

In December 1833, Benjamin B. French, a New Hampshire politician, traveled overland from his home in Newport to Washington, D.C., to take up his new post as assistant clerk of the United States House of Representatives. His wife was to follow him once he had rented a house and furnishings and settled into a work routine. Upon his arrival in the nation’s capital, he sent a package of banknotes home with instructions for his wife: “Use New Hampshire or Massachusetts money until you get to New Haven, and then begin upon your southern money” (Freeman Reference Freeman2018, p. 21). French had found it difficult to sell his New Hampshire banknotes in Philadelphia and wanted to save his wife the aggravation of exchanging distant for local banknotes in her travels. French’s experience is but one of many travelers’ accounts of the need to change monies as they moved across the early nineteenth-century United States (Dewey Reference Dewey1910; Shepard Reference Shepard1864). Moreover, French’s instructions to his wife highlight the inconvenience costs of the nineteenth-century United States decentralized, private money system: Bank-issued, small-denomination banknotes circulated as currency within a geographic range defined by trade flows, perceived bank quality, information reliability, and transportation costs.
French’s experience highlights issued raised in the modern study of payment systems. Banks provided the principal media by which their customers made payments and settled debts, but as his experience demonstrates, the system did not operate seamlessly as consumers moved across space.
Historians have questioned why the public tolerated a currency that depreciated as it moved away from its point of issue, involved the risk of nontrivial losses, and was sometimes hard to spend and even harder to redeem. The answer is that the public did not tolerate risky, depreciated currencies because bank-issued currencies did not move very far from their point of issue. Merchants and consumers were familiar with local banknotes, so that verification and redemption costs were low. The risks were modest. In 1842, the average discount in Philadelphia of a note issued by a bank 50 miles away was 0.67 percent; the median discount was zero (Bicknell Reference Bicknell1842). Among the Pennsylvania banks analyzed here, the average number of known counterfeits was 3.7; the median was one. The average number of counterfeit notes with a face value of $5 or less was 2.3, and the median was zero.
Davis (Reference Davis1910, p. 18) and Cagan (Reference Cagan and Carson1963, p. 20) repeated and accepted a Civil War-era opinion that the public suffered under the expense of a confusing mass of paper currency, “torn, greasy, issued by nobody knows whom, payable—if payable at all—in other scraps of printed paper.” Since Rockoff (Reference Rockoff1974), economic historians have moved past this facile interpretation, but it persists in various guises among historians (Mihm Reference Mihm2007; Tarnoff Reference Tarnoff2011). Well-used, widely accepted banknotes may have been torn and greasy by the end of their useful lives, but locals knew who issued them, where they were payable, and accepted them without questioning their authenticity, which was why they became torn and greasy in the first place. This study is the first to document the extent of spatial separation between the issuers of banknotes and the agents who redeemed their notes.
Using detailed data on interbank balances and deposits of other banks’ notes reported by 18 Pennsylvania banks in the 1840s and the banknotes discounted by a Connecticut banknote brokerage in the 1850s, this study estimates the geographic distance over which banknotes moved prior to being deposited in another bank. Linking interbank balances, note redemptions, and clearings among Pennsylvania’s banks with major transportation links and information on known counterfeits and market-based banknote prices, I estimate a 50 percent probability that a bank reports holding another bank’s notes when the other bank is approximately 50 miles away. The probability declines quickly beyond 50 miles. Banknotes were more likely to be accepted in trade over a wider area when issuing banks maintained correspondent redemption accounts with other banks. Early American bankers were unlikely to encounter a note issued by a bank 200 miles away, even when the banks’ locations were linked by a canal. Spatial separation and the institutions designed to overcome the information, transactions, and transportation costs associated with separation played a vital role in the use and ready acceptance of privately issued currencies.
My analysis of the records of a small-town Connecticut banknote broker adds nuance to the analysis of Pennsylvania’s banks. This broker discounted notes issued by banks as close as five miles and as far as 450 miles away, though the majority were issued by banks no more than 65 miles away. The brokerage discounted only a few notes from banks within 15 miles of its office. Consumers did not need the services of a broker to redeem notes issued by nearby banks. Micro data obtained by hand linking the individuals who discounted banknotes to their entries in the 1850 federal population census reveals how and why some banknotes from the Finger Lakes district in western New York State found their way to Darien, Connecticut, on Long Island Sound. Some arrived in the pockets (or pocketbooks) of migrants traveling back to Connecticut to visit family or perhaps conduct business. Others moved with watermen who moved up and down the Hudson River, through New York Harbor, and thence into Long Island Sound. These findings are consistent with the movement of modern Federal Reserve notes, which circulate for extended periods across a small space, then jump long distances consistent with modern air travel routes, then circulate for periods across another small space, and so on (Brockmann, David, and Gallardo 2009). The analogy to early America is not exact, but substitute canals for air travel, and the patterns are remarkably similar. Banknotes tend to stay close to home, but some notes make an occasional long leap across space and show up far from their point of issue.
ANTEBELLUM MONETARY ARRANGEMENTS
Complaints about the chronic shortage and low quality of coins formed a constant refrain throughout the colonial period into the early republic (Redish Reference Redish1984; Grubb Reference Grubb2016). The inadequate quantity and low quality of hard currency in circulation in early nineteenth-century America encouraged state legislatures to charter commercial banks, each of which issued its own form of circulating currency, and most states’ chartering policies grew increasingly liberal over time (Rockoff Reference Rockoff1974; Sylla Reference Sylla1985). By 1860, there were 1,345 banks (Weber Reference Weber2006). Because each of these 1,300 banks issued banknotes in several denominations, there were between 8,000 and 10,000 distinct notes in circulation in 1860 (Cagan Reference Cagan and Carson1963; Greenberg Reference Greenberg2020). Contemporary observers and historians alike depict the antebellum currency as a confusing mix of low-quality foreign and domestic coins, low-quality banknotes, and counterfeits that imposed substantial and potentially growth-inhibiting inspection and verification costs on routine daily transactions (Cagan Reference Cagan and Carson1963; Mihm Reference Mihm2007). Merchants and the public alike viewed unfamiliar banknotes offered in impersonal transactions skeptically and rarely accepted them uncritically (Dillistin Reference Dillistin1949; Greenberg Reference Greenberg2020). Despite the potential costs of using banknotes, people relied on them in daily exchanges (Fearon Reference Fearon1819, p. 232; Gouge Reference Gouge1833, p. 57).
Banknote Clearing and Redemption Arrangements
Two systems, broadly defined, emerged that monitored banknote quality and provided note holders with information about the liquidity and solvency risks of holding banknotes: bank-based systems and market-based systems. The most notable of the bank-based systems was Boston’s Suffolk System, which established a region-wide clearing system (Whitney Reference Whitney1878; Fenstermaker and Filer 1986; Smith and Weber Reference Smith and Weber1999). In 1842, New York mandated that all banks outside Albany and New York City contract with a bank in either of these cities to serve as their redemption agents (Myers Reference Myers1931).
Banks in other places created their own interbank redemption networks to extend the geographic extent of their circulation and enhance the monetary services provided by their notes. Using information on interbank accounts at Pennsylvania’s banks in the 1850s, Weber (Reference Weber2003) shows that interbank accounts map to the transportation networks of canals and railroads. The correspondence between transportation routes and interbank balances points to banknotes following trade flows between countries and cities.
Market-based redemption systems centered on urban traders who made secondary markets in distant banknotes. As the name implies, note brokers were traders who stood ready to purchase, for specie, notes issued by distant banks at discounts from face value. Note brokerage was competitive; larger cities often had as many as two dozen brokers operating at a given time (Adams, Sampson & Co. 1860). In creating competitive liquid markets for banknotes, note brokers enhanced the medium-of-exchange function of private currencies.
Three models of the antebellum payment system have been offered to explain the observed distribution of banknote discounts. Bullard and Smith (Reference Bullard and Smith2003) emphasize spatial separation and imperfect communication between issuers and users of notes. Discounts depend on regional differences in price levels, discount factors, and money supplies. Gorton (Reference Gorton1999) focuses on the connection between issuing banks’ risk-taking and redemption and information costs, though the principal costs of redemption are travel times (or physical distance) between issuers and users. Two implications of Gorton’s model are that banknotes follow trade and that there is a maximum distance from home that a consumer will travel to purchase consumption goods, determined by the rate at which local banknotes depreciate in distance from point of issue. Ales et al. (Reference Ales, Carapella, Maziero and Weber2008) generate several potential equilibria, but a principal determinant of the distance banknotes circulate beyond their point of issue is the difficulty a noteholder faces in interacting with a bank. Trade emerges as a key predictor in Gorton (Reference Gorton1999) and Ales et al. (Reference Ales, Carapella, Maziero and Weber2008). A prediction common to all three approaches is that the spatial separation between issuers and users of banknotes influences the use of a given bank’s notes and their geographic extent. While the models provide theoretical foundations for the econometrics, namely the importance of distance and trade patterns, this paper does not study the determinants of discounts. Rather, it uses discounts as an explanatory variable instead of a random variable to be explained.
DATA
The hand-coded data assembled here sheds light on the distances over which banknotes circulated before they were deposited in another bank and whether trade patterns influenced the volume of notes that moved across space. Evidence is assembled from three sources: reports of 17 Pennsylvania banks in March 1842; the annual reports of the Columbia Bank & Bridge Company of Columbia, Pennsylvania, in 1849 and 1850; and a business journal of a retail grocer and banknote broker in Darien, Connecticut, from the 1850s. Each source offers unique insights into the geographic space over which notes circulated in the Mid-Atlantic region in the mid-nineteenth century.
Pennsylvania, March 1842
In response to a short-lived Philadelphia bank run, Pennsylvania’s legislators asked the Auditor General, whose office oversaw the state’s banks, to request statements of condition from the banks as of 2 March 1842, which was two weeks prior to the run (Jalil 2015). In addition to the standard balance sheet entries, banks were instructed to include details of all banknotes from other banks held, as well as all interbank (correspondent) balances. Of Pennsylvania’s 48 banks, 37 responded, but only 17 provided bank-level details of their holdings of other banks’ notes and interbank balances. The other 20 respondents reported aggregate values of notes by state of origin rather than individual issuers. These 20 reports do not provide the level of detail necessary to calculate the distance traveled or the paths they may have followed between a note’s issuer and acceptor, so I rely on the reports of the 17 banks that provided detailed reports.Footnote 1
The objective here is to determine the distance between issuing banks and the banks holding their notes, and to calculate the likelihood that a given bank held the notes of other banks a given distance away. To do so, the data were assembled under the assumption that each reporting bank may have received notes from any other bank operating in the mid-Atlantic region. An initial survey of the reports revealed that Pennsylvania’s bank held notes issued in 15 other states. The initial survey also revealed that the banks held relatively few notes from other than the six states contiguous to Pennsylvania. Of the $44,716 in notes of other banks held by the Bank of Pittsburgh, for example, $537 were notes of the State Bank of Indiana, $28 were from Michigan banks, and it held a single $5 note from Boston (Pennsylvania Auditor General 1843). An unexpected result was that only two of five Philadelphia banks reported holding notes issued by New York City banks; the combined total was less than $500. Of the $233,587 in other banks’ notes held by Philadelphia’s Bank of Pennsylvania, the only western note was a single $10 note issued by the Bank of Tennessee. Based on the zero to small holdings of distant banks’ notes, a preliminary examination points to a limited geographic reach of most banknotes.
The empirical analysis matches each reporting bank with all other banks in the seven-state area—Pennsylvania, New York, New Jersey, Ohio, Delaware, Maryland, and Virginia—and distances in miles between each reporting bank and each issuing bank are geodetic distances based on GPS coordinates. Haupert (Reference Haupert1994), Gorton (Reference Gorton1996), and Jaremski (Reference Jaremski2011) use measures of travel times or travel costs, but Gorton (Reference Gorton1989) reports correlation coefficients of 0.90 between travel times and straight-line distance, so distance is used here.
The principal data used here are the value of banknotes held by each reporting bank issued by every other bank in the seven-state region. If no notes were reported, a zero is recorded in the data. Further, the matched bank sample includes each issuing bank’s balance sheet information from the reporting date closest to March 1842 (Weber 2019). The balance sheet information is used to construct liquidity and leverage measures for each note-issuing bank to determine if these factors are related to the likelihood that one of the 17 reporting banks in Pennsylvania holds one or more of its notes.
In addition to note holdings, other valuable data in the detailed 1842 bank report include BALANCES DUE TO and BALANCES DUE FROM other banks. Banks maintained interbank deposits for several reasons, including note clearing. Country banks held balances in city banks, which stood ready to redeem the country banks’ notes. Because a city correspondent bank redeemed their country respondents’ notes at par, the respondents’ notes circulated over a wider geography and provided the respondents’ customers with valuable liquidity services (Appleton Reference Appleton1841; Weber Reference Weber2003). After a country respondent’s notes were redeemed by the city correspondent, either on deposit or for redemption into specie, the city bank bundled them and sent them back to the issuing bank with instructions to replenish the correspondent balances.
In interpreting the results, it is important to keep in mind that urban banks that received notes issued by small, distant banks with which they maintained no interbank relationship and that lay outside the typical trading area of their customers may not have held them. City banks probably sent such notes to brokers or to country correspondents who did interact with the distant bank. We may then observe fewer country notes at city banks than they accepted on deposit. Country banks, on the other hand, may have held more city notes than notes of other country banks with the expectation that country bank customers would demand city notes for travel and city transactions. There may, therefore, be an urban-rural asymmetry in banknote redemptions and holdings.
Information on the dollar value of DUE TO and DUE FROM accounts provides insights into existing or anticipated trade flows between places (Weber Reference Weber2003). Country merchants traveled to cities to restock their goods for retail customers and often paid wholesalers with inland bills drawn on their local country bank. Urban merchants, especially wholesalers dealing in primary products, traveled to market towns in the periphery to buy goods for export to the metropolis. It was this trade in primary products that provided country banks with locally drawn bills of exchange payable in urban commercial centers. Rather than pay for produce with cash, commission merchants paid for raw materials and farm produce with bills of exchange, which local dealers then discounted at a local bank. Country and city banks credited the appropriate correspondent accounts. They transferred funds and settled accounts according to the terms of the correspondent agreements. Trade and, thus, credit instruments—banknotes, bills of exchange, and bank drafts—flowed in both directions. Interbank balances at a point in time provide a snapshot of the connections between banks and the magnitude of yet-to-be-settled accounts.
I also include as a control information on total CIRCULATION taken from the balance sheets collected, digitized, and made available by Weber (2019). Additional controls include the bank’s AGE, banknote DISCOUNTS (Bicknell Reference Bicknell1842), and the total number of COUNTERFEITS (Van Court Reference Van Court1842). Unlike most other studies of early American banknote markets, discounts and counterfeits are not the feature to be explained, but rather variables designed to explain the geographical range over which notes travel. Notes with discounts above the regional average or mode, and notes with known counterfeits, may have been less readily accepted by consumers and bankers in areas beyond which legitimate notes were familiar and readily distinguishable from counterfeits. Thus, the data captures several factors that are likely to have influenced the geographic range over which banknotes traveled.
Columbia Bank & Bridge, Columbia, Pennsylvania, 1849–1850
Although the Columbia Bank & Bridge failed to report its holding of other banks’ notes, balances DUE TO, and DUE FROM in March 1842, it included a detailed accounting of all three in reports it submitted to the Pennsylvania Auditor General (1850, 1851) with its 1849 and 1850 year-end reports. The Columbia Bank data take the same form as those in 1842. Preliminary analysis points to results similar to those of the 1842 sample, so the Columbia Bank & Bridge data are combined with the 1842 data for analysis. The sources do not provide any insights into why the bank included this information when no other bank did.
The Columbia Bank & Bridge data are assembled in the same way as the data for the 17 banks reporting in 1842. The banknotes issued in Pennsylvania and six contiguous states and held at the Columbia are matched to balance sheets nearest the date of the bank’s 1849 and 1850 reports (Weber 2019). Distances between Columbia, Pennsylvania, and issuing banks are geodetic distances based on GPS coordinates of the cities and towns in which the issuing banks are located. Detailed interbank balances will help identify likely trade patterns. Discounts and counterfeits are taken from Bicknell (Reference Bicknell1849) and Van Court (Reference Van Court1849).
Gorham & Garland’s Grocery in Darien, Connecticut
In 1850, Samuel B. Gorham, with a partner named Garland, opened a grocery in Darien, Connecticut (Huntington Reference Huntington1868). It is unclear whether it was a retail or wholesale business, but it appears to have commenced as a modest retailer. A handwritten ledger in the Gorham Family Records (1824) held at Harvard’s Baker Library contains a detailed record of banknotes accepted by Gorham & Garland over an unspecified period. Each entry includes the name of the customer tendering the note(s), the name of the issuing bank, the denomination of the note, and the serial number of the note. There is no indication in the source that Gorham & Garland discounted the notes, though Hasse (Reference Hasse1957) believes that the grocers were also banknote brokers.
The undated ledger appears to date to the early 1850s, which corresponds to the grocery’s opening. In matching entries to Weber’s (Reference Weber2006) bank census, the earliest chartered bank whose notes appear is the Bank of New York, which was established in 1784. The latest chartered bank whose notes appear is the City Bank of Cape May, New Jersey, which was organized in 1851. Three other banks listed in the ledger were established in 1850. Although Huntington’s (Reference Huntington1868) business list does not include the first names of business partners, it is likely that the Gorham identified by Huntington is Samuel Gorham. Samuel Gorham’s name appears on the second page of the ledger in reference to the sale of shingles. Samuel Gorham also appears in the manuscripts of the 1870 census of Darien; he is a 51-year-old married grocer.
Darien is located on Long Island Sound between Stamford and Norwalk, Connecticut, approximately 60 miles northeast of New York City and 35 miles southeast of New Haven. Given its location, Gorham’s business was likely to have encountered banknotes carried by overland travelers between New York City and Boston. Travelers, sailors, and primary product merchants engaged in the coasting trade in Long Island Sound who landed at or near Darien may have purchased goods from Gorham & Garland using whatever banknotes were in their pockets at the time. Nearly 35 percent of 494 banknotes recorded in the ledger were $1 notes; 17 percent were $2 notes; $3 and $5 notes accounted for another 40 percent. The average transaction was $6.54 (std dev = 6.50), and the majority of transactions were less than $10. The grocer’s ledger logged just two $50 notes issued by two New York City banks. It seems reasonable, then, that Gorham & Garland’s experience provides some valuable information on the banknotes encountered by a retail grocer/broker in a small to medium-sized market town circa 1850 and the distance those banknotes traveled before they ended up in the grocer’s till.
The data in the Pennsylvania Auditor General’s reports provide insights into the interplay between banks and redemption services. The Gorham & Garland data provides insights into the mix of local and distant banknotes used in everyday retail transactions that found their way to a small-town note broker. Each data source has its own limitations, but together they tell a hitherto unappreciated story about the geography over which early banknotes traveled.
EMPIRICAL APPROACH
Before introducing the formal econometric methods used to analyze distances between where banknotes originated and where they are observed, this section offers a narrative approach to thinking about banknote markets that motivates the formal analysis that follows.
A Narrative Approach to Banknote Dispersal
Gorton’s (Reference Gorton1996) and Jaremski’s (Reference Jaremski2011) empirical studies of banknote prices use detailed reconstructions of travel times between the location of each issuing bank and the city in which a price of the issuing banks’ notes was quoted. Neither study contains any information on the quantities of notes traded in these secondary markets or how they were dispersed across space. The three mechanisms posited here to explain the dispersal of nineteenth-century banknotes are trade flows, the costs of returning banknotes to their point of origin, and diminishing quality of information about bank quality as notes move away from the point of origin. I cannot measure information quality, but note that several empirical studies of banking in the twenty-first century find that the strength of bank-customer relationships declines in distance (Brevoort and Hannan Reference Brevoort and Hannan2006), that proximity facilitates banks’ ability to collect “soft information” about its customers (Agarwal and Hauswald Reference Agarwal and Hauswald2010), and that informational frictions increase and the quality of monitoring declines in the distance between a bank and the nearest regulatory field office (Lim, Hagendorff, and Armitage Reference Lim, Hagendorff and Armitage2016). Given the communication technology of the time, the combination of distance and location on a canal or other major waterway provides proxy measures of information quality. At a given distance between a point of banknote origin and redemption, information should be of higher quality, or at least timelier, along principal transportation and communication routes than away from them. In a pre-telegraphic world, news about banks traveled at the speed at which people, the post, or the newspaper moved.
Weber’s (Reference Weber2003) mapping of interbank accounts to canals and railroad lines in the 1850s points to the importance of trade flows in the dispersal of banknotes from their points of origin. I follow Weber (Reference Weber2003) in using canals and interbank balances as proxy measures of trade and information flows. It is not possible, given the data at hand, to decompose the aggregate effects into their separate parts.
To motivate the formal empirical analysis, Figure 1 provides a map that plots the aggregate DUE TO accounts held by five Philadelphia city banks and owed to their rural respondents, aggregated by county of origin. The largest aggregate DUE TO balances held by Philadelphia’s banks were, unsurprisingly, owed to other Philadelphia banks and, secondarily, to banks in Dover, Delaware. Philadelphia’s banks collectively owed relatively large amounts to banks in neighboring Chester and Delaware Counties in Pennsylvania, Wilmington (New Kent County), Delaware, and nearby Baltimore, Maryland. The heat map mirrors Weber’s (Reference Weber2003) map in his study of interbank balances in the 1850s. DUE TO balances are greatest in neighboring counties, counties on the Delaware River and Delaware Canal, namely Bucks and Northampton Counties in Pennsylvania, and Trenton, New Jersey. Otherwise, the heat map largely traces the Susquehanna Canal (e.g., Lancaster and York Counties) and the Main Line Canal (e.g., Pittsburgh).
TOTAL BALANCES DUE TO OTHER BANKS AND BANKNOTES HELD AT FIVE PHILADELPHIA BANKS
Notes: Map shows the value of interbank balances and banknotes redeemed by the 17 banks reporting to the Pennsylvania Auditor General (1843). Shading is proportional to interbank balances; circles are proportional to dollar value of banknotes redeemed.
Source: Author’s calculations from data reported in Pennsylvania Auditor General (1843).

The map overlays the origin counties of aggregate value of BANKNOTES held in the five reporting Philadelphia banks. Circles are centered on the county of origin, and the circles’ diameters are proportional to the aggregate value by county of banknotes held by Philadelphia’s banks. The pattern of values of banknotes redeemed in Philadelphia corresponds to the pattern of DUE TO balances evident in the heat map. Philadelphia’s banks hold more of each other’s banknotes than notes from other places, which is consistent with the ready acceptance and near-perfect substitutability of familiar, local banknotes. Relatively large values of banknotes originate in counties contiguous to Philadelphia or places along the Delaware River, the Susquehanna Canal, or the Main Line Canal. The visual evidence relating to Philadelphia’s banks is consistent with the hypothesis that mid-nineteenth-century banknotes circulated across limited spaces and moved along existing transportation and trade routes. The next section provides formal econometric analyses of the hypothesis.
An Econometric Approach to Banknote Dispersal
The data brought to bear on the question of interest here—the number of or the discrete dollar value of notes observed at a distance from their point of origin—are, by nature, count data. That is, the values considered here are non-negative integers (i.e., 0, 1, 2, 3, 4…), which are the dollar value of notes issued by Bank A and held by Bank B. The standard approach to modeling count data is to use Poisson or negative binomial regression (Cameron and Trivedi 2013).Footnote 2
If the data are over-dispersed, negative binomial regression is preferred. Negative binomial regression models may be appropriate as well, when the data contain an excessive number of zeros. The problem of excess zeros can be thought of as the consequence of a data-generating process that involves a combination of a count random variable and a binary random variable with a probability mass at zero. Zeros may be incidental, or they may be strategic. In the current context, excess zeros are incidental if they are the natural outcome of antebellum American banknote circulation patterns, in that notes of distant banks could have been presented at a distant bank, but banknotes tended not to travel far from home. The excess zeros are strategic if banknotes of distant banks were (or may have been) presented at a distant bank that refused to accept them. That is, it may be that some of the observed zeros are the result of banks simply not encountering notes of certain other banks (incidental), while other zeros are the result of banks refusing to accept the notes of specific other banks (strategic).
I estimate zero-inflated Poisson (alternatively, negative binomial) models of the following forms. Zero-inflated models are designed to account for excess zeros and over-dispersion.


The λ term represents the mean number of counts during a period of exposure t. In this case, the exposure period is assumed not to vary and is normalized to one. The first-stage zero-inflated model (Equation (2)) follows a Bernoulli zero-generation process where the observed outcome equals zero with probability φ. With probability (1 – φ), the data-generating process will produce a non-negative integer outcome. Outcomes observed in the data include zeros generated through both processes, with positive integers generated by the Poisson process.
The Poisson mean, λ, in Equation (1) is modelled as an exponential function of covariates X such that 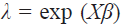 , where β is a vector of coefficients. The Bernoulli mean is a function of covariates Z assuming a logistic (logit) function such that
 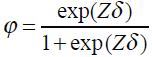 , where δ is a vector of coefficients of the zero-inflation process. If the non-negative data-generating process is defined by the negative binomial distribution, the term in the brackets in Equation (1) is replaced by the negative binomial function. The covariate vector X includes distance between banks in miles, interbank accounts, counterfeits, discounts, bank age, and bank fixed effects. The vector Z includes X plus location on a waterway.
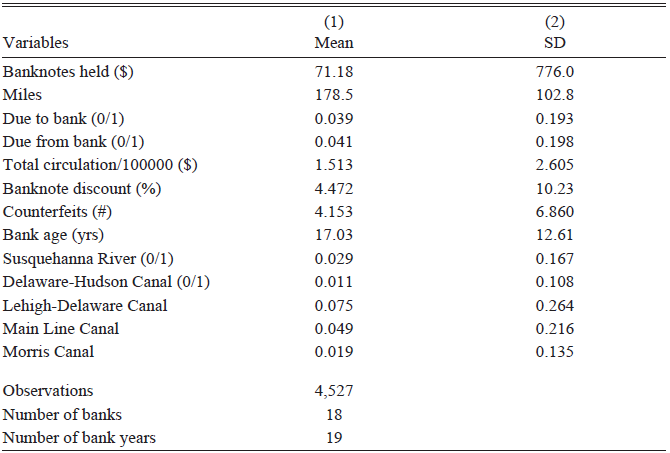
Table 1 reports summary statistics for the covariates used in the 18-bank sample (Bodenhorn (2026) provides data and replication files). The dependent variable in the count-data model is the dollar value of notes held by one of the 18 banks. Banks held an average of $71.18 in notes issued by other banks in Pennsylvania and the six contiguous states shown in Figure 1. Covariates used in four alternative count-data models include a quadratic in miles between issuing banks and the banks holding their notes. The average geodetic distance between every potential issuing and receiving banks is 178.5 miles; the median is 180 miles. The average distance between issuing and receiving banks, when receiving banks reported a positive value of notes held, is 87.5 miles (std dev = 75.6), and the median is 64 miles.
SUMMARY STATISTICS

Notes: 17 banks reported in 1842; the Columbia Bank & Bridge Company reported in 1849 and 1850.
Sources: Pennsylvania Auditor General (1843, 1850, 1851), Bicknell (Reference Bicknell1842, Reference Bicknell1849), Van Court (Reference Van Court1842, Reference Van Court1849), and Weber (2019).
The main specifications reported in the text use two dummy variables to identify interbank networks. The DUE TO BANK dummy equals one if the receiving bank reports owing any non-zero amount to an issuing bank and zero otherwise. Alternative specifications using the dollar amounts are reported in Online Appendix 3. The results do not differ in a meaningful way. The DUE FROM BANK dummy equals one if the receiving bank reports that it is owed any non-zero amount from an issuing bank and zero otherwise. DUE TO and DUE FROM accounts identify interbank relationships; if the receiving bank reports a positive DUE TO amount, the issuing bank holds a positive balance, whereas positive DUE FROM values identify when receiving banks hold a positive balance at an issuing bank.
The count-data regressions include the total CIRCULATION of the issuing banks to account for differences in the likelihood that a reporting bank holds other banks’ notes (Weber 2019). The greater a bank’s circulation (holding constant the denominational mix), the more opportunities there are to encounter its notes. The count-data regressions also include the number of COUNTERFEITS, the Philadelphia DISCOUNT, and the issuing bank’s AGE. Finally, the count-date regressions include reporting bank dummy variables, so that the estimated coefficients are interpreted as the within-bank effects of MILES, DUE TO, DUE FROM, and issuing banks’ CIRCULATION on the value of other banks’ notes held. The unit of observation is the issuing bank, so the standard errors are clustered on 385 issuing banks.Footnote 3
The logit regressions, which account for the excess zeros, include as regressors all the covariates included in the count-data regressions, in addition to whether the issuing bank is in a town proximate to the Susquehanna River or one of Pennsylvania’s canals. The choice to include the COUNTERFEIT, DISCOUNT, and AGE variables in the logistic (inflate) regression is driven by the strategic and incidental features that determine whether one bank holds the note of another bank. More counterfeits, higher discounts, and a lack of a reputation may have reduced the willingness of a bank to accept a distant issuing bank’s notes. And because trade moved along the state’s major rivers and canals, the likelihood of a bank holding a distant bank’s notes is greater if the distant bank is proximate to a waterway. Banks may have refused notes of distant banks not on a waterway due to the increased cost of redemption over land compared to water.
EMPIRICAL EVIDENCE ON THE EXTENT OF THE MARKET FOR BANKNOTES
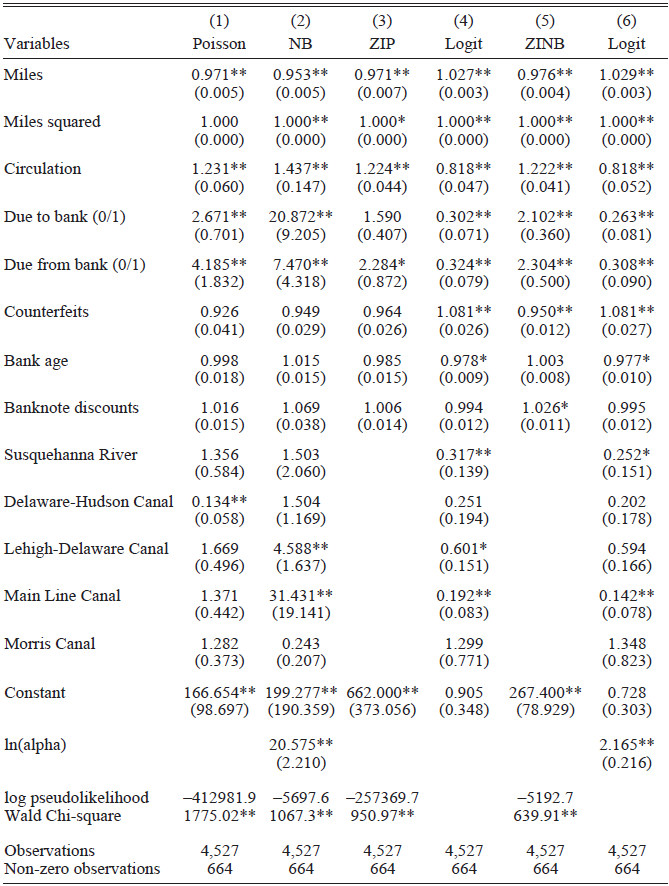
Table 2 reports the results of two count-data regressions (Poisson and negative binomial) and two zero-inflated count-data regressions. Columns (1), (2), (3), and (5) report incidence rate ratios, which are interpreted as the expected count for a value of x + 1 of an independent variable divided by the expected count for a value x of the independent variable. The reported incidence rate of 0.971 on the Miles variable in Column (1), for example, implies that an additional mile separating a note-issuing bank and a bank reporting holding an additional dollar of the issuing bank’s notes decreases by a factor of 0.971. An equivalent statement is that an additional mile separating the two banks decreases the expected count (dollar) value by 2.9 percent [100*(0.971 – 1) = –2.9], holding all else constant. Because there is evidence of overdispersion in the dependent variable, Column (2) provides coefficients estimated using a negative binomial regression. A significant ln(alpha) statistic in Column (2) indicates that the negative binomial model is more appropriate than the Poisson model.
DETERMINANTS OF BANKNOTES HELD BY PENNSYLVANIA BANKS

Notes: ZIP are zero-inflated Poisson estimates; ZINB are zero-inflated negative binomial estimates. Values reported in Columns (1), (2), (3), and (5) are incidence rate ratios from Poisson and negative binomial estimates. Logit coefficients reported in Columns (4) and (6). Standard errors are clustered on issuing bank. ** p<0.01, * p<0.05.
Sources: Author’s calculations from data discussed in text.
The Poisson and negative binomial models reported in Columns (1) and (2) include the full set of covariates and are offered as baseline comparisons for the zero-inflated models. The preferred specifications of the two-equation zero-inflated negative binomial regressions appear in Columns (5) and (6) of Table 2. Because nearly 80 percent of the observations are zeros, it is important to account for them explicitly, and because the dependent variable is over-dispersed, the negative binomial is preferred to a Poisson specification. Columns (3) and (4) report the zero-inflated Poisson coefficients for completeness and comparison purposes.
If we start with Column (6), which is the logit regression to account for the excess zeros, the estimated coefficients are consistent with our priors. Greater distances between issuing and reporting banks increase the likelihood of a reporting bank holding zero dollars of another bank’s notes. Zeros are less likely the larger the issuing banks’ circulation, and substantially less likely if the two banks have a correspondent relationship. The likelihood of observing zeros declines with bank age, which is consistent with Gorton’s (Reference Gorton1996) reputation hypothesis. Older banks have a track record of meeting their obligations. However, bank age has no meaningful effect on the value of notes observed. A bank’s age may, therefore, influence whether a bank’s notes travel, but not the dollar value of notes that travel.
Covariates included to capture strategic zeros are the counterfeit, bank age, and the discount on the issuing bank’s notes in Philadelphia. The likelihood of reporting zero dollars increases with the number of known counterfeits, the acceptance of which exposes the redeeming bank to potential losses. The discount on an issuing bank’s notes in Philadelphia has no significant or meaningful effect on the likelihood of reporting a zero. It may be that discounts may capture banknote prices in Philadelphia, but not elsewhere, given the asymmetry of discounts. Yet in regressions restricted to Philadelphia banks, the estimated incidence rate ratio on the DISCOUNT variable is not different from one and is insignificant (Online Appendix Table 3A, Column (5)). It seems more likely that banknote discounts do not contain sufficient variation to identify an effect.
Waterway covariates are included to account for incidental and strategic zeros. Although the canal and river controls are, apart from the Susquehanna River and Main Line Canal, statistically insignificant, they are jointly significant (χ2 = 51.2, p < 0.001). The estimated coefficients on Delaware-Hudson (p < 0.07) and Lehigh-Delaware (p < 0.06) canals are marginally significant and of the expected signs. Taken together, the waterway coefficients offer support for the hypothesis that some zeros are incidental, in that zero is a natural outcome in that the reporting banks simply did not encounter the notes of banks not on a waterway, and some were strategic in that notes from these banks were offered but rejected.
Column (5) reports the coefficients of interest from the zero-inflated negative binomial regression. The estimated constant means that a redeeming bank is expected to hold $267 in the reference issuing bank’s notes. Each additional MILE separating reporting and issuing banks reduces the dollar value of banknotes by 2.4 percent. Each additional $100,000 in issuing bank CIRCULATION increases the dollar value of notes held by 22.2 percent. Correspondent accounts, as predicted, have a pronounced effect on banknotes held. A positive value DUE TO another bank increases the dollar value of notes held by a factor of 2.10. A positive value DUE FROM another bank increases the dollar value of notes held by a factor of 2.30. These estimates are smaller than from the negative binomial (Column (2)), which points to the importance of accounting for the excess zeros. These results confirm the idea that banknotes moved across space with trade and travelers. Country banks, as discussed previously, held correspondent accounts with urban banks to make their notes more widely acceptable in trade and as a convenience to their customers.
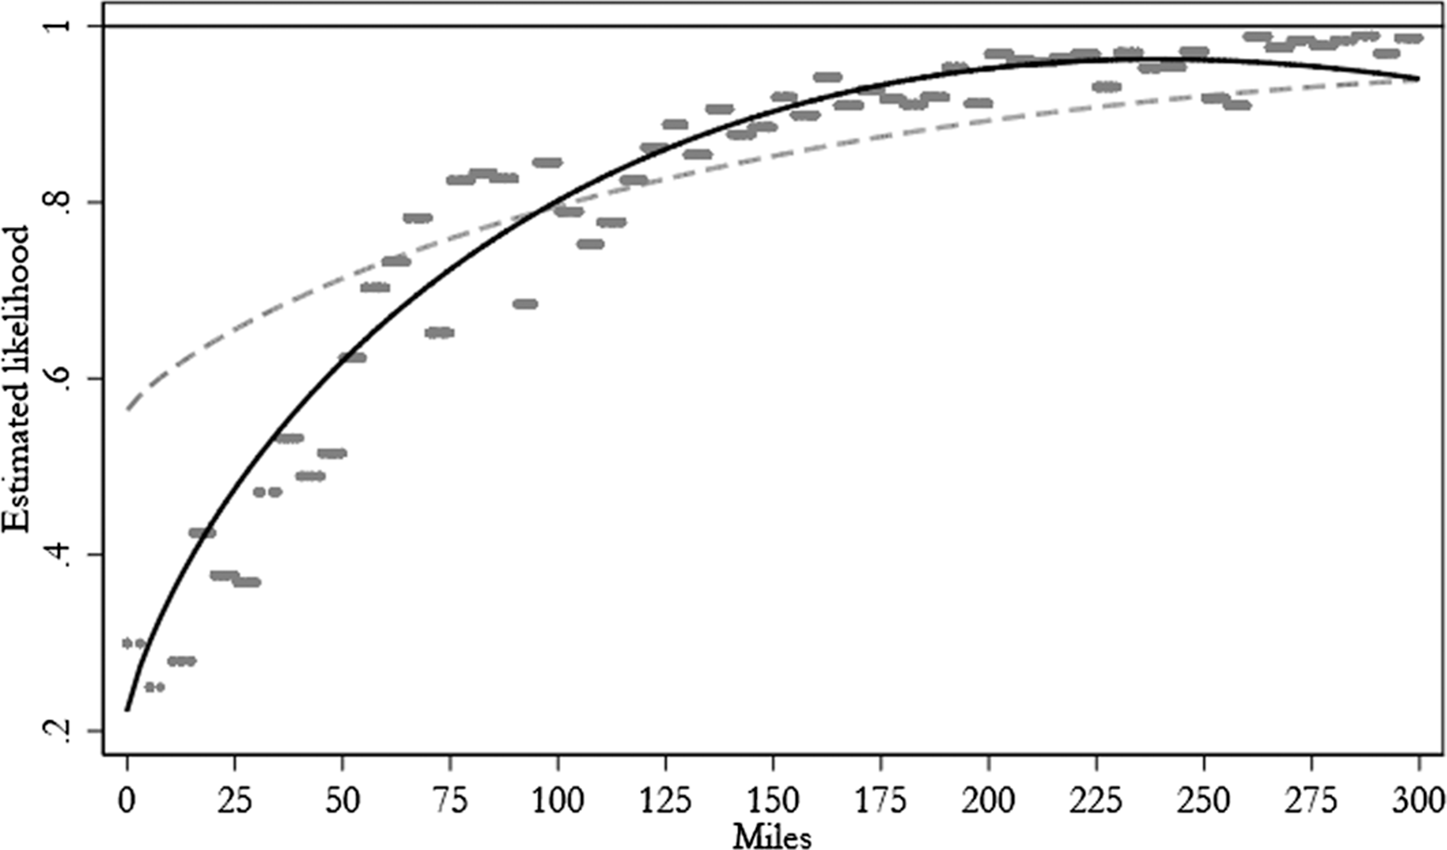
Using the estimated coefficients, it is straightforward to predict the expected probability that the reporting banks will hold zero dollars ($0) in banknotes of each note-issuing bank by miles separating reporting and issuing banks. The resulting predictions are plotted in Figure 2, which provides some insight into the critical distance beyond which a banknote is not held by one of the reporting banks. The scatterplot of predictions from the ZINB regressions (Column (5)) are average probabilities by five-mile bins; the central tendency of the ZINB predictions follows the solid line, while the central tendency of the negative binomial (Column (2)) follows the dashed line and is offered as a comparison.
PROBABILITY OF HOLDING ZERO DOLLARS OF NOTES OF BANK BY MILES
Negative Binomial and Zero-Inflated Negative Binomial Predictions
Notes: The figure plots probabilities of a receiving bank holding zero dollars in the notes of an issuing bank by miles between receiving and issuing banks. The scatterplot is predicted probabilities by five-mile bins. The solid line traces predicted probabilities derived from the zero-inflated negative binomial model (Table 2, Column (5)). The dashed line traces predicted probabilities from the negative binomial model (Table 2, Column (2)).
Source: Author’s calculations from data reported in Pennsylvania Auditor General (1843).

The scatterplot and solid curve reveal that if the distance separating an issuing bank and a reporting bank is zero miles, which occurs only in Philadelphia, the probability of a reporting bank holding zero dollars in the other bank’s notes is about 30 percent. (Alternatively, the probability of holding positive dollars is 70 percent.) An inspection of the scatterplot reveals that if the banks are separated by five to ten miles, the probability of holding zero dollars falls to 25 percent.
The result is consistent with contemporary accounts of interbank clearings in the period prior to the establishment of Philadelphia’s clearinghouse. According to Cannon (Reference Cannon1905), notes issued by Philadelphia’s banks circulated at face value in the greater Philadelphia area because they were easily presented at the issuing bank for specie. Nearly all the city’s banks accepted each other’s notes and then engaged in regular, often daily bilateral clearing. The probability of observing zero notes is not zero because some banks may not have cleared every day, even though the city’s largest banks were located within a few city blocks of each other, which made bilateral daily clearing relatively simple and inexpensive (McElroy Reference McElroy1839). The only banks separated by five to ten miles (in the sample) were the Bank of Germantown, which was in Philadelphia County, and the banks in the central financial district, which were separated by 5.5 miles. Clearings between the center-city banks and the Germantown bank likely occurred less than daily, which explains why the probability of zero dollars is lower for a bank separated by just a few miles than for those separated by a few city blocks.
Figure 2 highlights the central argument of this paper, namely that spatial separation influences payment practices. While it does not necessarily tell us how consumers and merchants interacted, in conjunction with results in Table 2, it provides information on how transportation and communication networks, along with interbank relationships, influenced the movement of banknotes. Briefly stated, Figure 2 shows that banknotes tended to circulate across a limited range, which is consistent with Gorton’s (Reference Gorton1996) and other payment system models. If 25 miles separate the reporting bank from the issuing bank, the probability of the reporting bank holding zero dollars is 40 percent. At 50 miles, it is about 60 percent. At 100 miles, it is 80 percent, and at 250 miles, it is effectively 100 percent. Alternatively, if two banks are separated by 250 miles, neither would anticipate being asked to accept the notes of the other on deposit. Philadelphia and Pittsburgh, for example, are separated by 257 (geodetic) miles. The average dollar value of banknotes issued in Pittsburgh and held by the five reporting Philadelphia banks is $84. It is reasonable to conclude that banks in these cities did not expect to encounter each other’s notes very often or do much business with each other; the average DUE TO Pittsburgh banks at Philadelphia’s bank was $81, and the average DUE FROM Pittsburgh banks at Philadelphia’s banks was $35. And these banks were nominally connected by the Main Line Canal.
My analysis of 1840s Pennsylvania bank data reveals how the clearing of one type of privately issued debt relied on and was facilitated by available transportation and communication systems. Trade between the periphery and the metropolis moved along canals and waterways, and debt instruments of various kinds—banknotes, bank drafts, inland bills of exchange, and so on—moved with the traded goods and people who moved them. Banks in the periphery developed correspondent relationships with banks in the center to redeem and return their notes, which gave those notes circulation. As the payments system literature posits, spatial separation is a fundamental factor underlying the structure of the payments system at a point in time, and systems arise to reduce the costs of transferring resources across space. This is one of the first studies to document the extent of the market—the extent of the spatial separation—for a vital early American debt instrument.
EVIDENCE ON BANKNOTE REDEMPTIONS FROM A CONNECTICUT GROCER
The Gorham & Garland records also allow me to reconstruct each transaction because the ledger records the name of the individual offering each note. Using the full name of the individual presenting each note, I searched the 1850 manuscript census on Ancestry.com™ to link the grocers’ customers with information about their city, county of residence, and occupations. Linked data reveal who presented notes and the (geodetic) distance the notes traveled before reaching the hands of the grocery’s customers and ultimately the grocery itself. Keep in mind, as well, that Hasse (Reference Hasse1957) contends that Gorham & Garland operated a banknote brokerage as a sideline to their grocery business. I cannot disentangle banknotes presented in purchasing goods from banknotes presented to be discounted. But it is reasonable to assume that the ledger records banknotes discounted rather than notes accepted in routine business. The ledger records just 11 entries involving notes of the Fairfield County Bank in Norwalk (5 miles from Darien), two notes of the Bridgeport Bank (14 miles), and zero notes issued by the Stamford Bank (9 miles). By comparison, the ledger documents 163 notes issued by banks in New York City (62 miles). If Gorham & Garland grocers had recorded the notes of every retail transaction, they would certainly have recorded more local notes. It appears that the ledger refers to Gorham & Garland as brokers.
Gorham’s ledger then provides several valuable pieces of evidence about the types of banknotes encountered by the brokerage’s customers, the notes’ denominations, and their points of origin. First, the denominations and the average transaction were small. Nearly 35 percent of 494 banknotes recorded in the ledger were $1 notes; 17 percent were $2 notes; $3 and $5 notes accounted for another 40 percent. The average transaction was $6.54 (std dev = 6.50), and most transactions involved less than $10. Second, the average distance between each note’s point of origin and Darien, Connecticut, is 107.1 miles; the median distance is 70.4 miles. (Online Appendix 5 provides a histogram of denominations, and another plots the number of notes by miles between the issuer and Darien.) Third, the ledger records 494 banknotes discounted, and 303 were linked to the 1850 census. Farmers presented 136 notes, merchants presented 32 notes, craftsmen presented 76 notes, and the remaining 59 were presented by individuals employed in other occupations, ranging in skill from architects to fishermen to laborers. That farmers presented more notes for discount than any other group speaks to their market orientation. They may have received distant notes in payment for their produce, perhaps from urban traders shipping farm products to urban markets.
To provide context for the geographic distribution of the banknotes’ points of issue and the residences of the brokerage’s customers, Figure 3 overlays the counties of issue of the banknotes, identified by the centers of the circles, the sizes of which are proportional to the aggregate value of notes accepted, and the number of customers by county of residence, identified by the heat map. Consider first the points of issue. New York City dominates, but the brokerage encountered substantial numbers of notes from banks in Connecticut, from banks located in counties on or near New York Harbor, and from counties bordering the Hudson River. It is not surprising that New York City notes circulated in Darien, Connecticut, given the proximity (62 miles) and the extensive trade between New York City and cities and towns on Long Island Sound.
TOTAL DOLLAR VALUE ACCEPTED AT GORHAM & GARLAND’S GROCERY IN DARIEN, CONNECTICUT
By County of Issue and County of Customers’ Residence
Notes: Map shows the distribution of customers who discounted banknotes at Gorham & Garland’s brokerage in Darien, Connecticut. Shading is proportional to residence of customers; circles are proportional to dollar value of banknotes discounted.
Source: Author’s calculation from data reported in Gorham Family Records (1824).

One interesting feature is the few notes issued by banks in Western New York. These Western notes, offered to and accepted by Gorham & Garland, were issued by banks in counties that bordered the Erie Canal, including Cayuga and Ontario Counties in New York’s Finger Lakes District. Micro evidence gathered by linking Gorham & Garland’s customers to the 1850 census shows how and why notes issued by banks near the Erie Canal and the Hudson River found their way to Darien, Connecticut. Several notes issued by banks near the Hudson River were presented by George and Harvey Weed, and by Isaac, John, Samuel, and William Waterbury. Both Weed and Waterbury were common surnames in and around Fairfield County, Connecticut. Some of these men were born in Connecticut and lived in Upstate New York; some were born in New York and lived in Fairfield County. It seems likely that these men carried banknotes issued by their local banks when they traveled to visit family around Darien. James and Nathaniel Clock, both identified as mariners in the census and living on Long Island, discounted notes issued by banks in such New York towns as Catskill, Hudson, Lansingburgh, Newburgh, Poughkeepsie, and Troy, all of which were on the Hudson River. Clock, too, was a common surname in and around Darien. They may have discounted notes as part of their business activities or when they visited family in the area.
The pattern of banknote dispersal evident in the Gorham & Garland data are, like the Pennsylvania data, consistent with the evidence presented in Brockmann, David, and Gallardo (2009). They find that modern Federal Reserve notes tend to circulate within a limited area for a time, then experience a long leap consistent with modern airline flight patterns, then circulate within a limited area, and so on. Banknotes reported in the Gorham & Garland may have followed a similar pattern. At least, the long leaps made by some banknotes exhibit a pattern consistent with nineteenth-century water travel and analogous to modern air travel.
The dispersal of banknotes is also consistent with the Pennsylvania data. Consider a circle centered on Darien defined by New York City and Hartford—approximately 60 to 65 miles—as the natural area of circulation for banknotes observed in Darien. More than half (55 percent) of the total value of notes accepted by Gorham & Garland were issued within that circle. Nearly half (47 percent) of the total number of notes were, as well. By comparison, there is a 49 percent probability of observing zero dollars of banknotes for banks separated by less than 65 miles in the Pennsylvania data. The Pennsylvania and Gorham results are not directly comparable because the Pennsylvania data include notes from all banks, including nearby banks, whereas the Gorham & Garland data do not include as many banknotes issued within 15 miles of Darien as we might expect to see. The underrepresentation of nearby banks in the Connecticut data likely follows from Gorham & Garland’s discounting business rather than their grocery business. Notes that circulated within 15 miles of their issuer were unlikely to have traded at (meaningful) discounts, were accepted at face value, and did not enter the sample.
DISCUSSION
It is reasonable to raise some concerns with the Pennsylvania bank data and the interpretation of the results. It may be that we do not observe more distant notes in the Pennsylvania bank records because information degrades with distance, perhaps rapidly, given the contemporary transportation and communications technologies, which may encourage banks and consumers to refuse unfamiliar notes. Unfamiliarity may also have encouraged banks and consumers to dispose of them quickly using the services of a banknote broker. If so, we might be misinterpreting some of the zeros as strategic or incidental zeros when the notes were, in fact, present but traded away before they could be observed. It is possible, as well, that the timing of the Pennsylvania reports may lead to misleading inferences. In 1842, the United States was emerging from the recession that followed the Panic of 1839, which was one of the longest and deepest of the nineteenth century (Moore and Zarnowitz Reference Moore, Zarnowitz and Robert1986). In the aftermath of a panic, the public would become wary of some banks and bank-issued currencies. Banks themselves sought to reduce counterparty risks by being more selective in the notes they were willing to accept on deposit. The incentive to divest of unfamiliar notes quickly might be more pronounced in a panic or crisis.
Two nineteenth-century sources speak to these issues. First, following the suspension of specie payments in 1837, the Indiana legislature appointed a special committee to investigate the State Bank of Indiana. In deposing the president and cashier of each of the bank’s eight branches, the committee inquired into which notes each branch was willing to accept at par, which of these notes were offered and accepted, and how they disposed of distant notes once accepted.
The banknotes they were willing to accept at par included those issued by banks in Ohio, Kentucky, Virginia, Pennsylvania, New York, Boston, and most southern banks in “good standing” (however defined). Some branches refused to accept notes issued by the troubled State Bank of Illinois, while other branches accepted them at a discount. Overall, the points of origin of banknotes these branches encountered were much closer than Philadelphia, New York, and Boston. The New Albany branch, for example, received deposits of notes issued by banks in Kentucky, Cincinnati, Pittsburgh, and Wheeling, all of which—like New Albany—are located on the Ohio River. The Richmond, Indiana, branch received deposits of notes issued in Kentucky, Ohio, and Virginia. The Richmond branch’s cashier noted in an aside that he once accepted $25 in South Carolina notes to accommodate a trusted customer. In Indianapolis, notes from banks other than those in Kentucky, Ohio, and Illinois circulated “but to a limited extent” (Indiana House 1837, p. 476).
By what means and how quickly did the branches of the State Bank redeem notes issued by distant banks? The Richmond branch remitted the South Carolina notes through the mails to a New York broker and the Virginia notes to a Baltimore broker. Some branches quickly forwarded distant notes to brokers, most often in Cincinnati. Others, like the Richmond branch, let balances of as much as $12,510 accumulate before sending them to Cincinnati (ibid, p. 459). Some branches engaged in direct redemptions after accumulating substantial balances, such as the New Albany branch, which negotiated a $12,740 gradual redemption agreement with the Union Bank of New Orleans (ibid, pp. 455). Other branches retained modest balances of regional banknotes to accommodate merchants and travelers bound for distant markets (ibid, pp. 477, 509).
Some additional evidence on the probability of observing whether a bank holds the notes of other banks. Due to growing frustration among New York’s country banks with the state’s 1840 redemption law, which required country banks to have a redemption agreement with a city bank, a legislative committee was appointed to investigate (New York Senate 1850). The committee estimated that an average banknote returned to its issuing bank after about 90 days. Redemption agents typically returned bundles of redeemed notes to issuing banks every 13 to 30 days, depending on the specific agreement between the banks. If Philadelphia banks had comparable relationships and agreements with Pennsylvania’s country banks, the amount and location of issuing banks’ notes held by Philadelphia’s banks in 1842 may be representative of their typical holdings.
CONCLUDING REMARKS
Generations of banking historians have been vexed by the question of how well bank-issued currencies served as the media of exchange. The modern consensus—among economic historians, at least—is that the benefits of those currencies outweighed the costs, excepting a few brief and isolated periods of wildcat banking (Rockoff Reference Rockoff1974; Rolnick and Weber Reference Rolnick and Weber1988; King Reference King1983; Gorton Reference Gorton1996). Several mechanisms arose to facilitate the circulation, clearing, and redemption of banknotes because they mitigated the spatial separation and information asymmetry problems inherent in private note issue. New England relied on centralized private coordination; New York mandated interbank redemption; Pennsylvania relied on correspondent relationships. In all regions, private banknote brokers supplemented formal systems.
The issue addressed here is the geography over which banknotes served as useful, readily accepted currencies. Nineteenth-century travelers recounted tales of frequent, sometimes costly exchange as they traveled across regional currency areas. Evidence from mid-nineteenth-century Pennsylvania and Connecticut is consistent with travelers’ accounts. Banknotes traded within a relatively compact space. Notes issued by banks 200 miles away sometimes found their way into the till of a bank, broker, or merchant, but rarely. The operative mechanisms that explain the direction and reach of traveling banknotes are trade flows and the principal transportation technology of the era. Notes did not disperse randomly across a featureless plain; they moved with traded goods and the traders and travelers who moved with them along roads, rivers, and canals.



 Open access

