


Critical to democracy and the peaceful transition of power is the acceptance of election results by losing candidates and their supporters (Anderson et al. Reference Anderson, Blais, Bowler, Donovan and Listhaug2005). This acceptance requires that voters have confidence that the election was conducted accurately, fairly, and legitimately (Norris Reference Norris2014). However, when voter confidence depends more on who wins than the integrity of electoral procedures, sustaining support for the political system becomes difficult—perhaps especially so when polarized, zero-sum outcomes are decided by narrow margins. Given the close connections between electoral confidence and opinions about democratic legitimacy overall (Carey et al. Reference Carey, Helmke, Nyhan, Sanders and Stokes2019), probing the nature of voter confidence surrounding the 2024 General Election is essential for understanding the current health of democracy in the United States (Layman, Lee, and Wolbrecht Reference Layman, Lee and Wolbrecht2024).
Prior research consistently has found a relationship between election outcomes and voters’ electoral confidence (Alvarez, Hall, and Llewellyn Reference Alvarez, Hall and Llewellyn2008; Anderson and LoTempio Reference Anderson and LoTempio2002; Craig et al. Reference Craig, Martinez, Gainous and Kane2006; Levy Reference Levy2021; Sances Reference Sances2023; Sances and Stewart III Reference Sances and Stewart2015; Sinclair, Smith, and Tucker Reference Sinclair, Smith and Tucker2018). Nevertheless, the persistent partisan divide in baseline electoral confidence following the 2020 election (Arceneaux and Truex Reference Arceneaux and Truex2023; Bowman and Goldstein Reference Bowman and Goldstein2021) combined with ongoing claims of fraud by Republican elites during the 2024 campaign (Ingram Reference Ingram2024; Wendling Reference Wendling2024) and widespread messaging from Democratic leaders affirming the legitimacy of the process (Benen Reference Benen2024) raises questions about how and why voter confidence changed during the 2024 election (Levendusky et al. Reference Levendusky, Patterson, Margolis, Ophir, Walter and Jamieson2024; Pew Research Center 2024).
This study examines three questions: (1) How did partisans’ confidence in the national vote count shift before and after Election Day 2024? (2) Among co-partisans, were confidence changes more significant among voters or among local political elites? (3) Among voters, whose confidence levels were impacted most by the outcome in ways that suggest that their confidence in elections is based more on who wins than the institutions, norms, and procedures being used? To answer these questions, I analyzed cross-sectional and panel surveys conducted before and after Election Day consisting of more than 54,000 registered voters and 1,400 local political elites (Clinton Reference Clinton2025). Examining how voter confidence varies across and within respondents over time provides important leverage when characterizing how election outcomes affect electoral confidence and for whom.
Several key findings emerge. First, daily cross-sectional surveys conducted immediately before and after Election Day revealed a sharp and immediate increase in Republican confidence following the networks’ projection of a Trump victory. Confidence in the accuracy of the national vote count more than doubled among Republican voters (123%) and local political elites (106%) despite months of messaging about the possibility of widespread fraud involving noncitizen voting and ballot harvesting (Goldin Reference Goldin2024). The timing and size of the abrupt increase in voter confidence highlights both the outcome-contingent nature of electoral confidence and the ability of a positive outcome to overcome prior skepticism.
Confidence in the accuracy of the national vote count more than doubled among Republican voters (123%) and local political elites (106%) despite months of messaging about the possibility of widespread fraud involving noncitizen voting and ballot harvesting.
Second, the direction and scale of election-related confidence changes varied greatly by party. Unlike the substantial increase in confidence among Republicans following Trump’s win, relatively few Democrats expressed a change in confidence. Contrary to the dramatic collapse in Republican confidence following the 2020 election (Arceneaux and Truex Reference Arceneaux and Truex2023)—and arguably reflecting the importance (Clayton et al. Reference Clayton, Davis, Nyhan, Porter, Ryan and Wood2021) and difference in elite messaging about electoral integrity between the Republicans in 2020 and the Democrats in 2024 (Benen Reference Benen2024)—Democratic confidence declined by 16% among voters and it was unchanged among local elites. Because of these contrasting partisan shifts in confidence, partisans expressed similar levels of electoral confidence following the election.
Third, two important features characterize the nature of within-party confidence changes. First, local election officials in both parties expressed consistently higher levels of confidence than co-partisan voters, policy makers, and school board members. Second, panel data revealed that affectively polarized partisans (Druckman and Levendusky Reference Druckman and Levendusky2019; Iyengar et al. Reference Iyengar, Lelkes, Levendusky, Malhotra and Westwood2019) were the most likely to change their confidence based on the election outcome. The most polarized Republicans were most likely to express confidence in the accuracy of the vote count after Election Day but not before, and the most polarized Democrats were most likely to express confidence before Election Day but not after. The fact that voter confidence changed the most among the most polarized partisans suggests the importance of motivated reasoning for voters’ confidence (Kunda Reference Kunda1990; Taber and Lodge Reference Taber and Lodge2006). Whereas an electoral victory legitimates and validates the desirability of a person’s partisan identity, it arguably is easier to resolve the dissonance of losing by questioning the legitimacy of the process rather than confronting the implications of having personally held beliefs rejected by others.
The most polarized Republicans were most likely to express confidence in the accuracy of the vote count after Election Day but not before, and the most polarized Democrats were most likely to express confidence before Election Day but not after.
Although partisan gaps in electoral confidence narrowed after the 2024 election (Bowman and Goldstein Reference Bowman and Goldstein2021; Stewart III Reference Charles2022), almost 40% of registered voters continued to express doubts about the accuracy of the national vote count. This level of doubt, combined with the fact that public confidence continues to be closely tied to electoral outcomes even within a long-established democracy such as the United States, underscores the fragility of democratic legitimacy and norms in polarized contexts (Graham and Svolik Reference Graham and Svolik2020). If perceptions of electoral legitimacy depend on who wins, even well-established democracies with competent electoral administration may struggle to sustain public confidence in elections. Highlighting the voices and perspectives of those closest to election administration may bolster public confidence given that they also are most confident (Gronke et al. Reference Gronke, Kimball, King and Udani2022; Manion et al. Reference Manion, Kimball, Gronke, Anthony and Udani2022). However, the differences in confidence changes between Democrats and Republicans in 2024 and 2020 suggest that sustaining and increasing voter confidence almost certainly also depends on the messaging of political elites (Anderson et al. Reference Anderson, Blais, Bowler, Donovan and Listhaug2005).
MEASURING CHANGES IN ELECTORAL CONFIDENCE
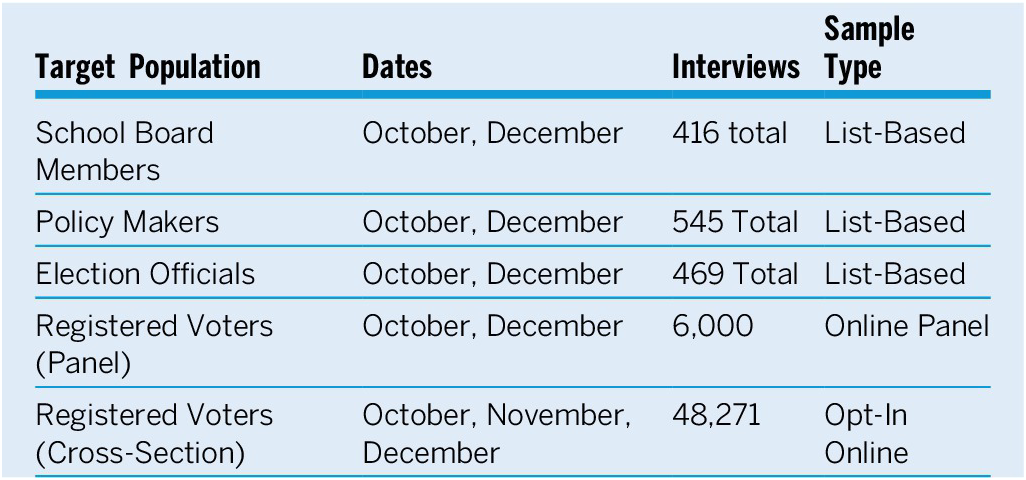
To assess levels and changes in electoral confidence surrounding the outcome of the 2024 presidential election, I conducted a series of surveys before, during, and after Election Day. These surveys, summarized in table 1, included three key components: (1) 1,400 local political elites and election officials surveyed in either October or December; (2) a panel of 6,000 registered voters interviewed in both October and December; and (3) more than 48,000 cross-sectional interviews with registered voters conducted almost every day from mid-October through mid-December (including approximately 2,000 interviews per day immediately before and after Election Day).Footnote 1 The high-frequency cross-sectional design enabled me to precisely estimate when or if confidence levels shifted (Arceneaux and Truex Reference Arceneaux and Truex2023); the cross-sectional elite survey allowed me to compare confidence changes between voters and local co-partisan elites; and the panel design provided within-respondent leverage that could identify which individuals changed their views (Sinclair, Smith, and Tucker Reference Sinclair, Smith and Tucker2018).
Surveys Conducted
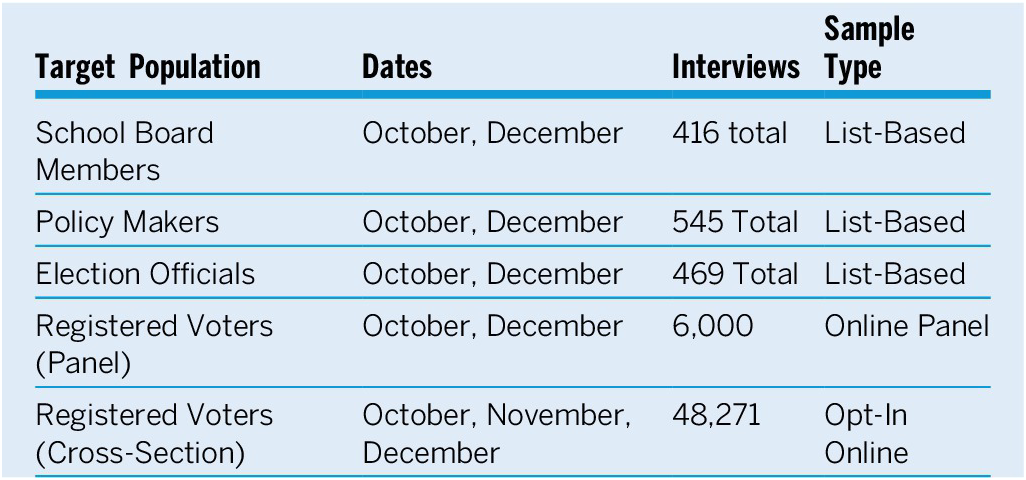
Note: See also online appendix figures S1–S5.
To measure respondents’ confidence in elections, I asked a version of the following question that has been used widely in the literature (Alvarez, Hall, and Llewellyn Reference Alvarez, Hall and Llewellyn2008; Arceneaux and Truex Reference Arceneaux and Truex2023; Sances and Stewart III Reference Sances and Stewart2015; Sinclair, Smith, and Tucker Reference Sinclair, Smith and Tucker2018): “Thinking about the United States as a whole, how likely do you think it is that the votes were counted accurately?”Footnote 2 Although the question asks specifically about the accuracy of the national vote count, it is possible to interpret the results more broadly because of how closely the responses to this item correlate with the responses to similar questions regarding the legitimacy of election outcomes (Holliday et al. Reference Holliday, Grimmer, Lelkes and Westwood2024).Footnote 3
The following analysis focuses on the level of confidence that respondents expressed about the accuracy of the national vote count; however, analyzing respondents’ confidence in the accuracy of their own-state vote counts yielded substantively similar patterns (see online appendix figures S7 and S8). The fact that confidence in national- and state-level vote counts changed in similar ways after Election Day matters because it provides additional evidence about the importance of election outcomes for overall voter confidence by revealing a similar change in confidence despite differences in the procedures being used across states. Voters were slightly more confident in the accuracy of own-state vote counts. However, the fact that state-confidence changes were similar to national-level confidence indicates that state-specific factors (e.g., local election procedures and even state-level outcomes) did not eliminate the effect of the national outcome on voter confidence.
PUBLIC CONFIDENCE IN THE NATIONAL VOTE COUNT
The first question of substantive interest is the extent to which voter confidence changed on Election Night following the projected victory of President Trump. If voters’ confidence depended on the procedures being used and/or their experiences with previous elections, little if any change in voter confidence should have been observed before and after Election Day. However, if voter confidence depended on the outcome of the election, confidence changes following the projected win of President Trump on Election Night (i.e., November 5, 2024) should have been observed.
One complication is that elite cues matter greatly for public opinion (Lenz Reference Lenz2012), and we know that elite messaging affects how voters interpret the fairness of an election and the legitimacy of the resulting outcome (Clayton et al. Reference Clayton, Davis, Nyhan, Porter, Ryan and Wood2021). Because it is impossible to isolate whether respondents are reacting to the election outcome or elite messaging about the election outcome, the confidence changes I characterize reflect the combined effect.
As in 2020, elite messaging about the legitimacy of the election varied dramatically by party in 2024. Similar to that used in 2020, Republican messaging prior to Election Day—and after (Fowler and Joffe-Block Reference Fowler and Joffe-Block2025)—often suggested the prevalence of voter fraud regardless of the outcome. Slogans such as “Too Big to Rig” and “Swamp the Vote” (Kincade Reference Kincade2024), for example, sought to mobilize voters with the expressed intention of overcoming a vote count that was presumed to be fraudulent. Messaging by Democrats, in contrast, emphasized the legitimacy and accuracy of the electoral process regardless of the outcome before, during, and after Election Day (Benen Reference Benen2024). The messages used in 2024 largely reinforced partisan messaging related to the legitimacy of election outcomes used in prior elections (Baker Reference Baker2022). Strong conclusions are impossible in the absence of observing and estimating the counterfactual; however, the difference in party messaging regarding the presence and absence of electoral fraud seems likely to minimize an outcome-related increase in Republican confidence and to lessen an outcome-related decline in Democratic confidence.
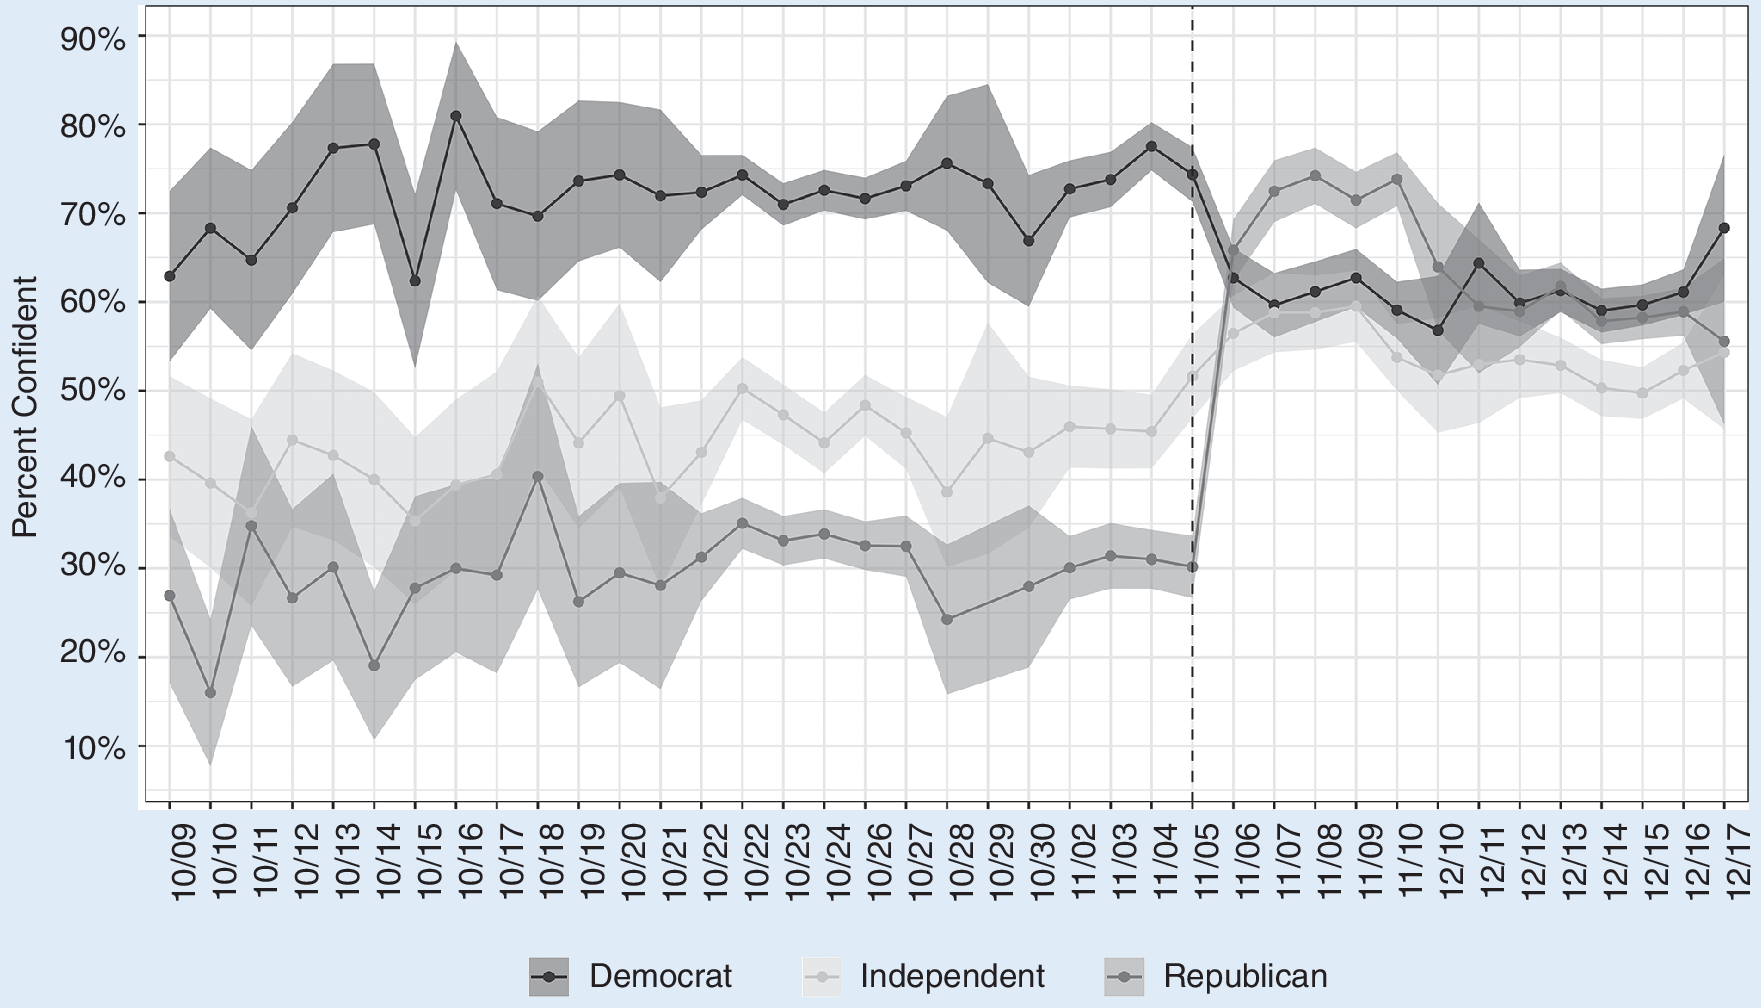
To identify whether the size and timing of opinion change was consistent with voter confidence being directly affected by the national outcome, the graphs in figure 1 illustrate the percentage of partisans who expressed confidence in the national vote count for every day on which more than 50 partisans were interviewed. Restricting the analysis to days with more than 100 partisan interviews and weighting daily averages to match the demographics of the 2020 electorate (Flood et al. Reference Flood, King, Rodgers, Ruggles, Robert Warren, Backman and Chen2024) slightly reduced the frequency of the time series and the amount of daily variation without changing the overall substantive conclusions (see online appendix figures S3–S5).
Daily Average Confidence in National Elections Among Self-Reported Voters by Partisanship
Note: Average confidence for days with 50+ respondents for each partisan group. See online appendix figures S3–S5 for demographic-weighted averages. See online appendix figure S6 for daily partisan differences and figure S7 for own-state confidence trend.
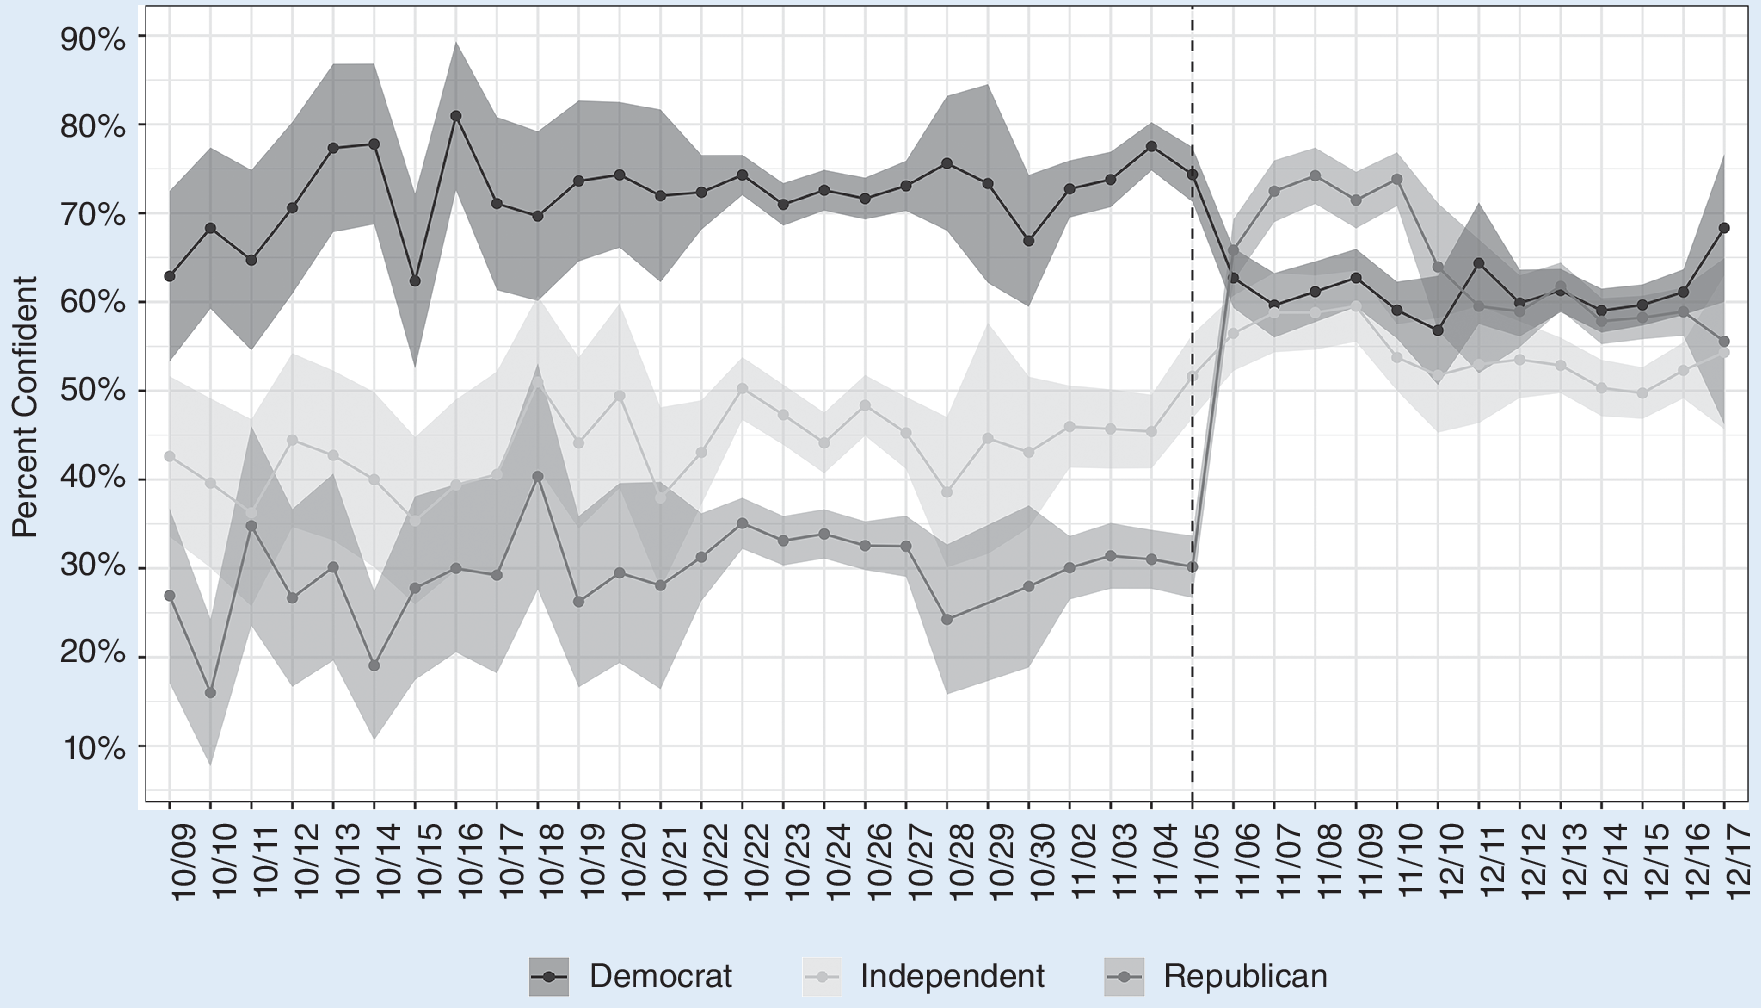
Several conclusions immediately emerge from the patterns in figure 1. As in 2020 (Arceneaux and Truex Reference Arceneaux and Truex2023) but unlike in 2022 (Holliday et al. Reference Holliday, Grimmer, Lelkes and Westwood2024), voter confidence in the national vote count shifted immediately and dramatically after Election Day. The numerous daily samples precisely estimated a dramatic shift in voter confidence immediately after the projected election of President Trump on Election Day, November 5. The fact that voter confidence changed so immediately and dramatically that day suggests that the change resulted from what happened on Election Day. Unlike the more gradual changes often observed when partisans update opinions based on elite messaging (Clinton et al. Reference Clinton, Cohen, Lapinski and Trussler2021), dramatic changes in voter confidence occur immediately.
Among Republicans, confidence in the accuracy of the national vote count immediately increased to match the level of confidence that Democrats expressed before Election Day despite ongoing—but certainly more muted—expressions about the prevalence of voter fraud (e.g., “missing votes”; see Bond Reference Bond2024). Democrats, in contrast, experienced an immediate albeit smaller change in confidence following Election Day. Aligned with previous research on the effects of electoral loss (Reller, Anderson, and Kousser Reference Reller, Anderson and Kousser2022), 16% of Democrats reported decreased confidence after the outcome was announced—despite Vice President Kamala Harris’s prompt concession. That said—and almost certainly reflecting differences in the parties’ reactions to electoral loss—the immediate decline in Democratic confidence in 2024 was substantially smaller than the Republican decline in 2020 (Bowman and Goldstein Reference Bowman and Goldstein2021). Consistent with the importance of elite messaging, twice as many Democrats in 2024 as Republicans in 2020 expressed confidence in the accuracy of national election results after losing.
Finally, figure 1 reveals that the partisan shifts in voters’ confidence had stabilized by mid-December and the difference in confidence between Democrats and Republicans was no longer statistically distinguishable (see online appendix figure S6 for formal statistical tests). Nevertheless, almost 40% of partisans expressed a lack of confidence in the accuracy of the national vote count! Perhaps reflecting their dissatisfaction with the political system (Klar and Krupnikov Reference Klar and Krupnikov2016), unaffiliated voters reported the lowest overall level of confidence—although they expressed slightly more confidence after Election Day than before.
COMPARING CHANGES IN ELITE AND PUBLIC CONFIDENCE
It is useful to benchmark the change in voter confidence observed in figure 1 against the reaction of local political elites to characterize the extent to which more extensive experiences with elections affects the extent to which electoral confidence is contingent on who wins. Not only are local political elites—including school board members, policy makers, and election officials—often more familiar with elections because of their position; they also are more likely to be exposed to elite messaging because of their proximity to political power and the local leadership that they may provide. Of primary interest is whether similar shifts are observed in the confidence expressed by local elites or whether the many ways that they differ from the mass public results in their confidence being less outcome dependent.
To compare the change in voter and local elite confidence, I surveyed almost 1,400 individuals whose position depends on either being elected (i.e., school board members and local policy makers) or running elections (i.e., local election officials) in equal numbers either before or after Election Day. Attempts were made to reinterview the local elites interviewed in October after the election to measure within-individual change; however, due to the small sample sizes (i.e., approximately 200 respondents in each group) and turnover, I took the more cautious approach and treated the sample averages as separate cross sections.
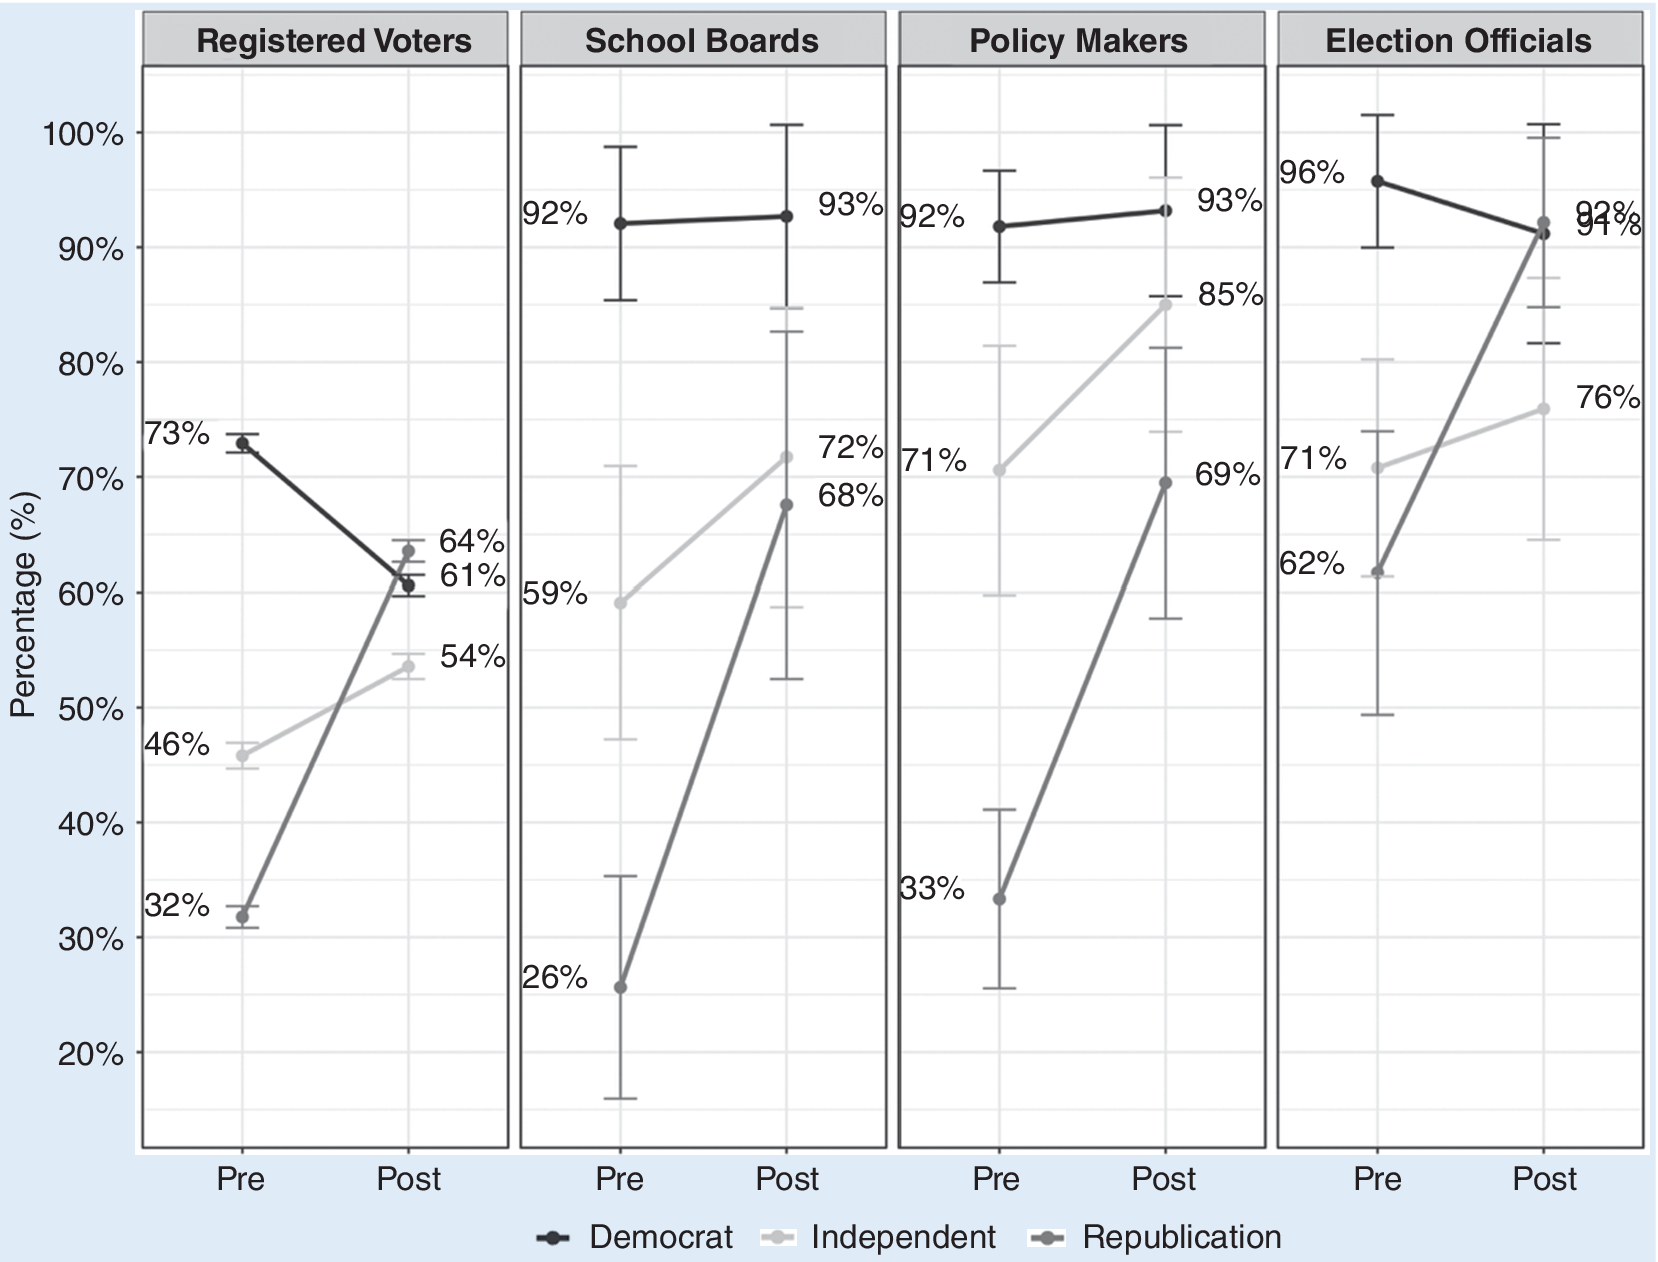
Figure 2 and online appendix tables S4 and S5 compare the average confidence of the three groups of local officials to the average confidence of voters who were interviewed during the same period in either October or December 2024.Footnote 4 Three conclusions were immediately obvious. (See online appendix figure S8 for a similar pattern for own-state confidence.)
Average Confidence Among Registered Voters and Local Political Elites Before and After Election Day by Self-Reported Partisanship
Note: Pre-election opinions were surveyed in October and post-election opinions in December. Averages are unweighted. See online appendix tables S3–S5 for additional details and figure S8 for pre- and post-confidence in own-state vote count.
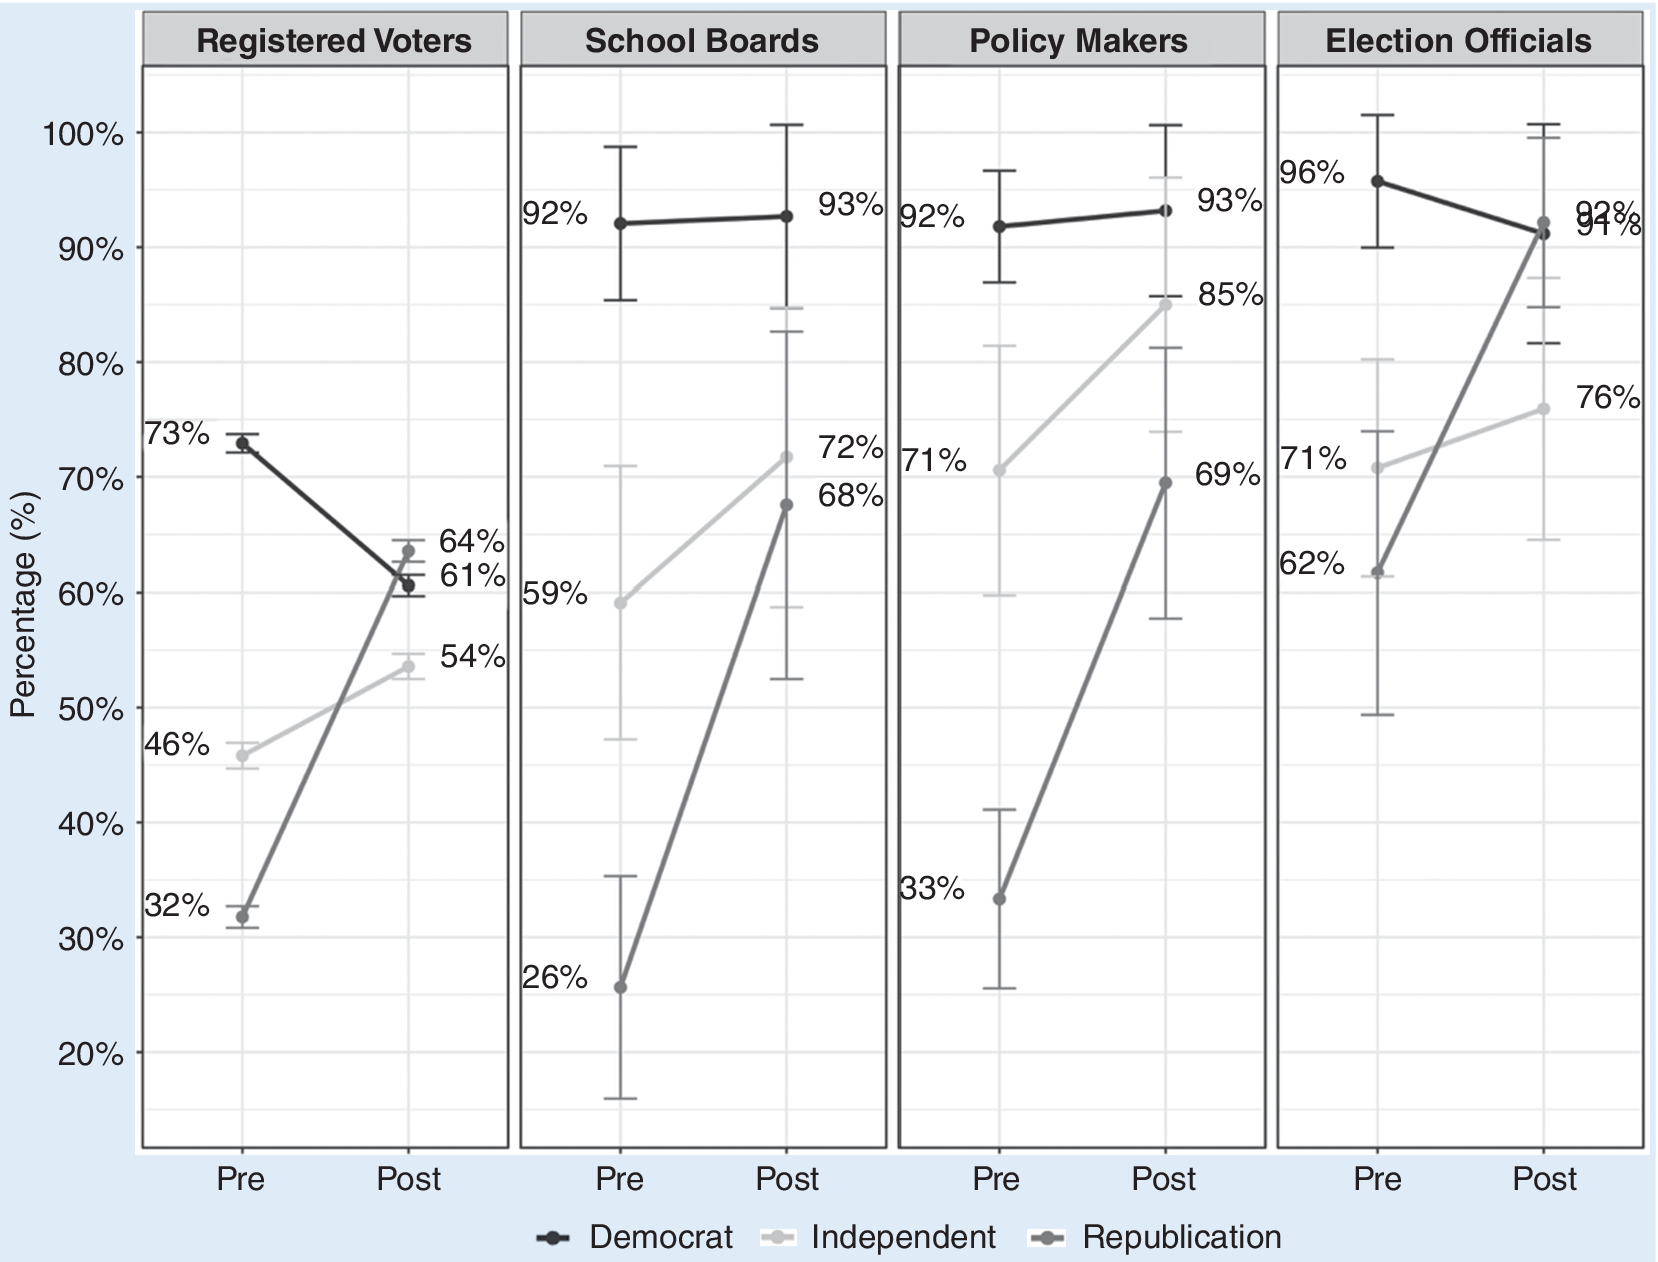
Reflecting the daily changes previously evident in figure 1, figure 2 reveals notable changes in confidence, especially among Republicans: 12% of Democratic voters, 32% of Republican voters, and 8% of Independent voters appear to have changed their opinion about the accuracy of national elections based on the outcome. (Online appendix table S5 reports the formal statistical results.) Relative to the baseline level of confidence expressed before Election Day, these changes represent a 16% decline in confidence among Democrats, a 123% increase in confidence among Republicans, and a 17% increase in confidence among Independents.
There also are important differences in how local elites and voters reacted to the 2024 outcome between the two parties. Among Democrats, local political elites were more confident in the accuracy of the vote count than voters both before and after Election Day. Moreover, unlike the 16% decline in confidence observed among Democratic voters, the confidence of local elites was largely unchanged by the election result. It is impossible to discern why voters reacted differently to the outcome than local elites. However, the difference suggests that local political elites perhaps were more committed to Democratic messaging about the legitimacy of election outcomes and/or more familiar with legitimate elections producing undesirable outcomes than the relatively small percentage of voters who lost confidence because of the outcome. Nevertheless, a majority of Democratic voters and local political elites expressed confidence in the vote count before and after Election Day.
Unlike the divergent reactions to the election results observed among Democratic voters and local political elites, Republican voters and local political elites reacted similarly. Following Election Day, Republican confidence increased by 106% across all three groups of local political elites and by 123% among voters. Moreover, a majority of Republican voters and local political elites expressed confidence in the accuracy of the national vote count after but not before Election Day.
In addition to these party-related differences in how voters and local political elites reacted to the election result, there are important differences in how the various groups of local political elites responded. Local election officials consistently expressed higher levels of confidence than other local political elites in both parties. The difference was relatively slight among Democrats, given the high level of overall confidence, but there was a dramatic Republican difference. That is, Republican election officials were almost 30 percentage points more confident than co-partisan elites before Election Day and they remained 20 percentage points higher after the election. It is impossible to know whether these differences were due to self-selection (i.e., those who chose to work on administering elections were more confident in their performance) or experiences gained from administering elections (Manion et al. Reference Manion, Kimball, Gronke, Anthony and Udani2022). However, the difference is notable and possibly important for identifying political elites whose opinions and experiences may be useful for improving voter confidence.
WHOSE CONFIDENCE CHANGES?
To better understand the confidence changes characterized in figures 1 and 2, I followed the approach taken by Sinclair, Smith, and Tucker (Reference Sinclair, Smith and Tucker2018) and interviewed 6,000 registered voters before and after Election Day to identify the characteristics of voters whose confidence changed following the election. (See the online appendix for the wording and coding of the measures and table S6 for descriptive statistics based on the pre-election survey.)
Reassuringly, the proportion of individuals who exhibited a change in confidence in the panel closely aligned with the cross-sectional trends described in figures 1 and 2. Among the 1,200 Republicans, 37.5% expressed confidence after but not before Election Day (58.2% unchanged). Among the 1,493 Democrats, 17.5% expressed confidence before but not after (73.1% unchanged). Among the 1,463 respondents who identified as “independent,” “other,” or “don’t know,” 9.9% became less confident, 20% became more confident, and 70.1% remained unchanged in their confidence level.
To assess the relative importance of the various factors previously linked to opinion change (Botvinik-Nezer, Jones, and Wager Reference Calvillo, Rutchick and Ryan2023; Calvillo, Rutchick, and Garcia Reference Botvinik-Nezer, Jones and Wager2021), I estimated the difference in confidence (post–pre) as a function of features that were plausibly related to respondents’ willingness to update their beliefs based on the outcome.Footnote 5 (Online appendix table S2 and figure S10 report similar results when predicting whether respondents changed their confidence.)
One of the most theoretically important predictors is affective polarization, measured as the difference in warmth a respondent feels toward Democrats and Republicans (Bakker and Lelkes Reference Bakker and Lelkes2024; Iyengar et al. Reference Iyengar, Lelkes, Levendusky, Malhotra and Westwood2019). Prior research highlights the many negative consequences of affective polarization (Iyengar and Westwood Reference Iyengar and Westwood2015), and exploring whether it also affects the nature of electoral confidence is important for better understanding its effect on politics. Although other scholars have not found a clear relationship between higher levels of affective polarization and support for democratic backsliding (Broockman, Kalla, and Westwood Reference Broockman, Kalla and Westwood2022; Druckman, Green, and Iyengar Reference Druckman, Green and Iyengar2023; Voelkel et al. Reference Voelkel, Chu, Stagnaro, Mernyk, Redekopp, Pink, Druckman, Rand and Willer2023), there are competing reasons to consider that partisan feelings may affect how election outcomes impact voter confidence.
On the one hand, the most affectively polarized partisans may be less likely to change their confidence based on the election outcome because the parties’ campaign messaging mostly reinforced the committed beliefs of the most affectively polarized individuals (Layman et al. Reference Layman, Carsey, Green, Herrera and Cooperman2010; Osmundsen et al. Reference Osmundsen, Bor, Vahlstrup, Bechmann and Petersen2021). Republican skepticism about the legitimacy of recent national elections was sustained throughout 2024 by messages that urged the need to achieve an electoral margin that was “Too Big to Rig” and that would allow Republicans to “Swamp the Vote” (Kincade Reference Kincade2024). Messages that targeted core supporters suggested that a Trump victory would reflect overwhelming support rather than evidence of a free and fair election. Among Democrats, elite messaging reinforced prior beliefs in the legitimacy and validity of national election results (Benen Reference Benen2024). Given the prior-reinforcing messaging used by both parties, the outcome of the election may have had little impact on the beliefs of the most committed partisans.
On the other hand, there is reason to believe that election outcomes have an outsized effect on the confidence of the most polarized partisans because of the relative importance of partisanship to their self-identity (Huddy, Mason, and Aarøe Reference Huddy, Mason and Aarøe2015). Consistent with identity-driven reasoning, prior research shows that affectively polarized individuals are more likely to condition their support for democratic norms on whether their party holds power (Kingzette et al. Reference Kingzette, Druckman, Klar, Krupnikov, Levendusky and Ryan2021) and that the strongest partisans tend to exhibit the largest shifts in confidence following elections (Sinclair, Smith, and Tucker Reference Sinclair, Smith and Tucker2018).
Because political identity is deeply connected to self-concept and emotional investment in politics for highly affectively polarized individuals (Iyengar and Westwood Reference Iyengar and Westwood2015), an electoral victory affirms their political worldview and validates their partisan identity. The fact that the system has “worked” to deliver a preferred and identity-consistent outcome may boost their confidence in the system as a result.
A loss, however, presents a psychological challenge by calling into question the popularity of a person’s views and the status of their political identity within the political system. To reduce the resulting dissonance, polarized partisans may choose to question the legitimacy of the process itself rather than confronting the possibility that they may hold less-popular beliefs (Kunda Reference Kunda1990; Taber and Lodge Reference Taber and Lodge2006). The more intense a person’s affective polarization, the greater the psychological threat posed by a loss and the stronger the motivation may be to delegitimize the outcome rather than accept that their views may be incongruous with the majority (Anderson and LoTempio Reference Anderson and LoTempio2002).
In addition to exploring how affective polarization affects the impact of election outcomes on voter confidence, it is useful to explore the relationship between other characteristics and voter confidence. Educational attainment and political interest are associated with more consistent political beliefs (Devine and Valgarðsson Reference Devine and Valgarðsson2023), but it is unclear whether either of them also affects the willingness to update beliefs based on an outcome. Those who hold conspiratory beliefs may be less likely to trust election results overall (Albertson and Guiler Reference Albertson and Guiler2020; Norris, Garnett, and Gromping Reference Norris, Garnett and Gromping2020) (measured using beliefs about FBI involvement in January 6). However, it is unclear whether these individuals also are differentially likely to change their confidence based on who wins. Perceptions of political status based on past experiences with winning or perceptions of the local political environment also may affect the willingness to update beliefs about electoral confidence if the outcome is unexpected.
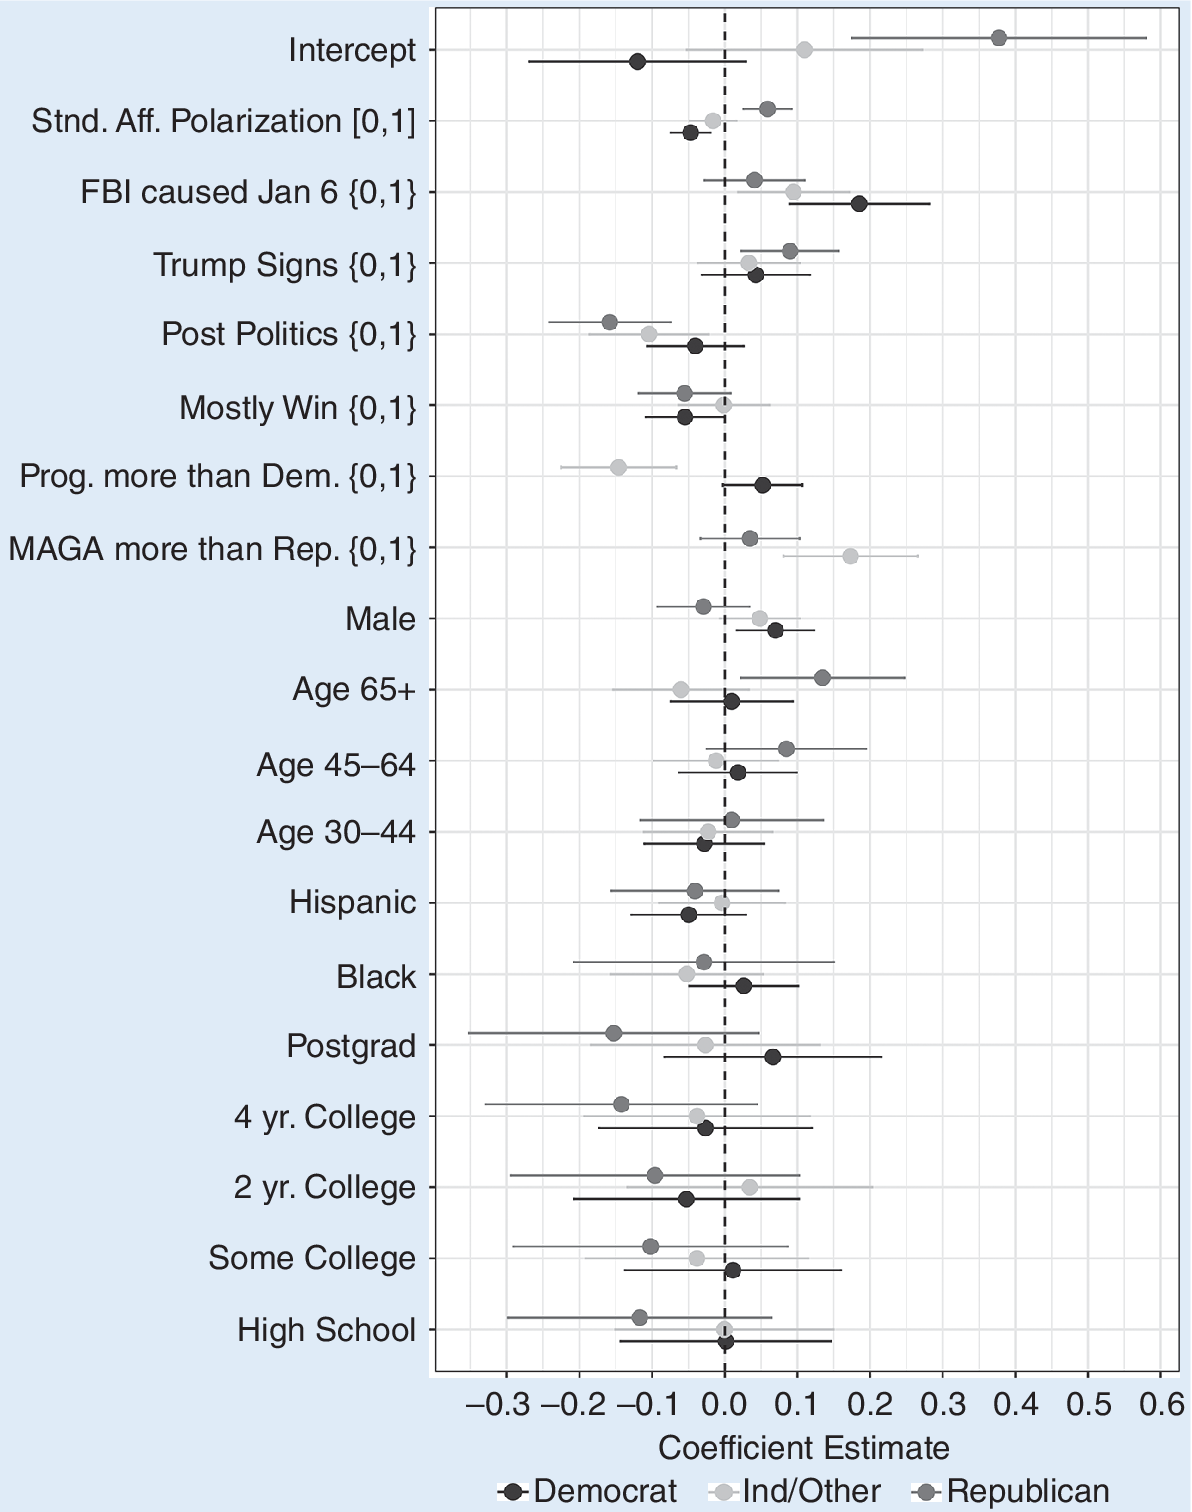
Figure 3 presents the estimated coefficients and 95% confidence intervals when predicting the within-respondent change in confidence separately by party. I standardized the measure of effective polarization for each partisan group to facilitate comparisons—that is, the reported coefficient reflects the impact of a one-standard-deviation change in affective polarization on the change in voter confidence.
Coefficients and 95% Robust Confidence Intervals for Predicting Confidence Change by Partisanship
Note: The dependent variable is the difference between post- and pre-election confidence. The measure of affective polarization is standardized with partisanship and the standard deviation of polarization is 0.316 for Democrats, 0.319 for Republicans, and 0.298 for Independents/Others. Online appendix tables S1 and S3 and figure S9 show similar results using the difference in five-point confidence scales and figure S11 reports unstandardized results. Coefficient results are reported in online appendix table R1.
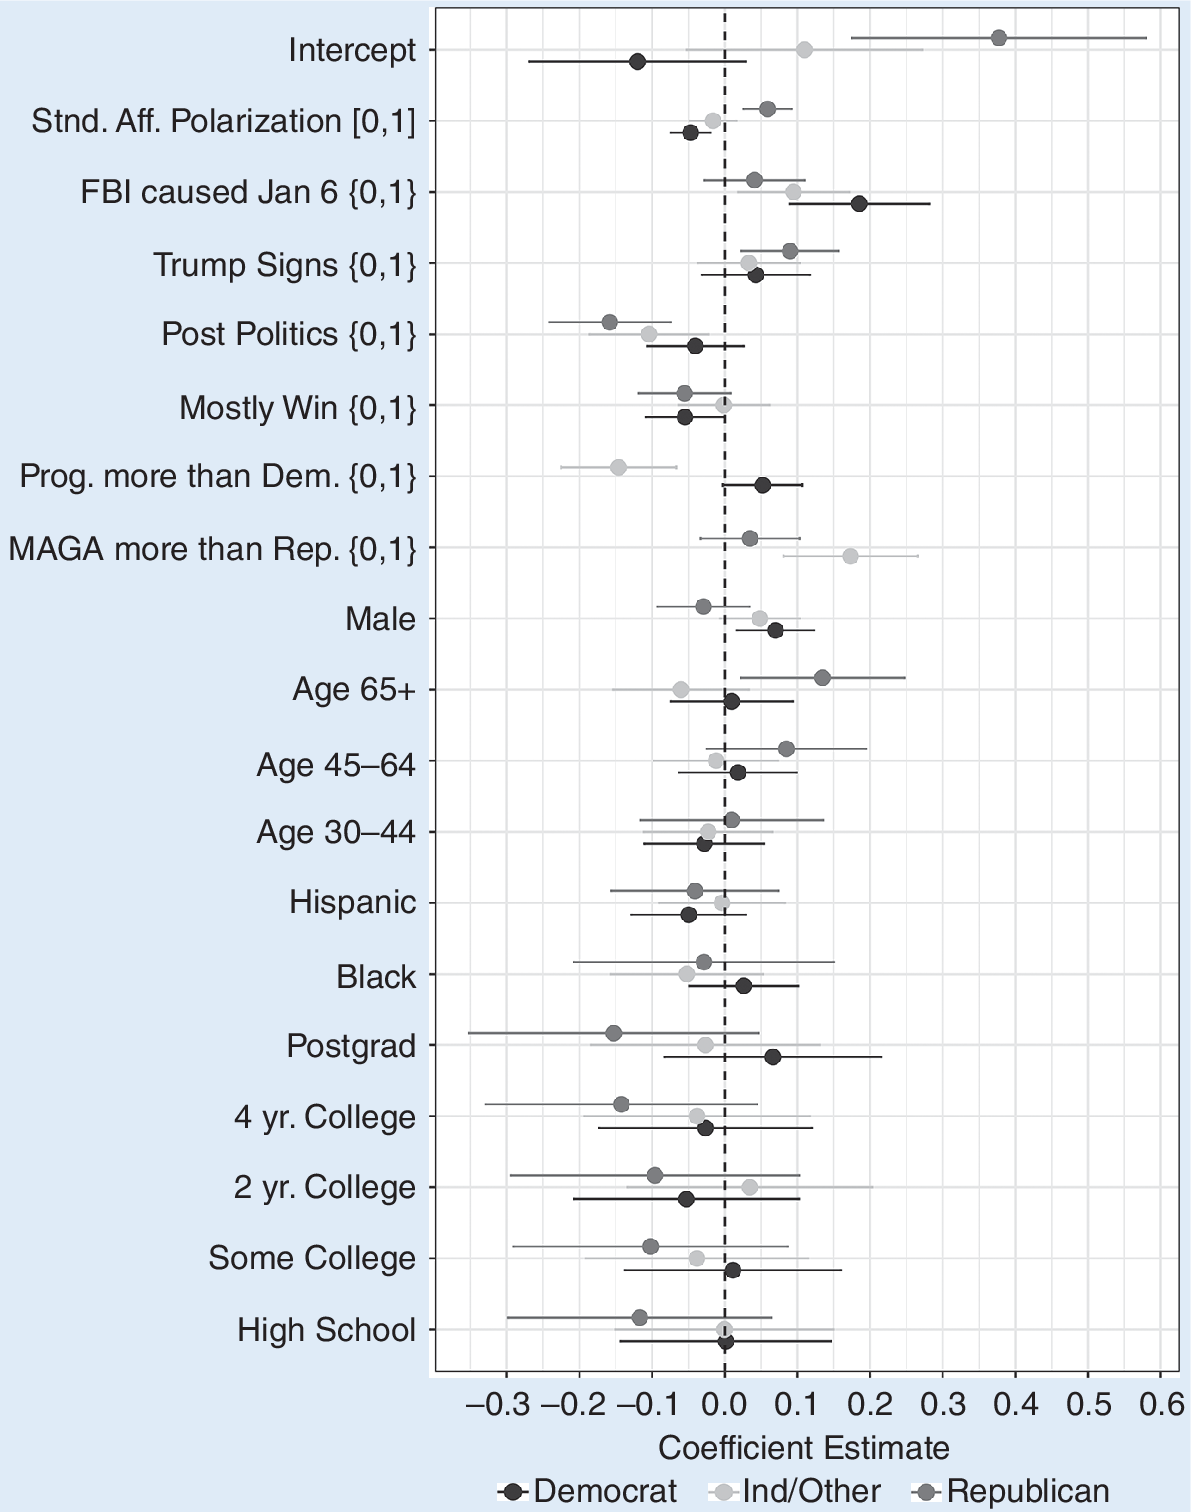
The intercept in each model represents the average overall confidence change for each partisan group independent of other covariates. The large substantively and statistically distinguishable intercept for Republicans (i.e., +0.38 with a robust standard error of 0.10) indicates that there was a large, uniform increase in confidence among all Republicans following the election. In contrast, the insignificance of the intercept (−0.12 (0.08)) among Democrats reveals that there was no such change in confidence. Whereas all Republicans experienced a significant change in confidence following the election, changes among Democrats were far more concentrated.
The plotted coefficients for (standardized) affective polarization in figure 3 clearly reveal that the most polarized partisans also were the most likely to report a change in their confidence about the accuracy of the national vote count following the election. The fact that the similarly sized coefficients were positive for Republicans and negative for Democrats means that polarized Republicans were as more likely to express more confidence following the election as polarized Democrats were less so. The magnitude of the standardized effects—Republicans (+0.06) and Democrats (−0.05)—suggests substantively modest effects, but they are sizably larger than the other included covariates. Rather than being the most likely to maintain prior confidence levels following an election due to the reinforcing effects of elite messaging, the results instead suggest that affectively polarized individuals are the most likely to update their confidence based on the election’s outcome. This suggests yet another adverse consequence of increasing levels of affective polarization (Iyengar et al. Reference Iyengar, Lelkes, Levendusky, Malhotra and Westwood2019; Kingzette et al. Reference Kingzette, Druckman, Klar, Krupnikov, Levendusky and Ryan2021): the more polarized that individuals are, the more likely their electoral confidence depends on who wins.Footnote 6
Other included covariates were mostly uncorrelated with confidence change. As in prior research (Devine and Valgarðsson Reference Devine and Valgarðsson2023), demographic factors were mostly insignificant. In fact, among Democrats, affective polarization was one of the few covariates correlated with decreasing confidence.Footnote 7 Among Republicans, those living in locations with many visible Trump supporters (measured by whether they saw several signs supporting Trump) experienced a small but statistically distinguishable increase in confidence (+0.09, standard error 0.03). However, there was no statistically distinguishable change in confidence among Republicans who associated more with the “Make America Great Again” movement or who stated that they frequently vote for winning candidates. Republicans who reported frequently posting online were least likely to express increased confidence—perhaps suggesting that those who were most active online believed that President Trump won despite an inaccurate vote count. Among Independents, an association with MAGA or the progressive movement was related to increased or decreased confidence, respectively. However, this was because these indicators reflected the partisan leanings of those who initially declined to self-identify with a party.
CONCLUSIONS AND IMPLICATIONS
Examining the confidence that voters and local elites expressed about elections before and after the 2024 presidential election using a variety of survey designs revealed several important and consequential changes in electoral confidence immediately following the projected victory of President Trump on Election Day. Confidence among Republican voters and local political elites more than doubled overnight, whereas the confidence of Democrat voters but not local political elites slightly declined. Moreover, these changes were concentrated among the most affectively polarized partisans, and local election officials reported higher confidence levels than their co-partisans. Consistent with the greater influence of national outcomes over procedural factors or local outcomes in shaping electoral confidence, confidence in both the accuracy of the national vote count and the accuracy of respondents’ own-state vote counts shifted significantly on Election Day following the projected victory of President Trump. Finally, although the partisan confidence gap that emerged after 2020 all but disappeared post-2024, almost 40% of both Democrats and Republicans still lacked confidence in the results—despite there being relatively few disputes about the outcome.
…although the partisan confidence gap that emerged after 2020 all but disappeared post-2024, almost 40% of both Democrats and Republicans still lacked confidence in the results—despite there being relatively few disputes about the outcome.
The patterns I documented in 2024 continue trends found in prior elections (Alvarez, Hall, and Llewellyn Reference Alvarez, Hall and Llewellyn2008; Arceneaux and Truex Reference Arceneaux and Truex2023; Sances and Stewart III Reference Sances and Stewart2015; Sinclair, Smith, and Tucker Reference Sinclair, Smith and Tucker2018). These patterns suggest that electoral confidence depends not only on institutional performance and elite cues but also on how outcomes reflect political identities. That the largest confidence shifts occurred among the most committed partisans in ways that affirmed the legitimacy of favorable outcomes and cast doubt on those that were unfavorable suggests that voter confidence may be shaped by motivated reasoning tied to political identity. Moreover, comparing the relative shifts and differences in messaging between 2024 and 2020 reveals that although elite messaging matters, outcome-related changes in confidence are possible even in its absence.
These findings underscore the troubling possibility that confidence in democratic elections and institutions may depend on agreement with outcomes rather than widely agreed-on procedures, norms, and values. Because so many voters view the legitimacy of the elections through the lens of zero-sum partisan success, elections in a polarized environment may exacerbate rather than resolve political conflict contrary to their intended purpose. Election outcomes not only fail to meaningfully reduce partisan affect (Fasching et al. Reference Fasching, Iyengar, Lelkes and Westwood2024); partisan disagreements over candidates and policies increasingly morph into disagreements about the legitimacy of political institutions and norms (Carey et al. Reference Carey, Helmke, Nyhan, Sanders and Stokes2019; Krishnarajan Reference Krishnarajan2023; Sides, Tausanovitch, and Vavreck Reference Sides, Tausanovitch and Vavreck2022).
The contingent nature of voter and elite confidence in US elections poses troubling implications for democratic legitimacy more broadly. If institutional design and a history of peaceful power transitions cannot prevent dramatic shifts in electoral confidence based on outcomes in a well-established democracy like the United States, the challenges facing newer democracies may be even greater. The relative stability and confidence expressed by local election officials suggest that their perspectives could be a buffer against outcome-driven shifts in public opinion. However, creating and sustaining high levels of voter confidence likely depends on deliberate and consistent messaging from both winning and losing political elites (Anderson et al. Reference Anderson, Blais, Bowler, Donovan and Listhaug2005; Clayton et al. Reference Clayton, Davis, Nyhan, Porter, Ryan and Wood2021; Norris Reference Norris2014).
SUPPLEMENTARY MATERIAL
To view supplementary material for this article, please visit http://doi.org/10.1017/S1049096525101662.
ACKNOWLEDGMENTS
In addition to thanking the editor and anonymous reviewers who helped to improve the article, I thank Steve Rogers for helpful comments on an earlier draft. Colleagues at CivicPulse, YouGov, and Morning Consult provided invaluable assistance with survey instruments and data collection. This study would not have been possible without the support of the Carnegie Foundation—the Andrew Carnegie Fellows program and the associated financial support (Grant No. G-F-24-61687) of which helped to fund the data collection.
DATA AVAILABILITY STATEMENT
Research documentation and data that support the findings of this study are openly available at the PS: Political Science & Politics Harvard Dataverse at https://doi.org/10.7910/DVN/FQZMIG.
CONFLICTS OF INTEREST
The author declares that there are no ethical issues or conflicts of interest in this research.


 Open access

