


Climate change—the current rise in global temperature and accelerating change in weather patterns—and the increasing rate of disasters pose a growing threat to human safety, health, and economic welfare, especially to vulnerable groups and communities (Thomas et al., Reference Thomas, Phillips, Fothergill and Blinn-Pike2009; Thomas et al., Reference Thomas, Jang and Scandlyn2020; United Nations Office for Disaster Risk Reduction [UNDRR], 2015; U.S. Global Change Research Program [USGCRP], Reference Program2017). Weather-related disasters and climate change are inextricably linked: as temperature rise accelerates, so, too, will patterns and intensity of hazards like flooding, wildfires, and hurricanes (USGCRP, Reference Program2017). As weather hazards intensify and become more frequent, the likelihood and magnitude cost of disasters stemming from these events become steeper. That is, disaster risk—the likelihood of injury, death, damage, or destruction from a disaster—will continue to accumulate.
The past decade (2010–2019) generated more than half of the “billion-dollar disasters” recorded since 1980 (National Centers for Environmental Information, 2021). The past five years generated 81 billion-dollar disasters and yearly disaster costs greatly exceeding the 1980–2021 average cost of $45.7 billion. In 2020, 22 weather-hazard-related disasters cost $95 billion in damages (Smith, Reference Smith2021). Negative psychological and physical health impacts related to disasters and climate change are also on the rise (see, e.g., CDC, 2021). For example, recent polling of advanced-economy countries reveals that a median of 72% of people worry that climate change will personally harm them during their lifetime (Bell et al., Reference Bell, Poushter, Fagan and Huang2021).
Given the climbing costs and dangers associated with climate change and the knowledge that anthropogenic factors shape climate change and disaster intensity (e.g., fossil fuels, socioeconomic inequality; see, e.g., UNDRR, 2015), behavioral scientists stand at a watershed moment. As environmental issues become increasingly politicized and polarizing, research into factors that influence people’s attitudes about disasters, climate change, and the sociopolitical systems that shape vulnerability to each are crucial first steps to pushing for behavior change to remediate these issues. While political psychologists have understandably focused their efforts on studying factors that influence people’s beliefs about climate change writ large (e.g., climate change skepticism), less attention has been paid to factors shaping how people believe we should minimize the impacts of specific disasters. Here, we extended past research by examining both: focusing on disaster risk as a key variable while retaining climate change beliefs as an exploratory focus.
People vary in climate change beliefs and also in their views on disaster attribution and risk mitigation (see, e.g., Colvin et al., Reference Colvin, Prokosch, von Meding, Chmutina and Smith2022; Lizarralde et al., Reference Lizarralde, Bornstein, Robertson, Gould, Herazo, Petter and Bouchereau2021). For example, people who believe that disaster severity is linked to climate change tend to endorse more government intervention to reduce disaster impacts (e.g., legislating new construction standards; removing dead vegetation), though support for disaster policies that would reduce social vulnerability (e.g., financially helping those who lose homes) tends to fall along party lines (Republicans favor such policies less than independents and Democrats; MacInnis & Krosnick, Reference MacInnis and Krosnick2020). Additionally, connecting disasters stemming from weather hazards to larger-scale climate change may increase acceptance that climate change is occurring (Zanocco et al., Reference Zanocco, Boudet, Nilson, Satein, Whitley and Flora2018). Conversely, climate skeptics react to the link between disasters and climate change being made apparent with resistance, labeling hazards as less severe (which may exacerbate disaster risk) and becoming more skeptical of climate change (Dixon et al., Reference Dixon, Bullock and Adams2019; Zanocco et al., Reference Zanocco, Boudet, Nilson, Satein, Whitley and Flora2018).
Large-scale contextual factors like country-level political culture explain some of the variance in how disaster risk and climate change are viewed. For example, political polling across the last decade has revealed that the United States (especially Republicans, evangelicals, and those who feel economically threatened) reports higher rates of climate change skepticism than other countries (Benegal, Reference Benegal2018; Dunlap et al., Reference Dunlap, McCright and Yarosh2016; Fagan & Huang, Reference Fagan and Huang2019; Shao, Reference Shao2017). These differences may stem in part from differences in environmental policy platforms between parties: conservative platforms tend to discourage environmental intervention as it is perceived to come at cost of industrialism, while liberal platforms encourage pro-environmentalism and industrial regulation (McCright et al., Reference McCright, Marquart-Pyatt, Shwom, Brechin and Allen2016).
While context remains an important consideration for researchers and policymakers alike, research into individual differences (beyond political party affiliation) that shape variation in climate change skepticism and views on disasters also represents an important opportunity for those seeking ways to mitigate climate change and climate-related disasters (e.g., floods). Here, we highlight important belief and affective differences that we predicted would relate meaningfully to both disaster blame and mitigation, as well as climate change: beliefs about hierarchy and defending the status quo and trait empathy. Our choice of these traits was based on the literature suggesting that psychological needs to maintain social order (and dominance) may prompt defensive processes that reinforce climate skepticism and limit support for intervention. Environmental practices are often tied to existing industrial practices and sociopolitical structures; thus, the growing threats of climate change and disasters, and the need for broader adaptations to reduce their impacts, may also threaten the preservation of current social systems, prompting increased defensiveness (see Feygina et al., Reference Feygina, Jost and Goldsmith2010; Santos & Feygina, Reference Santos and Feygina2017). Further, we introduce a biological individual difference that we hypothesized would predict these worldviews and trait empathy, as well as climate change and disaster views: physical formidability.
Physical formidability and political attitudes
Physical formidability—the ability to inflict damage on others in combat (Sell, Tooby, & Cosmides., Reference Sell, Tooby and Cosmides2009)—is an underexplored individual difference that might be related to hierarchical worldview, status quo defense, and empathy (and, in turn, views on disasters and climate). Formidability has acted as a valuable form of social capital for men throughout history by allowing them to more successfully bargain for their own interests by threatening to inflict physical cost on others or providing protective benefits to the in-group (Lukazewski et al., Reference Lukaszewski, Simmons, Anderson and Roney2016; Sell, Tooby, & Cosmides, Reference Sell, Tooby and Cosmides2009; Zeng et al., Reference Zeng, Cheng and Henrich2022). Indeed, highly formidable men (e.g., those with greater upper-body strength) tend to be more prone to anger, less prone to anxiety and neuroticism, and more prone to aggressively barter for their self-interests than less formidable men (Kerry & Murray Reference Kerry and Murray2018, Reference Kerry and Murray2021; Manson et al., Reference Manson, Chua, Rodriguez, Barlev, Durkee and Lukaszewski2022; Petersen & Dawes, Reference Petersen and Dawes2017; Sell, Cosmides et al., Reference Sell, Cosmides, Tooby, Sznycer, von Rueden and Gurven2009; Sell, Tooby, & Cosmides, Reference Sell, Tooby and Cosmides2009; Sell et al., Reference Sell, Hone and Pound2012; Sell et al., Reference Sell, Eisner and Ribeaud2016). Further reinforcing the bargaining asymmetries that formidable men may enjoy, formidable men may have also been viewed as especially beneficial partners for coalitional activities like hunting and warfare because of their increased strength.
Evidence suggests that formidability remains a salient social signal; people rapidly judge formidability and infer its behavioral correlates, especially when evaluating men (e.g., benefit-provisioning and cost-inflicting abilities, self-interest-promoting attitudes, high status; see Brown et al., in press; Durkee et al., Reference Durkee, Goetz and Lukaszewski2018; Durkee et al., Reference Durkee, Lukaszewski and Buss2020; Krems et al., Reference Krems, Merrie, Short, Duarte, Rodriguez, French, Sznycer and Byrd-Craven2022; Lukazewski et al., Reference Lukaszewski, Simmons, Anderson and Roney2016; Sell, Cosmides, et al., Reference Sell, Cosmides, Tooby, Sznycer, von Rueden and Gurven2009). Accordingly, formidability has historically been intertwined with human hierarchies: highly formidable men have enjoyed relative advantages in status, resource allocation, coalition building, and mate acquisition (see e.g., Eisenbruch et al., Reference Eisenbruch, Grillot, Maestripieri and Roney2016; Lukaszewski et al., Reference Lukaszewski, Simmons, Anderson and Roney2016; Price et al., Reference Price, Brown, Dukes and Kang2015; Sell, Lukazsweski & Townsley, Reference Sell, Lukazsweski and Townsley2017; Zeng et al., Reference Zeng, Cheng and Henrich2022).
What implications does formidability produce for political psychology? Studies have found that, similarly to acting competitively in self-interest in small-scale interactions, formidable men tend to hold political attitudes that promote and preserve competitive socioeconomic systems. Formidable men tend to be less endorsing of egalitarianism (Petersen et al., Reference Petersen, Sznycer, Sell, Cosmides and Tooby2013; Petersen & Laustsen, Reference Petersen and Laustsen2019; Richardson, Reference Richardson2021), espouse more hierarchical worldviews (Price et al., Reference Price, Kang, Dunn and Hopkins2011, Reference Price, Sheehy-Skeffington, Sidnaius and Pound2017), favor more economically conservative platforms (e.g., are in favor of free markets; Kerry & Murray, Reference Kerry and Murray2019), and express greater support for use of violence or militancy to resolve conflict (Brown et al., Reference Brown, Chua and Lukaszewski2021; Sell, Sznycer et al., Reference Sell, Sznycer, Cosmides, Tooby, Krauss, Nisu, Ceapa and Petersen2017; Urbatsch, Reference Urbatsch2021). Conversely, people may also infer conservativism from men’s bodily formidability (Brown et al., in Reference Brown, Sacco and Lukaszewskiin press).
Formidability, which tends to be greater in men than in women, may partly explain some of the variance in the recurring political gender gaps from past research, in which men tend to show greater support for group inequality, militancy, and conservative political attitudes (see, e.g., Pratto et al., Reference Pratto, Stallworth and Sidanius1997). Evolutionarily, parental investment asymmetries have created greater mating competition that may prompt more status seeking and physical infighting among men than women (see, e.g., Buss & Schmitt, Reference Buss and Schmitt1993; Campbell, Reference Campbell1999). More proximately, long-standing societal divisions of labor between the sexes have led to men’s status hierarchies being relatively more unstable and precarious than women’s (Vandello et al., Reference Vandello, Bosson, Cohen, Burnaford and Weaver2008). Men’s gender and social statuses are consequently more directly tied to social proof of masculinity than women’s status is to acts of femininity. Thus, displays of formidability via aggression, toughness, militancy, and endorsing related political platforms may simply reflect men’s greater need to reinforce status through “proofs of masculinity” (Bosson & Vandello, Reference Bosson and Vandello2011); more formidable men may enjoy higher status because they are less threatened by the potential inability to meet these proofs.
Consistent with past findings, we predicted that more formidable men would support anti-egalitarian worldviews (Kerry & Murray, Reference Kerry and Murray2019; Petersen & Laustsen, Reference Petersen and Laustsen2019; Price et al., Reference Price, Sheehy-Skeffington, Sidnaius and Pound2017). We extended these past findings by examining whether these men would also hold worldviews that support the preservation of hierarchical, competitive social systems (e.g., justify the existing free market). Further, proposed actions to mitigate disasters and climate change often involve a sacrifice of one’s own or in-group interests in the interest of the public good (i.e., heightened cooperativeness; see, e.g., Barclay & Barker, Reference Barclay and Barker2020; Van Lange & Rand, Reference Van Lange and Rand2022), whereas highly formidable men are less inclined to concede their own or in-group interests (Muñoz-Reyes et al., Reference Muñoz-Reyes, Polo, Valenzuela, Pavez, Ramírez-Herrera, Figueroa, Rodriguez-Sickert, Díaz and Pita2020; Sell, Tooby et al., Reference Sell, Tooby and Cosmides2009) and are possibly more reluctant to appear “weak” by compromising on these issues (Vandello & Bosson, Reference Vandello and Bosson2013). Thus, we extended past work linking formidability to anti-egalitarianism by predicting that highly formidable men should be less likely to endorse social interventions that would mitigate disaster or climate change risk by reducing inequalities (e.g., by relocating the homeless prior to a flood event or by reducing fossil fuel consumption and unrestrained economic growth in favor of creating new green infrastructure).
In short, highly formidable men may passively allow more disaster and environmental risks to accumulate by (1) downplaying the role of anthropogenic factors in creating each (e.g., not believing in man-made climate change, seeing disasters as “natural”), and (2) disfavoring policies that might reduce such risks through redistributing resources or requiring personal sacrifices (see, e.g., Conlon & Rose, Reference Conlon and Rose2017). Conversely, we expected that people low in formidability should favor such policies to reduce climate and disasters. Next, we discuss the role of factors that we expect to mediate this relationship: hierarchical, status quo defensive worldviews and empathy.
Worldviews and political psychology
Past research has identified worldview as an important predictor of differences in political views: for example, high-status individuals with hierarchical worldviews (e.g., those reporting high social dominance orientation) favor political action that maintains unequal status quo systems (Prati et al., Reference Prati, Pratto, Zeineddine, Sweetman, Aiello, Petrović and Rubini2022). Accordingly, worldview also shapes people’s views on disasters, climate change, and how to handle these problems (Feygina et al., Reference Feygina, Jost and Goldsmith2010; Gifford, Reference Gifford2011; Hornsey, Reference Hornsey2021). For example, people with more hierarchical (e.g., endorse social inequality) and status quo defensive worldviews (i.e., that existing systems are justified) tend to assign less blame to human factors when disasters happen and report less interest in using social interventions to reduce disaster risk (Colvin et al., Reference Colvin, Prokosch, von Meding, Chmutina and Smith2022). That is, people who view inequality as more inherent and feel that competitive systems are justified are less inclined to intervene in ways that might reduce disaster risk. The authors found that these relationships held even after controlling for political affiliation, suggesting that these psychological constructs explain meaningful variance in disaster views independent of political context.
Similar relationships are found for climate change beliefs; people with hierarchical worldviews (e.g., social dominance: Häkkinen, & Akrami, Reference Häkkinen and Akrami2014; Jylhä & Akrami Reference Jylhä and Akrami2015; Jylhä et al., Reference Jylhä, Tam and Milfont2021; racial prejudice: Benegal, Reference Benegal2018) tend to express more denial that climate change is occurring or should be mitigated. A meta-analysis by Stanley and Wilson (Reference Stanley and Wilson2019) suggests that social dominance orientation and right-wing authoritarianism each negatively relate to environmental beliefs, attitudes, and support for climate action (–.14 ≤ rs ≤ –.57), in some cases even predicting these relationships more strongly than overt political affiliation. Similarly, those who are defensive of current social systems (e.g., in the United States: individualistic, free markets) tend to express less belief in climate change, to assign less blame to human factors in shaping disasters, and to report less support for social interventions to reduce impacts (Druckman & McGrath, Reference Druckman and McGrath2019; Feygina et al., Reference Feygina, Jost and Goldsmith2010; Santos & Feygina, Reference Santos and Feygina2017; Hornsey, Reference Hornsey2021).
Some research suggests that this relationship is especially true for people in positions of power (Conlon & Rose, Reference Conlon and Rose2017). For example, some research has found a “White male effect”: White men enjoy relatively higher social status and have more of a culture of individualistic anti-egalitarian attitudes than other race- and gender-based social groups. In turn, White men tend to perceive lesser risk from environmental threats like climate change (Kahan et al., Reference Kahan, Braman, Gastil, Slovic and Mertz2007). We argue here that formidability, which tends to increase social power for men, may also lead to disaster risk accumulation via increased hierarchical and status quo defensive worldviews.
Empathy and political psychology
Research also suggests that empathy can play a meaningful role in shaping people’s political intentions and behavior. We define empathy here as the ability take the perspective of and feel compassion toward others (see e.g., Davis, Reference Davis1983). Feelings of empathy prompt people to behave more altruistically toward targets of their empathy—for example, by increasing support for social welfare to support the unlucky (Petersen et al., Reference Petersen, Sznycer, Cosmides and Tooby2012), expressing greater willingness to help disaster victims (Marjanovic et al., Reference Marjanovic, Struthers and Greenglass2012), or reporting greater willingness to engage in social distancing behaviors to contain the spread of COVID-19 (Pfattheicher et al., Reference Pfattheicher, Nockur, Böhm, Sassenrath and Petersen2020).
Evidence is also emerging that empathy, or the lack thereof, shapes people’s worldviews and accompanying views on climate change. Hierarchical and system justifying worldviews are related to lower empathy (Hudson et al., Reference Hudson, Cikara and Sidanius2019; Jylhä & Akrami, Reference Jylhä and Akrami2015; Li & Edwards, Reference Li and Edwards2021; Sidanius et al., Reference Sidanius, Kteily, Skeffington, Ho, Sibley and Duriez2013). For example, people who endorse group inequality exhibit lower empathy for out-group members and increased schadenfreude at the misfortunes of out-groups compared to people with more egalitarian worldviews (Hudson et al., Reference Hudson, Cikara and Sidanius2019). Social solutions to both disaster mitigation (e.g., reducing societal inequalities rather than investing in technocratic solutions) and climate change often require empathizing and cooperating with in-group and out-group members alike. Thus, lower empathy has been linked to greater denial of anthropogenic climate change and disinterest in taking efforts to mitigate climate change (Arnocky & Stroink, Reference Arnocky and Stroink2010; Jylhä & Akrami, Reference Jylhä and Akrami2015).
Given the existing links between hierarchical worldviews and lesser empathy, we also predicted that highly formidable men would tend to express lower trait empathy (concern for others and interest in perspective taking). As traits like rugged individualism and competitiveness are often viewed as “masculine” and traits like empathy and egalitarianism are considered “feminine,” highly formidable men may be more motivated to meet masculine gender norms by displaying greater self-interest and lesser empathy (Winter, Reference Winter2010). Consequently, we predicted that more formidable men should tend to accept more disaster and climate change risk accumulation via lowered empathy.
The current research
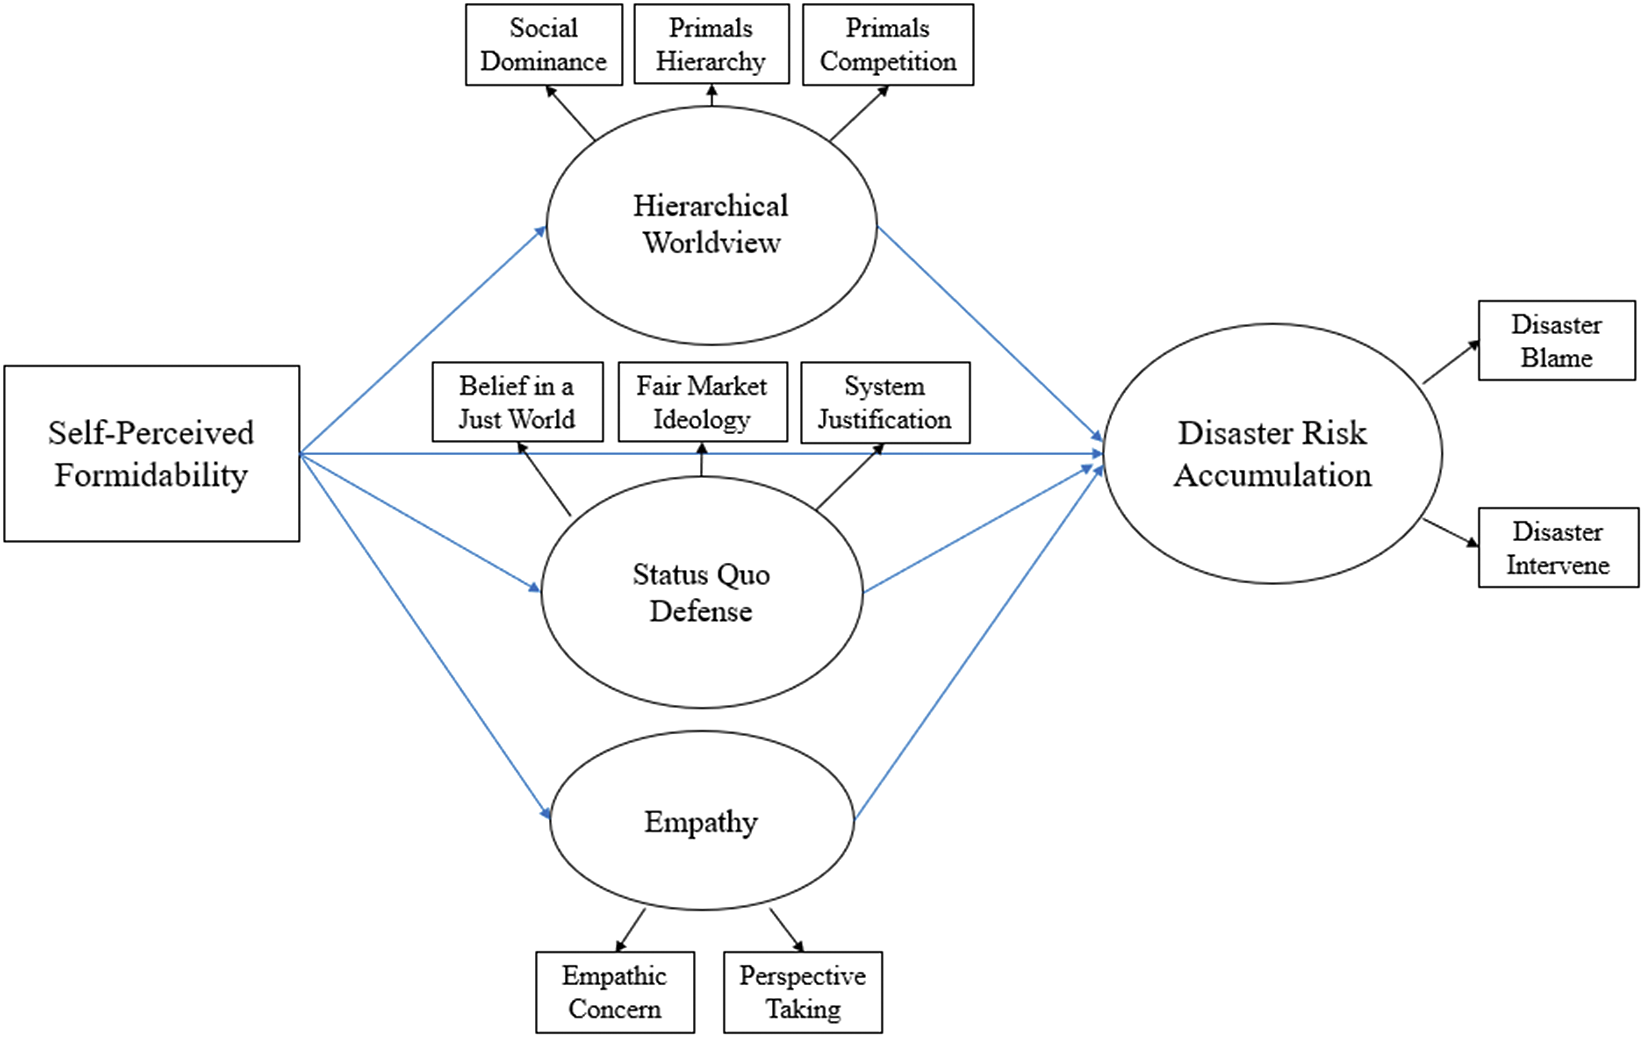
This registered report combines insights taken from evolutionary psychology, political psychology, and social psychology to probe how formidability relates to attitudes about disasters, climate, and potential cognitive (worldview) and affective mediators of this relationship. Given the relationships found in past research and outlined in the introduction, we proposed a theoretical model in which formidability predicts disaster risk accumulation via worldviews and empathy, with hypotheses as follows (see Figure 1 for model visualization):
H1: Highly formidable men will tend to endorse more (a) hierarchical worldviews and (b) status quo defensive worldviews, and (c) report lower levels of empathy.
H2: Highly formidable men will hold attitudes that are more congruent with disaster risk accumulation. That is, they will tend to hold more individualistic views of disaster risk, assign lesser blame to social contributions to disasters (e.g., unequal resource distribution), and be less endorsing of social interventions to reduce disaster impacts (e.g., increasing assistance for the homeless in advance of a weather hazard).
H3: People who (a) hold more hierarchical worldviews, (b) hold more status quo defensive worldviews, and (c) report lower empathy will tend to hold attitudes that are congruent with disaster risk accumulation. We envision these relationships as parallel, rather than interactive. That is, the relationship between each of these constructs and disaster risk accumulation may occur in tandem but should also hold independently.
H4: Hierarchical worldviews, status quo defensive worldviews, and empathy will mediate the relationship between men’s formidability and attitudes congruent with disaster risk accumulation.
Theoretical model for proposed studies. Letter strings and symbols (e.g., H1a +) indicate the relevant hypothesis and direction of prediction for a specific model path (e.g., Hypothesis 1a, positive relationship).

Last, as a supplemental exploratory analysis, we examined the relationships between formidability, worldviews, empathy, and climate change beliefs. We predict a similar mediational model, in which formidability, hierarchical worldviews, and status quo defense will relate to greater climate change skepticism, and empathy will relate to lesser skepticism. A figure depicting these predictions can be found in the Supplementary Materials.
We proposed a two-study test of our hypotheses to balance concerns of power while preserving ecological validity. First, we ran a well-powered online study that examined the relationship between formidability and our dependent constructs in a demographically diverse sample. Given the difficulty of instructing participants to complete a more objective formidability measure (like measuring their flexed bicep), and the measurement noise that such a task might produce, we opted to use a self-report measure of formidability. Past research has found self-reports of formidability are (1) reasonably correlated with objective formidability (Durkee et al., Reference Durkee, Goetz and Lukaszewski2018) and (2) produce analogous patterns of results to objective formidability, albeit with approximately half the effect size of physical measures (Petersen & Laustsen, Reference Petersen and Laustsen2019). Second, we planned to complement the results of our online study by running a laboratory study in which we would collect objective measures of formidability, a more ecologically valid marker of formidability.
One last issue of note is that past studies have found some (albeit inconsistent) evidence that formidability in women may also meaningfully relate to worldview and political attitudes (see, e.g., Petersen & Laustsen, Reference Petersen and Laustsen2019; Richardson, Reference Richardson2021; Urbatsch, Reference Urbatsch2021). Further, past research has found gender differences in worldviews, empathy, and views on the environment, such that men tend to endorse hierarchy, exert more defense of existing systems, and report lesser trait empathy and lesser environmentalism than women (Arnocky & Stroink, Reference Arnocky and Stroink2010; Colvin et al., Reference Colvin, Prokosch, von Meding, Chmutina and Smith2022; Goldsmith et al., Reference Goldsmith, Feygina, Jost, Alston and Whittenbury2013; Sidanius et al., Reference Sidanius, Pratto and Bobo1994). To allow for another highly powered probe into these questions, we collected data from both men and women in each of our studies.
The registration can be found on the Open Science Framework at https://osf.io/nwvp3.
Study 1: Does self-reported formidability predict disaster risk accumulation?
Method
Participants
We used Project Implicit’s study platform to collect data. Project Implicit is a nonprofit organization that hosts an educational website (https://implicit.harvard.edu) where people can learn about their implicit attitudes through demonstrations and/or participation in research studies. We allowed any English-speaking man or woman to participate. There were no location restrictions, and all participation in the study was voluntary.
Power analysis and recruitment
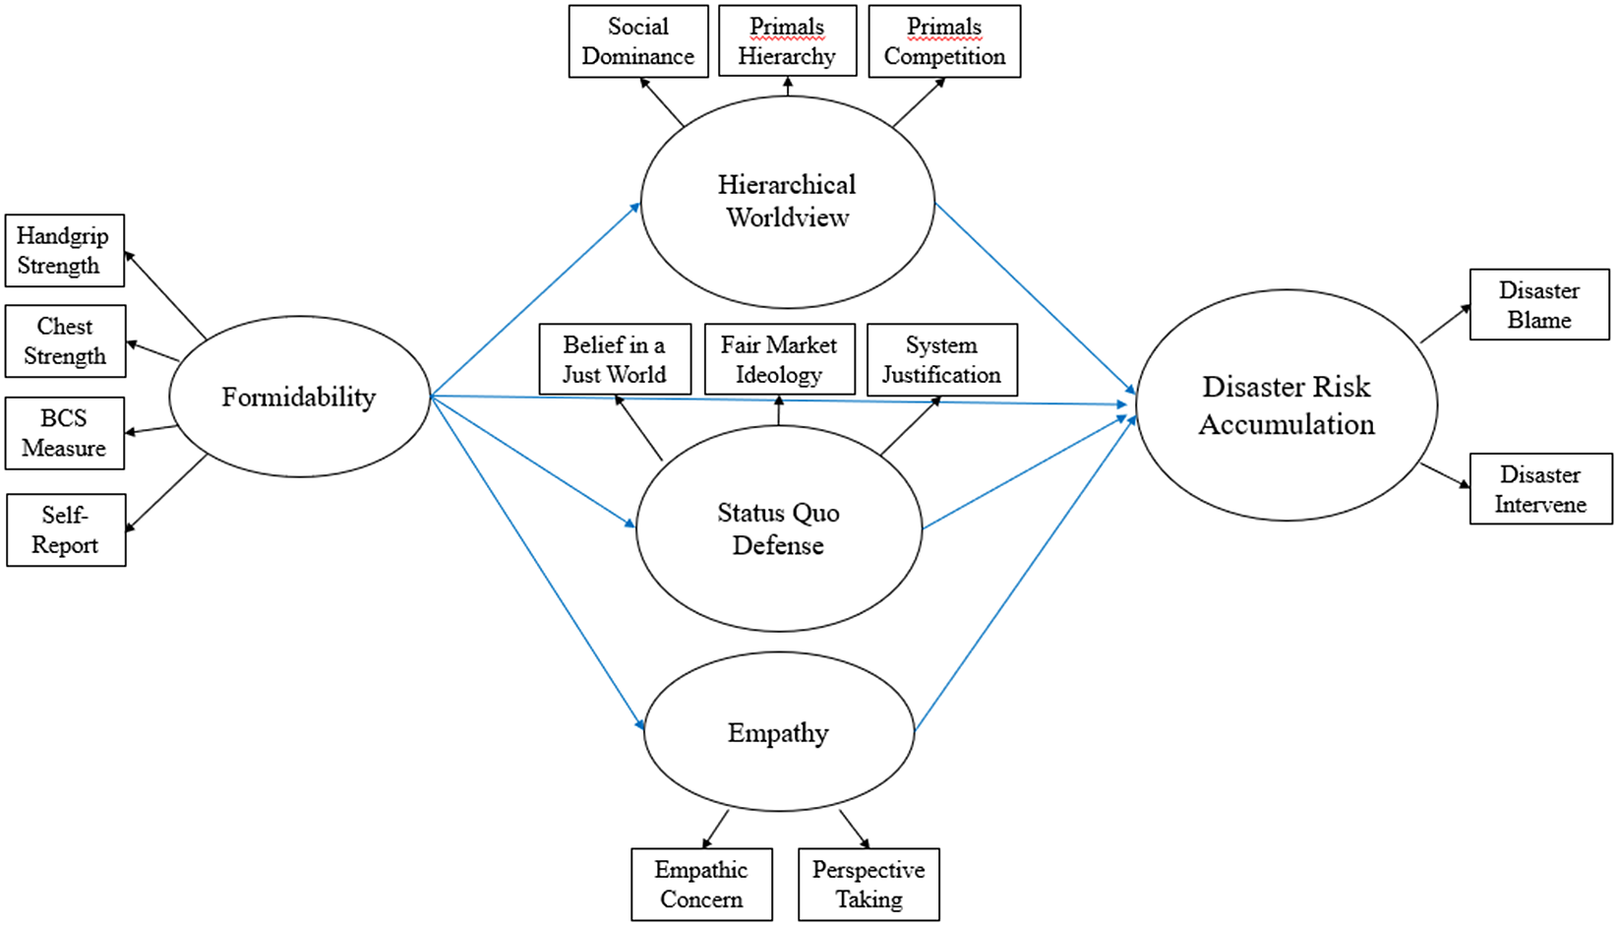
A priori sample calculations were made based upon our analytic model structure and target effect size of interest, using a sample size calculator (Soper, Reference Soper2021) assuming 11 observed variables and 4 latent variables (see Figure 2), and a probability level of .05. Results revealed that we should plan to collect a minimum of 241 participants’ data to adequately power (β = .80) our tests of model structure. After a review of the literature, we predicted that the smallest effect sizes of interest we should power for would be between formidability and worldview (estimated r of around .13, based on Kerry & Murray, Reference Kerry and Murray2019; Petersen & Laustsen, Reference Petersen and Laustsen2019). Power analyses suggest that we should collect a minimum of 849 participants’ data to adequately power (β = .80) our ability to detect this effect. As we planned to use the data collected in this study as exploratory data for a different project on invariance testing within men and women (see Supplementary Materials), we doubled the planned sample size to allow for well-powered testing of our model separately within men and women. Thus, we planned to collect data from a minimum of 1,698 participants (849 men, 849 women) to power our confirmatory and exploratory tests. To account for likely participant attrition related to running an online study, we oversampled and aimed to recruit 2,000 participants.
Planned analytical model for online study. Squares represent survey scale composites (observed variables), while circles denote latent variables. Black arrows represent scale factor loadings onto latent variables, while blue arrows represent regression pathways.
Final sample
After excluding participants who did not complete the full survey (in line with our registered analytic plan), our sample consisted of 1,908 people (956 women, 952 men) from around the world (75.6% reported living in the United States), who reported being between 18 and 112 years of age (M = 38.00, SD = 15.43). White-identifying participants made up the majority of the sample (59.8%), The rest of the sample reported being Hispanic (11.8%), Asian (11%), Black (10.8%), Middle Eastern/North African (1.2%), Native American (0.4%), Pacific Islander (0.3%), or more than one race/ethnicity (4.8%). Other sample characteristics relevant to our study (e.g., political orientation) can be found in Table 1.
Sample characteristics for Study 1.

Procedure and materials
Upon registering on Project Implicit, all participants provided basic demographics. Participants who were assigned to participate in our study and consented to do so first completed a measure of self-perceived formidability. Participants also reported where they place blame for disasters and their beliefs about whether disasters can and should be mitigated through social interventions (coded so that a higher score indicates greater acceptance of disaster risk accumulation: Colvin et al., Reference Colvin, Prokosch, von Meding, Chmutina and Smith2022). As an exploratory measure, participants also completed a short measure of their beliefs about climate change. They answered questionnaires (in randomized order) assaying their general empathy; the extent to which they view the world as being a hierarchical, competitive place; and how much they believe that current socioeconomic systems are justified and should be maintained. Political orientation was measured as a composite of three questions assessing how fiscally, socially, and generally liberal to conservative people self-identify as, with higher scores indicating greater conservatism (1 = Very Liberal; 4 = Neither Liberal Nor Conservative; 7 = Very Conservative). Last, they completed a single-target IAT unrelated to the current hypotheses before being debriefed. Of note for potential order effects: participants always completed formidability measures first, disaster and climate views (randomized) next, the worldview and empathy questionnaires (randomized) next, and political orientation near the end of the survey.
Formidability
We measured self-perceived formidability using a 9-item measure (Durkee et al., Reference Durkee, Goetz and Lukaszewski2018). Participants rated the degree to which they agreed that statements about physical formidability apply to them (e.g., “I am physically stronger than most people my age and sex.”) using a 4-point scale (endpoints: 1 = strongly disagree, 4 = strongly agree). We formed a mean formidability composite, where a higher score indicates that greater self-perceived formidability (α = .88). As exploratory measures, participants also reported their weekly time spent weightlifting (“Approximately how much time per week do you spend lifting weights, in order to build your muscles”; 6-point scale: 1 = none at all, 6 = more than four hours; Price et al., Reference Price, Sheehy-Skeffington, Sidnaius and Pound2017) and their height and weight. We converted height and weight to BMI (body mass index). Of note for determining potential order effects, self-perceived formidability was always measured before weight training and height and weight.
Hierarchical worldviews
Participants completed three scales to assess hierarchical and competition-relevant worldviews.
Social dominance orientation
We measured beliefs about social hierarchies via the social dominance orientation scale (SDO7: Ho et al., Reference Ho, Sidanius, Kteily, Sheehy-Skeffington, Pratto, Henkel and Stewart2015). We chose this scale as it assesses people’s belief in a necessary social hierarchy. Participants rated their endorsement of 16 statements that imply there is a natural, justified hierarchy among social groups (e.g., “It’s probably a good thing that certain groups are at the top and other groups are at the bottom.”) using a 7-point scale (endpoints: 1 = strongly oppose, 7 = strongly favor). We recoded necessary items and formed a mean SDO composite (α = .88), where a higher score reflected endorsement of intergroup inequality (i.e., a more hierarchical worldview).
Primal world beliefs
Participants completed the hierarchical subscale of the 99-item Primals Inventory (Clifton et al., Reference Clifton, Baker, Park, Yaden, Clifton, Terni, Miller, Zeng, Giorgi, Schwartz and Seligman2019). We chose this measure as it captures a belief that things can be meaningfully ranked and ordered (and is not limited to ranking social groups like SDO), as dominance hierarchies over nonhuman entities like nature have also been found to predict environmental beliefs (Jylhä & Akrami, Reference Jylhä and Akrami2015). Participants rated their agreement with five statements that reflect a hierarchical worldview (e.g., “Most things can be organized into hierarchies, rankings, or pecking orders that reflect true differences among things.”), using a 6-point scale (endpoints: 1 = strongly disagree, 6 = strongly agree). We recoded reverse-worded items and formed a mean composite (α = .74) where a higher score indicated a more hierarchical worldview.
Related to beliefs about inequality and hierarchy are views about the world being a more competitive rather than cooperative place. We chose this measure because part of endorsing social hierarchies may include holding a general view of the world as being a competitive place (Duckitt & Sibley, Reference Duckitt and Sibley2010). To measure this, participants completed the cooperative subscale from the Primals Inventory (Clifton et al., Reference Clifton, Baker, Park, Yaden, Clifton, Terni, Miller, Zeng, Giorgi, Schwartz and Seligman2019). This subscale consists of four items about cooperation (e.g., “For all life—from the smallest organisms, to plants, animals, and for people too—everything is a cut-throat competition.”) that people rate their agreement with using the same 6-point scale as with the hierarchical subscale. Because we were primarily interested in competition, we deviated from the original inventory scoring by coding items to form a mean composite (α = .71), where a higher score indicated a more competitive (hierarchical) rather than cooperative worldview.
Status quo defensive worldviews
We decided to represent status quo defense by measuring system justification, fair market ideology, and just world beliefs.
System justification
To measure people’s defense of current societal systems, participants completed a short-form, 8-item measure of system justification (Kay & Jost, Reference Kay and Jost2003). They indicated on a 9-point scale (endpoints: 1 = strongly disagree, 9 = strongly agree) their agreement with statements that reflect status quo society as fair (e.g., “In general, I find society to be fair.”). Items were coded and composited such that a higher score on the resulting mean composite (α = .82) reflected greater justification (defensiveness) of current societal systems.
Fair market ideology
To measure people’s defense of status quo market systems, participants filled out a measure of fair market ideology (Jost et al., Reference Jost, Blount, Pfeffer and Hunyady2003). We chose this measure because, ostensibly, people interested in preserving free markets may be less interested in supporting government interventions to reduce disaster and climate impacts (as these regulations or acts might hinder free market activity). Participants rated their agreement with 15 statements that endorse capitalism (i.e., “free markets”) as a fair system (e.g., “The most fair economic system is a market system in which everyone is allowed to independently pursue their own economic interests.”) using a 11-point scale (endpoints: –5 = completely disagree, 5 = completely agree). We coded items such that a higher score on the resulting mean composite (α = .81) reflected greater endorsement of status quo free market systems.
Just world beliefs
To measure people’s general beliefs about outcomes being deserved, which should correlate moderately with defensiveness of status quo systems, participants completed a just worlds belief measure (Lucas et al., Reference Lucas, Zhdanova and Alexander2011). Participants rated their agreement with statements that depict the world as a fair place (e.g., “I feel that people generally earn the rewards and punishments that they get in this world.”) using a 7-point scale (endpoints: 1 = strongly disagree, 5 = strongly agree). A higher score on the resulting mean composite (α = .91) indicated more belief that the world is fair.
Empathy
We measured empathy via two facets, empathic concern and perspective taking, using subscales of the Interpersonal Reactivity Index (Davis, Reference Davis1983). Participants rated how well each statement describes them using a 5-point scale (endpoints: 1 = does not describe me well, 5 = describes me well). Statements assessed people’s concern for and ability to identify with others (e.g., “I often have tender, concerned feelings for people less fortunate than me”; “Before criticizing somebody, I try to imagine how I would feel if I were in their place.”). Higher scores on the resulting mean composites (concern [α = .78], perspective taking [α = .78]) reflected greater empathy.
Disaster risk accumulation
Here, we conceptualized disaster risk accumulation as (1) holding reduced belief or disbelief that anthropogenic factors increase disaster risk, and (2) negating interventions to reduce these human-made risk factors (see e.g., Colvin et al., Reference Colvin, Prokosch, von Meding, Chmutina and Smith2022). People vary in how much they endorse human-made contributors to disaster risk, such as unequal resource distribution. We measured the extent to which people blame human contributors to disasters by asking participants to rate their agreement with three items (e.g., “Too many people politicize disasters, when really it is nobody’s fault.”) using a 7-point scale (endpoints: 1 = strongly disagree, 7 = strongly agree; α = .64).
Another component of disaster risk involves people’s willingness to intervene to mitigate the human factors that impact disaster outcomes (e.g., increasing services to help disaster-vulnerable demographics in advance of a hazard). We assessed this by asking people to rate their agreement with five statements that reflect the view that social interventions can reduce disaster risk (e.g., “Social spending is a good way to reduce disaster impacts.”) using the same 7-point scale (α = .76).
Exploratory measure of climate beliefs
Participants completed five items on climate change beliefs taken from Heath and Gifford (Reference Heath and Gifford2006). Participants indicated their agreement using a 5-point scale (endpoints: 1 = strongly disagree, 5 = strongly agree) on statements that indicate (a) that climate change is occurring (e.g., “I have already noticed some signs of global warming.”). Items were recoded such that higher scores on the resulting mean composite indicated a greater belief that climate change is occurring (α = .90).
Proposed analyses
The analytic plan was registered and completed as follows: First during cleaning, we excluded data from participants who did not complete the full survey. We also ran reliability analyses on each scale composite that we created to check that each indicator scale met minimally acceptable reliability criteria (e.g., scores a Cronbach’s α < .60). After cleaning, we ran zero-order correlations to examine the relationships between formidability, worldviews, empathy, and disaster risk accumulation. All sets of variables for our model passed collinearity checks (r < .70, VIFs < 2).
We used structural equation modeling with maximum likelihood (ML) estimation in MPlus (Muthén & Muthén, Reference Muthén and Muthén2017) to fit our proposed analytic model (see Figure 2) in two separate ways: (1) on the full sample and (2) separately within men and women each. Fit statistics were used to evaluate model fit (e.g., nonsignificant chi square, RMSEA < .05, SRMR < .08, CFI > .95), with chi square difference testing used to compare nested models. Model indices were used to judge any potential deviations from the analytic model that significantly improve model fit. Bootstrapping was used to examine indirect and direct effects in our full, parallel mediation model (see, e.g., Cheung & Lau, Reference Cheung and Lau2008). Deviations from the planned model due to collinearity, convergence issues, or major fit improvement are clearly identified in the reported results. Results of the exploratory analysis on climate change beliefs as the outcome instead of disaster risk are summarized in brief and detailed only in the Supplementary Materials. Exploratory analyses that investigate time spent weightlifting and body mass index (BMI) as covariates are reported in the Supplementary Materials. All p-values reported reflect two-tailed tests.
Completed focal analyses
We first describe the results of zero-order correlations between the focal and exploratory variables in the data set. These relationships are visualized for the full data set (Table 2) and split by gender (Table 3). Data, syntax, and code can be accessed at https://osf.io/jk7qd/.
Zero-order correlations between Study 1 variables.

* p < .05; ** p ≤ .01; *** p ≤ .001.
Study 1, zero-order correlations by gender.

Note: Correlations for men are to the bottom left of the diagonal, while women are to the top right.
* p < .05; ** p ≤ .01; *** p ≤ .001.
Correlations
Across the full data set, formidability had small but significant relationships with disaster and environmental beliefs. More formidable individuals tended to assign more blame to chance (nonhuman) causes of disasters (r = .11), express lesser belief that social interventions can reduce disaster risk (r = –.09), and report lesser belief that climate change is occurring (r = –.11). Formidability was also modestly associated with hierarchical worldviews such that highly formidable people tended to endorse greater social (r = .17) and nonsocial inequality (r = .10). Contrary to our expectations, formidability was not related to a competitive worldview. It was, however, related to system justifying worldviews, such that more formidable people tended to endorse just world beliefs, justify fair markets, and justify existing socioeconomic systems (.18 ≤ rs ≤ .20). Formidability had a small negative relationship to empathic concern (r = –.12) but not empathic perspective taking. Results split by gender suggest that the relationships between formidability, worldviews, empathy, and disaster were primarily driven by the men in our sample: effect sizes within men were still small but larger than in the full data (rs ≥ .13). Within women, formidability was weakly related to nonsocial hierarchy beliefs, belief in a just world, and fair market ideology (rs ≥ .07).
Disaster beliefs were moderately correlated with environmental beliefs, had small to moderate correlations with hierarchical worldviews, moderately correlated with status quo maintaining beliefs, and had small correlations with empathy. People who expressed more hierarchical, status quo maintaining beliefs, and lower amounts of either empathy facet tended to assign lesser blame to human causes of disaster, express lesser belief that social interventions could reduce disaster risk, and lesser belief that climate change is occurring. Results split by gender suggest that a similar pattern and strength of relationships existed for these variables across both men and women.
Relationships within each of our indicators of hierarchical worldviews, status quo maintaining beliefs, and empathy, and between each class of indicators ranged from small to large. Hierarchical worldviews were related to more status quo maintenance and lower empathy, and greater status quo maintenance was also related to lower empathy. Results suggested that the relationships between each hierarchical worldviews and status quo worldviews with empathy were of similar effect size (small to large) but slightly stronger in magnitude for men than women. Results of exploratory partial correlations controlling for BMI, time spent weight training, age, political orientation, and residence (U.S. versus non-U.S.) are described in the Supplementary Materials but do not substantially change the pattern of results described here.
Structural equation model building
We fit the hypothesized analytic model to our data in three sequential steps, using MPlus statistical software. Table 3 depicts the model fit statistics. Any deviations from the hypothesized model are described in the “deviations” section below.
First, in line with standard recommendations for fitting structural regression (S-R) models (see, e.g., Kline, Reference Kline2016), we fit the structural portion of the model by conducting a confirmatory factor analysis (CFA) on our hypothesized latent variables. The final CFA model demonstrated good fit across our sample, suggesting that the overall hypothesized structure of our latent variables fit across the full sample (see Table 4). Second, we added the hypothesized regression pathways to fit the full structural regression model on the entire sample. R 2 estimates of the final model for this step revealed that it explained 67.9% of variance in disaster risk beliefs. Third, we used the grouping variable option in MPlus to examine the model within men and women. The final multigroup model accounted for 71.6% of variance in women’s and 66.7% of variance in men’s disaster risk beliefs.
Study 1 model fit statistics.

Deviations made during model building
During model building, the following steps were taken to improve model fit, based upon model indices suggestions and theory: First, while fitting the CFA, we allowed the error variances for the primal world belief competition and hierarchy subscales to correlate, as the scales were validated together as part of the Primals Inventory (Clifton et al., Reference Clifton, Baker, Park, Yaden, Clifton, Terni, Miller, Zeng, Giorgi, Schwartz and Seligman2019). While fitting the full S-R model, we allowed our latent variable errors for hierarchical worldviews, status quo defense, and empathy to correlate, and for system justification to correlate with hierarchy and competitive worldviews. We chose to follow these suggested modifications as past research suggests these mediating variables are interrelated and could reasonably share common error variance (see, e.g., Colvin et al., Reference Colvin, Prokosch, von Meding, Chmutina and Smith2022; Hudson et al., Reference Hudson, Cikara and Sidanius2019; Jylhä & Akrami., Reference Jylhä and Akrami2015). Notably, although SDO explained most of the variance in our latent variable for hierarchical worldviews, models replacing the latent variable of hierarchical worldviews with a single indicator composite of SDO were a poorer fit compared to models retaining our originally hypothesized latent variable of hierarchical worldviews. Thus, we elected to retain the full latent variable to be more conservative to our initially proposed model, rather than trimming items or restructuring the model. We were able to use our planned estimator (ML) as missing data was not a problem because we retained 98.7% or more data for each of our focal variables.
Model interpretation
Next, we describe the unstandardized paths and tests for statistical mediation for first the full group model and for each gender. The full models (including factor loadings) are visualized in Supplementary Figure 1 and Figure 3.
Study 1 analytical model fit within men and women. Standardized estimates and values are depicted here. * p < .05; ** p ≤ .01; *** p ≤ .001.

Full sample
Results revealed that across the full sample, greater self-perceived formidability predicted more hierarchical worldviews: b = .05 (SE = .01), p = .002, 95% CI [.02, .08]; more status quo defense: b = .37 (SE = .04), p < .001, 95% CI [.29, .45]; and lower empathy: b = –.16 (SE = .04), p < .001, 95% CI [–.23, –.08]. Hierarchical worldviews predicted beliefs about disaster risk accumulation such that people who reported more hierarchical worldviews were less likely to endorse the belief that social interventions can reduce disaster risk or to blame human causes of disasters, b = –4.04 (SE = 1.91), p = .035, 95% CI [–8.92, –2.22]. A similar pattern emerged for status quo defense, where those who reported more defense of current systems also reported lesser blame for and belief in social determinants of disaster risk, b = –.37 (SE = .09), p < .001, 95% CI [–.52, -.16]. Empathy did not predict disaster beliefs, b = –.14 (SE = .09), p = .13, 95% CI [–.36, –.001].
We next evaluated statistical mediation by examining the total, indirect, and direct effects. The direct effect of self-perceived formidability on disaster beliefs was not significant, b = .06 (SE = .04), p = .18, 95% CI [–.03, .15]. The total effect, b = –.24 (SE = .05), p < .001, 95% CI [–.33, –.14], and total indirect effects, b = –.30 (SE = .04), p < .001, 95% CI [–.38, –.23] were each significant, suggesting that the relationship between self-perceived formidability and disaster beliefs was fully statistically mediated (see, e.g., Rucker et al., Reference Rucker, Preacher, Tormala and Petty2011). The specific indirect effects from self-perceived formidability via hierarchical worldviews, b = –.18 (SE = .06), p < .001, 95% CI [–.33, –.10], and status quo defense, b = –.14 (SE = .04), p < .001, 95% CI [–.21, –.06], were significant. The specific indirect effect of self-perceived formidability on disaster beliefs via empathy was not significant, b = .02 (SE = .04), p = .18, 95% CI [–.03, .15].
Model within men
Self-perceived formidability predicted hierarchical worldviews, system quo defense, and empathy, where men who reported greater formidability expressed more hierarchical worldviews, b = .06 (SE = .02), p = .003, 95% CI [.03, .11]; more status quo defense, b = .49 (SE = .06), p < .001, 95% CI [.38, .60]; and lesser empathy, b = –.16 (SE = .05), p = .003; 95% CI [–.27, –.06]. Greater hierarchical worldviews, b = –4.08 (SE = 2.30), p = .076, 95% CI [–9.52, –1.83], and more status quo defense, b = –.34 (SE = .11), p = .003, 95% CI [–.51, –.09], each predicted less blame on human causes of disaster and less belief that social interventions can reduce disaster risk. Empathy did not predict disaster risk beliefs, b = –.07 (SE = .15), p = .66, 95% CI [–.39, .15].
The total effect, b = –.35 (SE = .07), p < .001, 95% CI [–.49, –.22] was significant; but the direct effect of self-perceived formidability on disaster beliefs was not significant, b = .04 (SE = .07), p = .53, 95% CI [–.09, .18]. An examination revealed significant indirect effects via hierarchical worldviews, b = –.24 (SE = .10), p = .02, 95% CI [–.49, –.11], and status quo defense, b = –.16 (SE = .06), p = .006, 95% CI [–.27, –.05]. The specific indirect effect via empathy was not significant, b = .01 (SE = .02), p = .66, 95% CI [–.02, .07].
Model within women
There was a significant relationship between self-perceived formidability and system defense, where women who reported greater self-perceived formidability expressed greater status quo defense, b = .14 (SE = .06), p = .01, 95% CI [.03, .25]. In turn, women who expressed greater status quo defense placed less blame on human causes of disaster and expressed less belief that social interventions can reduce disaster risk, b = –.51 (SE = .19), p = .007, 95% CI [–.75, –.10]. The relationships between self-perceived formidability and hierarchical worldviews, between formidability and empathy, between hierarchical worldviews and disaster beliefs, and between empathy and disaster beliefs were not significant. There was no significant total effect; thus, we did not further pursue mediation tests.
Exploratory model with climate change beliefs
The results of our model suggested a similar pattern of relationships between self-perceived formidability, worldview, status quo defense, empathy, and climate change as found in our focal analyses (see the Supplementary Materials for full write-up and model visualizations). Across our entire sample, highly formidable people reported more hierarchical worldviews and expressed greater status quo defense and lesser empathy (Supplementary Figure 2). However, only hierarchical worldviews and status quo defense predicted climate change beliefs. People with a more hierarchical worldview and status quo defensiveness reported lesser belief that climate change is occurring. The relationship between self-perceived formidability and climate change beliefs was completely mediated by worldview and status quo defense. Analyzing men and women separately revealed that the pattern of effects described earlier was primarily driven by men (Supplementary Figure 3). Among women, the only significant pathway was an indirect effect of formidability on climate change beliefs via status quo defense, such that more formidable women tended to express greater defense of current systems and express lesser belief in climate change.
Study 2: Does objectively measured formidability predict worldviews, empathy, and disaster risk accumulation?
Method
Participants
Participants were men and women from the psychology subject pool at a large, public university in the southeastern United States. Psychology pool participants participated in exchange for partial course credit. We supplemented our data collection in the spring 2022 semester by also inviting members of the broader university community (aged 18–30 to match the typical study age range) to complete our study for a nominal payment ($10 gift card). Data collection is ongoing as of the publication date.
The planned analytic model contained 14 observed variables and 5 latent variables (see Figure 2). A power analysis with this level of model complexity and a probability level of .05 specified suggested that a minimum of 232 participants’ data would be needed to adequately power (β = .80) tests of model structure. After a review of the literature, we decided a smallest effect size of interest would be around r = .25 (see Petersen & Laustsen, Reference Petersen and Laustsen2019; Price et al., Reference Price, Sheehy-Skeffington, Sidnaius and Pound2017). Power analyses suggested that we should collect a minimum of 229 participants’ data to adequately power (β = .80) tests to detect this effect. As it was deemed unlikely at the time of Stage 1 submission that we would be able to double that number for data collection (N = 458) within one semester to allow for ideal invariance testing conditions, we aimed to collect a minimum of 300 participants and a maximum of 350 participants. It was registered that analyses would not be conducted on the data until the final subject data collection date had passed and at least 300 participants had provided data.
Sample deviation and publication sample characteristics
At the time of press, we had finished collecting 206 out of our proposed final minimum sample size of 300. Because of recruitment difficulties, we expanded the maximum age from 30 to 40 (two people were removed from the final sample for being older than 40). Further, four participants reported nonbinary gender and were excluded from the data set, as this was not a large enough subsample to standardize and run analyses on at the time of publication. An additional two people did not finish the survey and give consent to retain their data. Thus, we ended up with 200 participants’ final data. Because the sample fell short of adequate power to test model structure or the smallest effect size of interest, we were encouraged during review to conduct and report preliminary analyses for this study and then post updated analyses at study completion. Data collection is still ongoing. Results will be reported according to the proposed analyses and linked to the current registration (http://osf.io/nwvp3) upon completion.
See Table 5 for descriptive characteristics of our sample at the time of publication. At the time of publication, our sample was predominantly psychology subject pool students (71.5%; 28.5% paid nonpool participants), almost gender balanced (51% men, 49% women), and predominantly people from the United States (81%). The sample was mostly White (63.5%) with the rest of participants reporting an ethnic identity that was Hispanic (24.0%); Black (10.0%); Asian (18.0%); Native American, Alaska Native, or Pacific Islander (1.5%); multiracial (5.5%), or other (1.5%) racial identity. One-way ANOVAs (ps < .001) revealed that men scored higher on all raw measures of formidability, reported more time weight training, and reported a more conservative political orientation than women in the current sample.
Publication sample characteristics for Study 2.

Note: Descriptives are for sample used at the time of publication and are subject to change as data collection finishes.
Descriptive statistics for unstandardized formidability measures are reported here for greater ease of interpretation.
Procedure and materials
Upon consenting to participate, a research assistant guided men and women through the physical formidability measures. The research assistant measured participants’ flexed bicep, shoulder, and chest (men only) circumferences and took handgrip and chest strength measures using a dynamometer (see Price et al., Reference Price, Sheehy-Skeffington, Sidnaius and Pound2017). Participants completed a brief two-item measure of self-perceived formidability (Kerry & Murray, Reference Kerry and Murray2019). They next answered questionnaires examining hierarchical worldviews, status quo defensiveness, empathy, disaster risk accumulation, and climate change beliefs. Participants finished by reporting relevant demographic data such as their age, gender, time spent exercising, and political orientation with higher scores indicating greater conservatism. Participants were not offered feedback about any of their physical formidability measures until the end of the study (post-debriefing). If participants directly asked or commented about their performance on the physical measures prior to study completion, the research assistant informed the participant that they were not able to offer any feedback yet.
Formidability
Participants were instructed to attend sessions wearing a thin base layer (e.g., T-shirt) with any outer layers (e.g., jacket, sweaters) being easily removable. While collecting all anthropometric measures of formidability, we asked participants to remove their outer layers of clothing.
Anthropometric measures
First, participants removed their shoes and any heavy items in pockets, and the research assistant measured their height and weight on a stadiometer scale (in centimeters and kilograms—metric measurements were used to minimize potential participant discomfort from viewing their weight, as the majority of participants were American and acclimated to imperial measurements). We calculated BMI from these measurements, to be considered as a covariate.
Men’s chest and shoulders were measured at the fullest circumference (chest measurement across the shoulder blades). Women only had their shoulder circumference measured (to avoid discomfort from chest measurement). During shoulder and chest measurement, participants stood with arms relaxed. Next, the research assistant measured men’s and women’s bicep circumference at the widest point of the flexed bicep on the participant’s dominant arm. Participants’ measurements were standardized (z-scored) within their reported gender and then averaged to form a mean bodily formidability composite. A higher score represented greater (body measurement represented) formidability within one’s gender (reliability for standardized items: .88 < αs < .92).
Strength test
The research assistant instructed participants on how to complete the strength test portion of our formidability assessment. Participants first held a digital dynamometer (Camry, Hong Kong) in their dominant hand and squeezed as hard as possible for 2 seconds to measure grip strength. Following this, participants held the dynamometer in front of their chest, pressing inward with both hands as hard as they possibly could for 2 seconds to measure chest strength. To minimize measurement noise from differences in participants initially acclimating to the dynamometer, we gave participants two trials each for handgrip and chest strength, with a short rest in between trials. The research assistant recorded the highest dynamometer score (kilograms of pressure) for each handgrip and chest strength measurement (see, e.g., Kerry & Murray, Reference Kerry and Murray2018, Reference Kerry and Murray2019). Unstandardized chest and handgrip scores were strongly positively related (r = .62) Participants’ handgrip and chest strength measurements were each standardized within gender, with a higher score indicating greater relative strength compared to other members of one’s gender.
Brief self-perceived formidability
Participants rated their (1) fighting ability and (2) physical strength, each on a scale of 1–100 (with 100 being the most formidable). We standardized scores for each of these ratings within gender and then average to form a mean self-perceived formidability composite (α = .76).
Hierarchical worldviews
Participants completed the same measures of Social Dominance Orientation (α = .92), primal world beliefs hierarchy (α = .83), and competition (α = .82) subscales that were used in Study 1. These measures were coded in the same way as in Study 1.
Status quo defensive worldviews
We represented status quo defensive worldviews by asking participants to complete the same system justification (α = .82), fair market ideology (α = .82), and just world belief (α = .89) measured as in Study 1.
Empathy
We measured empathy using the same empathic concern (α = .86) and perspective taking (α = .74) subscales of the Interpersonal Reactivity Index used in Study 1.
Disaster risk accumulation
Participants completed the same measures of disaster blame (α = .60) and social disaster intervention (α = .72) as in Study 1.
Exploratory measure of climate beliefs
Participants completed an expanded version of the climate change beliefs measure used in Study 1 (Heath & Gifford, Reference Heath and Gifford2006). Items are recoded such that higher scores on the resulting mean composites for climate change endorsement, belief in human-made climate change, and belief in negative consequences will indicate that more belief in negative, human-made climate change is occurring.
Proposed analyses
The following analyses were registered and completed as follows (please note that the current publication sample is preliminary and these analyses will be conducted and reported again on the full final sample): During cleaning, we excluded the data from participants who did not complete the full survey measures (N = 1) or who did not consent for their data to be retained (N = 1). Next, we ran reliability and collinearity statistics. All measures passed these basic checks (α ≥ .60, focal predictor measure rs < .70, VIFs < 2). We next ran zero-order correlations to examine the relationships between formidability, worldviews, empathy, and disaster risk accumulation. We next used structural equation modeling to fit our proposed analytic model (see Figure 4) in the full sample, and within men and women each. As an exploratory analysis, we also examined the model with climate change beliefs represented as an endogenous latent variable. All p-values reported reflect two-tailed tests.
Analytical model for lab study. Squares represent survey scale composites (observed variables), while circles denote latent variables. Black arrows represent scale factor loadings onto latent variables, while blue arrows represent regression pathways.
A note on deviation from planned collection and interpretation of results
At the time of publication, sensitivity analyses conducted using G*Power (Faul et al., Reference Faul, Erdfelder, Lang and Buchner2007) suggested that for the zero-order correlations, we were powered (B = .80, α = .95) to detect small to moderate correlations of r ≥ .195 in the full sample (N = 200), r ≥ .27 within men (N = 102) and r ≥ .275 within women. We were underpowered for all planned tests of model structure and parameter effect sizes for the planned structural equation model. Therefore, all reliability statistics, correlations, and structural equation model results as currently reported should be viewed as preliminary and interpreted with caution. Please refer to the updated analyses and interpretation on OSF (estimated completion in spring 2023) for more conclusive inferences.
Completed focal analyses
We first describe the results of zero-order correlations between the focal and exploratory variables in the data set. These relationships are visualized for the full data set (Table 6) and split by gender (Table 7). Data, syntax, and code can be accessed at https://osf.io/bwsgp/.
Zero-order correlations between Study 2 variables in publication sample.

* p < .05; ** p ≤ .01; *** p ≤ .001.
Zero-order correlations between Study 2 variables by gender in publication sample.

Note: Correlations for men are to the bottom left of the diagonal, while women are to the top right.
* p < .05; ** p ≤ .01; *** p ≤ .001.
Focal correlations
In the whole sample, the formidability measures (body measurements, hand strength, chest strength, self-perceived formidability) were all positively related to one another—effect sizes ranged from small (r = .18) to medium-large (r = .45). All were also positively related to time spent weight training and overall BMI. Some of the formidability measures (e.g., self-perceived formidability) and formidability-related covariates (e.g., time spent weight training) were associated with lesser belief that social factors shape disaster risk. Only weight training was associated with disaster blame (i.e., people who spend more time weight training tended to assign lesser disaster blame to human factors). The effect sizes for the relationships between disaster views and formidability were below what a sensitivity analysis reported that we are powered to detect, so these interpretations should be viewed as preliminary and taken with caution.
Self-perceived formidability and time spent weight training were associated with greater SDO, while handgrip strength was associated with more hierarchical views (on the Primals measures). More self-perceived formidability and time spent weight training were associated with greater belief in a just world, fair market endorsement, and system justification. Handgrip and chest strength were associated with greater system justification, while chest strength was also associated with greater belief in a just world. Handgrip strength and time spent weight training were associated with lesser perspective taking while weight training was also associated with lesser empathic concern. Bodily measurements of formidability were not meaningfully associated with worldviews or empathy. Like the relationships between formidability and disaster views, some of the effect sizes of the relationships between formidability, worldviews, and empathy fell below our sensitivity threshold. Firmer conclusions will be reported after data collection is complete.
Greater SDO was associated with lesser blame on human factors and lesser belief that social interventions can impact disaster risk. The Primals measures were not consistently related to disaster views. Belief in a just world, fair market endorsement, and system justification were all related to disaster views, such that greater defensiveness of existing socioeconomic systems was related to lesser blame on human factors in disasters and lesser belief that social interventions can reduce disaster risk. Empathic concern was associated with greater belief that social interventions can reduce disaster risk.
Examining correlations within gender, formidability more consistently related to men’s worldviews, though some facets of formidability (e.g., self-perceived formidability) were related to system defense within women, too. The relations between worldviews, system defense, empathy, and disaster views were relatively similar between men and women. Comparisons can be more aptly made after the full sample is collected.
Exploratory correlations
Self-perceived formidability, handgrip strength, and time spent weight training were all associated with environmental beliefs—specifically, those who scored higher in formidability across the above measures tended to report more skepticism that climate change is occurring, less belief that climate fluctuations are caused by human activity, and less belief that climate fluctuations will produce negative consequences.
Facets of disaster views and our environmental beliefs inventory were related, such that there was a general pattern where people who reported assigning lesser blame for human factors in disasters and less belief that social interventions can reduce disaster risk also tended to report lesser belief in climate change, lesser belief that humans impact climate change, lesser belief that individuals’ actions can impact climate, lesser intention to engage in climate protective activities, and lesser belief that climate change will bring negative consequences. The effect sizes of these relationships ranged from subsensitivity analysis threshold to moderate. Examinations within gender suggest that formidability is more consistently related to environmental beliefs in men than women, though the current results should be interpreted with caution.
SDO, belief in a just world, fair market endorsement, and system justification were related to each of our climate change measures, such that greater social dominance or greater system defense were associated with skepticism about climate change, human contributions to climate change, self-efficacy, self-intention to act environmentally, and less belief in negative consequences of climate change. Perspective taking and empathic concern were each related with more climate change belief, belief in human contributions to climate change, self-intention to act environmentally (and belief it would work), and belief that climate change will produce negative consequences.
We will conduct, interpret, and report exploratory analyses with our predicted covariates (e.g., weight training, BMI, political orientation) after data collection is complete and the study is well powered.
Structural equation model building
First, in line with standard recommendations for fitting structural regression (S-R) models (see, e.g., Kline, Reference Kline2016), we fit the structural portion of the model by conducting a CFA on our hypothesized latent variables. The final CFA model demonstrated good fit across our sample, suggesting that after deviations reported here, the structure of our latent variables fit across the full sample (see Table 8). Second, we added the hypothesized regression pathways to fit the full structural regression model on the entire sample. However, we could not obtain model fit aligning with our goal cutoffs for great model fit in either the whole group sample, or in a multigroup sample comparing within genders. That is, there were not any theoretically sound model indices suggested by MPlus available to improve our model beyond the final fit reported in Table 8. Given the incomplete stage of data collection, we elected not to make any further changes to the hypothesized model structure, beyond the deviations reported here.
Study 2 structural equation model fit statistics.

Deviations made during model building
During the CFA building stage, SDO showed significant cross-loading with our latent factor of status quo defensiveness. Given that defense of existing social hierarchies is not completely distinct from status, we allowed SDO to load on the status quo defensiveness factor instead of hierarchical worldviews. Empathic concern correlated meaningfully with residual variance on the status quo defense latent variable; thus, we allowed them to correlate in our adjusted model. Following this, perspective taking and Primals competitiveness were removed from the model, leaving Primals hierarchy and empathic concern as individual outcomes and predictors in the model (rather than each construct loading onto larger latent variables). Finally, we allowed measurement error between the body measurements and chest strength to correlate with one another. Given the low power of the current sample, is possible that the model on the final full sample will be able to achieve a better fit to the data (Wang & Rhemtulla, Reference Wang and Rhemtulla2021). It might closer approximate the original hypothesized model than the current models but cannot be stated for certain as we do not have the power to firmly reject the currently poor fitting models as misspecified.
Model interpretation
As we could not build a stable whole group or multigroup structural regression (S-R) model approximating our hypothetical model that passed model fit criteria, we declined to interpret individual parameter estimates, in line with standard guidelines for interpreting S-R models (see, e.g., Kline, Reference Kline2016).
Exploratory analyses on climate change
We could not build a good-fitting CFA model and thus abandoned further analyses of these variables until more data are collected.
General discussion
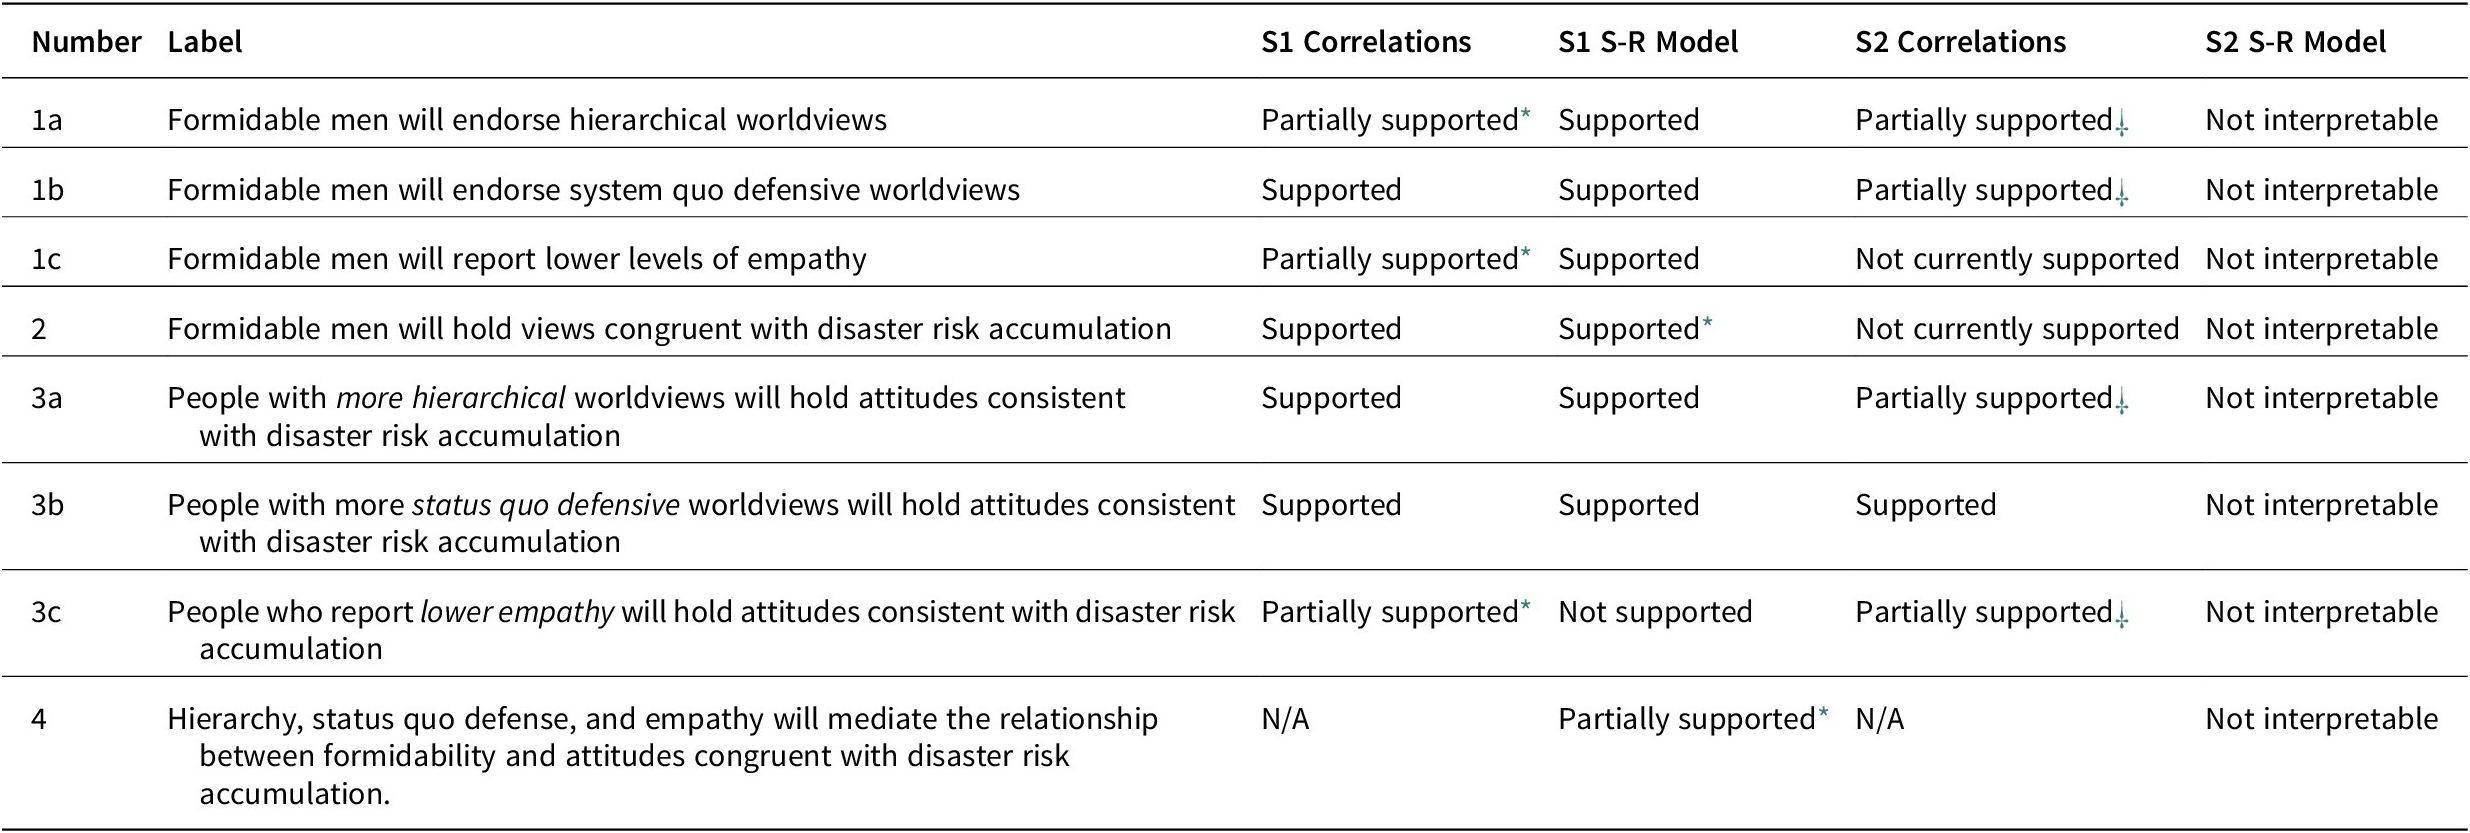
The current work was designed to examine the relationships between physical formidability and beliefs about disasters and the environment, while also examining the potential mediating roles of empathy and views about hierarchies and existing socioeconomic systems. The results of Study 1 found that small but significant relationships exist between formidability and each of our registered mediating and dependent variables. The direction of these relationships mostly supported our initial hypotheses that formidability would relate to more rigid, defensive, and less empathetic worldviews, lesser endorsement of human-made contributors to disasters, and greater climate change skepticism (see Table 5 and Table 9). Preliminary results of Study 2 broadly replicate the relationship between self-perceived formidability, disaster beliefs, and climate beliefs, though effects are small (some below the sensitivity analysis threshold).
Summary of support for registered hypotheses.
* 1a: Significant correlations with two of three scales in Study 1.
* 1c: Significant correlations with one of two subscales in Study 1.
* 2: Significant total effect, though direct effect is not significant in Study 1.
* 3c: Three of four possible subscale correlations were significant in Study 1
* 4: Hierarchy and status quo defense mediate the relationship in the full sample and men, but not in women in Study 1. Empathy is not a significant mediator for any of the sample.
⸸ 1a: Self-perceived formidability, weight training, and, in some cases. Handgrip were significant in Study 2.
⸸ 1b: Self-perceived formidability and weight training; mixed support for handgrip and chest strength in Study 2.
⸸ 3a, 3c: Limited current support for social dominance orientation, empathic concern, and social intervention beliefs.
Of note, results related to formidability were primarily driven by male participants in Study 1. However, status quo defensive worldviews were also related to views about disasters and the environment in women and men across both studies. Taken together, the focal results suggest that people (especially men) who report being more formidable—an ancestrally beneficial trait for status—report stronger preferences may hold views aimed at preserving the status quo and especially competition-based social systems (e.g., free markets). As noted previously, patterns for women were directionally consistent but weaker. This conceptually mimics patterns of previous studies examining physical formidability as a predictor of other traits, which have typically found effects of formidability that are stronger in or unique to men (see, e.g., Krems et al., Reference Krems, Merrie, Short, Duarte, Rodriguez, French, Sznycer and Byrd-Craven2022; Petersen & Laustsen, Reference Petersen and Laustsen2019). However, past research has also found formidability to be a significant mediator of sex differences in some traits, like anxiety (see, e.g., Kerry & Murray, Reference Kerry and Murray2021; Manson et al., Reference Manson, Chua, Rodriguez, Barlev, Durkee and Lukaszewski2022). Such research has examined physical markers of formidability (e.g., handgrip strength); we have yet to examine thoroughly whether effects found for self-perceived formidability in Study 1 will extend to physical measures or differ in meaningful ways. For example, it is possible that sex differences in preferences for hierarchical social structures (see, e.g., Sidanius et al., Reference Sidanius, Pratto and Bobo1994) are mediated by actual differences in physical strength.
Current results of Study 2 provide evidence that handgrip and chest grip may predict some worldviews (and potentially climate and disaster views) but should be treated with caution until a larger sample is collected. It is also possible in this case that rather than formidability, other traits more ancestrally important to women’s social status (e.g., physical attractiveness; Krems et al., Reference Krems, Merrie, Short, Duarte, Rodriguez, French, Sznycer and Byrd-Craven2022; wealth) might be more predictive of beliefs that preserve unequal social systems benefiting high-status individuals and in turn, environmental beliefs. Proximately, it is possible that men’s greater motivation to maintain existing hierarchies and resources (than women) may shape climate skepticism and reluctance to socially intervene to mitigate disaster risk via other mediating processes like loss aversion or perceived cost (and resistance) to social change (see, e.g., Bush & Clayton, Reference Bush and Clayton2022).
Our results also replicate and conceptually extend past work suggesting that people with a vested interest in preserving existing systems tend to be more skeptical of existential threats to system stability like climate change and climate-related disasters (see, e.g., Colvin et al., Reference Colvin, Prokosch, von Meding, Chmutina and Smith2022; Feygina et al., Reference Feygina, Jost and Goldsmith2010; Heath & Gifford, Reference Heath and Gifford2006). The results also support broad efforts in disaster scholarship to demonstrate that disaster risk is differentially constructed due to sociopolitical formations, such as racial capitalism (Jacobs, Reference Jacobs2021). Proponents of the “vulnerability paradigm” have long argued that inequality, injustice, and oppression is the foundation of disaster risk (Blaikie et al., Reference Blaikie, Cannon, Davis and Wisner1994). This reality, borne out in decades of disaster and hazard data, often underpins a politics of resistance to the status quo. It follows that many disaster scholars argue that all disasters are political.
A notable exception to the broad pattern of support for our initial predictions were the results surrounding empathy. While self-perceived formidability related to lesser empathic concern in men, it did not relate to empathic concern in women or perspective taking in either gender in Study 1. Preliminary results of Study 2 have also yielded little evidence for a relationship between formidability and empathy. Further, empathy did not significantly relate to disaster or climate change beliefs in either of our structural equation models in Study 1—that is, our results failed to conceptually replicate past work on emotional responsiveness and climate change beliefs (Arnocky & Stroink, Reference Arnocky and Stroink2010; Jylhä & Akrami, Reference Jylhä and Akrami2015). It is possible that our measures of empathy, disaster beliefs, and climate change beliefs were too general to capture meaningful nuance in the relationship between formidability, empathy, and environmental beliefs. For example, it is possible that targeted empathy toward specific groups of humans (e.g., like marginalized social out-groups) and nonhumans (e.g., animals, plant ecosystems) that are seen as especially vulnerable to potential disasters or climate change may be more predictive of disaster and climate beliefs than people’s general, trait empathy (see, e.g., Jylhä & Akrami, Reference Jylhä and Akrami2015; Jylhä et al., Reference Jylhä and Akrami2015; Jylhä et al., Reference Jylhä, Tam and Milfont2021). Another (more hopeful) possibility is that it is not a lack of empathy that causes individuals to reject disaster risk reduction measures rooted in ameliorating oppressive social conditions, but beliefs about society that limit the understanding of disaster risk, to which it appears that formidable men have a greater attraction.
Limitations and future directions
We have primarily discussed high formidability as a predictor of worldviews, empathy, and environmental beliefs. However, our current methods do not rule out the potential that men especially low in formidability (or status) might be especially likely to endorse egalitarianism and social change. Future analyses could disentangle these possibilities, for example, by investigating whether the relationship between formidability, worldviews, and environmental beliefs is nonlinear, or through more causal study designs. Additionally, while we have assumed that high formidability connotes higher social status, we have not measured status directly in our work. As past research highlights other factors like prestige (e.g., Durkee et al., Reference Durkee, Lukaszewski and Buss2020) or socioeconomic indicators that may also shape social hierarchies, future work could test status predictors like prestige and wealth, or directly measure subjective social status.
Our choice of variables, though informed by past work on climate and disaster was far from exhaustive. Future data collections should flesh out other potentially valuable constructs relevant to gender, formidability, and environmental beliefs, such as climate anxiety or risk aversion. Of note, however, the existing models did explain substantial variance in beliefs about social influences on disaster risk, and small to moderate amounts of variance in climate change beliefs. Further, we focused here on beliefs surrounding social determinants of disaster risk and social-focused disaster mitigation policies (i.e., social safety nets). We did not explore beliefs surrounding other mitigation strategies, like more individualized (e.g., forming a personal evacuation plan), technocratic (e.g., improving sea-wall construction), or managerial (e.g., novel alert systems) strategies. For example, it is possible that men are more willing than women to promote personally accountable mitigation strategies rather than large-scale social spending or restructuring. It is also possible that people who seek to preserve existing social systems (and stability) might be especially supportive of technocratic strategies or “Band-Aid” solutions that focus on a return to previous stability, while ignoring existing social issues that create disaster risk and vulnerability (see, e.g., Cheek & Chmutina, Reference Cheek and Chmutina2022).
In addition, while a strength of online data collection for Study 1 is that our sample was relatively diverse in terms of country (i.e., 75.6% of participants lived in the United States, but the remaining 24.4% were from 60 different countries) and region of origin, we do not possess the statistical power directly examine how our hypotheses might apply cross-culturally. Future work could investigate how beliefs about disasters and climate change, and the relative influence of formidability, worldview, and empathy on these beliefs, are shaped by local and national level context. Such studies could also examine the influences of specific contextual factors of interest to this work that vary meaningfully across regions and countries (e.g., sociopolitical context, geographic hazard risk, regional climate impacts of warming).
Finally, as we have noted across the latter portion of this manuscript, data collection is still ongoing for Study 2. More data are needed to allow us to assess more confidently whether relatively small relationships between formidability and our other measures are significant. Further, more power is needed to allow us to examine model fit and model parameters in our structural equation models (see, e.g., Wang & Rhemtulla, Reference Wang and Rhemtulla2021). Thus, while the current results lend some insight into the potential relationships between physically measured formidability and our other measures, they should not be treated as exhaustive or decisive.
Conclusion
As environmental issues become increasingly politicized and polarizing, research into individual differences that shape people’s beliefs about disasters, climate change, and relevant sociopolitical systems that may create vulnerability to each represents a crucial first step toward building beliefs and behavior to reduce disaster and climate change impacts. Here, we extended past research by how formidability might shape worldviews, beliefs about existing sociopolitical systems, empathy, and beliefs surrounding disaster risk and climate change. A registered online study revealed that formidability predicts these sets of beliefs in men. Results of an in-lab study were pending at the time of manuscript submission but suggest a broad conceptual replication of relationships between self-perceived formidability, while relationships between physically measured formidability and our other measures are less consistent at present. Further, this work replicates work linking views of existing sociopolitical systems and beliefs about disaster risk accumulation (Colvin et al., Reference Colvin, Prokosch, von Meding, Chmutina and Smith2022). Exploratory analyses suggested that these relationships held even when controlling for time spent weight training, political ideology, locale, and age—third variables that correlate with multiple scales included in this study. Thus, this study provides some initial evidence that individual differences like self-perceived physical formidability (and potentially, physically measured formidability) may shape beliefs about disaster risk accumulation above and beyond existing social narratives of polarization and culture wars.
Author acknowledgments
The authors thank the Association for Politics and the Life Sciences for funding Study 2 of this project. We would also like to thank members of the Attitudes and Political Cognition Lab, the Florida Social Cognition and Emotion Lab, and the Florida Institute for Built Environment Resilience for their helpful feedback during the initial formation of this project. We thank Project Implicit and Dr. Kate Ratliff for providing the virtual and physical spaces needed to conduct each of these studies. We thank lab managers Victoria Colvin and Sara Wolfe, research assistants Carter Pacis, Gabrielle Schienert, Skye Speakman, and Greyson Williams, and future research assistants in the Attitudes and Political Cognition Lab and Social Cognition Across People and Environments Lab for their help with collecting Study 2 data.
Supplementary Materials
To view supplementary material for this article, please visit http://doi.org/10.1017/pls.2022.20.
Data availability statement
This article earned Open Data, Open Materials, and Preregistration badges for open scientific practices. The materials, data, and preregistration that support the findings of this study and the award of these badges are openly available at https://osf.io/nwvp3 and https://osf.io/jk7qd.


 Open access