




Introduction
It is commonly accepted that the species composition of a biological community is driven by multiple mechanisms that act at both evolutionary and ecological scales (e.g. Connor and Simberloff, Reference Connor and Simberloff1979; Chesson, Reference Chesson2000; Kraft and Ackerly, Reference Kraft, Ackerly and Monson2014). The main mechanisms determining species assembly are associated with either (a) the environmental requirements of the species coupled with interspecific interactions (e.g. Ackerly and Cornwell, Reference Ackerly and Cornwell2007) or (b) stochastic speciation/extinction processes and biogeographic histories such as dispersal (e.g. Hubbell, Reference Hubbell2001). An example of the former mechanism is the so-called ‘environmental filtering’ (e.g. van der Valk, Reference van der Valk1981), in which the environment dictates the community composition by permitting it to be composed only of species possessing certain morphological, physiological, behavioural and/or ecological traits that allow a species to tolerate the biotic and abiotic conditions in that environment (e.g. Kraft and Ackerly, Reference Kraft, Ackerly and Monson2014). However, between-species similarities in these traits likely lead to an increase in the intensity of interspecific competition (e.g. Schoener, Reference Schoener1974). As a result, the overlap in the resource use by coexisting species must be limited (MacArthur and Levins, Reference MacArthur and Levins1967). A community's composition is thus seen as being driven by deterministic niche-based processes (Hubbell, Reference Hubbell2001). In contrast, the predominance of stochastic speciation/extinction and biogeographic processes results in ‘neutral’ communities (Hubbell, Reference Hubbell2001, Reference Hubbell2006). Species composing ‘neutral communities’ and belonging to the same trophic level are considered equivalent in their fitness and competitive abilities, so that ‘neutral communities’ are shaped by dispersal limitations and population dynamics. Efforts aimed at reconciling niche-based and dispersal-based ( = neutral) perspectives of community assembly have resulted in the conclusion that communities may be assembled by both types of processes, so that niche-assembled and dispersal-assembled communities form opposite ends of a continuum (Gravel et al., Reference Gravel, Canham, Beaudet and Messier2006).
Studies aimed at elucidating assembly processes in parasite communities have produced contradictory results. The important role played by niche-based processes has been demonstrated in some parasite communities (e.g. Gutiérrez and Martorelli, Reference Gutiérrez and Martorelli1999; Mouillot, Reference Mouillot2007; Krasnov et al., Reference Krasnov, Shenbrot, Khokhlova, Stanko, Morand and Mouillot2015a), whereas the predominance of dispersal-based assembly has been indicated in other ones (Mouillot et al., Reference Mouillot, George-Nascimento and Poulin2003; Krasnov et al., Reference Krasnov, Shenbrot and Khokhlova2015b). Furthermore, the relative importance of niche-based vs dispersal-based assembly processes may be scale-dependent and may vary in dependence on whether the infra- (in a host individual), component (in a host population) or compound (in a locality) parasite community is considered (Holmes and Price, Reference Holmes, Price, Kittawa and Anderson1986). For example, both stochastic and niche-based mechanisms of species assembly have been indicated for infracommunities of fleas harboured by small mammalian hosts (Krasnov et al., Reference Krasnov, Shenbrot, Khokhlova, Hawlena and Degen2006 vs Surkova et al., Reference Surkova, Korallo-Vinarskaya, Vinarski, van der Mescht, Warburton, Khokhlova and Krasnov2018). The same was true for compound communities of these parasites (Krasnov et al., Reference Krasnov, Shenbrot, Khokhlova, Stanko, Morand and Mouillot2015a vs Krasnov et al., Reference Krasnov, Shenbrot and Khokhlova2015b).
The relative importance of niche-based vs dispersal-based processes in parasite community assembly has rarely been specifically studied (Mouillot, Reference Mouillot2007; Gibert et al., Reference Gibert, Shenbrot, Stanko, Khokhlova and Krasnov2021). Recently, Gibert et al. (Reference Gibert, Shenbrot, Stanko, Khokhlova and Krasnov2021) applied a permutation-based algorithm to infer whether regional flea communities parasitic on small mammals in 4 biogeographic realms are predominantly niche- or dispersal-assembled. They found that these communities’ assembly is, to a great extent, governed by the dispersal processes mediated via their hosts and, to a much lesser extent, by the niche-based processes. The influence of hosts on the dispersal process is not surprising because, obviously, fleas are not likely to disperse on their own and strongly rely on hosts as dispersal vehicles. The disadvantage of Gibert et al.'s (Reference Gibert, Shenbrot, Stanko, Khokhlova and Krasnov2021) approach is that the input data are strictly limited to species composition in the adjacent regions. This may mask the general pattern and lead to confounded results. Indeed, the indication of dispersal-based assembly held for 3 of the 4 biogeographic realms, whereas in the Nearctic, a stronger niche-based than dispersal-based assembly mechanism, was found.
Another way to distinguish between dispersal-based vs niche-based processes in community assembly is to ordinate biological communities using data on species composition and compare the ordination results with the spatial (e.g. across geographic regions) vs the ecological (e.g. across biome habitat types) distribution of these communities. Congruence between the resultant community clusters and their geographic locations, but not habitat/biome types, would indicate the predominance of dispersal-based assembly, whereas the opposite would indicate the predominance of niche-based assembly. Congruence between the ordination results and both geographic and habitat/biome-associated distribution would indicate the action of both processes. Furthermore, a comparison between the ordination results for parasite and host species composition would provide insight into the mediating role played by hosts in parasite community assembly.
Among multiple ordination methods (see Borcard et al., Reference Borcard, Gillet and Legendre2018), the principal component analysis (PCA) and the factor analysis (FA) are the most popular. The aim of both methods is to identify the underlying variables ( = factors = axes) explaining the pattern of correlations between the observed variables and, thus, to produce a small number of factors that explain most of the variance in a much larger number of original variables. The main difference between the PCA and the FA is that the former is a variance-oriented technique, whereas the latter decomposes co-variance (e.g. Shaukat and Uddin, Reference Shaukat and Uddin1989). The traditional FA has a long history of application in ecology, psychology and sociology (e.g. Dagnélie, Reference Dagnélie1960; Goff and Cottam, Reference Goff and Cottam1967; Cattell, Reference Cattell1978). One of the FA's advantages is that each produced factor ( = axis) suggests groupings of sites or samples as a single entity, without an a priori assumption of how many groups exist or definitions of discrete clusters (Alroy, Reference Alroy2019). However, implementing FA for presence–absence data is problematic when the gradients are long and there are many absences so that the majority of pairs of sites/samples have no shared species. As a result, the sites/samples at gradient extremes bend inwards and appear closer than other pairs of samples (horseshoe effect; Hill, Reference Hill1973; ter Braak, Reference ter Braak1985; Borcard et al., Reference Borcard, Gillet and Legendre2018). Alroy (Reference Alroy2019) proposed a modification of the FA, called the step-down factor analysis (SDFA), which aims to resolve this issue by assigning a negative value to an absence in which the missing species never co-occurs with the species found in the relevant sample. The results of implementing the SDFA on both simulated and real data have appeared to be superior to those produced by the traditional FA, as well as by other multiple ordination methods (see details in Alroy, Reference Alroy2019).
Here, we applied the SDFA to data on the species composition of regional assemblages of fleas and their small mammalian hosts from 6 biogeographic realms (the Afrotropics, Australasia, the Indo-Malay, the Nearctic, the Neotropics and the Palearctic). First, we aimed to identify biogeographic (across the entire globe) and ecological (within a realm across the main terrestrial biomes) clusters of flea and host assemblages. At the global scale, we expected that the clusters of regional assemblage loadings on SDFA axes would reflect the distribution of the assemblages according to the biogeographic realms to which they belong and, thus, indicate dispersal-based assembly. At the realm scale, we expected that these clusters would reflect the distribution of regional assemblages according to the predominant biomes in the respective regions and, thus, indicate niche-based assembly. Second, we aimed to understand whether biogeographic or ecological clusters of flea and host assemblages from the same regions match each other.
Materials and methods
Data on flea and host species composition
We used data obtained from various literature sources (including many ‘grey’ publications) on the species composition of fleas and their small mammalian hosts (tachyglossid Monotremata, Dasyuromorphia, Paramelemorphia, Diprotodontia, Macropodiformes, Didelphimorphia, Paucituberculata, Macroscelidea, Eulipotyphla, Rodentia and the ochotonid Lagomorpha) from 109 regions of the world (15 different regions in the Afrotropics, 8 regions in the Australasia, 10 regions in the Indo-Malay, 23 regions in the Nearctic, 17 regions in the Neotropics and 36 regions in the Palearctic) (see lists of regions and references in Supplementary Materials, Appendices 1 and 2). We took into the analyses only host species that harboured fleas. Synanthropic ubiquitous rodents (Rattus norvegicus, Rattus rattus and Mus musculus) and the ubiquitous fleas associated with these rodents (Xenopsylla cheopis, Xenopsylla brasiliensis, Nosopsyllus fasciatus and Nosopsyllus londiniensis) were excluded from the analyses. In total, our data included 1313 flea and 1153 host species. The numbers of flea and host species in each region are presented in Table S1, Appendix 1, Supplementary Materials.
Data analyses
We constructed matrices of either flea species × regions or host species × regions for either the entire globe or separately for each of the biogeographic realms (except for Australasia because there were data for only 8 regions) and applied the SDFA for fleas and hosts separately using the function ‘stepdown’ proposed by Alroy (Reference Alroy2019) and the function ‘fa’ of the package ‘psych’ (Revelle, Reference Revelle2022) implemented in the R statistical environment (R Core Team, 2021). We ran this function with the options (rotate = ‘varimax’) and (fm = ‘minres’). Initially, we specified 10 factors. Then, we removed the factors that cumulatively explained less than 10% of the variation and ran the SDFA with the number of factors remaining after this winnowing. The similarity between factors that was produced by the SDFA for fleas and hosts was further assessed using Tucker's congruence coefficient (TCC; see details in Lovik et al., Reference Lovik, Nassiri, Verbeke and Molenberghs2020). It represents a cosine between 2 vectors defined by the matrix of loadings and based at the origin, and it ranges from −1 to +1. Lorenzo-Seva and ten Berge (Reference Lorenzo-Seva and ten Berge2006) established cut-off values in the range of 0.85–0.94 as corresponding to a fair similarity and a value higher than 0.95 as an indicator that the 2 factors are equal. We estimated the TCC using the function ‘factor.congruence’ of the R package ‘psych’. We visualized the geographic distribution of regional flea and host assemblages according to their loadings on axes produced by the SDFA, using the R packages ‘sp’ (Pebesma and Bivand, Reference Pebesma and Bivand2005; Bivand et al., Reference Bivand, Pebesma and Gomez-Rubio2013), ‘sf’ (Pebesma, Reference Pebesma2018), ‘rnaturalearch’ (South, Reference South2017) and ‘ggplot2’ (Wickham, Reference Wickham2016). Mappings of regional flea and host assemblages within the biogeographic realms were done for the maps of the main terrestrial biomes according to Olson et al.'s (Reference Olson, Dinerstein, Wikramanayake, Burgess, Powell, Underwood, D'amico, Itoua, Strand, Morrison, Loucks, Allnutt, Ricketts, Kura, Lamoreux, Wettengel, Hedao and Kassem2001) classification.
Then, we applied hierarchical cluster analyses with Ward's linkage method to regional flea and host assemblages using the R package ‘dendextend’ (Galili, Reference Galili2015). We visualized the clustering of flea vs host assemblages for comparison with the function ‘tanglegram’ using a stepwise rotation of the 2 trees (option method = step2side). The similarity between each pair's (i.e. flea and host) dendrograms was estimated using Baker's gamma correlation (Baker, Reference Baker1974).
Results
The SDFA of regional flea and host assemblages produced from 2 to 4 factors ( = axes). The proportion of variance explained by these axes, both at the global scale and at the scale of individual biogeographic realms, was high (Table 1). Two (for the Afrotropical fleas) and 3 (for the entire globe and the remaining realms) SDFA axes cumulatively explained from 83 to 100% of the variation. In general, the axes were congruent between fleas and hosts (see Tables S2–S7, Appendix 3, Supplementary Material) with the TCC ranging from 0.85 to 1.00 between the first 2 axes (except for the second axes for fleas and hosts in the Afrotropics).
Proportion of variance explained by 2, 3 or 4 axes of the step-down factor analyses for flea and host assemblages across the entire world and 5 biogeographic realms (the Australasia was not analysed separately; see text for explanation)

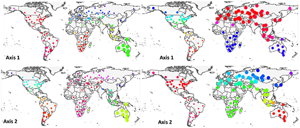
At the global scale, axes 1 and 2, taken together, generally recognized flea and host clusters as belonging to the 6 biogeographic realms (Fig. 1). For fleas, however, axis 1 did not distinguish between (a) the northern part of the Nearctic and the southern and the western part of the Neotropics and (b) the Australasia and the southern part of the Palearctic, whereas axis 2 did not distinguish between (a) most of the Palearctic and the Afrotropics and (b) the Nearctic and the Indo-Malay. For hosts, axis 1 combined (a) the Australasia and the Afrotropics and (b) the Indo-Malay and the eastern Palearctic. Host assemblages of the Neotropics and the northern Nearctic had similar loadings on axis 2. Interestingly, flea assemblages in North Africa and/or southern Asia were clearly distinguished from other assemblages in the Palearctic along both axes 1 and 2, whereas this was true for host assemblages along axis 1. For fleas, axes 3 and 4 combined the Holarctic flea assemblages, whereas for hosts, axes 3 and 4 recognized the difference between (a) the Afrotropics, the Neotropics and the Australasia (axis 4) and (b) the Nearctic, the Palearctic and the Indo-Malay (Fig. S1, Appendix 4, Supplementary Materials).
Distribution of regional flea and host assemblages across the globe according to their loadings on axes 1–4 of the step-down factor analyses. Point size and colours scale to the assemblage loading on the respective axis.

The results of the cluster analyses of loadings on the SDFA axes demonstrated clear clusters of flea and host assemblages respective to the 6 biogeographic realms except for fleas and hosts from Madagascar (belonging to the Afrotropics but clustered with the Indo-Malay and the Australasian assemblages, respectively) and hosts from Morocco and Egypt (both belonging to the Palearctic, but with the Afrotropical assemblages) (Fig. 2). The topology of the clusters corresponding to the biogeographic realms was similar between flea and host assemblages (Baker's gamma index = 0.98). However, the topology of subtrees within realm-specific clusters substantially differed between fleas and hosts (there were only 9 identical subtrees).
Tanglegram of the results of the cluster analyses of regional flea and host assemblage loadings on the axes of step-down factor analyses across the globe. Colours correspond to biogeographic realms as follows: (1) the Australasia, (2) the Afrotropics, (3) the Indo-Malay, (4) the Nearctic, (5) the Neotropics, (6) the Palearctic. Coloured lines represent subtrees common to the 2 dendrograms. See Table S1, Appendix 1, Supplementary Materials for the abbreviations of region names.

At the scale of biogeographic realms, the distribution of regional flea and host assemblages did not correspond to the predominant biome types. Assemblages with similar loadings on the SDFA axes were often situated in different biomes and vice versa. Distributions of assemblages according to their loadings on axis 1 of the SDFA, across biome types and within a realm, are presented in Figs 3–4 (see Figs S1–S4 of Appendix 4, Supplementary Material for distributions according to the loadings on axes 2–4 of the SFPDA). A visual inspection of the across-biome, within-realm distributions of flea vs host assemblages (Figs 3–4 and Figs S1–S4 of Appendix 4, Supplementary Material) suggested a generally weak congruence between these distributions. This was also supported by the results of the cluster analysis of loadings on the SDFA axes (Fig. 5). Baker's gamma indices for 4 of 5 realms ranged from 0.29 in the Indo-Malay to 0.78 in the Nearctic and reached as high as 0.88 only in the Palearctic.
Distribution of regional flea and host assemblages across the Afrotropics (A), the Indo-Malay (B) and the Nearctic (C), according to their loadings on axis 1 of the step-down factor analyses. Point size and colours scale to the assemblage loading on the respective axis. Borders of terrestrial biomes, according to Olson et al. (Reference Olson, Dinerstein, Wikramanayake, Burgess, Powell, Underwood, D'amico, Itoua, Strand, Morrison, Loucks, Allnutt, Ricketts, Kura, Lamoreux, Wettengel, Hedao and Kassem2001), are shown.

Distribution of regional flea and host assemblages across the Neotropics (A) and the Palearctic (B), according to their loadings on axis 1 of the step-down factor analyses. Point size and colours scale to the assemblage loading on the respective axis. Borders of terrestrial biomes, according to Olson et al. (Reference Olson, Dinerstein, Wikramanayake, Burgess, Powell, Underwood, D'amico, Itoua, Strand, Morrison, Loucks, Allnutt, Ricketts, Kura, Lamoreux, Wettengel, Hedao and Kassem2001), are shown.

Tanglegram of the results of the cluster analyses of regional flea (left dendrograms) and host (right dendrograms) assemblage loadings on the axes of step-down factor analyses within each of the 5 biogeographic realms. Colours correspond to the predominant biome of a region according to the classification of Olson et al. (Reference Olson, Dinerstein, Wikramanayake, Burgess, Powell, Underwood, D'amico, Itoua, Strand, Morrison, Loucks, Allnutt, Ricketts, Kura, Lamoreux, Wettengel, Hedao and Kassem2001) as follows: (1) tundra, (2) boreal forests/taiga, (3) montane grasslands and shrublands, (4) temperate coniferous forests, (5) temperate broadleaf and mixed forests, (6) temperate grasslands, savannas and shrublands, (7) tropical and subtropical moist broadleaf forests, (8) tropical and subtropical dry broadleaf forests, (9) tropical and subtropical grasslands, savannas and shrublands, (10) Mediterranean forests, woodlands and scrub, (11) deserts and xeric shrublands, (12) flooded grasslands and savannas. Coloured lines represent subtrees common to a pair of dendrograms. See Table S1, Appendix 1, Supplementary Materials for the abbreviations of region names and predominant biome types.

Discussion
We found that, at the global scale, clusters of regional assemblage loadings on the SDFA axes reflected well the distribution of the assemblages according to the biogeographic realms to which they belong. This, however, was not the case for assemblage distribution across the main biome types within a realm. This suggests that dispersal is a predominant mechanism of flea and host community assembly across large regions. In other words, the species composition of regional flea and host assemblages was determined first and foremost by historical processes.
The historical biogeography of mammals has been repeatedly studied, starting from the pioneering work of Simpson (Reference Simpson1940). Although some of Simpson's (Reference Simpson1940) conclusions and proposed mechanisms of mammalian distributions have been criticized (Cracraft, Reference Cracraft1974; Nelson, Reference Nelson1978), the application of modern molecular and analytical tools reinforced Simpson's (Reference Simpson1940) ideas about the importance of dispersal and vicariance in mammals’ biogeographic history (e.g. Springer et al., Reference Springer, Meredith, Janecka and Murphy2011). As obligate parasites of mammalian (although avian as well, but to a much lesser extent) hosts, fleas have closely followed the distribution of their hosts. Both earlier narrative studies of fleas’ geographic distribution (e.g. Traub, Reference Traub1972, Reference Traub, Traub and Starcke1980; Medvedev, Reference Medvedev1996, Reference Medvedev2005) and modern sophisticated molecular analyses (Whiting et al., Reference Whiting, Whiting, Hastriter and Dittmar2008; Zhu et al., Reference Zhu, Hastriter, Whiting and Dittmar2015) have provided strong support for flea biogeographic patterns mirroring those of their hosts.
In this study, the input data were merely inventories of flea and host species without any association between the species composition of a regional assemblage and its geographic location. Nevertheless, the ordination results provided clear groupings of both fleas and hosts that corresponded well to Wallacean biogeographic realms. Moreover, different axes of the SDFA captured somewhat different aspects of flea and host distributions. For example, axis 1 isolated North African and Middle Eastern flea communities, whereas axis 3 isolated the flea communities of Nepal from the rest of the Indo-Malay (Fig. 1). Similarly, Panamanian, Venezuelan and Colombian host communities were distinguished from the rest of the Neotropics along axis 1, and Moroccan and Egyptian communities from the rest of the Palearctic along axes 1 and 3 (Fig. 1). This emphasizes the substantial difference in species composition between these and other assemblages of the same realm.
The congruence between distributions of flea and host assemblages across biogeographic realms was high. This, however, did not hold for the across-biome, within-realm scale. In other words, similar regional assemblages of hosts do not necessarily harbour similar assemblages of fleas, suggesting that the dispersal patterns of fleas and hosts within a realm might be, to some extent, independent. The most likely mechanism for this independence is frequent host switching by fleas. The idea that cospeciation was the main event during the common history of the host and parasite lineages (Hafner and Nadler, Reference Hafner and Nadler1988; Ronquist, Reference Ronquist and Page2003) has been undermined by many studies that described frequent host switching among both related and unrelated hosts in various parasite–host associations (Paterson et al., Reference Paterson, Gray and Wallis1993; Beveridge and Chilton, Reference Beveridge and Chilton2001; Roy, Reference Roy2001), including fleas and their mammalian hosts (Krasnov and Shenbrot, Reference Krasnov and Shenbrot2002; Lu and Wu, Reference Lu and Wu2005; Whiting et al., Reference Whiting, Whiting, Hastriter and Dittmar2008). In fact, host switching as a highly probable evolutionary event has been demonstrated not only in phylogenetic, biogeographic and theoretical studies (e.g. Boeger et al., Reference Boeger, Kritsky and Pie2003; Meinilä et al., Reference Meinilä, Kuusela, Ziȩtara and Lumme2004; Araujo et al., Reference Araujo, Braga, Brooks, Agosta, Hoberg, von Hartenthal and Boeger2015) but also in experimental studies (e.g. Dick et al., Reference Dick, Esberard, Graciolli, Bergallo and Gettinger2009; Arbiv et al., Reference Arbiv, Khokhlova, Ovadia, Novoplansky and Krasnov2012). Ecological fitting (Janzen, Reference Janzen1985) is considered as the initial (and the main) mechanism of host switching (Agosta and Klemens, Reference Agosta and Klemens2008; Hoberg and Brooks, Reference Hoberg and Brooks2008; Agosta et al., Reference Agosta, Janz and Brooks2010). Originally, the concept of ecological fitting is related to a preadaptation scenario in which an organism (e.g. a parasite) exploits its environment (e.g. hosts), using some traits that suggest a shared evolutionary history, whereas these traits evolved in response to a different set of conditions. Imagine that a flea's main requirement is the resource (blood) presented by a host rather than a specific host species producing the resource. Given that all terrestrial vertebrates share this resource (and blood's biochemistry and nutritional value are similar among many mammals), a flea may follow the resource rather than its original source (a host species to which the flea is adapted) and may, for example, invade new areas where the resource is present despite the absence of its original source. This, however, does not mean that any flea can switch to any vertebrate host because a host must present fleas not only with its blood as a food resource but also with its burrow or nest, which is necessary for the majority of flea species as a microhabitat where they (most species) oviposit and where their pre-imaginal development takes place (see Marshall, Reference Marshall1981; Krasnov, Reference Krasnov2008). In addition, the success of host switching may depend on the fleas’ ability to extract blood from a host. This ability depends both on a host's morphological (e.g. skin depth, hair structure), physiological (e.g. immunocompetence) and behavioural (patterns of anti-ectoparasitic grooming) traits and on fleas’ morphological (e.g. possession of ctenidia), physiological (e.g. energetic cost of digestion) and behavioural (e.g. singular or multiple feeding bouts necessary for egg maturation) traits (see multiple examples in Krasnov, Reference Krasnov2008).
The results of both the SDFA and cluster analyses within realms demonstrated that the distribution of both fleas and hosts was not associated with biome types. Instead, spatial clusters could be envisaged within each biome. For example, flea and host assemblages with similar species compositions appeared to be distributed across various biomes in eastern South America (Fig. 4). The same was true for fleas in most of Europe and hosts in the eastern Palearctic (Fig. 4). This again testifies to the importance of historical processes as assembly mechanisms of flea and host communities at a large scale, whereas the role of niche-based processes, at least at this scale, is minor, supporting the idea of the scale dependence of a dispersal–niche continuum in which the role of historical processes increases with the increasing scale (Pearson and Dawson, Reference Pearson and Dawson2003; Gibert et al., Reference Gibert, Shenbrot, Stanko, Khokhlova and Krasnov2021).
Indeed, niche-based processes are likely very important for community assembly distribution at a smaller scale, such as across habitat types within a region of a particular biome. This is especially true for ectoparasites such as fleas that are influenced not only by their hosts but, to a great extent, by off-host environmental factors, such as, for example, air temperature, humidity and soil structure. Consequently, niche-based processes might be associated with the intertwined effects of environment and hosts. Moreover, the relative roles of host species vs environment differ between flea species. Fleas in Israel's Negev Desert present 3 possible scenarios for this (Krasnov et al., Reference Krasnov, Shenbrot, Medvedev, Khokhlova and Vatschenok1998, Reference Krasnov, Hastriter, Medvedev, Shenbrot, Khokhlova and Vatschenok1999). Parapulex chephrenis occurs wherever its specific hosts, rodents of genus Acomys, are found, independently of habitat type. Synosternus cleopatrae resides exclusively in sandy habitats, independently of host species composition. Xenopsylla ramesis parasitizes the rodent Meriones crassus but only in loessy habitats, whereas in dry riverbeds, it is replaced by Xenopsylla conformis. The latter example illustrates the combined host–environment effect that occurs due to across-habitat variation in the same host species’ shelter structures (Shenbrot et al., Reference Shenbrot, Krasnov, Khokhlova, Demidova and Fielden2002), which may or may not be suitable for a given flea that requires certain levels of air temperature and humidity for successful pre-imaginal development, as well as to the efficiency of physiological processes such as digestion (see Krasnov, Reference Krasnov2008).
From the methodological perspective, the SDFA appeared to be useful for revealing large-scale (global or continental) patterns and for recognizing spatially consistent clusters of samples or communities (see also Alroy, Reference Alroy2019). However, the SDFA's ability to recognize such clusters at a fine-grain scale (e.g. local) is still unknown and warrants further investigation.
Supplementary material
The supplementary material for this article can be found at https://doi.org/10.1017/S0031182022000907.
Data availability
Raw data are contained in the sources cited in Appendix 2.
Acknowledgements
We thank Uri Roll for help with R code. This is publication no. 1116 of the Mitrani Department of Desert Ecology.
Author contributions
B. R. K. conceived and designed the study. All authors collected the data and performed statistical analyses. B. R. K. wrote the first draft of the article. All authors finalized the article.
Financial support
This study did not receive any specific financial support.
Conflict of interest
None.
Ethical standards
This study is based on published data, and therefore, ethical standards are not applicable.


 Open access

