


1 Introduction
The syllable is an important unit in utterance organization and speech planning. Syllables are psychologically salient units into which sequences of individual segments are organized (e.g. Selkirk Reference Selkirk, van der Hulst and Smith1982). They are also the base units for higher levels of prosodic organization such as feet and phonological phrases, and are generally the docking sites for lexical stress, tone, and pitch-accent (Ladd Reference Ladd2008, Yip Reference Yip2002). However, current definitions of the syllable cannot uniformly account for all syllabic structures found in the world’s languages. Two theories have had broad success in addressing this issue: one rooted in sonority (e.g. Clements Reference Clements, Kingston and Beckman1990) and one based on timing as defined in Articulatory Phonology (Browman & Goldstein Reference Browman and Goldstein1986). There are still, however, languages with syllabic structures that challenge either or both approaches. On the one hand, violations of sonority-based principles of syllable organization are well-documented. On the other hand, the timing-based definition of the syllable from Articulatory Phonology cannot easily capture large onsets, such as those in Georgian. In fact, the Articulatory Phonology account of syllabic structure has only been tested against a limited number of syllable shapes and sizes. The work presented here proposes that we can best address these challenging cases through probing the relationship between sonority and articulatory timing, and, by extension, further refine the definition of the syllable.
We focus on Georgian, which is a language that calls into question the assumptions of both approaches to syllable organization. Georgian permits essentially any combination of consonants in the onset, including sonority falls with left-edge approximants, thus defying sonority-based principles of syllable organization. Onsets can also consist of up to seven consonants; their sheer size makes it difficult to capture their organization within Articulatory Phonology. Indeed, previous articulatory research has been unable to offer a unified account of timing in Georgian (Goldstein, Chitoran & Selkirk Reference Goldstein, Chitoran and Selkirk2007, Hermes, Greisbach & Chitoran Reference Hermes, Greisbach and Chitoran2020). We systematically examine the relationship between sonority shape and articulatory timing in two-consonant onsets in Georgian and demonstrate that the two do interact. On the basis of these findings, we offer an account of how syllabification in Georgian works, that can extend to all onset types and lengths. Ultimately, we provide a novel proposal of how the two approaches to the syllable – i.e. the sonority sequencing approach and the articulatory timing approach – can be expanded in tandem with one another to capture syllable organization despite cases of apparent lack of conformity to one or the other.
1.1 Sonority
Sonority is an abstract property of speech sounds that can be invoked to explain a wide variety of phonotactic patterns and phonological processes across languages. Speech sounds can be organized in a hierarchy based on their sonority values. The most widely accepted sonority hierarchy (adapted from Parker Reference Parker2011) is shown here:
Sonority is often used to explain patterns of syllable structures across the world’s languages, through the Sonority Sequencing Principle (Hooper Reference Hooper1976; Kiparsky Reference Kiparsky1979, Reference Kiparsky, Dressler, Pfeiffer and Rennison1981). The Sonority Sequencing Principle (SSP) states that each syllable has a sonority peak and is preceded and followed by sequences increasing and decreasing in sonority, respectively, with local sonority minima at syllable edges. Following the SSP, two other major sonority-based principles of syllable organization have been proposed: Minimum Sonority Distance (Steriade Reference Steriade1982) that states that languages may impose a minimum difference in sonority values, assumed to be language specific, between adjacent segments; and the Dispersion Principle (Clements Reference Clements, Kingston and Beckman1990) which states that, all else being equal, languages will maximize sonority differences in onsets and minimize them in codas. Figure 1 illustrates an SSP-conforming syllable from Georgian.
The Georgian word /khris/ ‘blow-3sg.subj’ follows the SSP.

Any language that permits complex syllable onsets will allow the kind of complex onset illustrated in Figure 1, where each successive consonant in the onset is more sonorous than the one preceding it. But many languages that permit tautosyllabic CC(…) sequences also allow some SSP-nonconforming syllable shapes. Figure 2 illustrates an SSP-nonconforming syllable from Georgian.
The Georgian word /rkhebs/ ‘antler-pl-dat’ does not follow the SSP.

The most common SSP-nonconforming cluster across the world’s languages is the /s/+stop cluster, which has received significant attention in the literature (e.g. Engstrand & Ericsdotter Reference Engstrand and Ericsdotter1999, Morelli Reference Morelli, Féry and van de Vijver2003, Yavaş et al. Reference Yavaş, Avivit Ben-David, Kristoffersen and Simonsen2008, Goad Reference Goad2011, Yavaş Reference Yavaş2013) and in many languages is the only tautosyllabic sonority ‘reversal’ permitted. Phonological analyses of /s/+stop clusters have therefore been focused on reconciling their presence within the otherwise SSP-conforming phonotactics of languages like English. This body of work explains the exceptionality of /s/+stop clusters and focuses primarily either on the unique properties of sibilants which allow them to appear at the syllable left-edge or on analyses that treat left-edge sibilants as extrasyllabic. However, the focus of the current study is not on individual exceptional clusters, but on an entire system in which essentially all clusters are permitted. To this end, i.e. to understand how Georgian and other languages permit syllable onsets with such cross-linguistically dispreferred shapes (e.g. /rg/ or /lb/), we consider two accounts of what may motivate the general cross-linguistic preference for sonority rises (e.g. /gr/ or /bl/).
The first is that sonority rises in onsets are the sequences of consonants best suited for the parallel transmission of information. Parallel transmission – the simultaneous conveyance of information about multiple segments – is introduced by Mattingly (Reference Mattingly, Myers, Laver and Anderson1981) as a crucial organizing element of speech production and perception. Mattingly (Reference Mattingly, Myers, Laver and Anderson1981: 481) describes the articulatory prerequisites for parallel information transmission as a sequence of increasingly open constrictions followed by one of increasingly closed constrictions. This, as Mattingly notes, is strikingly similar to sonority sequencing. Sonority rises are those shapes which best allow for parallel transmission of information because co-production of consonantal constrictions in the onset does not obscure cues to consonant identity.
The second account comes from Henke, Kaisse & Wright (Reference Henke, Kaisse, Wright and Parker2012), who argue that the SSP and related principles are epiphenomena that emerge entirely from perceptual concerns. Specifically, /s/+stop clusters and those sequences licensed by the SSP are those where the cues to each consonant’s identity are most recoverable. Their account also considers Georgian and other languages with pervasive SSP violations, building on prior proposals that in these languages, articulatory timing is modulated in ways that ensures consonant recoverability in SSP-nonconforming clusters (Chitoran, Goldstein & Byrd Reference Chitoran, Goldstein, Byrd, Gussenhoven and Warner2002 on Georgian; Wright Reference Wright1996, Reference Wright1999 on Tsou).
Both Mattingly (Reference Mattingly, Myers, Laver and Anderson1981) and Henke et al. (Reference Henke, Kaisse, Wright and Parker2012) invoke articulatory timing to explain the sonority shapes found across languages. Mattingly (Reference Mattingly, Myers, Laver and Anderson1981) uses timing to account for how sonority rises are cross-linguistically preferred, while Henke et al. (Reference Henke, Kaisse, Wright and Parker2012) use timing to explain deviations from the SSP. Although articulatory timing emerges in these accounts as an important dimension of syllable organization, the relationship between sonority and timing has not been directly examined previously. In our study, we make a first step towards probing this relationship, following the assumptions of Articulatory Phonology, which is a theory that provides a principled account of how articulatory timing gives rise to syllable structure.
1.2 The role of articulatory timing in syllable organization
1.2.1 Articulatory Phonology
In Articulatory Phonology (AP), the syllable is defined on the basis of temporal organization (Browman & Goldstein Reference Browman and Goldstein1988). Articulatory Phonology considers the cognitive-linguistic (or phonological) dimension and the biomechanical (the phonetic) one as the macroscopic and the microscopic description respectively of the same complex self-organizing system (e.g. Browman & Goldstein Reference Browman and Goldstein1986, Reference Browman and Goldstein1989, Reference Browman and Goldstein1992; Goldstein & Fowler Reference Goldstein, Fowler, Schiller, Olaf Schiller and Meyer2003). In AP, gestures, i.e. discrete movements of the speech articulators forming and releasing phonologically relevant constrictions in the vocal tract, are the phonological primitives. These gestures are abstract units that can be defined in a tract-variable space using a set of task-dynamic equations in the same way as many other skilled motor tasks such as walking and reaching can be defined (Saltzman & Kelso Reference Saltzman, Scott Kelso and Magill1983, Saltzman Reference Saltzman, Heuer and Fromm1986). The goals in these tract-variable spaces are achieved through synergies of different articulators. Different speakers may tune these synergies differently to achieve the same goal or may employ different compensatory mechanisms to adapt these synergies when external perturbations are introduced (e.g. Kelso & Tuller Reference Scott and Tuller1984, Shaiman Reference Shaiman1989, Ito, Gomi & Honda Reference Ito, Gomi and Honda2000, Golfinopolous et al. Reference Golfinopoulos, Tourville, Bohland, Ghosh, Nieto-Castanon and Guenther2011). Each articulator has a set of dimensions associated with it, such as constriction location and constriction degree for the tongue tip, tongue body and tongue dorsum articulators, among others (see Browman & Goldstein Reference Browman and Goldstein1989: 210 for the full proposed set of articulators and their dimensions).
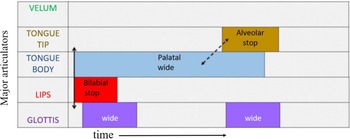
Gestural score for the word ‘pat’ with phasing relationships marked. Solid line marks in-phase coordination and the dotted line marks anti-phase coordination.

Gestures have not only spatial but also temporal properties, as dynamical systems by definition change over time. Specifically, they are active for a given temporal interval, called activation interval, and are timed with respect to each other. Figure 3 shows a gestural score for the English word ‘pat.’ The activation interval for each gesture is marked with a filled bar on the row for the relevant articulator and is labelled with the constriction location (upper line) and degree (lower line). For example, the lips are making a bilabial (location) stop (degree) early in the utterance for the onset consonant of the word ‘pat’, and the tongue tip makes an alveolar stop later in the utterance for the coda /t/. The x-axis represents time; the longer the bar for the activation interval, the longer the duration of the gesture.
Later work in AP advanced a dynamic coupling model (e.g. Saltzman & Byrd Reference Saltzman and Byrd2000, Nam & Saltzman Reference Nam and Saltzman2003) to explain inter-gestural timing patterns. In this model, timing of gestures is controlled by oscillators, which are coupled to one another in specific ways. There are two types of ‘coupling targets’ (Nam et al. Reference Nam, Goldstein, Saltzman, Pellegrino, Marsico and Chitoran2009: 4) found in these kinds of models: the first is in-phase coupling, and the second is anti-phase. Activation intervals for gestures that are in-phase are initiated simultaneously. Oscillators in anti-phase coordination are linked in time, but in this case the activation interval for the second gesture is initiated after the first gesture has reached its target. In Figure 3, the solid line marks in-phase coordination, and the dotted line marks anti-phase coordination.
Oscillator coupling graphs.

Gestural score for the word ‘spat’. Vertical line marks the c-center. The c-center is equidistant from the onset (shown as the beginning of activation interval) of the Tongue Tip gesture (constriction location: alveolar; constriction degree: fricative) for /s/ and the onset of the Lips gesture (constriction location: bilabial; constriction degree: stop) for /p/.

1.2.2 Syllable affiliation and c-centers
Browman & Goldstein (Reference Browman and Goldstein1992) investigated the mechanism by which C(C)(C) sequences in different syllabic contexts are distinguished. They found that onset and coda C gestures had distinct timing patterns relative to the V gesture in the nucleus. Coda C gestures are organized locally: the first coda C gesture is anti-phase coordinated with the V gesture, and each following C gesture is anti-phase coordinated with the preceding C gesture. Onset consonants, on the other hand, are organized globally, and this observed pattern was termed the c-center organization (for ‘consonant center’). In onsets, all C gestures are in phase with the V gesture but antiphase with each other. The conflicting phasing results in all onset C gestures being temporally equidistant from the mean value of the midpoints of all of the gestural plateaus of the onset consonants (Browman & Goldstein Reference Browman and Goldstein1989: 144). This midpoint is called the c-center. The shift in timing seen between single C gestures (with respect to the V gesture) and the respective C gestures in onsets consisting of multiple consonants (with respect to the V gesture) is called the c-center effect or c-centering (compare the Tongue Tip gesture for onset /d/ in Figure 3 to the Tongue Tip gesture for onset /s/ in Figure 5).
The coupling model introduced by Nam & Saltzman (Reference Nam and Saltzman2003) accounts for the c-center using competitive coupling graphs. In these graphs, each individual oscillator representing an onset consonant has an in-phase coupling relationship with the vowel as well as an antiphase coupling relationship to the other consonant oscillators. The competition between these two coupling modes results in the rightward movement of the c-center effect as described in Browman & Goldstein (Reference Browman and Goldstein1992). Figure 4 shows the oscillator coupling graphs for a simplex onset (left graph), a simplex coda (middle graph), and a complex onset (right graph); the gestural score for the word ‘spat’ (Figure 5) is the result of the coupling pattern shown in the right graph in Figure 4; the vertical line indicates the c-center.
The c-center effect has been investigated in several languages with different syllable structures and the results have confirmed the presence of the effect and the coupling model hypothesis (e.g. Kühnert, Hoole & Mooshammer Reference Kühnert, Hoole and Mooshammer2006 on French; Hermes, Mücke & Grice Reference Hermes, Mücke and Grice2013 on Italian). Research looking at timing within syllables has also confirmed previous analyses of syllable structure in certain languages, such as Imdlawn Tashlhiyt Berber. To illustrate, Tashlhiyt Berber does not permit complex onsets, and indeed, no c-center is found in CCV or CCCV structures (Goldstein et al. Reference Goldstein, Chitoran and Selkirk2007, Hermes, Mücke & Auris Reference Hermes, Mücke and Auris2017). Instead, the data support the C.CV or CC.CV parses proposed in non-AP-based analyses of Tashlhiyt syllabification (Dell & Elmedlaoui Reference Dell and Elmedlaoui1985, Reference Dell and Elmedlaoui2002). Shaw et al. (Reference Shaw, Gafos, Hoole and Zeroual2011) show the same for Moroccan Arabic, which has been claimed to disallow complex onsets (Dell & Elmedlaoui Reference Dell and Elmedlaoui2002). In Georgian, on the other hand, complex onsets are attested, and previous articulatory work comparing Georgian and Tashlhiyt Berber has provided evidence for different timing patterns in the two languages (Goldstein et al. Reference Goldstein, Chitoran and Selkirk2007). However, it is unclear whether Georgian consistently shows the c-center effect, since data present significant inter-speaker variability. In addition, intra-syllabic coordination seems to break down in onsets of four or more consonants (Hermes et al. Reference Hermes, Greisbach and Chitoran2020). A parallel study to the current one directly examines c-centering in Georgian in an attempt to clarify its syllable organization (Crouch, Katsika & Chitoran Reference Crouch, Katsika and Chitoran2022). In the design and analysis of the experiment we discuss here, which examines CC clusters, we are operating under the assumption that these sequences are tautosyllabic onsets and that therefore, the consonant gestures we analyze are temporally coordinated with one another, possibly via the c-center mechanism, giving rise to a syllable. We predict that, independently of this intra-syllabic coordination pattern, these consonant gestures will have different patterns of overlap as a function of sonority shape. There is a substantial body of research, summarized below, showing that gestural overlap can vary depending on a variety of factors without disrupting intra-syllabic coordination.
1.2.3 Gestural overlap
Variation in gestural overlap between syllable onsets with distinct compositions is not due to variation in phonological structure. Kühnert et al. (Reference Kühnert, Hoole and Mooshammer2006) show that consonant sequences in French differ with regard to gestural overlap but show a stable c-center effect. This indicates that global timing patterns (i.e. the c-center effect) can be consistent within a language despite major differences in local timing patterns (e.g. consonant gesture overlap), as also supported by Sotiropoulou, Gibson & Gafos (Reference Sotiropoulou and Gibson2020, on Central Peninsular Spanish) and Sotiropoulou & Gafos (Reference Sotiropoulou and Gafos2022, on German).
Overlap between consonant gestures is both language-specific (Pouplier Reference Pouplier, Susanne Fuchs, Pape and Perrier2012, Bombien & Hoole Reference Bombien and Hoole2013) and determined by a variety of factors such as order and manner of place of articulation (Bombien & Hoole Reference Bombien and Hoole2013, Bombien, Mooshammer & Hoole Reference Bombien, Mooshammer and Hoole2013). Order of place of articulation affects degree of overlap; research on Georgian (Chitoran et al. Reference Chitoran, Goldstein, Byrd, Gussenhoven and Warner2002), French (Kühnert et al. Reference Kühnert, Hoole and Mooshammer2006), Korean (Son, Kochetov & Pouplier Reference Son, Kochetov and Pouplier2007), and Russian (Kochetov, Pouplier & Son Reference Kochetov, Pouplier and Son2007) has shown that back-to-front clusters are less overlapped than front-to-back clusters, with the exception of /kt/ in Russian (Kochetov et al. Reference Kochetov, Pouplier and Son2007).
Manner and voicing have also been shown to affect consonant gesture overlap. Hoole et al. (Reference Hoole, Pouplier, Benus, Bombien, Spreafico and Vietti2013) find that gestures in obstruent–rhotic sequences show less overlap than those in obstruent–lateral sequences, and that nucleic consonant gestures show different overlap patterns, measured from the offsets and onsets of gestural targets, with the rightmost onset consonant gesture than nucleic vowel gestures do. Work on German has found that stop–nasal clusters and stop–liquid clusters display different patterns of overlap and are differently affected by changes in voicing status of the obstruent member of the cluster (Bombien & Hoole Reference Bombien and Hoole2013). Further work on German reveals a hierarchy of overlap in different clusters relying on the aforementioned factors: /kl/ has the most overlap, followed by /pl/ > /ps/ > /ks/ > /kn/ (Bombien et al. Reference Bombien, Mooshammer and Hoole2013).
In general, the identity of each consonant gesture in the cluster could affect overlap, in some part due to different degrees of coarticulatory resistance for different consonant gestures. Pastätter & Pouplier (Reference Pastätter and Pouplier2014) find that sibilant consonant gestures overlap less with adjacent vowel gestures than other consonant gestures do, which has implications for the c-center effect in these sequences and propose that coarticulation resistance plays a role in timing. Because of the sibilant gestures’ higher resistance to coarticulation (Recasens, Pallarès & Fontdevila Reference Recasens, Dolors Pallarès and Fontdevila1997, Recasens Reference Recasens2012), they resist the rightward movement associated with the c-center effect that normally results in a higher degree of overlap with the nucleus gesture. By resisting this movement, the timing patterns normally associated with the c-center effect are disrupted, but still present. In a similar vein, Kochetov et al. (Reference Kochetov, Pouplier and Son2007) compared degree of consonant gesture overlap in VCCV structures in Korean and Russian to test the hypothesis that languages with more or stronger assimilation patterns, like Korean, will show more overlap, and they find that this is indeed the case.
The present study aims to determine if sonority sequencing is another factor affecting gestural overlap. Since in Georgian onsets of all sonority shapes share the property of being tautosyllabic, we make the assumption that, in accordance with the literature summarized here, the principle of syllabic organization is the same (e.g. c-centering), and we assess whether it is by fine-tuning gestural overlap that Georgian allows onsets of any sonority shape.
Georgian consonant inventory (following Shosted & Chikovani Reference Shosted and Chikovani2006).

1.3 Georgian
The following section presents a few relevant facts about Georgian phonology. We selected Georgian for this study because the language permits in principle any combination of up to seven consonants as a syllable onset. Unambiguous syllable codas, even simplex ones, are uncommon, and the vast majority of complex codas are multimorphemic (Butskhrikidze Reference Butskhrikidze2002). Many complex onsets are also multimorphemic, as Georgian verbal morphology includes a variety of consonant-only prefixes. For example: /gv-ptsxvni-s/ ‘He/she peels us’, where the gv- prefix marks the first personal plural object, or /g-naxe/ ‘I saw you’, where the g- prefix marks the second personal singular object.
Georgian has a typical five vowel inventory: /a e i o u/. It is important to note that there is no phonemic schwa in Georgian, nor are there any phonological processes that would reduce underlying phonemic vowels to schwa (e.g. Aronson Reference Aronson1997). The consonant inventory is presented in Table 1.
Georgian ejectives have a short lag between the release of the oral closure and the release of the glottal closure (Vicenik Reference Vicenik2010), and the uvular ejective is often fricated to some degree (Shosted & Chikovani Reference Shosted and Chikovani2006). The labio-dental fricative /v/ has a wide range of realizations which can be more or less approximant-like.The following example (from Chitoran Reference Chitoran1999) suggests that /v/ may actually be a phonological approximant:

Syncope triggered by the attachment of the genitive case suffix is expected in both nouns here, but fails to apply to mtvralis, where syncope would result in a /vrl/ sequence. Georgian permits fricative–sonorant–sonorant sequences otherwise, so the failure of syncope in this particular example suggests an avoidance of a three-sonorant sequence. For this reason, /v/ has been excluded from test sequences to avoid possible variation in sonority shape both across and within speakers.
Word-level stress is found on the initial syllable. Vicenik & Jun (Reference Vicenik, Jun and Jun2014) report a weak increase in f0 on the initial syllable; Borise & Zentarski (2018) report lengthening on the initial syllable but no evidence of a pitch target. Since stress is both fixed and weakly realized, we do not expect any confounds related to lexical prominence.
1.4 Research question and hypotheses
We begin with a concise statement of our research question, followed by the hypotheses.
Research question
Since combinatorial possibilities in Georgian onsets are not constrained by the sonority hierarchy, could the timing of the consonantal gestures systematically reflect sonority sequencing?
Our broad proposal is one initially set forth in Chitoran (Reference Chitoran, Ball and Müller2016): that the sonority hierarchy and deviations from it can indeed best be understood through articulatory timing. One hypothesis (H1) predicts that we will see a hierarchical relationship between sonority shape and gestural timing, measured here on two dimensions: the amount of temporal overlap between the constriction gestures making up the syllable’s onset, and the observed variability of this overlap. Specifically, sonority rises are expected to be the most overlapped because they are well-suited for parallel transmission of information (Mattingly Reference Mattingly, Myers, Laver and Anderson1981), as discussed in Section 1.1. For the same reason, we expect rises to also be the least variable in overlap. The main point of this argument is that less variability in such measures would indicate a more stable timing relationship between the constriction gestures in question. A stable relationship indicates a temporal connection between gestures that is principled and phonological.
Hypothesis 1 (H1)
Temporal overlap of consonantal gestures in complex onsets depends on a hierarchical effect of increasingly open constrictions (Mattingly Reference Mattingly, Myers, Laver and Anderson1981). Sonority rises (e.g. /br/ or /gl/) will be more overlapped than plateaus (e.g. /mn/ or /phth/), which will be, in turn, more overlapped than falls (e.g. /rb/ or /md/), as show in the left panel of Figure 6. In addition, rises will be the least variable sonority shape.
Predicted overlap differences between sonority shapes (rise, plateau, fall) for H1 (left) and H2 (right).

As an alternate hypothesis (H2), we consider a solely perceptual basis for overlap patterns, based on Henke et al. (Reference Henke, Kaisse, Wright and Parker2012). These patterns will result in some significant differences between sonority categories, but their prediction is motivated by cluster-dependent segment recoverability and not by sonority per se.
Hypothesis 2 (H2)
Timing of consonantal gestures in complex onsets depends on segmental perceptual recoverability. Consonantal sequences in sonority plateaus (e.g. /phth/) will be the least overlapped. This is because the plateau sonority category is the only onset type where the recovery of the first consonant may be jeopardized if its release is obscured by a following non-sonorant segment with a similarly closed constriction (see also Chitoran et al. Reference Chitoran, Goldstein, Byrd, Gussenhoven and Warner2002). Sonority rises (e.g. /br/ or /gl/) and sonority falls (e.g. /rb/ or /md/) will be more overlapped than sonority plateaus but will not necessarily be significantly different from one another, as represented in the right panel of Figure 6.
The two components of Figure 6 show the predicted differences in overlap for each hypothesis.
2 Method
An Electromagnetic Articulography (EMA) of Georgian was conducted in order to assess the hypotheses above.
2.1 Participants and procedure
Three native speakers of Georgian participated in the study, two female (F1 and F2) and one male (M1). Data collection was limited to the three speakers because of the Covid-19 pandemic. All three were in their twenties and living in southern California at the time of their participation. All three were in their twenties and living in southern California at the time of their participation. They were recruited via word of mouth and an announcement circulated by the Georgian Cultural and Educational Center of Southern California. Data collection was limited to the three speakers because of the Covid-19 pandemic.
Data were collected using an Electromagnetic Articulograph AG501 (Carstens Medizinelektronik GmbH). Electromagnetic articulograph (EMA) data allows us to track the movement of the tongue and lips at a millisecond level of temporal resolution. This tracking is done by affixing sensors to key points in the vocal tract. The sensors’ movement is recorded as they move through a weak electromagnetic field generated by the EMA. Participants are seated in the center of the field, so all movements of interest occur within the electromagnetic field and are recorded.
For this study, we attached sensors at three points along the midsagittal line of the tongue: one on the tongue tip (TT), one on the tongue dorsum (TD), and one on the midpoint between TT and TD, referred to as TB. This means that TB was on the anterior and TD on the posterior part of the tongue dorsum. Vertical displacement of the TT sensor was used for coronal (dental and alveolar) segments; the vertical displacement of the TB sensor for palato-alveolar segments, and the vertical displacement of the TD sensors was used for velar segments. Two sensors were attached on the lip, one on the upper and one on the lower lip. The Euclidean distance between these sensors at each timepoint was calculated during data analysis, and the resulting variable – Lip Aperture (LA) – was used for labial segments. Sensors were also attached on the upper and lower incisor for reference and jaw movement respectively, and on the bridge of the nose and behind each ear for head correction. Audio was recorded with a Shure SCM262 microphone mixer at a 16 kHz sampling rate, with a Sennheiser shotgun microphone positioned a foot away from the participant’s mouth. Kinematic data was automatically synchronized with the external audio data.
Participants read the stimuli off of a computer screen placed approximately three to four feet from the EMA. Stimuli were presented in the Georgian orthography, but we present here the IPA transcription. Georgian orthographic versions are available in the appendix.
2.2 Experimental design and stimuli
Each test word appeared first in isolation and then in a frame sentence, without the isolated word disappearing from the screen. The phrase-medial tokens were analyzed for this study. The following frames were used:

The frame sentence was changed after participant F1 in order to simplify the phonetic material immediately following the test word (i.e. removing the somewhat unwieldy four consonant onset in ‘I said’) and to bracket the test word with syllables of the form m + vowel to avoid as much gestural blending as possible.
Tables 2 and 3 show the test words used in the experiment. Along with sonority shape, we include order of place of articulation as an independent variable, since previous research has shown that this factor does affect overlap in Georgian (Chitoran et al. Reference Chitoran, Goldstein, Byrd, Gussenhoven and Warner2002). After speaker F1’s participation, the test words from Table 2 were revised and expanded to the set in Table 3 in order increase the diversity of manner combinations and remove ejectives in order for all test consonants to be pulmonic. In both tables, words in opposite corners mirror one another. For example, front-to-back sonority rises contain the same consonants as back-to-front sonority falls. Plateau clusters across order conditions are also mirrors of one another where possible.
Test words for speaker F1. Bold marks the clusters analyzed in this study.

Test words for speakers F2 and M1. Bold marks the clusters analyzed in this study.

These stimuli were presented in blocks that included randomized stimuli for two other parallel studies, for a total of 67 stimulus sentences per block. Each block presented a different randomization of the stimuli. Speakers F1 and F2 had eight blocks, while M1 had seven due to time constraints.
Timepoints labelled for each gesture.

2.3 Analyses
Collected data were post-processed; they were head-corrected and rotated relative to the occlusal plane, which was recorded by having participants bite down on a hard plastic plane designed precisely for this purpose. Then, all data were semi-automatically labelled based on velocity criteria using the custom software Mview (Mark Tiede, Haskins Laboratory).
Figure 7 shows the relevant timepoints used for the analysis. From left to right, they are: the onset of the gesture; the constriction target achievement; the constriction release; and the offset of the gesture. The figure also shows the point of maximum constriction during the closure, as well as the points of peak velocity for the formation phase (i.e. the interval between gestural onset and release) and the release phase (i.e. the interval between release and offset) of the gesture. The stretch of time between the target and the release is referred to hereafter as the constriction duration. Constriction maxima were identified using velocity minima, and all other timepoints were identified using thresholds of velocity ranges between alternating velocity extrema (i.e. between a maximum and a minimum or vice versa). Velocity threshold was set to 20 $\%$
for all cases.
$\%$
for all cases.
For every test cluster, we calculated two distinct measures of overlap. The first quantifies what we are terming relative overlap, following Chitoran et al. (Reference Chitoran, Goldstein, Byrd, Gussenhoven and Warner2002) and Gafos et al. (Reference Gafos, Philip Hoole, Chakir Zeroual, Kühnert, D’Imperio and Vallée2010): when C2 gesture starts with respect to C1 constriction, measured as the temporal interval between the onset of C2 and the target achievement of C1 relative to the constriction duration of C1. The following equation and Figure 8 show how relative overlap was calculated, and how that measure can be visualized:
 \begin{equation*}{{\left( {{C_2}Onset} \right) - \left( {{C_1}Target} \right)} \over {{C_1}Constriction\;Duration}}\end{equation*}
Relative overlap schematization. Solid horizontal line (blue) indicates the interval measured, dotted horizontal line (green) marks the normalizing interval.

For relative overlap, negative values indicate more overlap; C2 begins before C1 reaches its target. A value of zero means that C2 begins when C1 reaches its target, and positive values indicate that C2 begins after C1 reaches its target.
The second measure quantifies constriction duration overlap, per Hoole et al. (Reference Hoole, Pouplier, Benus, Bombien, Spreafico and Vietti2013): the overlap of the constriction duration of the two consonant gestures, as defined in the following equation and Figure 9:
 \begin{equation*}{{\left( {{C_1}Release - {C_2}Target} \right)} \over {\left( {{C_2}Release - {C_1}Target} \right)}}\end{equation*}
Constriction duration overlap schematization. Solid horizontal line (blue) indicates the interval measured, dotted horizontal line (green) marks the normalizing interval.

For constriction duration overlap, positive values indicate overlap between the two constriction durations. A value of zero means that C2’s target and C1’s release coincide. Negative values indicate that C2 achieves its target after C1 is released. We use both constriction duration overlap and relative overlap because they measure overlap between different parts of gestures, allowing us to better approach the question of gestural timing.
Of the 442 tokens initially measured, 19 were removed from the data set due to issues with sensor tracking or participant speech error, and two outliers that were more than three standard deviations from the mean were removed as well. The final data set had 413 total observations.
Statistical analysis was done in R (R Core Team 2018) using linear mixed effects models from the lmerTest package (Kuznetsova, Brockhoff & Christensen Reference Kuznetsova, Brockhoff and Christensen2017), followed by post-hoc pairwise comparisons with Holm corrections, using the emmeans package (Lenth Reference Lenth2019). Plots were generated using the ggplot2 package (Wickham Reference Wickham2009). Model selection for both measures was done by starting with the maximal model both in terms of random and fixed effects. The maximal fixed effects structure was Sonority (with three levels: Rise, Plateau, and Fall), Order (with two levels: Front-to-Back and Back-to-Front), and their interaction. The maximal random effects structure had random slopes by Word, Speaker, and Frame Sentence. The minimal adequate random effects structure was determined using rePCA from the lme4 package (Bates et al. Reference Bates, Mächler, Bolker and Walker2015), and the minimal adequate fixed effects structure was determined using drop1 from the basic R stats package (R Core Team 2018).
To assess the variability of gestural overlap with respect to sonority shape, we calculated the standard deviation for each measure per word, per speaker, and ran linear mixed effects models on the resulting data set. We opted to use the standard deviation rather than a normed measure of variability (e.g. residual standard deviation) because the measures we used are already normalized. Model selection was done following the procedure described in the previous paragraph.
3 Results
3.1 Relative overlap results
The final model for relative overlap has fixed effects of Sonority and Order, and random intercepts by Speaker, Word, and Frame Sentence. Sonority (F(2) = 17.56, p < .0001, with Falls as the baseline) and Order (F(1) = 4.45, β = −.53, SE = .25, p < .05, with Back-to-Front as the baseline) are significant in the overall model. Table 4 summarizes the fixed effects results. Each pair of sonority shapes is significantly different from one another (β = −.89, SE = .31, p < .01 for Plateau vs. Rise; β = −.99, SE = .35, p < .01 for Fall vs. Plateau; β = −1.89, SE = .35, p < .001 for Fall vs. Rise). Falls are the only sonority shape in which C2’s movement to target does overlap with C1’s constriction. In plateaus and rises, there is no overlap; C2 begins after the release of C1. This is not the pattern predicted by either hypothesis. In fact, it is an exact reversal of the prediction of H1.
Summary of the linear mixed effects model for relative overlap, with Falls as the baseline for Sonority, and Back-to-Front as the baseline for Order. Bold indicates significant comparisons.

Back-to-front clusters (such as [thm] or [gd]) are less overlapped than front-to-back clusters (such as [mth] or [bg]). This replicates findings for stop–stop sequences in previous research on Georgian (Chitoran et al. Reference Chitoran, Goldstein, Byrd, Gussenhoven and Warner2002) and extends them to a wider range of cluster types, even those where neither consonant requires an audible release, like fricative–fricative clusters. As seen in Figure 10, this pattern occurs in all three sonority shapes.
Relative overlap as a function of Sonority Shape.

3.2 Constriction duration overlap results
The final model for constriction duration overlap had a fixed effect of Sonority, and random intercepts by Speaker, Word, and Frame Sentence. Table 5 summarizes this model. The only significantly different pairwise comparison is between sonority rises and sonority falls (β = .21, SE = .08, p < .05), though the fall-plateau comparison is marginally significant (p = .052). It is possible that with more data each pairwise comparison would reach significance We see (Figure 11) a trace of the same hierarchy, in the same direction, that was found in the relative overlap measure. Constriction durations overlap more in falls than in plateaus, and in plateaus more than rises. As mentioned in Section 3.1, this is not what is predicted by either hypothesis but is an exact reversal of the pattern predicted by H1 (see Figure 6 left, above). Of further interest is that the values of constriction duration overlap are negative across all sonority shapes; the uniformity suggests that this may be a language-wide timing pattern, which is consistent with the findings of Pouplier et al. (Reference Pouplier, Manfred Pastätter, Stefania Marin, Lentz and Kochetov2022).
Summary of the linear mixed effects model for relative overlap, with Falls as the baseline for Sonority. Bold indicates significant comparisons.

Constriction overlap by sonority shape. The y-axis shows normalized overlap values. They are all negative, indicating constriction duration lag in all sonority shapes.

Figure 12 shows a schematization of constriction duration overlap, as in Figure 9 above, but it illustrates lag, which is representative of the reduced overlap values we actually find.
Constriction duration overlap schematization with lag between the constriction durations. Solid horizontal line (blue) indicates the interval measured, dotted horizontal line (green) marks the normalizing interval.

As a result of the reduced overlap between consonant gestures, intrusive vocoids sometimes emerge between them.
3.3 Vocoids
Vocoids have been reported before in research on Georgian (Goldstein et al. Reference Goldstein, Chitoran and Selkirk2007), and we find vocoids in other data collected from these same participants for a different study (Crouch et al. Reference Crouch, Katsika and Chitoran2022). For purposes of counting and measuring the duration of vocoids, we defined them as vocalizations that occurred between the release of C1 and the target achievement of C2, that have a voicing bar and a distinct formant structure. Visibility of F2 determined the onset and offset of the measured interval. Vocoids are much shorter than full vowels: the mean duration of all intrusive vocoids in the data reported in this paper is 29 ms, with a standard deviation of 12.5 ms. Their distribution also differs by sonority shape: 56 $\%$
of sonority rises produced have intrusive vocoids, as do 25
$\%$
of sonority rises produced have intrusive vocoids, as do 25 $\%$
of sonority plateaus. Only 9
$\%$
of sonority plateaus. Only 9 $\%$
of sonority falls have intrusive vocoids, and over half of those occur in productions of the word /mdare/ ‘worthless’. Vocoids occur in words with all possible laryngeal settings for C1. However, our test words all have voiced consonants in C2 positions, so a voiced C2 could be a prerequisite for intrusive vocoids in Georgian, but the data here cannot answer that question. We do not investigate any further acoustic properties (e.g. formant structure) of the intrusive vocoids, because our experiments were not designed for this purpose. Crucially, knowledge of these properties, such as the exact quality of the vocoid, does not affect our following discussion. This is, however, a fruitful avenue for future research.
$\%$
of sonority falls have intrusive vocoids, and over half of those occur in productions of the word /mdare/ ‘worthless’. Vocoids occur in words with all possible laryngeal settings for C1. However, our test words all have voiced consonants in C2 positions, so a voiced C2 could be a prerequisite for intrusive vocoids in Georgian, but the data here cannot answer that question. We do not investigate any further acoustic properties (e.g. formant structure) of the intrusive vocoids, because our experiments were not designed for this purpose. Crucially, knowledge of these properties, such as the exact quality of the vocoid, does not affect our following discussion. This is, however, a fruitful avenue for future research.
Figure 13 shows the spectrogram and sensory trajectories for /bneda/ ‘epilepsy’ as produced by speaker F2. The vocoid is delimited on the spectrogram with dotted lines. Underneath the spectrogram are (bottom to top) trajectories for lip aperture, tongue tip vertical displacement, and tongue dorsum vertical displacement, with the gestures for /b/, /n/, and /e/, respectively, marked by rectangles. The shaded box in the rectangle is the constriction. The vocoid occurs when the vocal tract is relatively open (see Catford Reference Catford1988 on open transitions) as the lips release the closure for /b/ and the tongue tip is moving towards the target for /n/. Crucially, there is no tongue dorsum gesture associated with the vocoid; it is not a planned vowel but an artifact of the vocal tract configuration at that point in time.
Spectrogram and articulatory trajectories for /bneda/ with vocoid between dotted lines.

3.4 Variability
Our primary hypothesis (H1) proposes that the cross-linguistic preference for sonority rises will also be reflected in Georgian in the amount of variability in the timing of each sonority shape. We specifically predict that sonority rises will be the least variable shape, sonority plateaus an intermediate case, and sonority falls the most variable.
For relative overlap (Section 3.1), there was no difference in variability between sonority shapes. For constriction duration overlap (Section 3.2), however, there was. Table 6 shows the model summary, with sonority falls as the baseline. Sonority rises were significantly less variable than sonority falls, and a post-hoc pairwise comparison with a Holm correction showed that rises were also significantly less variable than plateaus (p = .01). This suggests that in complex onsets, the timing pattern for moving from more constricted to less constricted articulatory targets (i.e. as in rises) is, as predicted, more stable than the timing patterns in falls and plateaus. Strikingly, this is the case despite the fact the sonority rises have the highest number of intrusive vocoids. This further supports the analysis of vocoids as intrusive, without a gestural target.
Summary of the linear mixed effects model for standard deviation of constriction duration overlap, with Falls as the baseline for Sonority. Bold indicates significant comparisons.

Table 7 shows the means and standard deviations for constriction duration overlap by speaker and by sonority shape. Of note is the similarity across speakers, despite the use of different stimuli.
Means and standard deviations (SDs) of constriction duration overlap presented by speaker (F1, F2, and M1) and by sonority shape. Asterisk marks the pilot speaker, who had a different set of test words.

4 Discussion
4.1 Sonority and articulatory timing
Our results on gestural timing show a hierarchical effect of sonority shape. As the measure of constriction duration overlap shows, in all shapes, there is a lag between the constrictions of the two consecutive consonants in the onset. The lag is longest in rises and shortest in falls. Moreover, according to the measure of relative overlap, the movement to C2 constriction is initiated after C1 constriction is released in rises and plateaus, but during C1 constriction in falls. As an illustration of these timing relationships, the reader is referred to Figure 13, which depicts the gestures for the first syllable of /bneda/ ‘epilepsy’. The constrictions for /b/ and /n/, marked by the filled boxes on the lip aperture and tongue tip vertical displacement trajectories respectively, do not overlap. Furthermore, the movement of the tongue tip to the constriction for /n/ is not even initiated until after the /b/ constriction is released.
The detected hierarchical effect of sonority shape discussed above is reflected in the distribution of intrusive vocoids: they are most frequent in rises and least frequent in falls. Interestingly, despite having both the longest lags and the highest number of vocoids, sonority rises have the most stable timing between their C gestures, as reflected in the measure of variability of constriction duration overlap.
The observed hierarchical effect allows us to reject Hypothesis 2 (H2), which predicted that sonority plateaus would show more lag than rises or falls and that rises and falls would not differ significantly from one another. H2 proposed consonant recoverability as the sole motivation for timing patterns, and although the long lag in Georgian favors consonant recoverability, this is an across-the-board pattern, and not a case of timing modulation occurring in specific clusters to preserve consonant identity. It is likely a language-wide setting, which may have first arisen to ensure consonant recoverability in stop–stop sequences and was then phonologized and generalized to all sequences.
Hypothesis 1 (H1) did predict a hierarchical effect of sonority shape on gestural overlap. However, the observed direction of the effect – falls have the least lag, rises the most – is the opposite of what was predicted. H1 also predicted that sonority rises would present the least variable gestural overlap, and this is confirmed for the measure of constriction duration overlap (Section 3.2). These results suggest a principled relationship between sonority shape and gestural timing, but not one necessarily motivated by maximizing parallel transmission of information, as suggested in H1. Were this the case, sonority rises should have been the most overlapped because they are best suited to parallel transmission (Mattingly Reference Mattingly, Myers, Laver and Anderson1981). Further evidence that maximizing parallel transmission does not drive gestural timing in Georgian comes from the fact that consecutive C constrictions do not overlap regardless of sonority shape. This means that transmission is not parallel: the first constriction is released before the second is formed. This in turn gives rise to the overall prevalence of open transitions (Catford Reference Catford1988) in Georgian, and the tolerance for resulting vocoids can be related to the lack of phonemic schwa and of any widespread pattern of phonological vowel reduction. In a language without any of these features, we might expect less opportunity for open transitions because the resulting intrusive vocoid is more likely to be interpreted as a phonemic vowel.
Despite the prevalence of vocoids, our data show a clear difference in their occurrence depending on sonority shape (Section 3.3), which suggests that speakers time consonantal gestures differently depending on the order of constriction degree. When C2 begins after C1’s constriction is released, as is the case for all sonority rises and plateaus, the vocal tract is more open for C2’s formation. If phonation for C2 has already begun, during the movement to target, a vocoid can appear, as shown in Figure 13. The relatively earlier C2 onsets in sonority falls prevent these conditions from emerging even in the presence of a voiced C2. The question that then arises is what motivates the uneven distribution of vocoids across sonority shapes.
We argue that these differences originate in syllable-level, rather than either gesture- or segment-level concerns. Speakers plan their syllables with a single nucleus, which is a peak in the amplitude envelope. In kris, the presence of a vocoid would add sonority at around the same location as the nucleus (see Figure 14 left panel), but in rkebs the vocoid would enhance sonority closer to the left edge of the syllable, away from the nucleus, resulting in a pattern with two equally high sonority peaks, as illustrated in the right panel in Figure 14.
Sonority curves for /khris/ ‘blow-3sg.subj’ (left) and /rkhebs/ ‘antler-pl-dat’ (right), with intrusive vocoids.

We propose that this pattern of two peaks is more likely to be misinterpreted as a disyllabic sequence. It then follows that the presence of a vocoid in a fall is perceptually more disruptive than the presence of a vocoid in a rise. If that is the case, speakers could be relying on gestural overlap to avoid open transitions and thus an additional sonority peak in falls.
4.2 Typological versus language-specific perspectives
Our hypotheses and our discussion in Section 4.1 assume that typological markedness of sonority shapes would be relevant even for speakers of a language where sonority sequencing does not play a meaningful role. A hard form of this hypothesis would be one advanced in generative grammar, that universal markedness constraints are active for all speakers of all languages (e.g. Berent, Harder & Lennertz Reference Berent, Harder and Lennertz2011). A more nuanced view would be that these patterns may be further affected by language-specific pressures, and in languages like Georgian, which have sonority plateaus and falls, the efficient production–perception balance afforded by sonority rises can be outweighed or modulated by other factors, such as the need to ensure perception of all consonants in multimorphemic CC(…) sequences.
We could also take, however, a strictly language-specific perspective. If we consider only Georgian, markedness is no longer relevant to the discussion about sonority. From the viewpoint of a Georgian speaker, there is nothing ill-formed about a syllable onset like [rb] or [lp’] or longer sequences with sonority reversals, such as [k’rb]. Rather than being sensitive to the markedness of sonority shapes or completely uniform in cluster timing, Georgian speakers are modulating timing according to a different concern. As proposed in Section 4.1, speakers plan syllables to have a peak in the amplitude envelop and control the amount of consonant gesture overlap to achieve this plan. It is possible that syllables are identified solely by the presence of a vowel and the presence of a vocoid puts syllabification at risk in specific contexts. For this reason, recoverability of the syllable as a unit is the primary factor behind consonantal overlap in Georgian. Ensuring a felicitous syllabification also works to maintain lexical recoverability, since there are minimal or near-minimal pairs such as /phthila/ ‘lock of hair’ and /phithila/ ‘wick’.
This articulatory timing control is not expected to affect the coordinative structure of the syllable, as shown for other languages discussed in Section 1.3. This means there should not be phasing differences between the components of the syllable in Georgian, a hypothesis that is tested and supported in Crouch Reference Crouch2022 and Crouch et al. Reference Crouch, Katsika and Chitoran2022. This work presents evidence that C gestures in Georgian onsets are timed sequentially with each other. This coordination, although non-conforming to the cross-linguistic expectation for the c-center effect, is systematic, holding regardless of sonority shape, and possibly originated in the morphological system of Georgian (see Crouch Reference Crouch2022 for further argumentation). The absence of the c-center effect (Crouch Reference Crouch2022, Crouch et al. Reference Crouch, Katsika and Chitoran2022) and the failure of H1 to correctly predict the nature of the relationship between sonority and timing in this study are likely entwined. In languages with c-centering in complex onsets, syllables can be and likely are distinguished by having distinct right- and left-edge timing patterns (shown in Section 1.2.2). The competitive coupling in complex onsets specifically results in considerable overlap between the onset consonants (Figure 5). In these languages, we would also expect to see the hierarchical effect of sonority on overlap as predicted in H1; sonority rises are better able to preserve consonant recoverability while allowing for overlap (Mattingly Reference Mattingly, Myers, Laver and Anderson1981). Georgian, however, does not clearly distinguish onsets and codas in this way, and instead the relationship between sonority shape and timing is modulated by a need to preserve the syllable parse in the absence of the c-center. This perspective also provides a set of testable hypotheses about perception, to be examined in future research. For example, if our syllable perception-driven hypothesis is correct, we should expect different rates of CVCV (mis)perceptions for CCV sequences based on sonority shape and relative overlap value. We predict that, given the same low relative overlap value, sonority rises will be less likely to be perceived as CVCV disyllables than sonority falls.
In general, from a typological perspective, both cross-linguistic generalizations of SSP-driven markedness for sonority rises and AP-driven c-center effect on the onset are not directly applicable to the specific linguistic system of Georgian. Taking a language-specific approach, however, reveals that sonority concerns affect articulatory timing in a way that ensures the lexically specified syllabic parsing.
5 Conclusion
By using two measures of gestural overlap, we demonstrate (i) that multiple timing relationships need to be examined in order to fully understand how syllables are organized, and (ii) that the typologically unusual phonotactic system of Georgian is maintained through a careful balance of timing relationships. There is a language-specific setting of constriction duration lag which applies to all clusters and works to preserve the identity of consonants in sequences. The measure of relative overlap, which tells us when the constriction gesture of the second consonant starts relative to the target achievement of the first consonant, is significantly different across sonority shapes. We see earlier C2 onset in sonority falls than in plateaus, and earlier C2 onset in plateaus than in rises. This prevents open transitions in sonority falls, ensuring the production of a syllable with a single clear nucleus.
In light of these results, we propose that sonority sequencing can best be understood by considering articulatory overlap. Bridging sonority-based approaches and Articulatory Phonology sheds significant light on why sonority sequencing principles are able to capture so many phonotactic generalizations cross-linguistically, and, at the same time, why and how some languages are able to essentially disregard sonority as a factor for permissible complex onsets.
Acknowledgements
The authors would like to thank the editors and two anonymous reviewers for their feedback. We would also like to thank our participants, the UCSB Phonetics Circle, and the Haskins Laboratories Speech Group directed by Doug Whalen. This work was supported by the National Science Foundation (#1551428) and National Institutes of Health (NIDCD-DC-002717).
Appendix. Stimuli in Georgian orthography

Test words for speaker F1. Bold marks the clusters analyzed in this study.

Test words for speakers F2 and M1. Bold marks the clusters analyzed in this study.


 Open access