


1 Introduction
Articulation rate (AR) is a characteristic of speech that is generally associated with the notion of tempo. It refers specifically to the number of units of connected speech uttered per unit of time, and it excludes pausing and hesitations. Examples of units that express AR are syllables per second, syllables per minute, words per minute and phones per second. A notable feature of AR is its variability; the sources of this variation include factors such as region, style, age, gender, and utterance length.
Region is one of the more frequently analyzed factors. Studies of American English have revealed significant AR variation across regions – including Southern, Northern and Midwestern varieties – in text readings (Kendall Reference Kendall2013, Clopper & Smiljanic Reference Clopper and Smiljanic2015), in free speech (Coats Reference Coats2020), and in both read and free speech (Jacewicz et al. Reference Jacewicz, Fox, O’Neill and Salmons2009, Jacewicz, Fox & Wei Reference Jacewicz, Fox and Wei2010). Leemann (Reference Leemann2017) observed that ARs are more rapid in varieties of Swiss German spoken in eastern regions of Switzerland than those in western regions; by contrast, van Dommelen (Reference van Dommelen2017) found no differences in Norwegian ARs in text reading across 12 regions of Norway. A number of studies found that regional differences are related to the country where the language varieties are spoken. For example, speakers of Dutch varieties in the Netherlands articulate faster than those in Dutch-speaking regions of Belgium (Verhoeven, DePauw & Kloots Reference Verhoeven, DePauw and Kloots2004). Similarly, speakers of varieties of Spanish spoken in the western and southern regions of Spain have faster ARs than speakers of the Porteño variety in Argentina (García-Amaya, Kendro & Henrikson Reference García-Amaya, Kendro and Henrikson2022). In their comparison of American and New Zealand English, Robb, Maclagan & Chen (Reference Robb, Maclagan and Chen2003) observed that speakers from the US have a slower AR.
In French, the focus of this paper, AR has been studied mainly in European varieties spoken in Belgium, France, and Switzerland. Analyses reveal that speakers of ‘standard’ varieties of French tend to have faster ARs than speakers of ‘regional’ European varietiesFootnote 1 when reading a text (Miller Reference Miller2007, Avanzi, Obin et al. Reference Obin, Avanzi, Bordal and Bardiaux2012, Schwab & Racine Reference Schwab and Racine2013) or in both text readings and spontaneous speech (Avanzi, Schwab et al. Reference Avanzi, Schwab, Dubosson, Goldman and Simon2012, Schwab & Avanzi Reference Schwab and Avanzi2015). In addition, both ‘standard’ and regional speakers also tend to have faster AR rates than French speakers in contact situations, such as those in some French-speaking countries in Africa or in French L2 communities in Switzerland (Avanzi, Dubosson & Schwab Reference Avanzi, Dubosson and Schwab2012, Obin et al. Reference Obin, Avanzi, Bordal and Bardiaux2012).
Speaking style is also a significant correlate of AR. Interestingly, this factor can show opposite effects in different languages. In German, for example, ARs are significantly higher in reading than in spontaneous speech (Jessen Reference Jessen2007) while the opposite is found in American English (Jacewicz et al. Reference Jacewicz, Fox and Wei2010). Often speaking style can interact with factors such as region and age. For example, Hewlett & Rendall (Reference Hewlett and Rendall1998) report that in Scottish English conversation style is faster than reading; in addition, rural speakers have a faster AR in conversation style than urban speakers but there are no differences between the two groups in reading mode. In her study of four styles (spontaneous narrative, narrative recall, conversation, reading) in Hungarian, Bóna (Reference Bóna2014) finds that AR is fastest in reading and slowest in narrative recall; while young speakers showed significant differences in AR among the four styles there were no significant differences in ARs among the speech styles in the older group. In French, style also has a significant – but inconsistent – effect on AR. Some studies report faster ARs in text readings than in conversation style (Lucci Reference Lucci1983, Simon et al. Reference Simon, Auchlin, Avanzi, Goldman, Abecassis and Ledegen2010), while other studies report faster ARs in spontaneous productions than in text readings (Avanzi, Obin et al. Reference Obin, Avanzi, Bordal and Bardiaux2012, Avanzi, Schwab et al. Reference Avanzi, Schwab, Dubosson, Goldman and Simon2012, Schwab & Avanzi Reference Schwab and Avanzi2015).
Studies about the effect of age on AR find that, in general, younger speakers tend to have faster ARs than older speakers. This effect has been reported for different languages and different styles including spontaneous speech in Dutch (Verhoeven et al. Reference Verhoeven, DePauw and Kloots2004), four styles in Hungarian (Bóna Reference Bóna2014), and reading style in Norwegian (van Dommelen Reference van Dommelen2017) and Swiss German (Pellegrino, He & Dellwo Reference Pellegrino, He, Dellwo, Klessa, Bachan, Wagner, Karpiński and Śledziński2018). In American English, this age effect can have a curvilinear shape, whereby ARs increase and peak when speakers are in their 40s, and then decrease as speakers get older (Jacewicz et al. Reference Jacewicz, Fox and Wei2010). In the case of French, Schwab & Avanzi (Reference Schwab and Avanzi2015) report a significant interaction between age and style: while AR decreases in both reading and conversation as speakers get older, the age effect is greater in reading than in conversation. As well, the nature of this age-by-style interaction can differ across regions.
As for gender, studies do not show a consistent effect for this factor. One pattern that emerges is that males tend to have faster ARs than females across different styles (Verhoeven et al. Reference Verhoeven, DePauw and Kloots2004; see also the review in Weirich & Simpson Reference Weirich and Simpson2014), including in reading tasks (Kendall Reference Kendall2013, Leemann Reference Leemann2017, van Dommelen Reference van Dommelen2017). However, some studies – on American English (Jacewicz et al. Reference Jacewicz, Fox and Wei2010) and on French (Schwab & Avanzi Reference Schwab and Avanzi2015) – conclude that this gender effect is not consistent across regions or styles. Yet other studies find no effect of gender on AR (Malécot, Johnston & Kizziar Reference Malécot, Johnston and Kizziar1972, Clopper & Smiljanic Reference Clopper and Smiljanic2015).
Finally, utterance length – an internal factor that is measured as the length of inter-pause intervals (IPIs) – shows a regular effect on AR. In general, the longer the IPI, the faster the AR. This effect has been observed in Dutch (Quené Reference Quené2008), in American English (Kendall Reference Kendall2013, Clopper & Smiljanic Reference Clopper and Smiljanic2015; but Jacewicz et al. Reference Jacewicz, Fox and Wei2010 observe the opposite effect), and in French (Malécot et al. Reference Malécot, Johnston and Kizziar1972, Schwab & Avanzi Reference Schwab and Avanzi2015). We note that for French, Schwab & Avanzi (Reference Schwab and Avanzi2015) find that the IPI effect varies with region and style: in certain regions, the effect is stronger in conversation than in reading; in other regions, IPI length has the same effect in both styles. The authors consider that these interactions ‘highlight the necessity to take into account the utterance length in the studies of temporal variables’ (p. 101).
1.1 Scope of the present study
As this literature review shows, most of the research on AR variation in French deals with European varieties. Only a few studies have examined AR in varieties of French spoken in Canada, and AR was often just one of several variables specified in the study design. An early description by Gendron (Reference Gendron1966) reported that Quebec French is perceived as slower than European French. However, in an instrumental study based on reading sentences, Boudreault (Reference Boudreault1968) found no significant differences in AR between speakers from the Quebec City area (in the province of Quebec) and speakers from Paris. More recently, Kaminskaïa, Tennant & Russell (Reference Kaminskaïa, Tennant and Russell2016) studied spontaneous speech in two localities in Ontario: one (Hearst) where French is a majority language and where there is little contact with English, and the other (Windsor) where French is a minority language and where contact with English is high. ARs in both localities were similar, and there were no effects on AR of age or gender. In a related study that focused on the minority locality (Windsor), Kaminskaïa (Reference Kaminskaïa, Jonathan Barnes, Shattuck-Hufnagel and Veilleux2016) found significant stylistic differences – a faster AR in spontaneous speech than in reading style – but observed no effects of age or gender. Lancien & Côté (Reference Lancien and Côté2021) observed similar stylistic differences in a group of speakers from the Saguenay region of Quebec. To our knowledge, there are no studies that systematically analyze AR variation across different regions where Canadian French is spoken.
This paper attempts to fill this gap by examining AR in varieties spoken in three regions that are located in three different provinces. The regions are: Quebec City (in the province of Quebec), where the québécois variety is spoken, Tracadie (province of New Brunswick), where speakers use the acadien variety, and Windsor (province of Ontario), with the ontarien variety. These regions are situated far away from each other, over a geographic distance that covers about 1,800 kilometres (see Figure 1).
Map showing the locations of the three regions: Quebec City, Tracadie and Windsor (Google Maps 2022).

In addition to representing different varieties,Footnote 2 the three regions also represent a significant sociolinguistic aspect of the French language in Canada – language contact. French speakers across Canada interact with speakers of many languages, including Indigenous languages and immigrant languages, but the greatest contact is with speakers of English. Even though both English and French are the official languages of the country, there are many French-speaking communities that are located in regions and provinces where French can have limited or no official status locally and where speakers have varying degrees of contact with English. This contact can affect the frequency of use of French, and it can in turn impact French speakers’ linguistic production (Mougeon Reference Mougeon2006). We briefly describe the three regions with respect to degree of French–English language contact, as supported by social-demographic information from Canada’s 2001 census (Statistics Canada 2002). This census is closest to the period when the speech data were collected (from 2000 to 2005).
-
Quebec City is a large urban centre (population: 682,757), and the vast majority of residents (96.6 $\%$
) are native speakers of French. The city plays an important role in the cultural and political life of the province of Quebec, where French is the only official language and where francophones are a majority (81.6
$\%$
).
$\%$
) are native speakers of French. The city plays an important role in the cultural and political life of the province of Quebec, where French is the only official language and where francophones are a majority (81.6
$\%$
). -
Tracadie is a small rural town (population: 4,724) where 96.9
$\%$
of the population has French as their first language. It is situated in New Brunswick, the only province in Canada where both English and French are official languages; it is noteworthy that the francophone population in New Brunswick is in a minority situation (33.6
$\%$
). -
Windsor is a mid-sized urban area (population 208,402) where English is the main language of communication. Only 3.9
$\%$
of the city’s population are native francophones. English is the only official language of the province of Ontario, where the francophone population is a small minority (4.6
$\%$
).


Thus, the three regions in this study fall along a continuum of French–English contact that is based on the demographic proportion of French speakers in a region. Quebec City, where French is the local and provincial majority language, is at the low-contact end of this continuum; Windsor, where French is a minority language both locally and within the province, is at the high-contact end; Tracadie – where French is the local majority language but is in a province where French is a minority language – occupies an intermediate position on the continuum.
Our analysis of AR variation in these three regional varieties is made with attention to the other sources of AR variation discussed above: speaking style, speaker’s age and gender, and the length of inter-pause intervals (IPIs). The broader objective of our study is to contribute to a description of AR variation that includes a large number of varieties of French. As outlined below (in Section 3.1), the present study is based on the protocol of the Phonologie du français contemporain research program, allowing us to make comparisons with results from several studies of the (mainly European) varieties of French mentioned in the literature review (e.g. Avanzi, Schwab et al. Reference Avanzi, Schwab, Dubosson, Goldman and Simon2012, Obin et al. Reference Obin, Avanzi, Bordal and Bardiaux2012, Schwab & Avanzi Reference Schwab and Avanzi2015).
1.2 Research questions
With respect to our objectives, we are asking the following research questions:
-
1. What variation in AR can be observed among the three regional varieties of Canadian French, and hence among the three language contact situations?
-
2. Does speaking style have an effect on AR in these varieties?
-
3. What is the role of age and gender in the AR variation?
-
4. What effect does IPI length have on AR?
Following earlier findings that AR correlates with a scale of regionality in Europe and parts of Africa (Obin et al. Reference Obin, Avanzi, Bordal and Bardiaux2012), we hypothesize that Canadian ARs will correlate with region along the continuum of French–English contact mentioned above. A strong version of this hypothesis is: the low-contact end will have fastest ARs, the high-contact end the lowest ARs, and the intermediate contact level intermediate ARs.Footnote 3
Similarly, given the patterns found in earlier research, we expect to observe that AR is faster in spontaneous speech than in text readings, that older participants have slower ARs than younger speakers, and that males have faster ARs than females.
Finally, we expect to observe slower ARs in shorter IPIs and faster ARs in longer IPIs. We note that in earlier research Schwab & Avanzi (Reference Schwab and Avanzi2015) documented an IPI-by-style-by-region interaction but found no obvious explanation for this effect; as a result, we pay attention to the possibility of this interaction but make no specific hypothesis about it.
2 Materials and method
2.1 Materials
Materials used consisted of speech samples from the database of the Phonologie du français contemporain (PFC) research program (Durand, Laks & Lyche Reference Durand, Laks, Lyche, Durand, Laks and Lyche2002, Reference Durand, Laks, Lyche, Durand, Laks and Lyche2009). Modeled after the methodology used in variationist sociolinguistic interviews (see Detey et al. Reference Detey, Durand, Laks and Lyche2016 for more details), the PFC protocol includes several tasks of which two are studied here: reading and an informal conversation. The reading task was intended to elicit a more formal style. In this task, participants were asked to read – at a natural pace – a text that had been constructed to correspond to a newspaper article (the Le Premier Ministre ira-t-il à Beaulieu? text). The text included phonemic oppositions and other features of interest such as schwa and liaison. In the conversation task, participants spoke with a friend, a family member, or the fieldworker about everyday matters (such as family history, jobs, shopping). This guided conversation task prompted a less formal style that we refer to as spontaneous speech. Recordings of the interviews were made in each locality, usually at the participant’s home.
The 31 participants were native francophones; they were born, raised, and resided in the region where the interviews took place. Specifically, 8 were from Quebec City, 11 from Tracadie, and 12 from Windsor. Because the sample size is small, it is important not to generalize the results over entire dialect areas. The sample is also not perfectly balanced with respect to age and gender across all regions; in particular, there are only two male participants from Quebec City (see Figure A1 in the appendix). Nevertheless, the sample has eight participants between the ages of 17 and 60 in each region. This indicates that the sample is sufficiently balanced to mitigate the effects of confounding; that is, we can use a statistical model to estimate the effects of both region and age on AR. The participants had diverse education and socio-economic backgrounds, so these social factors were not included in the analysis.
2.2 Measurements and analyses
The data annotation and acoustic analysis were performed using Praat software (Boersma & Weeninck Reference Boersma and Weeninck2021). Initial semi-automatic transcription and segmentation of phones were carried out with EasyAlign (Goldman Reference Goldman2011) and followed by a manual verification and correction of segmental boundaries based on standard visual and auditory segmentation criteria (Peterson & Lehiste Reference Peterson and Lehiste1960). Syllable boundaries were established on the basis of actual pronunciation (and not on orthographic or phonological representations) with attention to features such as the (non-)realization of liaison and enchaînement consonants, schwa deletions or insertions, fusions of vowel sequences, and consonant cluster simplifications. Glides, aspiration of voiceless stops, glottal stops (produced in the context of liaison or enchaînement or at the beginning of a prosodic unit after a pause), and voiceless vowels that did not display formants were labelled as non-vocalic elements (that is, in an onset or coda position). All phonetic variants of /ʀ/ were treated as consonantal segments, and affricated dental stops were treated as one segment. Pauses, hesitations (including hesitations cooccurring with vowels), false starts, and speech overlaps were excluded from the analysis. Also excluded in the spontaneous data were discourse elements used as fillers – such as en tout cas ‘anyway’. IPIs were established for all sequences of syllables found between silent pauses (that is, silent intervals of 80 msec or more). The length of IPIs was measured in the number of phonetic syllables realized in this interval.
Articulation rate was measured as the number of syllables uttered in an IPI divided by the duration of the IPI (in syllables/second). This rate was calculated for each IPI greater than 2 syllables (i.e. for IPIs of three syllables and longer)Footnote 4 in each of the 62 recordings (31 speakers by two styles). In total, 2,818 IPIs were analyzed (1,318 in reading style and 1,500 in spontaneous style); that is, 21,785 syllables (9,808 in reading style and 11,977 in spontaneous style) with a total fluid, connected speech time of about 72.1 minutes (34.7 minutes of reading and 37.4 minutes of spontaneous speech).
Data were analyzed with linear mixed effects modeling with articulation rate as the dependent variable. The five predictor factors (region, style, age, gender, and IPI length) and their interactions were treated as fixed effects in the modeling; speakers were a random effect. Using linear mixed effects models allowed for the incorporation of continuous predictor variables, such as age and IPI length. As explained in Sections 3.1 and 3.2, logarithmic transformations of AR values and IPI lengths were applied in order to improve the fit of the model and to better satisfy assumptions associated with linear mixed effect models. Age and the logarithm of IPI were centered in the model-fitting process. These analyses were carried out using the nlme package in R (Pinheiro et al. Reference Pinheiro, Bates, Heisterkamp and Ranke2017, R Core Team 2020).
3 Results
3.1 Preliminary descriptive statistics
In this section, we present descriptive analyses that summarize several notable trends observed in the data. These trends motivate formal exploration of the relationship between AR and the predictor variables using a linear mixed effects model.
A summary of the distribution of articulation rates by region is presented in Figure 2. These plots show that AR is faster in Quebec City than in Tracadie and Windsor. Average ARs (reading and spontaneous styles combined) are as follows: Quebec City 5.862 syll/sec (SD 1.074), Tracadie 4.819 syll/sec (SD 0.943), Windsor 4.868 syll/sec (SD 1.122).
Boxplots for articulation rates by region and style; the dashed horizontal lines mark the overall mean for each region.

The boxplots in Figure 2 indicate moderate skewness in the distribution of articulation rates; specifically, faster ARs differ more from the mean than slower ARs. When the data from all regions and both styles are combined, the sample skewness is 0.43; for combined styles, the skewness statistic is considerably higher in Windsor (0.60) compared with Quebec City (0.20) and Tracadie (0.21). This led us to apply the logarithmic transformation to AR (see also Section 3.2).
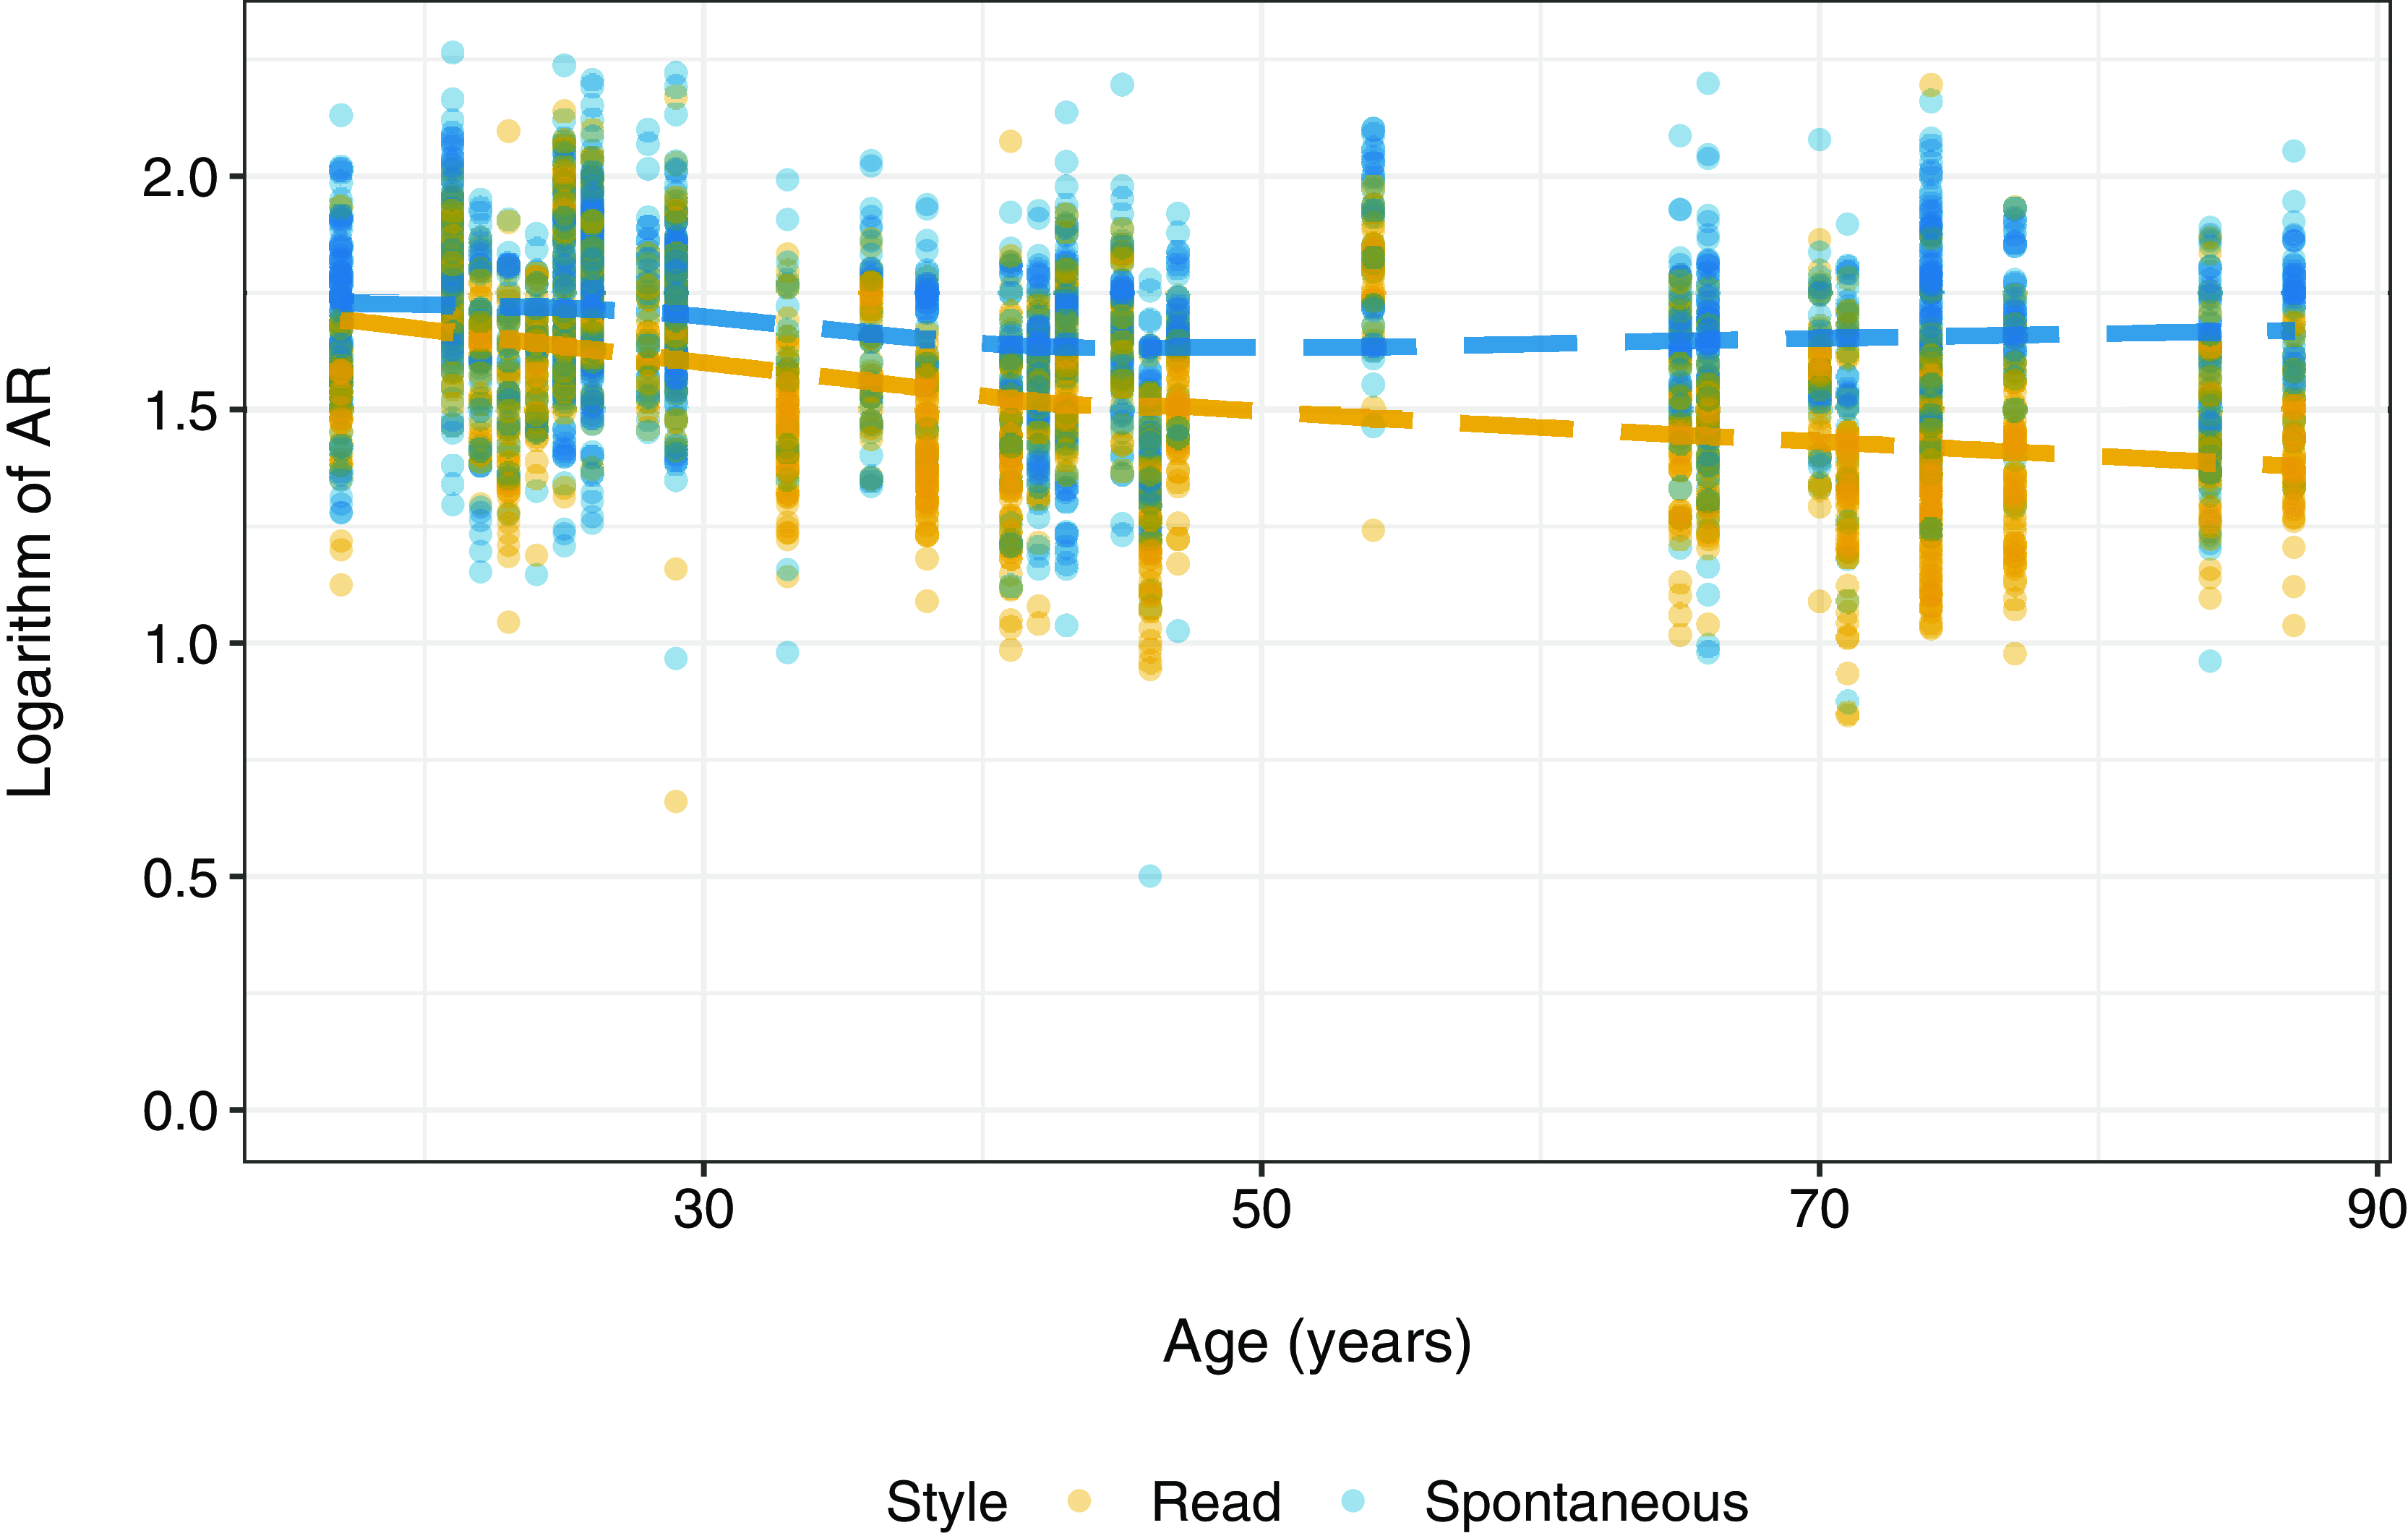
The relation of logAR with age and style is presented in Figure 3, which aggregates data from both genders and the three regions. The plot shows that there is a linear relationship between logAR and age. Also noteworthy is an effect of style: AR decreases with age, but only when participants are reading. Finally, AR generally appears to be faster for spontaneous speech.
Plot of logarithm of AR vs. age (grouped by style).
Another set of observed trends involves the factor of inter-pause intervals (IPIs). Descriptive statistics for IPIs, given in Table 1, point to differences in IPI length among the three regions. Application of a two-way repeated measures ANOVA showed that mean IPI differs substantially by region (F (2,28): p < .001) even after accounting for style. Post-hoc two-way repeated measures ANOVAs revealed that mean IPI in Windsor is significantly smaller than in Quebec City (F (1,18): p < .001) and Tracadie (F (1,21): p < .001), but Quebec City and Tracadie are more similar (F (2,17): p = .04). Only the differences in mean IPI between Windsor and the other two regions are significant after applying a Bonferroni correction. To satisfy the normality assumption, the logarithm of the IPI length was used as the dependent variable in the initial and post-hoc ANOVAs.
Descriptive statistics for IPI values (in number of syllables) by region.

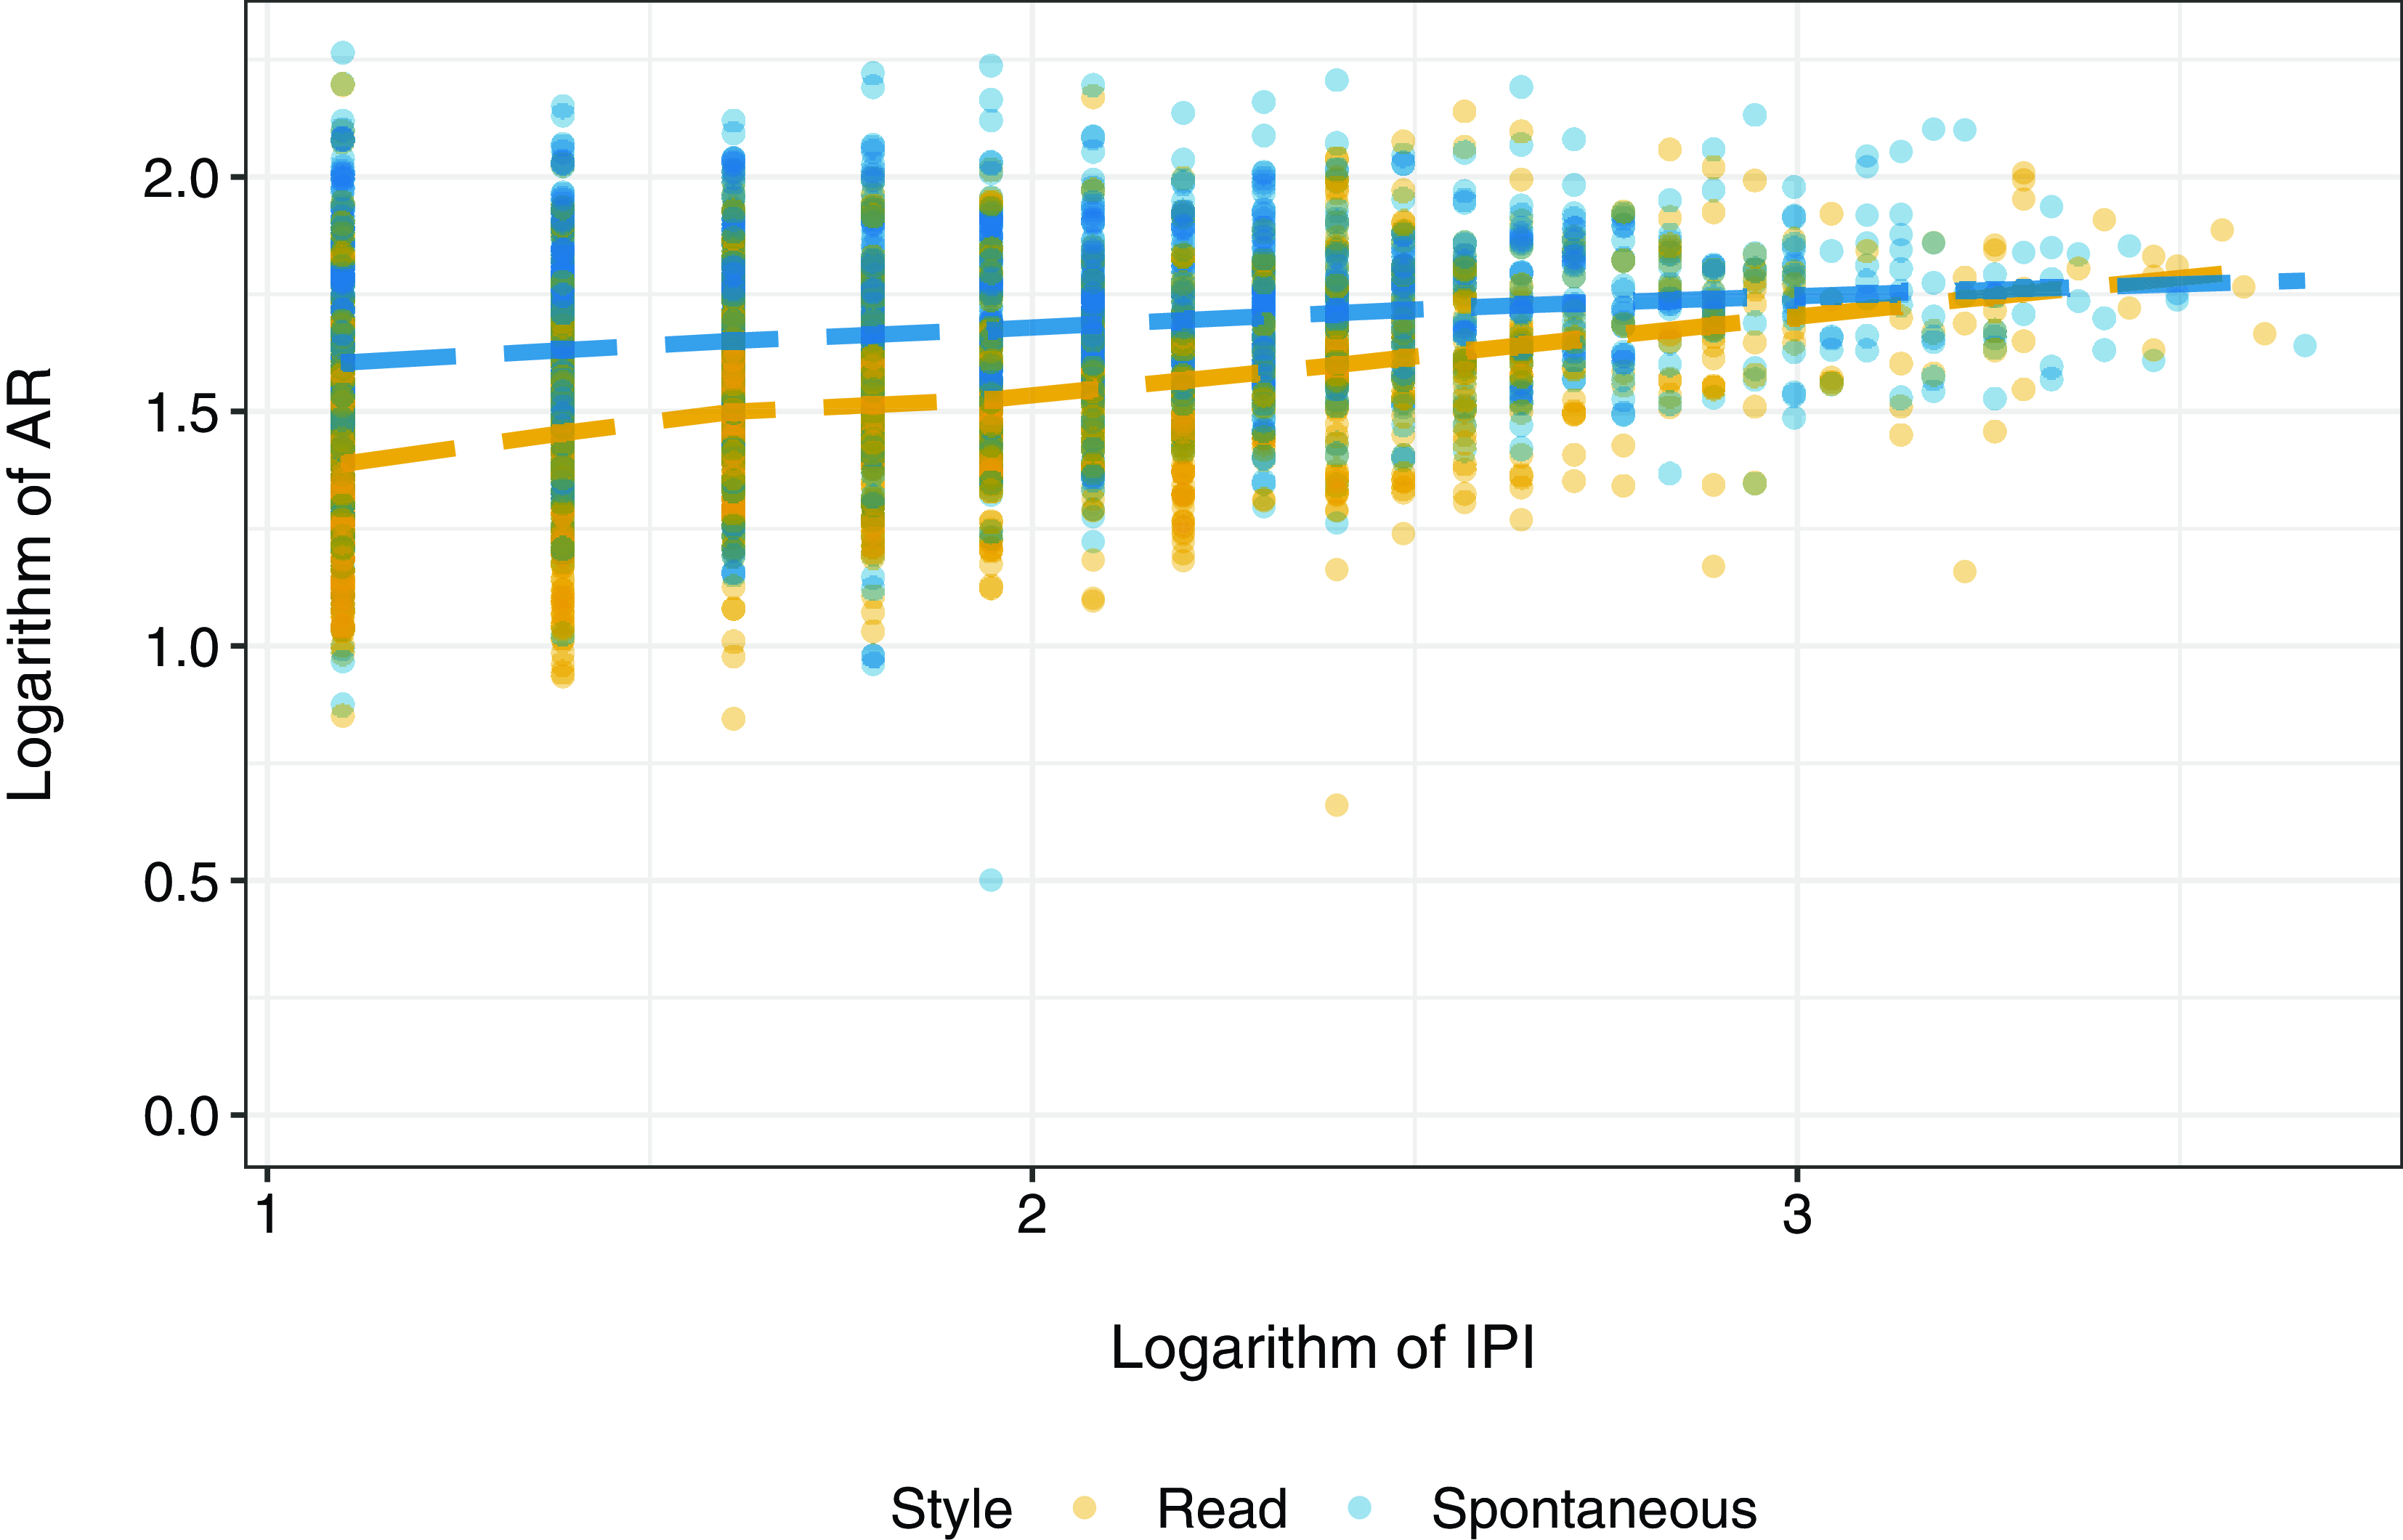
The skewness values in Table 1 indicate that the distribution of IPIs is highly skewed. Indeed, when the data for all regions and both styles are combined, the sample skewness for IPI is 1.92. Because shorter IPIs have higher frequencies than longer IPIs, we applied a logarithmic transformation to IPI values. Figure 4 illustrates how logIPI and region impact AR. The relationship between logAR and logIPI suggests that longer IPIs have faster ARs. Moreover, this relationship is maintained across the three regions, with generally higher AR values in Quebec City.
Plot of logarithm of AR vs. logarithm of IPI (grouped by region).

In checking for collinearity among the predictor factors, we noted that there is a potential correlation between IPI and region. A cursory comparison of average IPIs in Table 1 and average ARs in Figure 2 indicates the nature of this association: Quebec City has both the fastest ARs and the longest IPIs, while Tracadie and Windsor have slower ARs and shorter average IPIs. To motivate the inclusion of both logIPI and region in the main model, we considered potential collinearity between IPI and regions using generalized variance inflation factors (VIFs) (Fox & Monette Reference Fox and Monette1992); these were conducted with the car package in R (Fox & Weisberg Reference Fox and Weisberg2019). The VIFs showed no substantial collinearity between these two terms, or any other factors and interactions included in the model in Section 3.2 below.
The trends noted in these descriptive analyses suggest that region, style, age, and IPI are all predictors of variation in AR in our data. While no apparent trend was observed for gender, this factor was nevertheless included in linear mixed effects modeling.
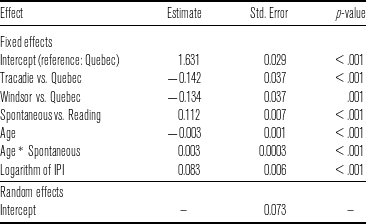
Estimated parameters (with standard error) of linear mixed effect model of logarithm of AR.
3.2 Linear mixed effects modeling
The best-fitted linear mixed effects model that accounts for variation in articulation rate is given in Table 2. The fixed effects are region, style, age with an age-by-style interaction, and logIPI; the model has a random effect for the speaker. The Q–Q plot of the residuals (see Figure A2 in the appendix) provides validation for this model. It shows that the residuals for this model are approximately normally distributed, diverging relatively symmetrically from the guiding line at both ends.
Figure A2 also presents the Q–Q plot of the residuals when this model is fitted using (untransformed) AR as the response variable. In this case, the residuals diverge substantially from the guiding line in the upper right corner of the plot, suggesting that this model routinely underpredicts the fast ARs. Because the distribution of residuals is less skewed when logAR is the response variable, the model with logAR as the response variable better satisfies the assumptions required by linear mixed effects modeling. This comparison adds further justification for our decision (in Section 3.1) to transform the AR values.
This model reveals four main patterns. First, the model confirms that region is a significant factor affecting AR in our samples. AR is significantly faster in Quebec City than in Tracadie or Windsor (see also Figures 1 and 3). Specifically, average AR in Tracadie is exp(−0.142) = 0.868 (95 $\%$
CI: (0.808, 0.932)) times as fast as the rate in Quebec City, while in Windsor, average AR is exp(−0.134) = 0.874 (95
$\%$
CI: (0.808, 0.932)) times as fast as the rate in Quebec City, while in Windsor, average AR is exp(−0.134) = 0.874 (95 $\%$
CI: (0.814, 0.939)) times as fast as in Quebec City. Because we have applied a logarithmic transformation to AR, this model describes how changes in region, style, age, and IPI length are associated with proportional change in AR. This allows us to account for greater variability for faster ARs, as observed in Figure 2. This means that AR will be more sensitive to changes in region (and the model’s other covariates) in situations when AR is higher. To consider the absolute difference between the average ARs in two scenarios, we need to completely specify their region, style, age, and IPI length values. Here, we provide some general context for how much faster or slower average AR is in each region for an average participant in the dataset. Compared to Quebec City, the average AR is roughly 0.720 syll/sec slower in Tracadie and 0.684 syll/sec slower in Windsor.Footnote
5
This pattern remains true when the other variables in the model are held constant.
$\%$
CI: (0.814, 0.939)) times as fast as in Quebec City. Because we have applied a logarithmic transformation to AR, this model describes how changes in region, style, age, and IPI length are associated with proportional change in AR. This allows us to account for greater variability for faster ARs, as observed in Figure 2. This means that AR will be more sensitive to changes in region (and the model’s other covariates) in situations when AR is higher. To consider the absolute difference between the average ARs in two scenarios, we need to completely specify their region, style, age, and IPI length values. Here, we provide some general context for how much faster or slower average AR is in each region for an average participant in the dataset. Compared to Quebec City, the average AR is roughly 0.720 syll/sec slower in Tracadie and 0.684 syll/sec slower in Windsor.Footnote
5
This pattern remains true when the other variables in the model are held constant.
With respect to style, AR is faster in spontaneous speech than in text readings in all three regions (see also Figure 3). The average AR for spontaneous conversations is exp(0.112) = 1.119 (95 $\%$
CI: (1.103, 1.134)) times faster than in readings for an individual who is 45.41 years of age (the average age of the participants from the dataset). For an average participant of that age, this suggests that AR is 0.552 syll/sec faster when speaking spontaneously.Footnote
6
$\%$
CI: (1.103, 1.134)) times faster than in readings for an individual who is 45.41 years of age (the average age of the participants from the dataset). For an average participant of that age, this suggests that AR is 0.552 syll/sec faster when speaking spontaneously.Footnote
6
The style-by-age interaction indicates that this difference between average AR for the two styles becomes more pronounced as age increases. In other words, AR decreases with age, but only when speakers are reading (see Figure 3). In reading, the articulation rate changes by a factor of exp(−0.003) = 0.997 (95 $\%$
CI: (0.996, 0.998)) for each year increase in age; this is the case when region and IPI are held constant. For an average participant in the dataset, this implies that a 10-year increase in age would be associated with 0.138 syll/sec decrease in average AR when reading.Footnote
7
In spontaneous speech, there is no significant change in articulation rate when age increases and when region and IPI are held constant.
$\%$
CI: (0.996, 0.998)) for each year increase in age; this is the case when region and IPI are held constant. For an average participant in the dataset, this implies that a 10-year increase in age would be associated with 0.138 syll/sec decrease in average AR when reading.Footnote
7
In spontaneous speech, there is no significant change in articulation rate when age increases and when region and IPI are held constant.
With respect to IPI, average AR increases as the number of syllables in IPI increases. Specifically, when IPI length doubles, the AR increases by 100 * (20.083 – 1) = 5.94 $\%$
(95
$\%$
(95 $\%$
CI: (5.03
$\%$
CI: (5.03 $\%$
, 6.86
$\%$
, 6.86 $\%$
)) when region, age and style are held constant. For an average participant in the dataset, the average AR increases by roughly 0.293 syll/sec when the IPI length doubles.Footnote
8
$\%$
)) when region, age and style are held constant. For an average participant in the dataset, the average AR increases by roughly 0.293 syll/sec when the IPI length doubles.Footnote
8
3.3 Gender and interactions with IPI
In this section we draw attention to two items that were among the factors tested in the model selection process but do not appear in the final model. First, modeling showed that there is no effect of gender on AR (Wald: $\chi$
2
(1), p = .58).Footnote
9
In addition, there are no interactions of gender with region (Wald:
$\chi$
2
(1), p = .58).Footnote
9
In addition, there are no interactions of gender with region (Wald: $\chi$
2
(3), p = .22), style (Wald:
$\chi$
2
(3), p = .22), style (Wald: $\chi$
2
(2), p = .65), age (Wald:
$\chi$
2
(2), p = .65), age (Wald: $\chi$
2
(2), p = .86), or logIPI (Wald:
$\chi$
2
(2), p = .86), or logIPI (Wald: $\chi$
2
(2), p = .36).
$\chi$
2
(2), p = .36).
A second item of interest is the possible interaction of IPI with region and style. None of the two-way or three-way interactions were significant and, therefore, they were not added to the model (region-by-style-by-logIPI: Wald: $\chi$
2
(5), p = .23; region-by-logIPI: Wald:
$\chi$
2
(5), p = .23; region-by-logIPI: Wald: $\chi$
2
(2), p = .63; style-by-logIPI: Wald:
$\chi$
2
(2), p = .63; style-by-logIPI: Wald: $\chi$
2
(2), p = .63).
$\chi$
2
(2), p = .63).
Figure 5 plots the relation between logAR and logIPI for both styles. The two horizontal lines in the plot appear to be roughly parallel for most logIPI values, indicating that logAR increases with logIPI at about the same rate for reading and spontaneous speech styles. The lines overlap near the right end of the plot, suggesting that AR may not differ by style for extremely large IPIs. However, there are noticeably fewer data points to fit the lines in this region of the plot, and hence the relationship between AR and style might not be reliably estimated for very large IPIs – when logIPI is greater than about 2.75. This figure provides visual justification for not including a style-by-logIPI interaction in the model.
Plot of logarithm of AR vs. logarithm of IPI (grouped by style).
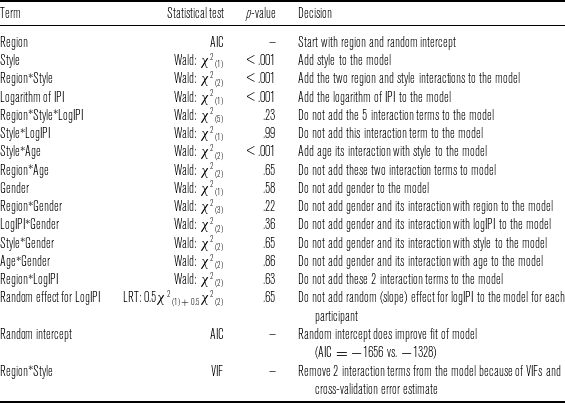
We also tested for a region-by-style effect, which appeared to be significant (p < .001) in one of our models. However, cross-validation error (Fang Reference Fang2011) in the resulting model was greater than in the model reported above (3.17 vs. 3.09). This suggests that the model retained is more stable and not sensitive to changes in the database (e.g. a change in participants). Please see Table A1 in the appendix for the complete model selection process.Footnote 10
4 Discussion
The main goal of this study was to examine variation in ARs in three regional varieties of French spoken in Canada, with a view to extending information from earlier research on other (mainly European) varieties of French. In addition to region, the study also considered other factors susceptible to affect AR variation: three external factors – style, age and gender – and one internal factor – length of IPI. Results indicate that, with the exception of gender, all of these factors are significant predictors of AR.
4.1 Effect of region
The results for the region factor show a clear contrast between Quebec City, that has a faster AR, and Tracadie and Windsor, that have slower but very similar rates. While the result does not support the hypothesis of a linear correlation between the French–English contact continuum of the three regions and their ARs, it does reveal a binary distinction between a low-contact region (Quebec City) and the two regions that have greater degrees of contact (Tracadie and Windsor). This distinction parallels the association between AR and the degree of ‘regionality’ that Obin et al. (Reference Obin, Avanzi, Bordal and Bardiaux2012) observed among French-speaking communities in Europe and Africa. Specifically, speakers from ‘standard’ varieties have faster ARs than those from ‘regional’ varieties, who, in turn, have faster rates than speakers in contact situations. A quantitative comparison with our Canadian results is appropriate given that Obin et al.’s study used the same PFC protocol as our study. The comparison, based on reading ARs, is as follows: the fastest ARs are among speakers from major centres in France such as Paris and Lyon (5.9 to 6.1 syll/sec) and are similar to those in Quebec City (5.86 syll/sec); slower rates are found in ‘regional’ European varieties such as in Geneva, Switzerland and Liège, Belgium (5.2 to 5.8 syll/sec); the slowest ARs are found in contact varieties such as those in Senegal and German-speaking Switzerland (4.5 to 5.3 syll/sec) and are comparable to ARs in Tracadie (4.82 syll/sec) and Windsor (4.87 syll/sec).
This comparison contributes to a general phonetic description of French by providing valuable information about regional and social variation in varieties spoken on several continents. It also demonstrates the contribution – to such a description – of articulation rate, a feature that is mentioned only infrequently in descriptions of language dialects. The Canadian varieties and those from other parts of the French-speaking world appear to follow a fairly well-defined pattern: low-contact varieties appear toward the faster range of ARs, and greater-contact varieties are at the slower range. Whether this association reflects normative forces that occur over the large geographic space where French is spoken or whether the ARs represent more local norms is a question for further investigation.
A limitation of the present study is that our use of region as an external factor provides only a very general gauge of the linguistic impact of language contact. The French–English contact continuum that we used to rank the Canadian varieties is based on demographic information that is measured at the level of the community, that is, whether the degree of concentration of francophones is a majority or a minority at local and provincial levels. A possible refinement of this approach would be to formulate one or more external factors that measure contact at the level of the individual speaker. Such factors could quantify, for example, how frequently a speaker uses French and/or English in different situations, and how proficient a speaker is in each of the contact languages. Mougeon & Beniak (Reference Mougeon and Beniak1991) find that both community- and individual-level factors are significant – and independent – predictors of sociolinguistic variation in morphosyntactic features of Ontario French. An example of the use of individual-level measures in studies of AR is Nagy & Brook (Reference Nagy and Brook2020) who observe that language use, as measured by self-reported language use scores, is a significant predictor of AR in the spontaneous speech of speakers of heritage languages (Italian, Russian, Ukrainian) in Toronto, Canada. Other examples are found in research on AR in second-language acquisition (e.g. Bradlow, Kim & Blasingame Reference Bradlow, Kim and Blasingame2017, Højen Reference Højen2019).
4.2 Effect of age, style and gender
Results for the other external factors – speaking style, age, and gender – are largely consistent with results of earlier studies, and they confirm our hypotheses to varying degrees.
Our results for speaking style show that reading is slower than spontaneous speech. This effect is independent of region. While this result aligns with some of the earlier research on other varieties of French (Schwab & Avanzi Reference Schwab and Avanzi2015), a number of studies of French found the opposite result – a faster rate for reading than for spontaneous speech. A plausible explanation of these opposing results is probably related to methodological differences; the studies that found that reading is slower than spontaneous speech also followed the PFC protocol. It is possible that there is an effect of the order of the reading task during the interview or the nature of the instructions given to participants. What seems more relevant here is that there is an effect of speaking style on AR variation in French, regardless of methodological approach.
Our results also confirmed the hypothesis that age is a significant predictor of AR. This is in line with previous research that found that younger speakers have faster ARs than older speakers. In addition, modeling showed an age-by-style interaction: AR decreases with age in reading but there is no change in AR with age in spontaneous speech; this effect carried over all three regions. This result is similar to findings for European French varieties. Schwab & Avanzi (Reference Schwab and Avanzi2015) also found an age-by-style interaction, although they report no impact of age in Belgian varieties of French and a slower rate among older speakers in both styles in some regional French and Swiss varieties. A possible explanation of the age-by-style interaction is that older speakers have a slower AR because they may be reading more carefully than younger speakers. Also likely is that older speakers may also be experiencing neuro-physiological changes that are related to regular aging and that can affect speech production (see Pellegrino et al. Reference Pellegrino, He, Dellwo, Klessa, Bachan, Wagner, Karpiński and Śledziński2018).
Results did not confirm our hypothesis about the role of gender. Unlike earlier studies on French (Schwab & Avanzi Reference Schwab and Avanzi2015) and other languages (Verhoeven et al. Reference Verhoeven, DePauw and Kloots2004, Kendall Reference Kendall2013, van Dommelen Reference van Dommelen2017) that report that male speakers have faster ARs than female speakers, our modeling found no significant effect of gender on AR. It is noteworthy that the effect of this factor is not consistent across the literature, as a number of studies also observed no gender effect on AR. A possible interpretation of this result is that both genders demonstrated similar sensitivity to stylistic variation with respect to AR.
4.3 Effect of IPI
The internal factor in this study, IPI length, also has a significant effect on AR. As hypothesized, shorter IPIs were pronounced with slower ARs, and longer IPIs with faster ARs. Similar results have been reported for other languages such as Dutch (Quené Reference Quené2008), American English (Kendall Reference Kendall2013, Clopper & Smiljanic Reference Clopper and Smiljanic2015), and French (Malécot et al. Reference Malécot, Johnston and Kizziar1972, Schwab & Avanzi Reference Schwab and Avanzi2015). In our study, this effect is the same in both reading and spontaneous speech styles, and modeling shows no interactions of logIPI with other factors.
The absence of interactions with IPI is a noticeable difference with the results reported for European French varieties. Schwab & Avanzi (Reference Schwab and Avanzi2015) find a significant interaction of IPI length with both region and style: in certain regions, the IPI effect is stronger in conversation than in reading; in one region, the opposite is true; yet in others, IPI length has the same effect in both styles. Our results suggest that the three Canadian regions fall into the last category. The plot in Figure 5 shows that logAR increases with logIPI at about the same rate for both reading and spontaneous styles, indicating the absence of an interaction of IPI length with styleFootnote 11 .
Another important finding is that the Canadian data show considerable variation in the length of IPI. Average IPIs (see Table 1 above) have a wide range (6.03 to 9.85 syll) when compared with European varieties (10.50 to 12.71 syll) (Schwab & Avanzi Reference Schwab and Avanzi2015). Furthermore, there are significant differences in IPI lengths among the Canadian varieties, and average IPIs show an irregular association with ARs. On the one hand, speakers in Windsor have significantly shorter IPIs than those in Tracadie (6.03 syll vs. 8.74 syll; see Section 3.1) but both groups have very similar ARs (4.868 syll/sec and 4.819 syll/sec); on the other hand, participants in Tracadie and Quebec City have similar IPIs (8.74 syll and 9.85 syll), even though average AR in Tracadie is significantly slower than in Quebec City (4.82 vs. 5.85 syll/sec). This irregular pattern in IPIs suggests that there may be other sources of AR variation related to utterance length (that is, IPI length), and we suggest that they are likely related to prosodic phrasing. In French phonology, the minor phrase (Accentual Phrase) and the major phrase (Intonation Phrase) are the two main levels of phrasing above the syllable. Each IPI is normally composed of a combination of these phrases. Because the syllables at the end of both minor and major phrases are lengthened, there is an obvious effect on AR. Thus, the duration of the phrase-final lengthening and the make-up of IPIs – in terms of the minor and major phrases in each IPI – are two possible factors that may further elucidate variation in AR and that should be investigated further.
A final observation is that the average length of IPIs tends to be shorter in Canadian varieties than in European varieties. In reading, for example, Canadian varieties have an average IPI length of 7.44 syll while in European varieties it is 12.07 syll, indicating that Canadian speakers are reading the text in smaller ‘chunks’ than European speakers. An earlier study by Grosjean & Deschamps (Reference Grosjean and Deschamps1975) found that AR is significantly slower and IPIs (referred to as ‘les suites sonores’) are significantly shorter in English than in French. While this study followed a different methodology from our study, the main result suggests a further line of research that includes comparisons with English spoken in the three Canadian regions, including the analysis of English productions by monolingual and bilingual speakers in two different styles.
4.4 Comparison with previous studies of Canadian French
In the context of this discussion about the influence of various factors – region, style, age, gender, IPI – on AR variation, it seems appropriate to make a few comparisons with the previous research on Canadian French mentioned in Section 1.1. While these earlier studies did not consider all the factors analyzed in this paper, their results can be situated in the context of a broader description of AR variation in regional varieties of Canadian French.
The earliest study, Boudreault (Reference Boudreault1968), focused only on regional differences between the Quebec City area and Paris. In terms of age and gender, the sample was limited to young-adult, male participants. No significant regional differences were found, a result that roughly parallels our observation that speakers from Quebec City have ARs that are in the same range as speakers from ‘standard’ varieties in European centres such as Paris. In absolute terms, the ARs observed by Boudreault (Reference Boudreault1968: 137–141) appear to be slower – 5.25 syll/sec in Quebec and 5.24 syll/sec in Paris – than those discussed above (reading ARs fall in the range from 5.86 to 6.1 syll/sec). However, Boudreault based his observations on the reading of 70 short sentences and not on the reading of a text, which is an important methodological distinction.
Kaminskaïa et al. (Reference Kaminskaïa, Tennant and Russell2016) examined several factors – region, age, gender – but limited their study to one style, spontaneous speech. Their sample included 24 speakers from two contact communities in Ontario – a local francophone majority (Hearst) and a local minority (Windsor). The authors’ finding that there are no regional differences coincides with the pattern presented here: ARs in communities with greater French–English contact have similar ARs. The authors also found no significant effects of age and gender, which also corresponds to the results for spontaneous speech reported in our study.
Lancien & Côté (Reference Lancien and Côté2021) highlighted the role of style and gender in their analysis of the ARs of 20 young adults from the Saguenay region in the Province of Quebec. Their results for style overlap with those reported here: average ARs in reading style were slower (4.84 syll/sec) than in three types of spontaneous speech, where ARs varied from 5.53 syll/sec, in conversation with a local interlocutor, to 6.09 syll/sec, when the interlocutor is the speaker’s spouse. Gender was not a significant predictor of AR, although the authors noted a small style–by–gender interaction.
Only one of the earlier studies included the IPI factor. Lancien & Côté (Reference Lancien and Côté2021) used the IPI unit to measure average ARs, but they do not mention an influence of IPI on AR. It is important to note that in all the other previous studies AR was measured globally, that is, as an average of all syllables in the speech sample, without attention to smaller local units such as IPIs. Among these studies is Kaminskaïa’s (Reference Kaminskaïa, Tennant and Russell2016) preliminary ANOVA–based analysis of the Windsor sample that we have presented in this paper. The author found the same stylistic difference – reading style is slower than conversation style – but did not identify the age–by–style interaction as a significant predictor when age was treated as a binary (that is, categorical) factor. This suggests that measuring AR on the basis of local units such as IPI provides a greater number of data points and therefore greater statistical power to detect the possible effects associated with other factors. It also illustrates that in comparison with traditional ANOVA – which requires that continuous factors such as age and IPI length be treated as categorical – linear mixed effects modeling offers more flexibility to accurately characterize the relationship between AR and age.
5 Conclusions
This study examined variation in articulation rate in three Canadian French varieties with a view to making comparisons with earlier research on other varieties of French. The main result is that regional differences in articulation rate are related to a French–English contact continuum that is based on the degree of concentration of francophones in each region. Regions where there is greater French–English contact – Tracadie and Windsor – have slower ARs than a region where there is a lower degree of French–English contact – Quebec City. This result presents parallels with patterns of AR variation observed in research on standard, regional and contact varieties spoken in Europe and Africa. It also highlights the possible role of social demographics in language contact when making comparisons among varieties of a language.
The effects of other external factors on AR – speaking style, age, gender – are generally consistent with results from previous studies. Spontaneous speech is faster than read speech; articulation rate decreases with speaker’s age in reading but not in spontaneous speech; gender is not a significant predictor of articulation rate. These effects are independent of regional differences.
Finally, IPI length is a significant predictor of articulation rate in Canadian French: articulation rates are directly correlated with length of IPIs. This factor does not interact with style and region, unlike in European varieties, where this interaction is a significant source of AR variation. However, mean IPI lengths vary significantly among the three Canadian regional varieties, and they are generally shorter than mean IPI lengths in European varieties. This suggests that further investigation should focus on possible differences in the prosodic structure of regional varieties of French spoken in Canada.
Acknowledgements
We are grateful to the speakers from Quebec City, Tracadie and Windsor who generously agreed to participate in the ‘Phonology du français contemporain’ project. We also thank two anonymous reviewers for their insights and helpful comments. This work was supported by the Social Sciences and Humanities Research Council of Canada (IG grant 1675-50656-10104 to S. Kaminskaïa) and by Acfas (travel grant CFC0012 to W. Cichocki).
Competing interests
The authors declare none.
Appendix
Demographic analysis for the participants by age, region and gender.

Q–Q plots for linear mixed effects models with AR (left) and logAR (right) as the response variable.

Complete model selection process with p-values.


 Open access