


Introduction
Dry edible bean is an economically important crop and an important source of protein for human consumption produced yearly on around 30 million ha worldwide (Schmutz et al. Reference Schmutz, McClean, Mamidi, Wu, Cannon, Grimwood, Jenkins, Shu, Song, Chavarro, Torres-Torres, Geffroy, Moghaddam, Gao, Abernathy, Barry, Blair, Brick, Chovatia, Gepts, Goodstein, Gonzales, Hellsten, Hyten, Jia, Kelly, Kudrna, Lee, Richard, Miklas, Osorno, Rodrigues, Thareau, Urrea, Wang, Yu, Zhang, Wing, Cregan, Rokhsar and Jackson2014; Yonts et al. Reference Yonts, Haghverdi, Reichert and Irmak2018). The United States is the fourth largest dry edible bean producer, with an annual average production of 1.33 million tons from 2010 to 2020 (Lucier and Davis Reference Lucier and Davis2020; Statista 2021a; USDA AMS 2020). In the United States, dry edible bean production primarily occurs in North Dakota, Michigan, Minnesota, and Nebraska, representing 86% of the total production in 2020 (Lucier and Davis Reference Lucier and Davis2020). Nebraska is the largest great northern bean producer and the second largest pinto bean producer in the United States (NDA 2020; USDA AMS 2020), where 74% of the production is obtained in the Panhandle region—the western part of the state (Thomas et al. Reference Thomas, Hein and Kamble2001). The semi-arid climate and coarse-textured soil in western Nebraska requires dry edible bean producers to rely on irrigation.
Palmer amaranth is a dioecious, small-seeded, annual, broadleaf species native to the Sonoran Desert, an area that encompasses southern California, Arizona, and the Mexican states of Baja California and Sonora (Spaunhorst Reference Spaunhorst2016). Palmer amaranth is among the most troublesome and economically important weed species in row crops in the United States as a result of its high fecundity, high competitiveness, high water use efficiency, and rapid growth rate (Chahal et al. Reference Chahal, Aulakh, Jugulam, Jhala, Price, Kelton and Sarunaite2015; Chandi et al. Reference Chandi, Jordan, York, Milla-Lewis, Burton, Culpepper and Whitaker2012; Korres et al. Reference Korres, Norsworthy and Mauromoustakos2019; Tekiela and Sbatella Reference Tekiela and Sbatella2017). Palmer amaranth is a C4 plant that grows taller and accumulates more biomass than other species in the Amaranthaceae (pigweed) family (Bertucci et al. Reference Bertucci, Jennings, Monks, Schultheis, Louws and Jordan2019; Spaunhorst Reference Spaunhorst2016). A single female Palmer amaranth plant can produce >100,000 seeds when grown in competition with crops, and up to 600,000 seeds when grown in isolation (Fine Reference Fine2020; Keeley et al. Reference Keeley, Carter and Thullen1987). Palmer amaranth seed can easily be transported and disseminated by wind, irrigation water, animals (viviparous and mammals), contaminated agricultural machinery, contaminated cover crop seed, manure, and contaminated livestock feed sources (Farmer et al. Reference Farmer and Webb2017; Norsworthy et al. Reference Norsworthy, Griffith, Griffin, Bagavathiannan and Gbur2014; Spaunhorst Reference Spaunhorst2016). The USDA’s Animal and Plant Health Inspection Service estimated that 81% of the United States is ideal for the establishment of Palmer amaranth and emphasized that limiting its geographic spread is a challenge to economies, environments, and societies (PPQ 2020).
Because of its rapid growth rate, Palmer amaranth can be a robust competitor with crops for light, nutrients, space, and moisture (Mahoney et al. Reference Mahoney, Jordan, Hare, Leon, Roma-Burgos, Vann, Jennings, Everman and Cahoon2021). Yield reduction from Palmer amaranth interference has been reported as high as 91%, 68%, 79%, 63%, 92%, and 67% in corn (Zea mays L.) (Chahal et al. Reference Chahal, Aulakh, Jugulam, Jhala, Price, Kelton and Sarunaite2015; Massinga et al. Reference Massinga, Currie and Horak2001), soybean (Glycine max L. Merr.) (Klingaman and Oliver Reference Klingaman and Oliver1994), sweet potato (Ipomoea batatas L. Lam.) (Basinger et al. Reference Basinger, Jennings, Monks, Jordan, Everman, Hestir, Waldschmidt, Smith and Brownie2019), sorghum (Sorghum bicolor L. Moench) (Moore et al. Reference Moore, Murray and Westerman2004), cotton (Gossypium hirsutum L.) (Chandi et al. Reference Chandi, Jordan, York, Milla-Lewis, Burton, Culpepper and Whitaker2012), and peanut (Arachis hypogaea L.) (Burke et al. Reference Burke, Schroeder, Thomas and Wilcut2007), respectively. Once Palmer amaranth is established in the field or orchard, it is difficult to manage (Mahoney et al. Reference Mahoney, Jordan, Hare, Leon, Roma-Burgos, Vann, Jennings, Everman and Cahoon2021; Spaunhorst Reference Spaunhorst2016). If not adequately managed, it can be a threat to the profitable production of agronomic and horticultural crops (Mahoney et al. Reference Mahoney, Jordan, Hare, Leon, Roma-Burgos, Vann, Jennings, Everman and Cahoon2021). Mahoney et al. (Reference Mahoney, Jordan, Hare, Leon, Roma-Burgos, Vann, Jennings, Everman and Cahoon2021) grouped management issues with Palmer amaranth into short- and long-term challenges; short-term challenges include developing timely and effective management programs for a single season, whereas long-term challenges include the management of the soil seedbank.
Palmer amaranth is a recent arrival in western Nebraska (Beiermann et al. Reference Beiermann, Creech, Knezevic, Jhala, Harveson and Lawrence2021; Lawrence Reference Lawrence2017; Sarangi and Jhala Reference Sarangi and Jhala2018), but its occurrence is becoming more common. In the past, Palmer amaranth was not an issue in Nebraska and the Midwest. However, its prevalence has increased in the last 10 yr, and Palmer amaranth is now reported in the majority of Nebraska counties (McDonald et al. Reference McDonald, Striegel, Chahal, Jha, Rees, Proctor and Jhala2021). In western Nebraska, Palmer amaranth is present where there is irrigation (Lawrence Reference Lawrence2017). Difficulty in Palmer amaranth management is due to its season-long emergence pattern and rapid evolution of herbicide-resistant biotypes, often escaping control measures (Chandi et al. Reference Chandi, Jordan, York, Milla-Lewis, Burton, Culpepper and Whitaker2012; Korres et al. Reference Korres, Norsworthy and Mauromoustakos2019; Tekiela and Sbatella Reference Tekiela and Sbatella2017). Dry edible bean growers in western Nebraska are further challenged with Palmer amaranth management in that effective labeled postemergence herbicides are lacking (Knezevic et al. Reference Knezevic, Klein, Ogg, Creech, Kruger, Lawrence, Jhala, Proctor, Jackson-Ziems, Harveson, Wegulo, Bartles, Timmerman, Sivits, Broderick, Wright, Ohnesorg and McMechan2020).
Palmer amaranth interference and seed production in dry edible beans has never been studied before. The objectives of this field study were to (1) evaluate the impact of season-long Palmer amaranth interference on dry edible bean yield and (2) determine the Palmer amaranth seed production potential when grown in competition with dry edible bean.
Materials and Methods
Site Description
Field experiments were conducted in 2020 and 2021 at the University of Nebraska−Lincoln Panhandle Research and Extension Center in Scottsbluff, NE (41.893° N, 103.680° W). Soil type was a Tripp fine sandy loam (coarse silty, mixed, superactive, mesic Aridic Haplustolls) (NCSS 2006; USDA-NRCS 2019) with a pH of 8.1 in both years, and an organic matter content of 1.1% and 2.1% in 2020 and 2021, respectively. The Palmer amaranth population present at the experiment area is resistant to acetolactate synthase−inhibiting herbicides. The preceding crop in the experiment area was sugar beet (Beta vulgaris L.) in 2019 and corn in 2020.
Treatments and Experimental Design
This study was designed as a randomized complete block design with four replications. The dry edible bean cultivar ‘SV6139GR’ (Seminis, St. Louis, MO) was planted on May 26, 2020, and the cultivar ‘Cowboy’ (ADM Seedwest, Decatur, IL) was planted on June 2, 2021. Both dry edible bean cultivars are pinto with type II (upright indeterminate) growth habits. Dry edible beans were planted at a density of 210,000 plants ha−1, with 56 cm between rows. Plot size was 9.1 m long by 2.2 m wide. Fertilizers were applied at 112 kg N ha−1 and 45 kg P2O5 ha−1 with a dry fertilizer applicator prior to experiment establishment. Irrigation was provided season-long using an overhead lateral-move irrigation system.
Palmer amaranth density was 0 (weed-free control), 0.2, 0.3, 0.5, 1, and 2 Palmer amaranth plants m−1 row (Table 1). These densities were chosen following a preliminary field study completed in 2019 with higher Palmer amaranth densities (as high as 8 plants m−1 row), where populations above 2 plants m−1 row resulted in 100% yield reduction. Palmer amaranth density was established using naturally occurring Palmer amaranth populations. Glyphosate was applied at a rate of 1,261 g ae ha−1 plus ammonium sulfate at 3% v/v plus nonionic surfactant at 0.25% v/v one day after dry edible bean planting to control emerged weeds. Palmer amaranth densities were established after emergence on June 14 in 2020, and June 15 in 2021, 11 and 5 d after dry edible bean emergence, respectively, and those densities were maintained until harvest with hand weeding and hoeing. Each plot contained four dry edible bean rows, and treatment densities were established between first and second, second and third, and third and fourth rows.
Density levels used in field experiments to evaluate the season-long Palmer amaranth interference in dry edible bean at the University of Nebraska Panhandle Research and Extension Center, Scottsbluff, NE, in 2020 and 2021.

Data Collection
Twenty Palmer amaranth plants per plot were randomly selected to obtain Palmer amaranth dry biomass, seed production, and sex ratio data. In treatments where the Palmer amaranth density was 0.2, 0.3, and 0.5 plants m−1 row, all Palmer amaranth plants within the plot were harvested in that fewer than 20 plants were present. Plants were cut at ground level on September 9 in 2020 and on September 2 in 2021, at 1,207 and 1,101 growing degree days (GDDs, base 10 C) after dry edible bean emergence in 2020 and 2021, respectively. Plants were separated by sex to measure female/male ratio, and seeds were collected from female plants for each plot. No Palmer amaranth seed shattering was observed prior to harvest. Palmer amaranth seeds were extracted by hand by stripping terminal and axillary flowers (Bertucci et al. Reference Bertucci, Jennings, Monks, Schultheis, Louws and Jordan2019; Mahoney et al. Reference Mahoney, Jordan, Hare, Leon, Roma-Burgos, Vann, Jennings, Everman and Cahoon2021). Flowers were threshed by hand; seeds were separated from residual material using a 20-mesh sieve (equivalent to a 0.85-mm sieve) followed by a vertical air column seed cleaner. Clean Palmer amaranth seeds were weighed; then a 1-g subsample was taken, counted, and used to extrapolate the total number of seeds for each plot (Bertucci et al. Reference Bertucci, Jennings, Monks, Schultheis, Louws and Jordan2019) using the equation presented by Sosnoskie et al. (Reference Sosnoskie, Webster, Grey and Culpepper2014):
 $${S_{{\rm{Total}}}}\; = \;{{\left( {{M_{{\rm{Total}}}}} \right)\left( {{S_{{\rm{Sample}}}}} \right)} \over {{M_{{\rm{Sample}}}}}}$$
where S Total is the number of clean Palmer amaranth seeds; M Total is the mass of clean Palmer amaranth seeds; S Sample is the number of clean Palmer amaranth seeds from the 1-g subsamples; and M Sample is the mass of clean Palmer amaranth seeds from the 1-g subsamples.
Seed production of each Palmer amaranth plant was calculated by dividing the number of total clean seeds (S Total) by the number of female plants sampled in each plot (Bertucci et al. Reference Bertucci, Jennings, Monks, Schultheis, Louws and Jordan2019). To estimate number of Palmer amaranth seeds m−2, seed production per plant was multiplied by total plants in the plot and then multiplied by the female/male ratio to account for the dioecious nature of Palmer amaranth; the product then was divided by the plot area in m2 (Equation 2).
 $${\rm{Seeds}}\;{{\rm{m}}^{ - 2}}\; = \;{{{\rm{Seeds}}\;{\rm{per}}\;{\rm{plant}}\; \times \;{\rm{No}}.\;{\rm{total}}\;{\rm{plants}}\;{\rm{in}}\;{\rm{plot}} \times \;{\rm{female}}/{\rm{male}}\;{\rm{ratio}}} \over {{\rm{Plot}}\;{\rm{area}}\;\left( {{{\rm{m}}^2}} \right)}}$$
Palmer amaranth plants were oven dried at 40 C for 1 wk before being weighed. Palmer amaranth dry biomass was calculated by adding up the dried residual floral and vegetative material from each plot. Palmer amaranth dry biomass per plant was calculated by dividing Palmer amaranth dry biomass of sampled plants per plot by the number of plants sampled in each plot, whereas Palmer amaranth dry biomass per female plant was calculated by dividing Palmer amaranth dry biomass of sampled female plants per plot by the number of female plants sampled in each plot. Palmer amaranth dry biomass ha−1 was estimated by multiplying Palmer amaranth dry biomass per plant by the total number of plants in a plot divided by the plot area in m2 and multiplied by 10,000 (as there are 10,000 m2 in 1 ha).
Dry edible bean was harvested on September 17 in 2020 and September 8 in 2021, at 1,252 and 1,140 GDDs (base 10 C) after dry edible bean emergence in 2020 and 2021, respectively, by hand pulling all plants from 6.1 m of row from the middle two rows. Hand-pulled dry edible bean plants were later threshed with a Zurn 150 plot combine (ZURN USA Inc., Brooklyn Park, MN) acting as a stationary thresher. Weight and moisture per plot were recorded by a H2 Classic GrainGage (Juniper Systems & HarvestMaster Inc., Logan, UT) mounted on the combine. Yields were adjusted to a standard moisture of 15%. Subsamples were taken from the combine after moisture and yield measurements to obtain 100-seed weight for each plot. An additional 10 consecutive plants were removed from each plot, following the harvest of 6.1 m from the center two rows for yield, so as to sample crop yield components: number of pods per plant and number of seeds per pod.
Statistical Analysis
Regression analysis was used to determine the impact of season-long Palmer amaranth interference with dry edible bean. Data were analyzed in R version 4.0.2 (R Core Team 2020). Variability across years for response variables fitted to nonlinear regressions was tested using an ANOVA at the 5% level of significance using the ‘Anova’ function in the ‘car’ package version 3.010 (Fox and Weisberg Reference Fox and Weisberg2019). When the density (treatment)-by-year interaction was significant for a response variable, data from each year of the study were analyzed separately utilizing the ‘drc’: Analysis of Dose−Response Curves package version 3.0-1 (Ritz et al. Reference Ritz, Baty, Streibig and Gerhard2015). When the density-by-year interaction was not significant for a response variable, years were combined and analyzed utilizing the ‘drc’ package (Ritz et al. Reference Ritz, Baty, Streibig and Gerhard2015). The appropriate nonlinear regression model was chosen using the ‘mselect’ function in the ‘drc’ package (Ritz et al. Reference Ritz, Baty, Streibig and Gerhard2015). Best-fit model was chosen for a given response variable using Akaike Information Criterion, log-likelihood, and lack-of-fitness values, considering the biological/ecological perspective (Onofri et al. Reference Onofri, Carbonell, Piepho, Mortimer and Cousens2010). Lack-of-fit F-tests were used to determine if a model fit the data well (Davies et al. Reference Davies, Hull, Moss and Neve2019; Onofri et al. Reference Onofri, Carbonell, Piepho, Mortimer and Cousens2010) at a significance level of α = 0.05.
To estimate dry bean yield reduction relative to the weed-free control, Equation 3 was used (Klingaman and Oliver Reference Klingaman and Oliver1994):
 $$YR = 100\times\left( {1-{{T}\over{C}}} \right)$$
where YR is the yield reduction relative to the weed-free control in percentage, T is the treatment yield, and C is the weed-free control yield. Relationship between Palmer amaranth density and percent dry edible bean yield reduction was fitted using the rectangular hyperbola (Equation 4) (Bertucci et al. Reference Bertucci, Jennings, Monks, Schultheis, Louws and Jordan2019; Burke et al. Reference Burke, Schroeder, Thomas and Wilcut2007; Cousens Reference Cousens1985) with the ‘yieldLoss’ function in the ‘drc’ package (Ritz et al. Reference Ritz, Baty, Streibig and Gerhard2015).
 $$YL = {{ID} \over {1 + \left( {ID/A} \right)}}$$
where YL is the response variable dry edible bean yield loss; A is the asymptote for maximum crop yield loss as Palmer amaranth density approaches infinity; D is the Palmer amaranth density m−1 of row; and I is the crop yield loss per unit of Palmer amaranth (D) as Palmer amaranth density approaches zero (Swinton and Lyford Reference Swinton and Lyford1996).
The shifted three-parameter Michaelis-Menten model [Equation 5] was used to fit the relationship between Palmer amaranth density m−1 of row and dry edible bean 100-seed weight with the ‘drm’ function in the ‘drc’ package (Ritz et al. Reference Ritz, Baty, Streibig and Gerhard2015).
 $$Y = c + {{d - c} \over {1 + (e/x)}}$$
where Y is the dry edible bean 100-seed weight, c is the upper limit, d is the lower limit, x is Palmer amaranth density expressed in number of plants m−1 of row, and e is the ED50 (Palmer amaranth density in number of plants m−1 row where 50% response between lower and upper limit occurs).
A three-parameter log-logistic model (Equation 6) was used to fit the relationship between Palmer amaranth density m−1 of row with dry edible bean yield and Palmer amaranth seed production m−2 with the ‘drm’ function in the ‘drc’ package (Ritz et al. Reference Ritz, Baty, Streibig and Gerhard2015).
 $$Y = {d \over {1 + {\rm{exp}}(b(\log (x) - \log (e))}}$$
where Y is the response variable, d is the upper limit, x is Palmer amaranth density expressed in number of plants m−1 of row, e is the ED50, and b is the slope of the line at the ED50.
A four-parameter log-logistic model (Equation 7) was used to fit the relationship between Palmer amaranth density m−1 of row with number of dry edible bean pods per plant, number of dry edible bean seeds per pod, Palmer amaranth seed production per plant, and Palmer amaranth dry biomass per plant utilizing the ‘drm’ function in the ‘drc’ package (Ritz et al. Reference Ritz, Baty, Streibig and Gerhard2015).
 $$Y = c + {{d - c} \over {1 + {\rm{exp}}(b(\log (x) - \log (e))}}$$
where Y is the response variable, c is the lower limit, d is the upper limit, x is Palmer amaranth density expressed in number of plants m−1 of row, e is the ED50, and b is the slope of the line at the ED50.
A correlation test with the Pearson’s product-moment method was used to evaluate the correlation between Palmer amaranth dry biomass and dry edible bean yield, as well as Palmer amaranth dry biomass per female plant and Palmer amaranth seed production per plant (Mahoney et al. Reference Mahoney, Jordan, Hare, Leon, Roma-Burgos, Vann, Jennings, Everman and Cahoon2021) utilizing the ‘cor.test’ function in the base package (R Core Team 2020). For the correlations, correlation coefficients (r) and P values were calculated to determine the significance level of the correlation. A linear regression model (Equation 8) was used to fit the relationship between Palmer amaranth dry biomass and dry edible bean yield (Burke et al. Reference Burke, Schroeder, Thomas and Wilcut2007, Rowland et al. Reference Rowland, Murray and Verhalen1999, Wilson et al. Reference Wilson, Wicks and Fenster1980), as well as Palmer amaranth dry biomass per female plant and Palmer amaranth seed production per plant (Norsworthy et al. Reference Norsworthy, Schrage, Barber and Lazaro2016, Webster and Grey Reference Webster and Grey2015) using the ‘lm’ function in the base package (R Core Team 2020).
 $${Y = a + bX}$$
where Y is the dependent variable (dry edible bean yield or Palmer amaranth seed production per plant), b is the slope of the line, X is the explanatory variable (Palmer amaranth dry biomass ha−1 or Palmer amaranth dry biomass per female plant), and a is the intercept/value when the value of X is equal to 0. For the linear regressions, R2 values were calculated to determine how well the model fitted the data (Burke et al. Reference Burke, Schroeder, Thomas and Wilcut2007; Onofri et al. Reference Onofri, Carbonell, Piepho, Mortimer and Cousens2010).
Results and Discussion
Variability across years of the study for the nonlinear regression describing the interference between number of Palmer amaranth plants m−1 row and dry edible bean yield (kg ha−1) was significant based on ANOVA (P = 0.02); therefore, data from both years were analyzed separately. Variability across years of the study for the nonlinear regressions describing the interference between number of Palmer amaranth plants m−1 row and dry edible bean yield reduction (%), dry edible bean yield components (number of pods per plant, number of seeds per pod, and 100-seed weight), Palmer amaranth seed production per plant, Palmer amaranth seed production m−2, and Palmer amaranth dry biomass per plant was not significant based on ANOVA at an α = 0.05; therefore, data were combined before analysis.
Correlation tests determined that Palmer amaranth seed production per plant was positively correlated to Palmer amaranth dry biomass per female plant (r = 0.80, P < 0.0001), and dry edible bean yield was negatively correlated with Palmer amaranth dry biomass (r = −0.73, P < 0.0001). Therefore, linear regressions may be useful to estimate the number of Palmer amaranth seeds produced based on Palmer amaranth dry biomass per female plant, as well as to estimate dry edible bean yield based on Palmer amaranth dry biomass. Linear regressions were fitted to describe the aforementioned relationships, with years of the study combined to ensure the appropriateness of the linear regression model in multiple environments/years.
Temperature, Rainfall, and Irrigation
Average temperatures for June and July in 2020 and 2021 were higher than the 30-yr average (Table 2). Average temperatures were higher throughout the season in 2020 and 2021 compared to the 30-yr average by 5% and 6%, respectively. Average temperatures in May and August of 2021 were similar to the 30-yr average. Total rainfall in 2020 and 2021 were much lower than the 30-yr average by 46% and 33%, respectively, mainly the month of August in 2020, when no rainfall was received. Slightly higher temperatures in June and July in 2021 compared to 2020 led to earlier senescence of dry edible bean due to faster GDD accumulation; therefore, harvest occurred earlier in the season—September 8 in 2021 compared to September 17 in 2020. As irrigation was supplied based on estimated crop water use calculated with crop growth stage and temperatures in both years, rainfall differences between years would not have affected study results.
Average monthly temperature, total rainfall, and total irrigation during 2020 and 2021 growing seasons compared to the 30-yr average at the University of Nebraska Panhandle Research and Extension Center, Scottsbluff, NE.a

a Temperature and rainfall data were obtained from the High Plains Regional Climate Center weather station located within 1 km of the field experiment site in Scottsbluff, NE (https://hprcc.unl.edu/).
b Abbreviations: NA, not applicable.
Dry Edible Bean Yield Components
Dry edible bean yield components expressed as number of pods per plant, number of seeds per pod, and 100-seed weight, were negatively affected by season-long Palmer amaranth interference as density increased (Figure 1). Comparable results were obtained by Trezzi et al. (Reference Trezzi, Vidal, Patel, Miotto, Debastiani, Balbinot and Mosquen2015), where soybean yield components expressed as density, number of pods per plant, number of seeds per pod, and weight of seed were reduced in a hyperbolic trend as hairy fleabane [Conyza bonariensis (L.) Cronq.] density increased. In the present study’s weed-free control, on average, there were 21.4 dry edible bean pods per plant, which declined as Palmer amaranth density increased (Figure 1A, Table 3). Number of dry edible bean pods per plant were reduced by 22%, 36%, 52%, 64%, and 69% by season-long Palmer amaranth interference at a density of 0.2, 0.3, 0.5, 1, and 2 plants m−1 row, respectively (Table 3).
Dry edible bean yield components: (A) number of pods per plant, (B) number of seeds per pod, and (C) 100-seed weight in response to Palmer amaranth season-long interference at fixed density levels in field experiments conducted in 2020 and 2021 at the University of Nebraska Panhandle Research and Extension Center, Scottsbluff, NE. Regression lines represent the fit of a four-parameter log-logistic model (A, B) and a shifted three-parameter Michaelis-Menten model (C). Error bars indicate the standard error of the mean.

Parameter estimates (b, c, d, and e), standard errors (SE), and lack-of-fit values of the nonlinear regressions fitted for the response variables dry edible bean yield (kg ha−1), number of dry edible bean pods per plant, number of dry edible bean seeds per pod, dry edible bean 100-seed weight (g), Palmer amaranth seed production per plant (× 103), Palmer amaranth seed production m−2 (× 103), and Palmer amaranth dry biomass per plant (g) from field experiments conducted in 2020 and 2021 at the University of Nebraska Panhandle Research and Extension Center, Scottsbluff, NE.a

a Abbreviations: b, slope at the ED50; c, lower limit; d, upper limit; e, ED50 (Palmer amaranth density in number of plants m−1 row where 50% response between lower and upper limit occurs).
Number of dry edible bean seeds per pod began to decrease between densities of 0.3 and 0.5 Palmer amaranth plants m−1 row (Figure 1B). Number of dry edible bean seeds per pod in the weed-free control and the densities of 0.2 and 0.3 Palmer amaranth plants m−1 row averaged 3.3 seeds per pod and were reduced by 16% at 2 Palmer amaranth plants m−1 row (Table 3). Dry edible bean seed size, expressed as the 100-seed weight, averaged 38.3 g in the weed-free control, and this weight started to decrease in a Michaelis-Menten pattern right after Palmer amaranth density started to increase (Figure 1C). The size of dry edible bean seeds was reduced by 18% at 2 Palmer amaranth plants m−1 row (Table 3).
Similar to what was observed in this study, Aguyoh and Masiunas (Reference Aguyoh and Masiunas2003) reported a decline in the number of pods per plant in snap bean (Phaseolus vulgaris L.), a crop that is the same species as dry edible bean but bred for harvest at a different stage of pod maturity, as the density of redroot pigweed (Amaranthus retroflexus L.) increased. Aguyoh and Masiunas (Reference Aguyoh and Masiunas2003) did not evaluate number of seeds per pod or seed weight, as it is an impractical measurement in snap bean. However, in corn, reductions in seed size have been reported. Hussain et al. (Reference Hussain, Marwat, Cardina and Khan2014) reported a reduction in the weight of 1,000 corn seeds due to common cocklebur (Xanthium strumarium L.) interference. However, the weight or mass of seeds has been shown to be less sensitive to weed interference; therefore, it is not considered a good determining factor of crop yields (Trezzi et al. Reference Trezzi, Vidal, Patel, Miotto, Debastiani, Balbinot and Mosquen2015).
Dry Edible Bean Yield and Yield Reduction
Season-long Palmer amaranth interference severely reduced dry edible bean yield (Figure 2A). Dry edible bean yields in the weed-free control were 5,090 kg ha−1 and 3,670 kg ha−1 in 2020 and 2021, respectively; furthermore, at the highest density evaluated (2 Palmer amaranth plants m−1 row), yields were 596 kg ha−1 and 1,140 kg ha−1 in 2020 and 2021, respectively (Table 3). Dry edible bean yield over 2 yr was reduced by 77% at 2 Palmer amaranth plants m−1 row (Table 4, Figure 2B). A 5% yield reduction threshold was used as a heuristic to capture when yield reductions may be noticeable in a production setting. The 5% yield reduction threshold occurred at 0.02 (± 0.01) Palmer amaranth plants m−1 row, which equates to 2 (± 1) Palmer amaranth plants 100 m−1 row or 4 (± 2) Palmer amaranth plants 100 m−2.
Dry edible bean yield (kg ha−1) (A) and yield reduction (%) (B) in response to Palmer amaranth season-long interference at fixed density levels in field experiments conducted in 2020 and 2021 at the University of Nebraska Panhandle Research and Extension Center, Scottsbluff, NE. Regression lines represent the fit of a three-parameter log-logistic model (A) and a rectangular hyperbola (B); error bars indicate the standard error of the mean. The horizontal red line represents the 5% yield reduction threshold.

Parameter estimates (A and I), standard errors (SE), and lack-of-fit value of the rectangular hyperbola fitted for the dry edible bean yield reduction (%) due to Palmer amaranth density in number of plants m−1 of row relationship in field experiments conducted from 2020 and 2021 at the University of Nebraska Panhandle Research and Extension Center, Scottsbluff, NE.a

a Abbreviations: A, asymptote for maximum crop yield loss as Palmer amaranth density approaches infinity; I, dry edible bean yield reduction per unit of Palmer amaranth as density approaches zero.
Aguyoh and Masiunas (Reference Aguyoh and Masiunas2003) reported that redroot pigweed reduced snap bean yield as much as 58% at a density of 8 plants m−1 row over 2 yr of experiment. However, there are some differences in the competitiveness of pigweed species, where crop yields are reduced to a greater extent by Palmer amaranth interference, either season-long or for a defined period (Bensch et al. Reference Bensch, Horak and Peterson2003; Spaunhorst Reference Spaunhorst2016). When Palmer amaranth interfered season-long, corn yield was reduced by 91% at 8 plants m−1 row (Massinga et al. Reference Massinga, Currie and Horak2001); soybean yield was reduced by 68% at 10 plants m−1 row (Klingaman and Oliver Reference Klingaman and Oliver1994); peanut yield was reduced by 67% at 5.2 plants m−1 row (Burke et al. Reference Burke, Schroeder, Thomas and Wilcut2007); sweet potato yield was reduced by 79% at 8 plants m−1 row (Basinger et al. Reference Basinger, Jennings, Monks, Jordan, Everman, Hestir, Waldschmidt, Smith and Brownie2019); sorghum grain yield was reduced by 63% at 1.2 plants m−1 row (Moore et al. Reference Moore, Murray and Westerman2004); and cotton yield was reduced by 92% at 0.9 plants m−2 (Chandi et al. Reference Chandi, Jordan, York, Milla-Lewis, Burton, Culpepper and Whitaker2012). Dry edible bean in high-elevation and high-evapotranspiration environments appears to be more sensitive to Palmer amaranth interference than other crops where similar studies have been conducted.
In this study, the reduction in dry edible bean yield was due to the reduction in dry edible bean yield components, principally by a reduction in the number of pods per plant as Palmer amaranth density increased. Previous studies have demonstrated that weeds reduce yield of legume crops by reducing crop yield components in a similar manner (Song et al. Reference Song, Kim, Im, Lee, Lee and Kim2017; Trezzi et al. Reference Trezzi, Vidal, Patel, Miotto, Debastiani, Balbinot and Mosquen2015). Number of pods per plant is considered the most important crop yield component that governs yield of soybean and legume crops (Song et al. Reference Song, Kim, Im, Lee, Lee and Kim2017).
Palmer Amaranth Seed Production and Dry Biomass
A single female Palmer amaranth plant produced 91,000 to 376,000 seeds depending on treatment density (Table 3). Palmer amaranth seed production per plant decreased as Palmer amaranth density increased (Figure 3A). The highest average Palmer amaranth seed production was 376,000 seeds per plant found at the lowest density evaluated of 0.2 Palmer amaranth plants m−1 row, and it was reduced by 12%, 28%, 55%, and 75% when Palmer amaranth density increased to 0.3, 0.5, 1, and 2 plants m−1 row, respectively (Table 3). Palmer amaranth produced 158,000 seeds per plant at a density of 1 plant 0.76-m−1 row with a row spacing of 3 m when competing with watermelon [Citrullus lanatus (Thunb.) Matsum & Nakai] in North Carolina (Bertucci et al. Reference Bertucci, Jennings, Monks, Schultheis, Louws and Jordan2019), 312,000 seeds per plant at a density of 0.5 plants m−1 row with a row spacing of 0.91 m when competing with cotton in Georgia (Webster and Grey Reference Webster and Grey2015), and 534,000 and 434,000 seeds per plant at a density of 0.15 plants m−2 with a row spacing of 0.96 m when competing with cotton and peanut in North Carolina, respectively (Mahoney et al. Reference Mahoney, Jordan, Hare, Leon, Roma-Burgos, Vann, Jennings, Everman and Cahoon2021). Palmer amaranth seed production per plant when competing with dry edible beans averaged less in most of the densities evaluated compared to the aforementioned studies. This is most likely attributable to the shorter growing season of dry edible bean (around 90−100 d), dry edible bean water requirements, and environmental differences in western Nebraska compared to other regions of the United States.
Palmer amaranth seed production per plant (A), seed production m−2 (B), and dry biomass accumulation per plant (C) in response to Palmer amaranth season-long interference at fixed density levels in field experiments conducted in 2020 and 2021 at the University of Nebraska Panhandle Research and Extension Center, Scottsbluff, NE. Regression lines represent the fit of a four-parameter log-logistic model (A, C) and a three-parameter log-logistic model (B). Error bars indicate the standard error of the mean.
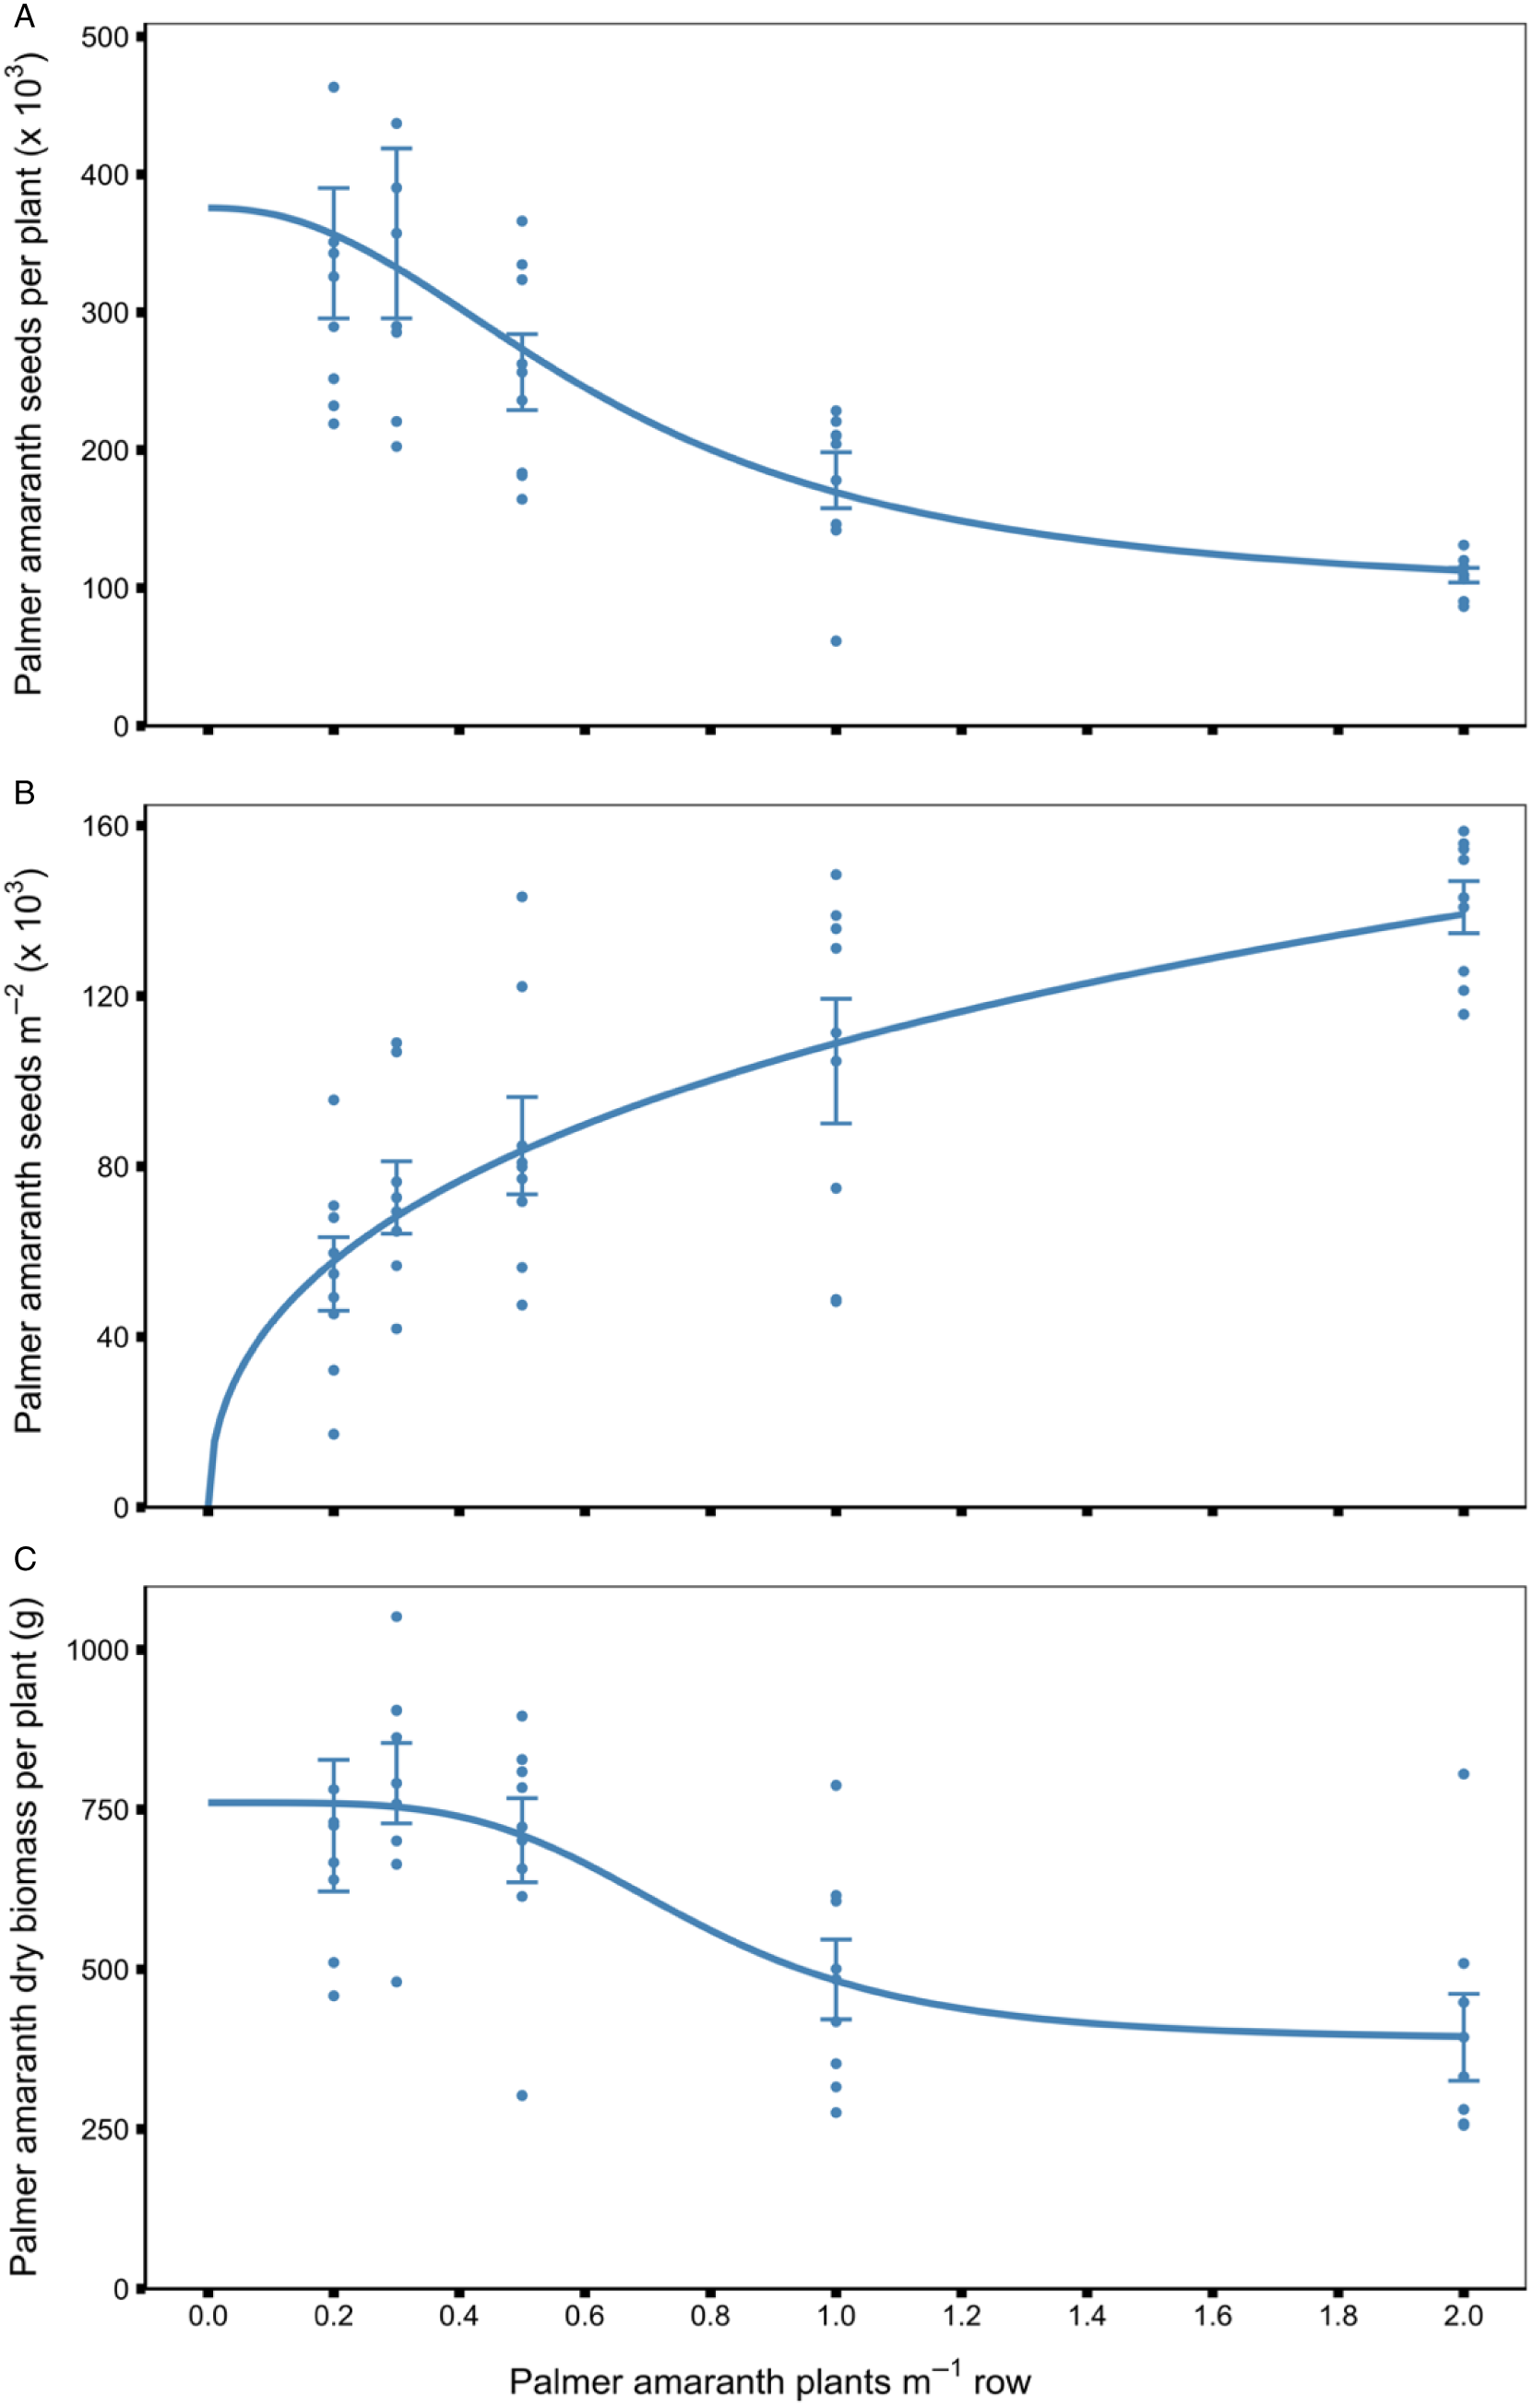
Although Palmer amaranth seed production per plant decreased as Palmer amaranth density increased, Palmer amaranth seed production m−2 increased with increasing Palmer amaranth density (Figure 3B). Similar results were reported by Massinga et al. (Reference Massinga, Currie and Horak2001) and Burke et al. (Reference Burke, Schroeder, Thomas and Wilcut2007), where the number of seeds m−2 produced by Palmer amaranth increased with density. At the 5% yield reduction threshold, which is estimated to occur at 0.02 Palmer amaranth plants m−1 row, we estimate that Palmer amaranth can add around 21,000 seeds m−2 to the soil seedbank. Around 140,000 Palmer amaranth seeds m−2 can be added to the soil seedbank when Palmer amaranth is competing season-long with dry edible bean at the highest density evaluated in this study (i.e., 2 plants m−1 row) (Table 3). This level of Palmer amaranth infestation can be detrimental for dry edible bean growers, as there is a lack of postemergence herbicides labeled to control Palmer amaranth. Similar studies evaluating season-long Palmer amaranth interference in peanut, corn, and cotton reported that Palmer amaranth produced 120,000 seeds m−2, 514,000 seeds m−2, and 110,000 seeds m−2 at a density of 5.2 plants m−1 row, 8 plants m−1 row, and 1.8 plants m−2, respectively (Burke et al. Reference Burke, Schroeder, Thomas and Wilcut2007; MacRae et al. Reference MacRae, Webster, Sosnoskie, Culpepper and Kichler2013; Massinga et al. Reference Massinga, Currie and Horak2001). Given the high fecundity of Palmer amaranth at low densities, it is suggested that growers eliminate all Palmer amaranth plants before seed production; therefore, it is necessary to adopt a “zero-tolerance” approach in dry edible bean productions, as well as in all crops in a dry edible bean rotation, to deplete Palmer amaranth seed in the soil seedbank (Mahoney et al. Reference Mahoney, Jordan, Hare, Leon, Roma-Burgos, Vann, Jennings, Everman and Cahoon2021; Norsworthy et al. Reference Norsworthy, Schrage, Barber and Lazaro2016; Spaunhorst et al. Reference Spaunhorst, Devkota, Johnson, Smeda, Meyer and Norsworthy2018).
Palmer amaranth dry-biomass accumulation per plant declined as Palmer amaranth density increased (Figure 3C). Palmer amaranth dry biomass was highest at the lowest density and began to decline between the densities of 0.3 and 0.5 Palmer amaranth plants m−1 row (Figure 3C). Palmer amaranth dry biomass per plant, when competing with sweet potato, decreased linearly as Palmer amaranth density increased (Meyers et al. Reference Meyers, Jennings, Schultheis and Monks2010). On average, at the lowest two densities evaluated, 0.2 and 0.3 Palmer amaranth plants m−1 row, Palmer amaranth dry biomass per plant was 760 g, whereas at the highest density of 2 Palmer amaranth plants m−1 row, dry biomass per plant was 388 g (Table 3); this is equivalent to a 49% dry-biomass reduction per plant. A single Palmer amaranth plant was able to accumulate around 400 g of dry biomass when competing with sweet potato at 1 plant m−1 row crop (Basinger et al. Reference Basinger, Jennings, Monks, Jordan, Everman, Hestir, Waldschmidt, Smith and Brownie2019), 580 g of dry biomass when competing with peanuts at 0.17 plants m−1 row crop (Burke et al. Reference Burke, Schroeder, Thomas and Wilcut2007), and 1,100 g when competing with sweet potato at 0.5 plants m−1 row crop (Meyers et al. Reference Meyers, Jennings, Schultheis and Monks2010).
Palmer amaranth seed production per plant and dry biomass per plant declined as Palmer amaranth density increased (Figure 3A−C). This trend is mainly attributed to intraspecific competition between Palmer amaranth plants as density increases (Caverzan et al. Reference Caverzan, Piasecki, Chavarria, Stewart and Vargas2019; Orzari et al. Reference Orzari, Barbasso, Silva and Braga2018; Singh et al. Reference Singh, Kaur, Chauhan, Chantre and González-Andújar2020). Similar intraspecific competition trends between Palmer amaranth plants as density increases has been reported by Basinger et al. (Reference Basinger, Jennings, Monks, Jordan, Everman, Hestir, Waldschmidt, Smith and Brownie2019), Bertucci et al. (Reference Bertucci, Jennings, Monks, Schultheis, Louws and Jordan2019), Burke et al. (Reference Burke, Schroeder, Thomas and Wilcut2007), and Massinga et al. (Reference Massinga, Currie and Horak2001), when Palmer amaranth competed with sweet potato, watermelon, peanut, and corn, respectively. The reduction in Palmer amaranth dry biomass per plant was attributed by Ghanizadeh et al. (Reference Ghanizadeh, Lorzadeh and Aryannia2014) to a lower growth rate that is the result of lower light interception and lower leaf area index caused by intraspecific competition.
Palmer Amaranth Seed Production per Plant as Influenced by Palmer Amaranth Dry Biomass per Female Plant
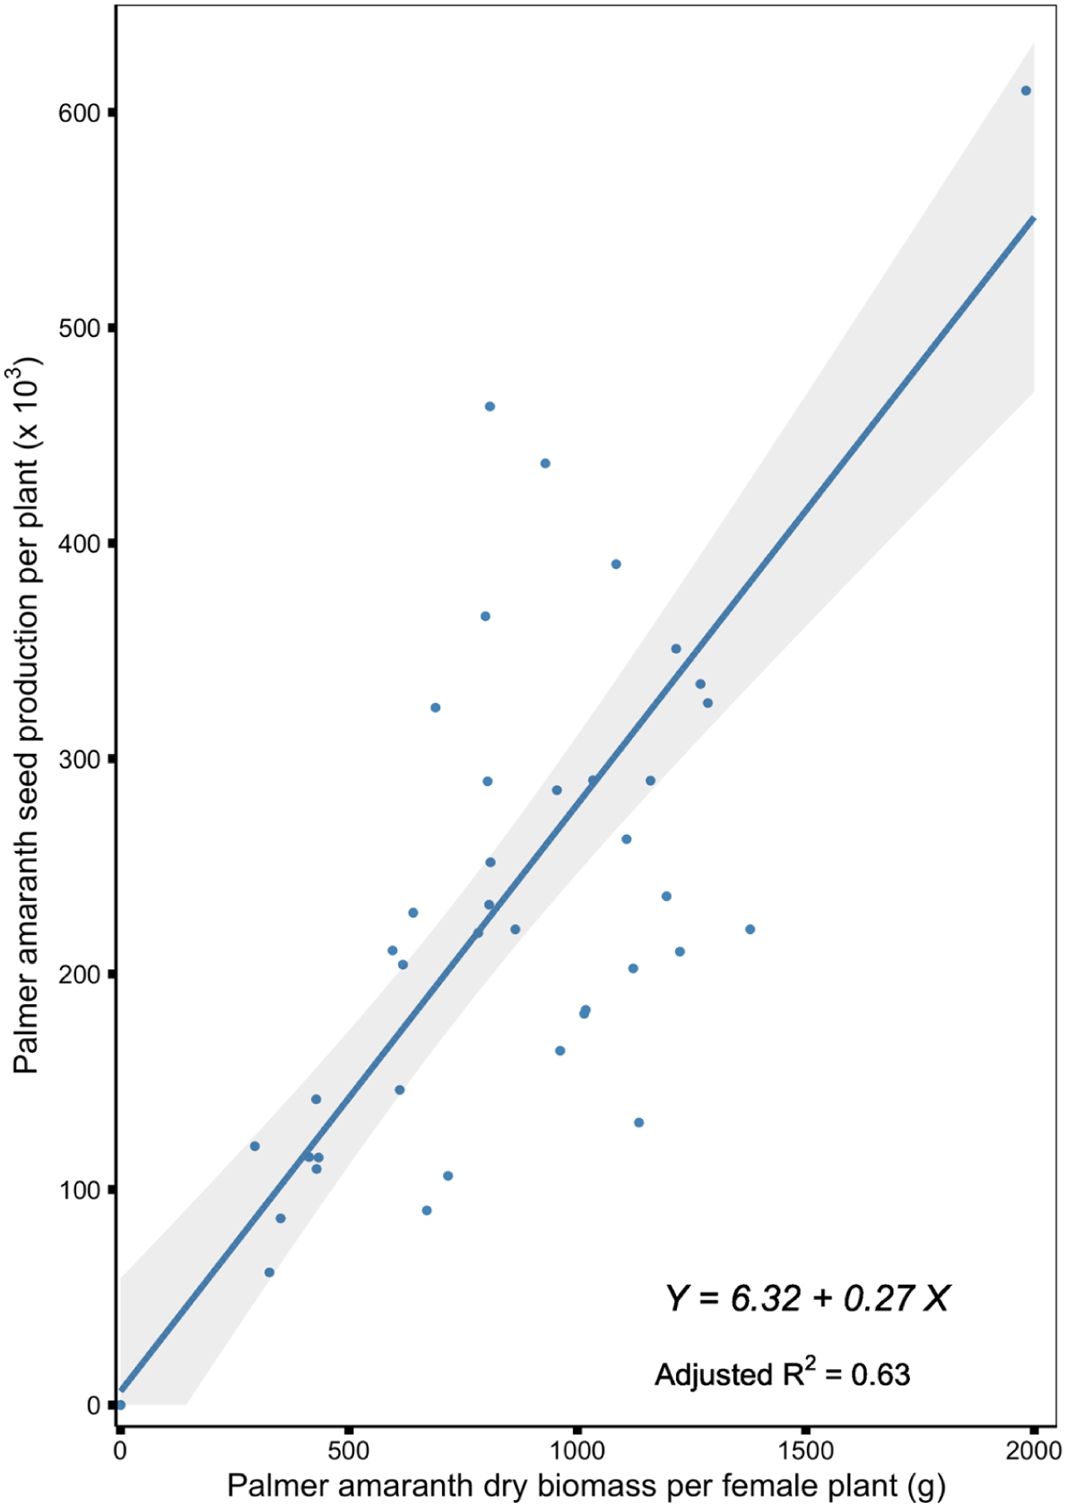
Palmer amaranth seed production per plant was positively correlated (r = 0.80, P < 0.0001) with Palmer amaranth dry biomass per female plant, when Palmer amaranth competed season-long with dry edible beans (Figure 4). Previous studies also reported a strong correlation between Palmer amaranth biomass per plant and seed production per plant, suggesting that the bigger (heavier) the plant, the higher the seed production (Mahoney et al. Reference Mahoney, Jordan, Hare, Leon, Roma-Burgos, Vann, Jennings, Everman and Cahoon2021; Norsworthy et al. Reference Norsworthy, Schrage, Barber and Lazaro2016; Schwartz et al. Reference Schwartz, Norsworthy, Young, Bradley, Kruger, Davis, Steckel and Walsh2016; Spaunhorst et al. Reference Spaunhorst, Devkota, Johnson, Smeda, Meyer and Norsworthy2018; Webster and Grey Reference Webster and Grey2015). Based on the linear regression model describing such a relationship, 1 g of Palmer amaranth dry biomass per female plant increased Palmer amaranth seed production per plant by 270 seeds (Table 5). Webster and Grey (Reference Webster and Grey2015) reported that Palmer amaranth produced 330 seeds for every gram of dry biomass when Palmer amaranth competed with cotton in Georgia. Considering the findings of the aforementioned studies and the current study, Palmer amaranth plants with greater biomass will produce a vast quantity of seed and will replenish the soil seedbank. Previous studies have shown a reduction in seed production when Palmer amaranth emerged after the crop and emphasized the importance of controlling escaped Palmer amaranth plants. Given the relationship of biomass to seed production, even a short Palmer amaranth plant can produce viable seeds that will contribute to future management problems (Mahoney et al. Reference Mahoney, Jordan, Hare, Leon, Roma-Burgos, Vann, Jennings, Everman and Cahoon2021).
Palmer amaranth seed production per plant in response to Palmer amaranth dry biomass per female plant in field experiments conducted in 2020 and 2021 at the University of Nebraska Panhandle Research and Extension Center, Scottsbluff, NE. Regression lines represent the fit of a linear regression model; gray ribbon represents the 95% confidence interval of the regression line.
Parameter estimates (a and b), standard errors (SE), and adjusted R2 values of the linear regressions fitted for the Palmer amaranth dry biomass per female plant (g) by Palmer amaranth seed production per plant (× 103), and Palmer amaranth dry biomass (kg ha−1) by dry edible bean yield (kg ha−1) relationships from field experiments conducted in 2020 and 2021 at the University of Nebraska Panhandle Research and Extension Center, Scottsbluff, NE.a

a Abbreviations: a, intercept; b, slope of the line.
Dry Edible Bean Yield as Influenced by Palmer Amaranth Dry Biomass
Dry edible bean yield was negatively correlated (r = −0.73, P < 0.0001) with Palmer amaranth dry biomass accumulation when Palmer amaranth competed season-long with dry edible bean (Figure 5). Based on the linear regression model describing the relationship, 1,000 kg of Palmer amaranth dry biomass reduced dry edible bean yield by 300 kg (Table 5). Results suggest that as Palmer amaranth biomass accumulation increases, dry edible bean yield is reduced. Wilson et al. (Reference Wilson, Wicks and Fenster1980) reported that 1,000 kg of weed dry biomass reduced dry edible bean yield by 208 kg; however, Palmer amaranth was not present in that study. Previous studies reported that cotton yield was reduced 5.2% to 9.3% for every 21 g of Palmer amaranth biomass m−2 (Rowland et al. Reference Rowland, Murray and Verhalen1999), peanut yield decreased 2,890 kg for every 1 kg of Palmer amaranth dry biomass m−1 row crop (Burke et al. Reference Burke, Schroeder, Thomas and Wilcut2007), and sorghum yield was reduced by 5.3% to 9.1% for every 193 kg of Palmer amaranth dry biomass ha−1 (Moore et al. Reference Moore, Murray and Westerman2004).
Dry edible bean yield in response to Palmer amaranth dry biomass accumulation in field experiments conducted in 2020 and 2021 at the University of Nebraska Panhandle Research and Extension Center, Scottsbluff, NE. Regression lines represent the fit of a linear regression model; gray ribbon represents the 95% confidence interval of the regression line.

Practical Implications
Results of this study will help inform farmers and other stakeholders of the magnitude of dry edible bean yield loss due to Palmer amaranth interference and the potential Palmer amaranth seed return to the soil seedbank if Palmer amaranth is not controlled. The dry edible bean market is estimated at $938 million annually in the United States according to average production value of a 10-yr period from 2010 to 2020 (Statista 2021b). Nebraska represents approximately 10% of total dry edible bean production in the country (Lucier and Davis Reference Lucier and Davis2020; Soltani et al. Reference Soltani, Dille, Gulden, Sprague, Zollinger, Morishita, Lawrence, Sbatella, Kniss, Jha and Sikkema2018). Based on estimated potential yield reduction in dry edible beans due to season-long Palmer amaranth interference, if Palmer amaranth is left uncontrolled, around $72 million can be lost every year in Nebraska. As Palmer amaranth is a new arrival in western Nebraska, many stakeholders are not aware of the impact that Palmer amaranth can have on long-term farm profitability. An understanding of crop–weed interactions is necessary to develop sustainable, profitable, and effective weed management strategies (Swanton et al. Reference Swanton, Nkoa and Blackshaw2015). Providing dry edible bean farmers with accurate yield loss data may help to motivate and convince growers to adopt best herbicide-resistant Palmer amaranth management practices, including a focus on the long-term management of the soil seedbank. Because Palmer amaranth seeds have short longevity in the soil, the seedbank can be nearly depleted in 4 yr if Palmer amaranth is controlled effectively (Cahoon et al. Reference Cahoon, York, Jordan and Seagroves2015). If Palmer amaranth is already present in the field, management should focus on a zero-tolerance approach to avoid replenishing the soil seedbank (Norsworthy et al. Reference Norsworthy, Schrage, Barber and Lazaro2016).
Acknowledgments
This research received no specific grant from any funding agency, or commercial or not-for-profit sectors.
Conflicts of interest
No conflicts of interest have been declared.


 Open access