The prevalence of malnutrition in hospitals remains quite high. According to a systematic review of data from Southeast and East Asia, hospital malnutrition exceeds 40 %(Reference Inciong, Chaudhary and Hsu1). Research data from the Netherlands indicate that the prevalence of hospital malnutrition was 31 % upon hospital admission, 56 % on the fifth day, 66 % on the tenth day and 79 % among patients with a length of stay of ≥ 15 d(Reference van Vliet, Gomes-Neto and de Jong2). More importantly, 30 % of patients experience malnutrition at the time of hospital discharge(Reference van Vliet, Gomes-Neto and de Jong2). Similar results were found in a study conducted by authors across four different hospitals in Indonesia, showing that approximately 37·3–48·2 % of patients are at risk of malnutrition. Malnutrition in hospitals has a significant impact on adverse clinical outcomes, including both infectious and non-infectious complications, reduced quality of life, prolonged hospital stays, increased length of stay and risk of readmission, impaired wound healing and increased mortality risk and hospital costs(Reference Susetyowati, Hamam and Mohammad3,Reference Kang, Kim and Ryu4) .
The detection of malnutrition risk is essential to inform treatment strategies and improve clinical outcomes. To detect malnutrition risk and predict the probability of improved or worsened clinical outcomes, nutritional screening and assessment should be conducted for all patients(Reference Susetyowati, Djarwoto and Faza5). Various existing screening methods have been proven effective for specific population groups, including the Malnutrition Screening Tool (MST) and Nutrition Risk Screening 2002 (NRS-2002). Although various screening tools are currently available, there is a need for a standardised, universally accepted method to identify patients at risk, especially in diverse populations such as those in Indonesia. The Simple Nutrition Screening Tool (SNST) has been adapted for the Indonesian context, showing promise for identifying at-risk patients, predicting length of stay and determining discharge status across a range of conditions including diabetes, renal disease, cancer and in elderly patients(Reference Susetyowati, Djarwoto and Faza5–Reference Rohimah, Sugiarto and Probandari10).
Further, to standardise clinical practice in diagnosing malnutrition with various screening tools, the Global Leadership Initiative on Malnutrition (GLIM) has proposed diagnostic criteria for malnutrition. These criteria combine phenotypic indicators (unintentional weight loss, low BMI and reduced muscle mass) and aetiological factors (decreased food intake and inflammation) for malnutrition diagnosis(Reference De Groot, Lee and Ackerie11). Full implementation of the GLIM approach should therefore be applied to patients with suspected or probable low muscle function and potentially mass such as sarcopenia. Sarcopenia should, however, increase suspicion for associated malnutrition. Once malnutrition is diagnosed, skeletal muscle function should be assessed as a relevant component of the nutrition assessment of individuals with malnutrition(Reference Compher, Cederholm and Correia12).
Muscle mass is a phenotypic component in the GLIM criteria, as low muscle mass correlates with adverse health outcomes in hospitalised patients(Reference Barazzoni, Jensen and Correia13). The methods used to assess muscle mass, however, vary widely including quantitative measurement using dual-energy x-ray absorptiometry, computerised tomography (CT) scan, MRI or bioelectrical impedance analysis (BIA)(Reference Barazzoni, Jensen and Correia13). Nonetheless, among the criteria for diagnosing malnutrition according to GLIM, the assessment of skeletal muscle mass is less frequently carried out in clinical nutrition practice, particularly in settings where access to trained clinical nutrition professionals is limited. For settings where these resources are lacking or not available, the use of anthropometric measures, such as calf circumference (CC) or upper mid-arm circumference, and physical examination is highly encouraged(Reference Barazzoni, Jensen and Correia13,Reference Bian, Li, Wang and Chang14) .
BIA and CC measurements are among the commonly used methods due to their accessibility and relatively low cost, yet there is ongoing debate over their accuracy and comparability(Reference Barazzoni, Jensen and Correia13,Reference Bian, Li, Wang and Chang14) . This study aims to evaluate the prevalence of malnutrition in hospitalised patients upon admission by applying the GLIM criteria and comparing the effectiveness of BIA and CC measurements for assessing muscle mass.
Materials and methods
Study population and design
This study was a regression analysis of an observational study in which 605 newly admitted patients in four multicentre hospitals were recruited between August 2024 and October 2024. Four hospitals in the present study were Dr Sardjito General Hospital, Yogyakarta; Dr Adhyatma MPH Regional Hospital Center, Java; Universitas Hasanuddin Hospital, South Sulawesi; and PKU Muhammadiyah Bantul Regional Hospital, Yogyakarta. All patients were older than 18 years old and were competent to participate in the research. Critically ill patients, maternal patients, patients with mental disorders and patients with oedema were excluded from the study.
Nutritional screening measurement
All new patients were screened and assessed according to the GLIM at the time of hospital admission by dietitians and nutritionists from four hospitals who were trained before data collection. The training covered standardised procedures for applying GLIM criteria, performing anthropometric assessments and using BIA and CC measurements. To ensure inter-centre consistency, mock assessments and protocol alignment sessions were conducted prior to study initiation. The application of GLIM criteria to all patients considered their risk of malnutrition according to the SNST (i.e. 0–2 = no malnutrition, > 2 = malnutrition), NRS-2002 (i.e. 0–2 = no malnutrition, 3–7 = malnutrition) and MST (i.e. < 2 = no malnutrition, ≥ 2 = malnutrition).
Diagnosis of malnutrition using GLIM was established if it met the threshold for at least one aetiologic and one phenotypic criterion. For the present study, we determined weight loss by losing > 5 % of normal body weight in 6 months. BMI was calculated as weight in kilograms divided by height in metres squared (kg/m2). The BMI cutoff values are indicated by the Asia-Pacific criteria. Reduced muscle mass was specified between mild to severe weakness using the standard protocol of BIA (Tanita Body Composition Monitor; the BC-541 series) or CC (M: < 33 cm; F: < 32 cm) taken using the tape model Health o Meter Digital Body Tape Measure (Sunbeam Products Inc.). Aetiologic criteria were assessed based on reduced food intake (<50% of estimated energy requirements for >1 week or any reduction for >2 weeks) or the presence of an inflammatory condition (acute injury/disease or chronic disease-related inflammation). Reduced food intake included decreased appetite or chronic gastrointestinal disorders that impair nutrient absorption (e.g., dysphagia, anorexia, chronic diarrhea, vomiting) and malabsorption syndromes (e.g., short bowel syndrome, pancreatic insufficiency, and post-bariatric surgery). Inflammatory conditions are shown by the presence of acute (burn injury, traumatic brain injury) or chronic inflammation (Chronic Obstructive Pulmonary Disease (COPD), Congestive Heart Disease (CHF), kidney failure, chronic liver disease, cancer, diabetes mellitus, rheumatoid arthritis, asthma, allergy).
Nutrition status and sarcopenia diagnosis
Any deterioration of nutritional status was examined with respect to weight (as defined before), BMI (as defined before), mid-upper arm circumference (MUAC), handgrip strength (HGS), sarcopenia event, fat-free mass index (FFMI) and total lymphocyte count (TLC). MUAC was measured 2-fold in the patient’s non-dominant arm, using the tape model Health o Meter Digital Body Tape Measure (Sunbeam Products Inc.) with cutoff values of 70–84 % for moderate and < 70 % for severe malnutrition. The HGS test was taken two times using a calibrated instrument called a grip strength dynamometer from Camry EH101 (M: < 27 kg; F: < 16 kg). TLC was calculated as leukocyte times 1000 times %lymphocyte, and then the result was divided by 100 (i.e. < 2000 = malnutrition). The normal range of leukocyte and %lymphocyte was measured according to the respective hospital laboratory standard.
To obtain sarcopenia incidence, we performed case-finding using the algorithm of the Asian Working Group for Sarcopenia 2019. It included CC and patient assessment of clinical conditions to identify any possible sarcopenia. Acknowledging those findings, diagnosis of sarcopenia was confirmed with both HGS and appendicular skeletal muscle (ASM) mass (M: < 7·0 kg/m2; F: < 5·4 kg/m2) using the standard protocol of BIA. BIA was also used to calculate FFMI, which was calculated as muscle mass (kg) divided by height (m2) (M: < 17 kg/m2; F: < 15 kg/m2).
Statistical analysis
Patients’ characteristics were expressed by frequencies and percentages for all categorical variables. The data were not normally distributed by the Shapiro–Wilk test; therefore, we showed the median of continuous variables. Patient data were categorised into four different tools: (a) GLIM according to three phenotypic criteria (weight, BMI and ASM) and at least one aetiologic criterion, (b) GLIM according to two phenotypic criteria (weight and BMI) and at least one aetiologic criterion, (c) GLIM according to one phenotypic criterion (ASM) and at least one aetiologic criterion and (d) GLIM according to one phenotypic criterion (CC) and at least one aetiologic criterion. Tool A was used as the standard method, as in the original GLIM definition. A χ 2 test was applied for comparison between groups, and a 95 % CI was used for estimating the prevalence ratio (PR). To evaluate the association with the outcome parameters, we performed multivariate logistic regression analysis on the constructed diagnostic tools. All data were tested for the validity statistics, which had been compared by sensitivity (Se), specificity (Sp), positive predictive value (PPV) and negative predictive value (NPV). The adjustment for multiple comparisons was not applied, as our primary analyses were based on pre-specified hypotheses focused on GLIM diagnostic method comparisons. This is also noted in the discussion section as a study limitation and acknowledged. The recommended interpretation of Se and Sp is > 80 %. Potential confounders were sex and age. For all statistical tests, a P value < 0·05 was considered to indicate statistical significance. Statistical analysis was performed with the software package SPSS (version 26, IBM Corp.).
Results
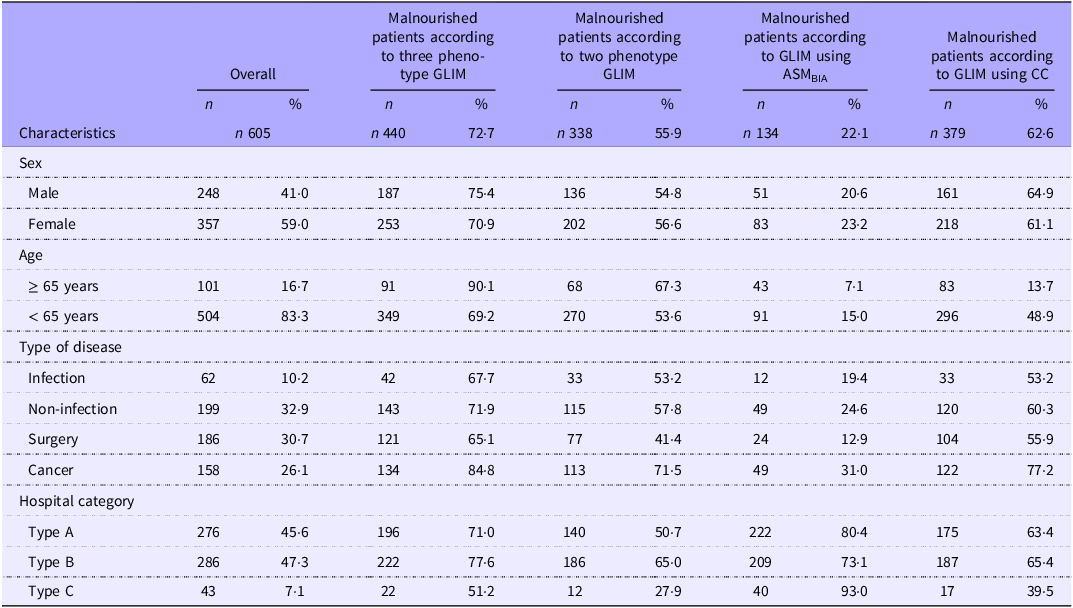
In this study of 605 enrolled patients, the prevalence of malnutrition was assessed at admission using four GLIM diagnostic methods: GLIM with three phenotypes, GLIM with two phenotypes, GLIM with appendicular skeletal muscle based on bioelectrical impedance analysis (ASMBIA) and GLIM with CC. The GLIM method with three phenotypes diagnosed malnutrition in 440 patients (72·7 %), the method with two phenotypes diagnosed 338 patients (55·9 %), the ASMBIA method diagnosed 134 patients (22·1 %) and the CC method diagnosed 379 patients (62·6 %). Data are shown in Table 1.
Characteristics of patients classified on the GLIM criteria

GLIM, Global Leadership Initiative on Malnutrition; ASMBIA, appendicular skeletal muscle based on bioelectrical impedance analysis; CC, calf circumference.
In the assessment using GLIM with three phenotypes, the prevalence of malnutrition was reported to be higher in males than females (75·4 v. 70·9 %), in patients aged ≥ 65 years compared with younger patients (90·1 v. 69·2 %) and in patients with cancer compared with those with non-infectious diseases, non-infectious diseases and surgical patients (84·4 v. 71·9 % v. 67·7 v. 65·1 %). When malnutrition was diagnosed by GLIM with two phenotypes, a higher prevalence was found in females than males (56·6 v. 54·8 %), in patients aged ≥ 65 years compared with younger patients (67·3 v. 53·6 %) and in patients with cancer compared with those with non-infectious diseases, non-infectious diseases and surgical patients (71·5 v. 57·8 % v. 53·2 v. 41·4 %).
In the assessment using GLIM with ASMBIA, malnutrition was more prevalent in females (23·2 v. 20·6 % in males), while a lower prevalence of malnutrition was observed in patients aged ≥ 65 years (7·1 v. 15 % in those < 65 years) and in those with cancer (31 v. 24·6 % in non-infectious diseases v. 19·4 % in infectious disease v. 12·9 % in surgical patients). Malnutrition diagnosis using GLIM with CC revealed a higher prevalence in males (64·9 v. 61·1 % in females), in patients aged < 65 years (48·9 v. 13·7 % in those aged ≥ 65 years) and in patients with cancer (77·2 v. 60·3 % in non-infectious disease v. 53·2 % in infectious diseases v. 55·9 % in surgical patients).
Nutrition status indicator according to the Global Leadership Initiative on Malnutrition criteria
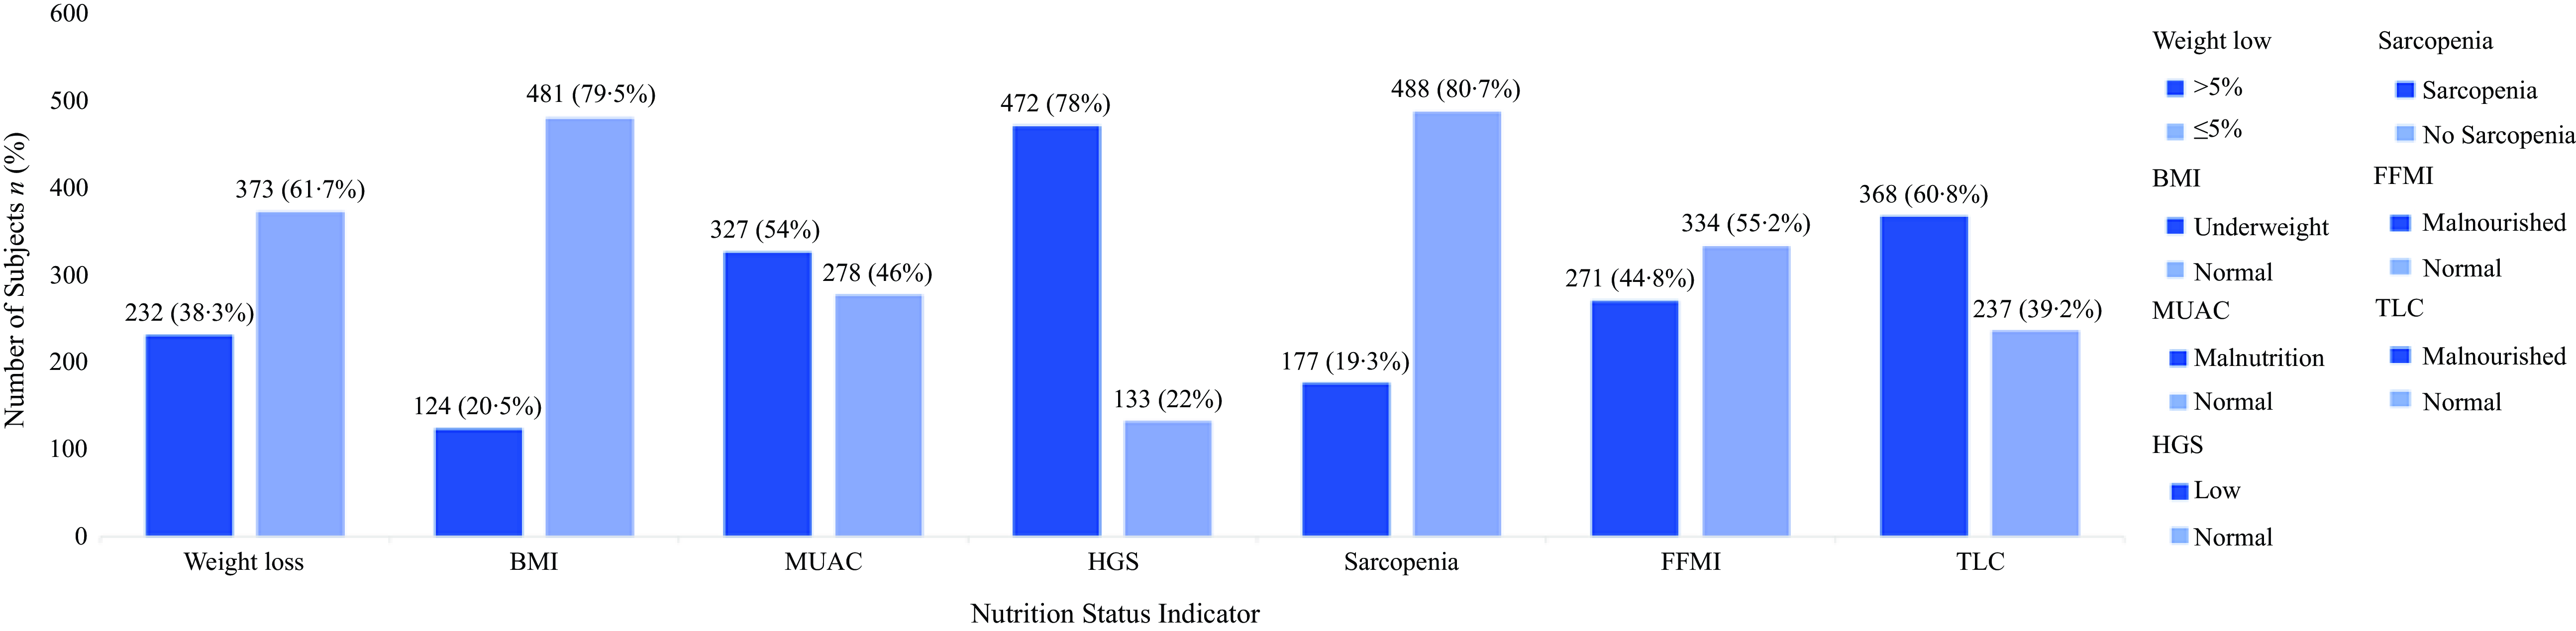
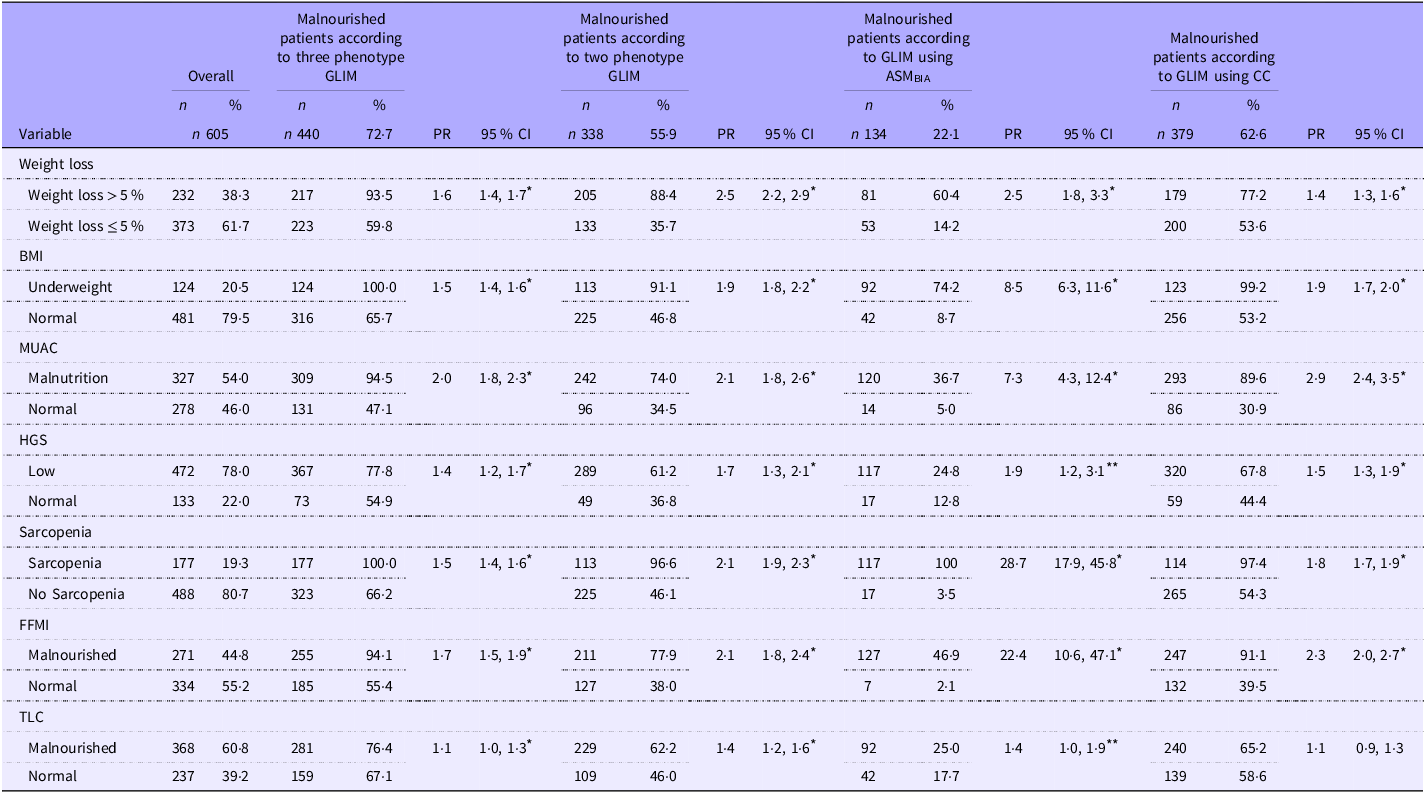
Nutritional status, indicated by anthropometric parameters (weight loss, BMI and MUAC), physical function (HGS), muscle mass (sarcopenia, FFMI) and an inflammation marker (TLC), was assessed using four GLIM diagnostic methods. A notably high proportion of subjects were identified as malnourished using HGS (78 %) and MUAC (54 %), compared with other indicators (Figure 1). In general, weight loss, BMI, MUAC, HGS, sarcopenia and FFMI were significantly associated with malnutrition as diagnosed by GLIM with three phenotypes, GLIM with two phenotypes, GLIM using ASMBIA and GLIM using CC. Only TLC in the GLIM with the CC method showed no association with malnutrition. Data are presented in Table 2.
Bar graph showing distribution of nutritional status among study participants (n 605). MUAC, mid-upper arm circumference; HGS, handgrip strength; FFMI, fat-free mass index; TLC, total lymphocyte count.

Nutrition status indicator according to GLIM criteria

GLIM, Global Leadership Initiative on Malnutrition; ASMBIA, appendicular skeletal muscle based on bioelectrical impedance analysis; PR, prevalence ratio; CC, calf circumference; MUAC, mid-upper arm circumference; HGS, handgrip strength; FFMI, fat-free mass index; TLC, total lymphocyte count.
* P value < 0·001.
** P value < 0·05.
Malnutrition risk screening identified by the Global Leadership Initiative on Malnutrition criteria
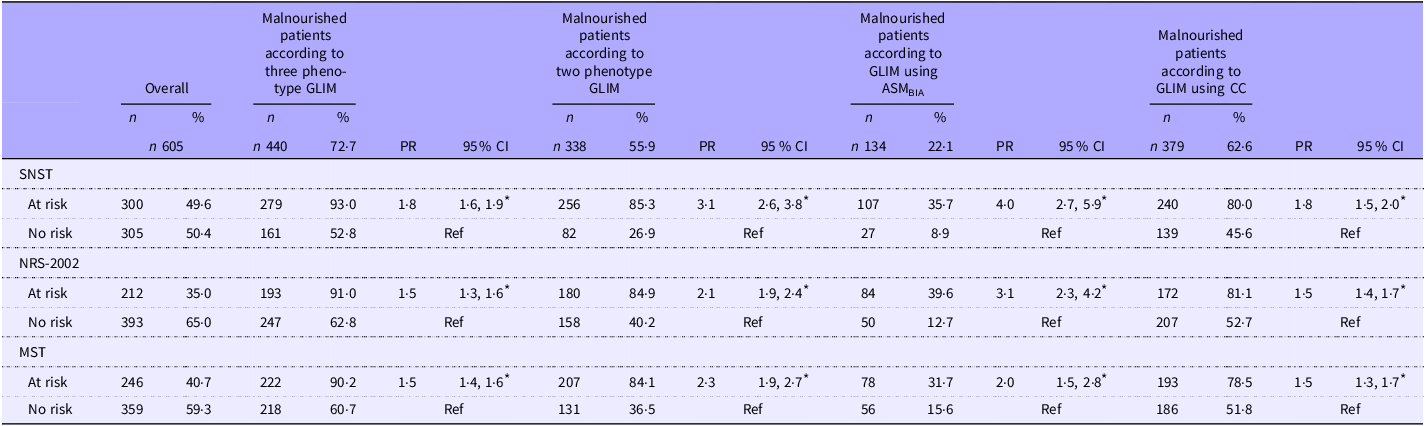
The risk of malnutrition, as detected by nutrition screening tools, showed a significant association with malnutrition diagnosed by the four GLIM methods. Patients at risk of malnutrition, as screened by SNST, NRS 2022 or MST, were more likely to be diagnosed with malnutrition according to GLIM with three phenotypes, GLIM with two phenotypes, GLIM using ASMBIA and GLIM using CC. The results are detailed in Table 3.
Malnutrition risk screening identified by GLIM criteria

GLIM, Global Leadership Initiative on Malnutrition; ASMBIA, appendicular skeletal muscle based on bioelectrical impedance analysis; CC, calf circumference; PR, prevalence ratio; SNST, Simple Nutrition Screening Tool; NRS-2002, Nutrition Risk Screening 2002; MST, Malnutrition Screening Tool.
* P value < 0·001.
Sensitivity, specificity, negative predictive value and positive predictive value for using all possible combinations of the Global Leadership Initiative on Malnutrition criteria
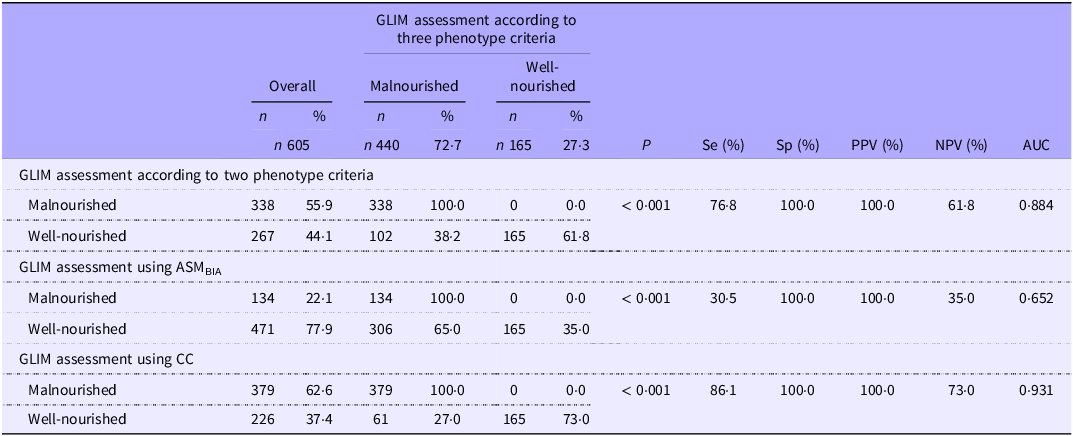
When comparing GLIM with two phenotypes and GLIM using CC against GLIM with three phenotypes, the Se of these two GLIM methods was fair (76·8 and 86·1 %, respectively), while SP was excellent (100 % for both), with PPV values of 100 and 100 % and NPV values of 61·8 and 73 %. Although Se decreased, SP remained high when using GLIM with ASMBIA for diagnosing malnutrition compared with GLIM with three phenotypes as the standard (Se 30·5 %, SP 100 %, PPV 100 % and NPV 35 %). See Table 4 for the detailed results.
Sensitivity, specificity, NPV and PPV for using all possible combinations of GLIM criteria

GLIM, Global Leadership Initiative on Malnutrition; ASMBIA, appendicular skeletal muscle based on bioelectrical impedance analysis; CC, calf circumference; Se, sensitivity; Sp, specificity; PPV, positive predictive value; NPV, negative predictive value.
The Receiver Operating Characteristic (ROC) curve analyses supported these findings. The GLIM using CC achieved an AUC of 0·931, indicating a strong ability to differentiate between malnourished and non-malnourished individuals. The GLIM with two phenotypes also showed favourable performance with an AUC of 0·884. In addition, the GLIM approach using ASMBIA resulted in a lower AUC of 0·652, reflecting more limited classification performance. These findings suggest that CC may offer a practical and informative component within the GLIM criteria for malnutrition screening.
Discussion
The study highlighted the diagnosis of malnutrition in hospitalised patients upon admission using the GLIM criteria, with a focus on phenotype criteria and muscle mass measurements. In general, according to the GLIM diagnostic, nutrition risk screening is required in the first stage to determine the risk of malnutrition. In the second stage, the GLIM criteria with a two-step approach (phenotypic and aetiologic) are applied to evaluate and confirm malnutrition. Nonetheless, in some cases, the GLIM criteria using a one-step approach (solely based on either phenotypic or aetiologic criteria) are directly applied to diagnose malnutrition(Reference Cederholm, Jensen and Correia15,Reference Win, Chua and Gwee16) . In this study, the prevalence of malnutrition confirmed by GLIM using three phenotypes was 72·7 %, representing the highest prevalence compared with malnutrition assessed by GLIM with two phenotypes (55·9 %), GLIM using ASMBIA (22·1 %) and GLIM using CC (62·6 %).
The prevalence of hospital malnutrition during the acute phase has been widely reported in the literature to range between 20 and 80 %(Reference Boaz and Kaufman-Shriqui17,Reference Barker, Gout and Crowe18) . This variation depends on the patient population, as well as the tools and criteria used for diagnosing malnutrition(Reference Barazzoni, Jensen and Correia13,Reference Bian, Li, Wang and Chang14) . More importantly, beyond its prevalence, acute malnutrition in hospital settings has also been associated with other impacts on patient care, including length of stay, medication use, infection rates, dietetic referrals, documentation of malnutrition and mortality(Reference Boaz and Kaufman-Shriqui17–Reference Wahyudi, Ronoatmodjo and Setiati19). Screening and assessing malnutrition in hospital settings is commonly performed using various tools, including the NRS, MST, Subjective Global Assessment (SGA), anthropometric measurements, blood markers, physical function assessments and the GLIM criteria(Reference Cederholm, Jensen and Correia15,Reference Barker, Gout and Crowe18) . The GLIM criteria for malnutrition are highly recommended as a diagnostic tool for identifying malnutrition(Reference Cederholm, Jensen and Correia15,Reference Win, Chua and Gwee16) . GLIM has the ability to comprehensively evaluate the nutrition-related condition of patients through its components. These include phenotypic criteria – which represent the severity of malnutrition, such as unintentional weight loss, low BMI and reduced muscle mass, which are not considered in The European Society for Clinical Nutrition and Metabolism (ESPEN) guidelines – and aetiologic criteria, such as reduced food intake and disease burden or inflammation, which help identify the underlying cause of malnutrition(Reference Compher, Cederholm and Correia12–Reference Bian, Li, Wang and Chang14).
Nutrition status indicator according to the Global Leadership Initiative on Malnutrition criteria
To the best of our knowledge, this is the first evaluation of GLIM criteria, particularly to compare the phenotypic criteria using different techniques in hospital patients in Indonesia. Our study is also the first research to investigate the prevalence of coexistent malnutrition and sarcopenia by performing the most recent diagnostic recommendation tools (GLIM criteria and Asian Working Group for Sarcopenia 2019)(Reference Chen, Woo and Assantachai20,Reference de van der Schueren, Keller and Cederholm21) . Bivariate analysis further demonstrates the comparison of GLIM and malnutrition screening of hospitalised patients.
As shown in Table 2, various indicators were assessed as phenotypic and aetiologic criteria. Phenotypic criteria were evaluated by weight loss; nutritional status, which was presented by BMI; and muscle mass, which was presented by ASM, FFMI, MUAC and CC. Aetiologic criteria were delivered solely by TLC. The result shows that almost all criteria give a significant association in all our GLIM methods; however, the magnitude of discrepancy between GLIM methods depends upon the phenotype criteria. MUAC was of great interest in this study as the least resource-intensive measurement, which is more sensitive to express the long-term nutritional changes than BMI(Reference Nowak-Szczepanska, Gomula and Koziel22). By using MUAC, the proportion of people with malnutrition is considered substantial if diagnosed with GLIM according to ASMBIA, GLIM according to CC and GLIM according to all three phenotypes (PR = 7·3; PR = 2·9; PR = 2·0, respectively). The strength in this relationship tends to be stronger by GLIM using ASMBIA since only 14 of 134 people in this group show a normal nutritional status, indicated by a> 84 % percentile value.
Nevertheless, in our clinical settings, measuring CC as one of the methods to see the reduction of muscle mass is more feasible than performing ASMBIA because not all health sectors in Indonesia are able to accommodate the proper BIA instrument and understand its protocol(Reference Kokura and Momosaki23). This argument is in accordance with other studies that mentioned the body composition measurement is an expensive, least reproducible method and not available to all patients(Reference Matsumoto, Iwai and Namikawa24,Reference Pereira, Costa and Vulcano25) .
On a side note, we also highlighted HGS measurement to find the ‘possible sarcopenia’ among patients(Reference Enge, Peelen and Nielsen26). Sarcopenia represents the depletion of muscle mass and poor health outcomes, and currently, many authors have published the association of hospitalisation with the development of sarcopenia(Reference Wan, Thiam and Ang27,Reference Wang, Wang and Li28) . As shown in Figure 1, HGS identified 78 % of participants as malnourished, representing the highest screening performance among all parameters assessed. These problems make early detection of sarcopenia recommended in the clinical setting(Reference Chen, Woo and Assantachai20). The examination of low HGS is required alongside reduced muscle quantity to diagnose sarcopenia when physical performance is not tested(Reference Chen, Woo and Assantachai20). In this study, we expected to find the greatest prevalence ratio of malnutrition when diagnosed by GLIM using ASMBIA (PR = 28·7) compared with other diagnostic methods.
As aforementioned, assessment of sarcopenia becomes impractical without the facilitation of recommended BIA devices; hence, we investigate a new strategy along with refinement in practice. Malnutrition status among sarcopenia patients was discovered to be almost equal when diagnosed by GLIM criteria using two phenotypes and GLIM using CC (n 113 (PR = 2·1); n 114 (PR = 1·8), respectively). Our results assured that the principles of hospitalised people may occur in sarcopenia and malnutrition simultaneously(Reference Juby and Mager29). It should be taken into consideration that the coexistence of sarcopenia and malnutrition consistently increases the mortality risk by more than four times(Reference Wang, Wang and Li28). Therefore, GLIM using two phenotypes or GLIM using CC was suggested as a complementary alternative for assessing malnutrition in sarcopenia patients.
Malnutrition risk screening identified by the Global Leadership Initiative on Malnutrition criteria
Numerous screening tools have been notably known to identify the risk of malnutrition for the GLIM process(Reference Henriksen, Paur and Pedersen30–Reference Liu, Lu and Li32). As presented in Table 3, we found agreement on the use of the screening tool that will affect the malnutrition outcome of the GLIM operation. The outcome varied from 8·9 to 93 % depending on which screening tool was applied. This study demonstrates that patients at risk of malnutrition screened by SNST had the highest prevalence of being malnourished if diagnosed according to all GLIM methods.
SNST is an instrument developed particularly in the Indonesian population to screen hospitalised malnutrition patients(Reference Susetyowati, Hadi and Hakimi7). The value of the Kappa coefficient, Se, Sp, PPV and NPV was 0·803, 96·8, 81·7, 84·5 and 96·1 % compared with SGA(Reference Susetyowati, Hadi and Hakimi7,Reference Susetyowati, Sholikhati and Cahyaningrum31) . SGA is a reference method for malnutrition diagnosis since it covers medical history, infection, and physical examination(Reference Susetyowati, Sholikhati and Cahyaningrum31). It is also used to identify risk of malnutrition among patients receiving nutritional intervention during hospitalization(Reference Susetyowati, Sholikhati and Cahyaningrum31). This result suggests that SNST gives the highest prevalence of malnourished patients when used as a screening tool.
With GLIM using three phenotype criteria as the most comprehensive method, the lowest compatibility was shown between GLIM using ASMBIA with SNST, NRS-2002 or MST (35·7, 39·6 and 31·7 %, respectively). This may be a consequence of most screening tools not considering body composition determined by BIA measurements even though this parameter has potential for identifying hospital malnourished patients(Reference Tanaka, Takahashi and Akishita33). Another observation in the present research was the performance of NRS-2002 as the most user-friendly nutritional screening tool, along with MST as a widely used nutritional screening tool(Reference Cortes, Yañez and Capitán-Moyano34). Fu et al. reported that the prevalence of malnutrition according to GLIM using CC with NRS-2002 was 51·9 %(Reference Fu, Xu and Zhang35). Current study found that NRS-2002 was the most user-friendly nutritional screening tool. Consistent with findings by Fu et al who reported a 51.9% prevalence of malnutrition based on GLIM using CC and NRS-2002, our study demonstrated a higher prevalence (81.1%) when malnutrition risk was assessed using NRS-2002.
A recent study provided 44·4 % of malnourished patients diagnosed by GLIM if the MST was preliminarily applied, which is comparable to our overall result(Reference Clark, Reijnierse and Lim36). However, previous research stated that MST indicates an underestimation of aetiologic criteria for GLIM(Reference Clark, Reijnierse and Lim36). Having said that, using any of those three screening tools implies that the number of malnourished patients will be remarkably identified. Taken together, it is recommended that future studies include the analysis of the diagnostic tests when the diagnosis is applied without nutritional screening tools.
Sensitivity, specificity, negative predictive value and positive predictive value for using all possible combinations of the Global Leadership Initiative on Malnutrition criteria
In general, both single-step GLIM two phenotype criteria and GLIM using CC were good as diagnostic tools for malnutrition, with Sp being high (100 %) against the GLIM three phenotype criteria. However, the Se of the two methods of GLIM was relatively moderate (76·8 % for GLIM two phenotype criteria and 86·1 % for GLIM using CC) against GLIM three phenotype criteria as a reference comparator. The Se of the GLIM with two phenotypes and GLIM using CC for diagnosing malnutrition was more than two times higher than that of GLIM using ASMBIA. This suggests that assessing weight loss and BMI or CC alone may enable earlier detection of malnutrition compared with relying on ASM measurements from BIA(Reference Barazzoni, Jensen and Correia13–Reference Cederholm, Jensen and Correia15). Comparatively, there were no significant differences in diagnostic accuracy among the three GLIM-based methods for diagnosing malnutrition when compared with GLIM with three phenotypes as the reference standard. Among patients screened using three different tools (SNST, NRS 2002 and MST), Sp remained consistently at 100 %. This underscores that, regardless of the screening method performed, the three GLIM-based approaches demonstrate consistent diagnostic accuracy(Reference Win, Chua and Gwee16,Reference Cederholm, Jensen and Ballesteros-Pomar37) .
The findings of our study align with those of a recent longitudinal study conducted among older adults in Singapore. The GLIM criteria demonstrated good construct and criterion validity, with Se and Sp of 80 and 83 %, respectively, along with a PPV of 20 % and an NPV exceeding 98 %(Reference Win, Chua and Gwee16). The use of GLIM criteria also increased the number of individuals identified as malnourished(Reference Cederholm, Jensen and Correia15,Reference Cederholm, Jensen and Ballesteros-Pomar37) . Early identification of malnutrition using appropriate tools provides opportunities to delay or prevent adverse outcomes, such as impaired quality of life and increased mortality(Reference Boaz and Kaufman-Shriqui17–Reference Wahyudi, Ronoatmodjo and Setiati19). Another study further supports our findings. A meta-analysis reviewing 451 articles reported that the GLIM criteria demonstrated high diagnostic accuracy in identifying patients with malnutrition, showing a Se of 0·81, Sp of 0·80 and an AUC of 0·87 when compared with the SGA as the reference standard(Reference Boaz and Kaufman-Shriqui17–Reference Wahyudi, Ronoatmodjo and Setiati19). Screening and diagnosing malnutrition have relatively low risks of harm from false positives and false negatives compared with severe diagnoses like cancer(Reference Win, Chua and Gwee16,Reference Huo, Chong and Yin38) . Moreover, the follow-up tests are considerably low cost, quick and easy to perform(Reference Barker, Gout and Crowe18). Therefore, the current levels of PPV and NPV are considered acceptable. Additionally, the stringency of the screening test can be adjusted to optimise these metrics as needed(Reference Huo, Chong and Yin38).
Malnutrition is a significant factor contributing to the risk of sarcopenia, and the two conditions often coexist(Reference Boaz and Kaufman-Shriqui17,Reference Wahyudi, Ronoatmodjo and Setiati19) . Therefore, assessing skeletal muscle mass is highly recommended when low muscle function is detected or evident, regardless of age or clinical context, particularly in individuals with overweight or obesity(Reference Compher, Cederholm and Correia12,Reference Barazzoni, Jensen and Correia13) . In this regard, the implementation of GLIM criteria using BIA offers practical advantages, including affordability, portability of the device and the potential for repeated measurements compared with dual-energy x-ray absorptiometry, CT scan and MRI as the standards(Reference Compher, Cederholm and Correia12,Reference Cederholm, Jensen and Correia15) .
However, the use of BIA in routine clinical practice comes with several limitations that must be considered. BIA estimates body composition, including muscle and non-muscle components, by relying on electrical impedance(Reference Cederholm, Jensen and Correia15,Reference Cederholm, Jensen and Ballesteros-Pomar37) . Its accuracy can be affected by hydration status, with overhydration and oedema leading to overestimation and dehydration causing underestimation of fat-free mass(Reference Barazzoni, Jensen and Correia13,Reference Bian, Li, Wang and Chang14) . A study comparing the use of GLIM criteria with CT scans and BIA for measuring muscle mass found that the Se of GLIM criteria using CT scans for predicting overall complication rates was significantly higher than that of GLIM criteria using BIA (76·3 v. 31·9 %, respectively)(Reference Wobith, Herbst and Lurz39). Conversely, the Sp was higher with BIA compared with CT scans (81·6 v. 40 %, respectively)(Reference Wobith, Herbst and Lurz39).
As an alternative, when technology-based devices and the expertise to interpret them are not readily available, anthropometric measures such as CC and mid-arm muscle circumference, along with physical examination, are recommended due to their universal availability and ease of use, depending on clinician preference(Reference Compher, Cederholm and Correia12–Reference Cederholm, Jensen and Correia15). Supporting this approach, a study evaluating CC in assessing malnutrition among 405 gastric cancer patients found that left CC can serve as a reliable indicator of reduced muscle mass(Reference Fu, Xu and Zhang35). Against SGA as the reference standard, CC demonstrated a Se of 67·9 %, Sp of 87·3 %, PPV of 92·9 % and NPV of 52·8 %(Reference Fu, Xu and Zhang35).
The current GLIM criteria allow various combinations of phenotypic and aetiologic components for diagnosing malnutrition. However, further standardisation is needed, particularly regarding cutoff values and the combinations of these components(Reference de van der Schueren, Keller and Cederholm21). Nonetheless, the phenotypic characteristics used in this study were cost-effective and readily accessible across diverse healthcare systems and regions. This makes our study replicable and allows for meaningful comparisons with future prospective studies.
This study has several strengths and limitations. The strengths are 1) the study was conducted in a large population therefore statistical reliability was high; 2) participants were recruited from three provinces and multiple hospital types across Indonesia, ensuring heterogeneity in patient characteristics and disease profiles. Importantly, this is the first study in Indonesia to examine the prevalence of hospital malnutrition using the GLIM criteria and to compare it with modified GLIM approaches, including single-step GLIM with two phenotypes, GLIM using ASMBIA and GLIM using CC to measure muscle mass. From a clinical perspective, the findings may inform practical adaptations of nutritional screening protocols, particularly in resource-limited hospital settings. Given its high diagnostic performance and ease of use, CC appears to be a feasible alternative to GLIM using ASMBIA for assessing reduced muscle mass as an indicator of malnutrition within the GLIM-based diagnostic approach. Integrating CC into hospital-based nutritional care pathways could facilitate broader implementation of GLIM-based malnutrition diagnosis, especially where access to BIA is limited. These insights may help inform future updates to local or regional clinical practice guidelines.
Our study has several limitations. First, due to its cross-sectional design, the statistically significant associations observed among variables should be interpreted with caution. Further research is needed to explore the underlying factors contributing to these associations. Future studies are also encouraged to evaluate the performance of GLIM, particularly the use of GLIM with two phenotype criteria and GLIM using CC, against gold standards such as the Patient-Generated SGA and inflammatory markers like C-reactive protein.
Conclusions
Our study indicated that all four methods for diagnosing malnutrition showed associations with nutritional screening tools and nutritional status parameters. In terms of confirming malnutrition, GLIM with two phenotypes, GLIM using CC and GLIM using ASMBIA, were effective and more feasible in the Indonesian population at more severe stages of malnutrition, as indicated by their high Sp. However, GLIM with two phenotypes and GLIM using CC, due to their high Se, may overestimate malnutrition. Hence, malnutrition diagnosis should be followed by other physical examinations. Taking all results, the GLIM criteria are recommended to provide a valuable, standardised approach to diagnose malnutrition.
Acknowledgements
We express our sincere gratitude to the esteemed Universitas Gadjah Mada, a member of the Indonesian Collaborative Research, for fully granting us funding support and permission to publish this article. We also thank trained nutritionists, dieticians, nurses and medical doctors for their full assistance during the activity.
This research was funded by the Indonesian Collaborative Research, research grant managed by three (3) State Universities with Legal Entity Status, under award number 330/UN1.P/KPT/HUKOR/2024.
S. S.: Supervision, validation, data curation, investigation; A. Y. S.: Data evaluation, methodology; A. S.: Methodology, review and editing; R. W.: Formal analysis, writing, review and editing; F. F.: Statistical analysis, writing, review and editing; S. T. A.: Statistical analysis. All authors read and approved the final manuscript.
The authors declare no competing interests.
This study was conducted according to the guidelines laid down in the Declaration of Helsinki, and all procedures involving patients were approved by the Medical and Health Research Ethics Committee of the Faculty of Medicine, Public Health, and Nursing, Universitas Gadjah Mada, Yogyakarta, Indonesia, number KE/FK/0963/EC/2024. Written informed consent was obtained from all patients.