


Both the quantity and the type of carbohydrates in a food have been proposed to influence insulin sensitivity (IS). Jenkins et al. (Reference Jenkins, Wolever and Taylor1) initially developed the concept of glycaemic index (GI), stating that carbohydrate-containing foods that are either slowly or rapidly absorbed lead to different glycaemic responses. Repeated cycles of early postprandial hyperglycaemia and hyperinsulinaemia are characteristic of high-GI (HGI) diets and may cause impaired IS and β-cell dysfunction(Reference Ludwig2). Accordingly, some prospective observational studies have revealed a positive association between GI and the risk of type 2 diabetes(Reference Salmeron, Ascherio and Rimm3, Reference Schulze, Liu and Rimm4). Likewise, a low-GI (LGI) diet has repeatedly been shown to improve carbohydrate metabolism in a variety of intervention studies lasting 2–52 weeks(Reference Wolever, Jenkins and Vuksan5–Reference Krog-Mikkelsen, Sloth and Dimitrov9). However, these studies mainly included ‘at risk’ populations, i.e. overweight, obese, diabetic or hyperlipidaemic participants or those with CHD. It has been hypothesised that patients with high fasting and postprandial glucose concentrations may be more responsive to the effects of an LGI diet than healthy euglycaemic subjects(Reference Livesey, Taylor and Hulshof10).
The effect of LGI v. HGI diets on IS in healthy normal-weight subjects is less clear(Reference Jenkins, Kendall and Augustin7, Reference Livesey, Taylor and Hulshof10). Several dietary intervention studies in healthy lean individuals have shown improvements in carbohydrate metabolism with LGI compared with HGI diets(Reference Brynes, Mark Edwards and Ghatei8, Reference Jenkins, Wolever and Collier11, Reference Frost, Leeds and Trew12). By contrast, IS assessed by euglycaemic clamp was impaired after 4 weeks of an LGI diet in lean men(Reference Kiens and Richter13). Other studies have failed to find a difference in IS between LGI and HGI diets in healthy non-obese subjects(Reference Herrmann, Bean and Black14–Reference Alfenas and Mattes16). Importantly, the majority of previous studies have focused on modulation of GI during eu-energetic feeding or are constrained by a lack of controlled feeding conditions.
An issue of particular interest is the GI effect during nutritional stress imposed by dietary restriction followed by a refeeding period. Perturbations in energy balance and associated body weight fluctuations are common in normal to overweight individuals, as shown by holiday(Reference Yanovski, Yanovski and Sovik17) and weekend weight gain(Reference Racette, Weiss and Schechtman18) as well as weight gain during college years(Reference Crombie, Ilich and Dutton19). This weight gain is often followed by weight loss, resulting in repeated weight cycles. It is of great interest to study early metabolic alterations that could precede the development of obesity and obesity-related conditions, such as impaired glucose metabolism, to study potential preventive strategies. Recently, we have shown that 1 week of refeeding following 1 week of energy restriction reduced fasting and postprandial IS and increased glucose-stimulated insulin secretion in a group of healthy lean men(Reference Lagerpusch, Bosy-Westphal and Kehden20). The observed characteristics during refeeding may be explained by a sudden shift from fat to carbohydrate metabolism(Reference Crook, Hally and Panteli21). Refeeding an LGI diet after weight loss may therefore counteract the metabolic changes by reducing postprandial glucose and insulin concentrations and increasing serum adiponectin concentrations(Reference Pawlak, Kushner and Ludwig22, Reference Neuhouser, Schwarz and Wang23). Already slightly elevated postprandial glucose values have been proposed to be associated with an increased cardiac risk(Reference Gerstein and Yusuf24).
To the best of our knowledge, the present study is the first that examines the impact of GI on IS during controlled refeeding. In a group of young healthy men, we compared the effects of an LGI v. HGI refeeding diet by applying continuous interstitial glucose monitoring as well as basal state (fasting glucose, insulin and adiponectin, homeostasis model assessment of insulin resistance (HOMAIR), steady state (hyperinsulinaemic euglycaemic clamp) and dynamic techniques to assess IS (oral glucose tolerance test, OGTT). We hypothesised that (1) an LGI v. HGI diet during refeeding would result in an improved IS via attenuated glycaemia and insulinaemia when compared with the preceding energy restriction period and (2) that an LGI v. HGI diet would have no effect on IS after restoration of energy balance.
Subjects and methods
Subjects
A total of sixteen healthy men aged 22–37 years were recruited by notice board postings and mailing lists from the University of Kiel campus. Health status was assessed by medical history and physical examination. All subjects were normal weight, except for three participants, whose BMI ranged between 25·6 and 26·2 kg/m2. Subjects eligible for participation were non-smokers, weight stable ( ± 2 kg) within the preceding 12 months, did not use any medications, had no family history of type 2 diabetes, no food allergies and did not follow any special diets (e.g. vegetarian). Competitive athletes were also excluded from the study and subjects were instructed to refrain from exercise in the 1 week pre-intervention period. The present study was conducted according to the guidelines laid down in the Declaration of Helsinki, and all procedures involving human subjects were approved by the ethics committee of the Medical Faculty of the Christian-Albrechts-University of Kiel. Written informed consent was obtained from all subjects.
Experimental protocol
The 6-week controlled nutritional intervention study comprised 1 week of overfeeding (+50 % of energy requirement), 3 weeks of energy restriction ( − 50 % of energy requirement) and 2 weeks of refeeding (+50 % of energy requirement). During refeeding, subjects were divided into two sub-groups (n 8) receiving either high-fibre LGI or HGI foods. The subgroups were matched according to age, body weight, percentage body fat and glucose tolerance status (as assessed by OGTT). The initial overfeeding period was added to the study protocol to limit minimum body weight.
Before the dietary intervention, there was a 1-week pre-intervention period, during which each subject underwent a hyperinsulinaemic–euglycaemic clamp and an OGTT. Prior to the tests, resting energy expenditure was measured to determine individual energy requirement. Body weight and blood pressure were measured daily throughout the 6-week dietary intervention. Measurements of resting energy expenditure and OGTT as well as fasting blood sampling were repeated at the end of energy restriction and refeeding. Continuous interstitial glucose monitoring and a second euglycaemic clamp were performed at the end of the refeeding period. An outline of the experimental protocol is shown in Fig. 1.
Schematic overview of the study protocol. OGTT, oral glucose tolerance test; CGM, continuous glucose monitoring; GI, glycaemic index; T0, baseline; T1, end of energy restriction; T2, end of refeeding.

Participants arrived at the metabolic ward of the Institute of Human Nutrition every morning at 08.30 hours after an overnight fast of ≥ 10 h. During the pre-intervention period, they were allowed to leave the institute after all measurements were completed. Throughout the intervention period, subjects were requested to stay at the institute until dinner.
Experimental diet
During the pre-intervention period, habitual ad libitum food intake was allowed and assessed by 3 d food records. Energy intake (EI) was increased by 50 % of energy requirements during overfeeding and refeeding (mean EI 16 701 (sd 1918) kJ/d), and was reduced by 50 % during energy restriction (mean EI 5568 (sd 641) kJ/d). Individual energy requirement was calculated by multiplying resting energy expenditure by a physical activity level of 1·4, corresponding to sedentary behaviour during the entire study duration. A physical activity level of 1·4 was maintained by limiting physical activity to approximately 5000 steps/d. This was controlled by wearing activity monitors (SenseWear Pro3 Armband, Body-Media, Inc.). Subjects were also instructed to refrain from exercise throughout the entire study.
During the initial overfeeding period, subjects received a normal mixed diet. To standardise dietary intake, 50 % of the EI during energy restriction and LGI v. HGI refeeding was given as a liquid formula diet that was provided free of charge by the InsuLean company (InsuLean GmbH & Company KG). During energy restriction, the subjects consumed two liquid formula meals per d that were prepared with soya milk and enriched with lactose (18·9 (sd 2·0) g/drink) and sucrose (14·1 (sd 1·5) g/drink). During HGI refeeding, two liquid formula meals were prepared with lactose-free milk and two servings of grape juice were enriched with maltodextrin (43·1 (sd 6·4) g/drink). During LGI refeeding, three liquid formula meals prepared with soya milk and enriched with lactose (42·7 (sd 2·2) g/drink) and sucrose (32·0 (sd 1·6) g/drink) were consumed. Because some subjects reported diarrhoea and flatulence on the LGI diet, 50 % of lactose was replaced by sucrose in the first week of refeeding (lactose 21·3 (sd 1·1) g/drink, sucrose 53·3 (sd 2·7) g/drink). The remaining 50 % of energy was provided as HGI and LGI mixed-meals and snacks, respectively. Lower- or higher-GI versions of key ‘staple’ carbohydrate-rich foods were incorporated into the diet (e.g. lower- or higher-GI breads, rice, pasta and potato products). The relative glycaemic responses to the formula meals consumed during refeeding are given in the sample diets that are provided as Supplementary information (available online).
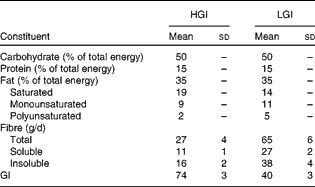
All foods and beverages consumed were provided during the intervention. The 7 d cycle menus were prepared by an experienced dietitian by using PRODI® software (Nutri-Science GmbH). The composition of the refeeding diet is given in Table 1. GI values of individual foods were taken from published international tables(Reference Foster-Powell, Holt and Brand-Miller25). The GI of the diet was calculated according to WHO/FAO guidelines(26) and averaged 40 units in the LGI and 74 units in the HGI diet, respectively. All diets consisted of 50 % of total daily energy as carbohydrate, 15 % as protein and 35 % as fat. Saturated, monounsaturated and polyunsaturated fats accounted for 19, 9 and 2 % of the total energy in the HGI diet and for 14, 11 and 5 % of the total energy in the LGI diet, respectively. Refeeding diets were not matched for fibre content, which was 65 (sd 6) g/d (27 (sd 2) g soluble fibre and 38 (sd 4) g insoluble fibre) in the LGI and 27 (sd 4) g/d (11 (sd 1) g soluble fibre and 16 (sd 2) g insoluble fibre) in the HGI diet group (P< 0·001). Subjects were instructed to eat all the foods provided, and meal intake was supervised by a skilled nutritionist. Participants were allowed to drink water, decaffeinated coffee and tea ad libitum and the fluid intake was recorded.
Composition of the high-glycaemic index (HGI) and low-GI (LGI) refeeding diets (Mean values and standard deviations)
Anthropometric measurements and body composition analysis
Height was measured to the nearest 0·5 cm using a stadiometer, with subjects not wearing shoes. Body weight was measured to the nearest 0·05 kg on an electronic scale (Seca 285, Seca GmbH & Co KG) with subjects in underwear and after voiding. Waist circumference was measured to the nearest 0·5 cm midway between the lowest rib and the iliac crest. Fat-free mass was assessed by air-displacement plethysmography (BOD-POD Body Composition System, Life Measurement Instruments), as described in detail elsewhere(Reference Bosy-Westphal, Mast and Eichhorn27).
Energy expenditure
Respiratory exchange measurements were performed by means of an open-circuit indirect calorimeter (ventilated hood system Vmax 29n, SensorMedics®; Sensor Medics 130 GmbH), as previously described(Reference Bader, Bosy-Westphal and Dilba28). Oxygen consumption and carbon dioxide production were continuously measured for ≥ 30 min and resting energy expenditure was calculated from steady-state intervals using a standard formula(Reference Weir29). Activity energy expenditure was assessed by the SenseWear Pro3 Armband (Body-Media, Inc.) that was continuously worn on the subject's dominant arm.
Blood sampling and analytic procedures
Plasma glucose was measured immediately upon sampling during hyperinsulinaemic–euglycaemic clamp and OGTT using a glucose oxidase method (BIOSEN C-Line, EKF-diagnostic). Fasting blood samples were obtained from an antecubital vein at the beginning of the study and at the end of energy restriction and refeeding. Fasting insulin and adiponectin concentrations were additionally analysed on days 2 and 4 of refeeding. After centrifugation for 10 min at 2000 g and 20°C within 40 min of sampling, the supernatant was stored at − 40°C until assayed. Serum insulin was determined by electrochemiluminescence immunoassay (Elecsys®, Roche Diagnostics). Serum adiponectin was analysed by ELISA (ELISA E09, Mediagnost).
Hyperinsulinaemic–euglycaemic clamp
During the pre-intervention period and at the end of refeeding, peripheral IS was assessed by the hyperinsulinaemic–euglycaemic clamp technique, as previously described(Reference Lagerpusch, Bosy-Westphal and Kehden20, Reference Bosy-Westphal, Kossel and Goele30). Whole-body IS (M-value, expressed as mg/kg fat-free mass per min) was determined from the mean rate of exogenous glucose infusion during the last 20 min of the clamp after correction for changes in the glucose pool size. Steady-state concentrations of serum insulin and plasma glucose (CVT0 5·8 (sd 2·3) %) were assayed using previously described methods(Reference Bosy-Westphal, Kossel and Goele30).
Oral glucose tolerance test
A standard 75 g OGTT was performed during the pre-intervention period and at the end of energy restriction and refeeding with venous blood sampling for glucose and insulin determinations at 0, 30, 60, 90, 120 and 180 min. Subjects lay quietly in a semi-recumbent position while watching video movies throughout the test. Glucose and insulin responses were calculated as incremental AUC (iAUC) above baseline using the trapezoidal method(Reference Matthews, Altman and Campbell31). Missing data were due to not being able to collect blood samples.
Continuous glucose monitoring
In a sub-group of subjects (n 4 in each GI group), interstitial glucose concentrations were measured by means of the FreeStyle Navigator® continuous glucose monitoring (CGM) device (Abbott Diabetes Care) at the end of the refeeding period. A glucose oxidase-based sensor was applied to the back of the upper arm to measure extracellular fluid glucose in subcutaneous tissue for five consecutive days. Sensor readings were reported every minute and an average value was stored in the monitor at every 10 min. Subjects were instructed on how to calibrate the device based on five separate finger stick capillary blood samples collected during this period. Total AUC for nighttime (total AUC-CGMnight: midnight to 07.00 hours) and iAUC for daytime (iAUC-CGMday: 08.00–22.00 hours) glucose were calculated using the trapezoidal method(Reference Matthews, Altman and Campbell31). Although sensor readings were recorded for the whole 5 d period, only the 24 h values monitored on Friday during the second week of refeeding were used for analysis.
Parameters of insulin sensitivity and insulin secretion
To estimate IS and insulin secretion, previously validated indices from either fasting or OGTT-derived glucose and insulin concentrations were calculated. An estimate of fasting IS was obtained by HOMAIR: fasting glucose × fasting insulin/22·5(Reference Matthews, Hosker and Rudenski32, Reference Hoffman33). Postprandial IS was estimated by Matsuda whole-body IS index (MatsudaISI): 10 000/((fasting glucose × fasting insulin) × (mean glucose × mean insulin during OGTT))1/2(Reference Matsuda and DeFronzo34). Overall, glucose-stimulated insulin secretion during OGTT was calculated as iAUC-insulin/iAUC-glucose(Reference Retnakaran, Shen and Hanley35).
Statistical analyses
Statistical analyses were performed using SPSS for Windows version 15.0 (SPSS, Inc.). Data normality was tested using the Kolmogorov–Smirnov test. Group differences at single time points were analysed by unpaired Student's t tests. Within-group changes following energy restriction were examined using paired Student's t tests. Differences between groups with refeeding, when compared with energy restriction, were analysed by a mixed-design ANOVA testing for differences between diet groups (main effect of diet), changes over time (main effect of time) and differences in time course between groups (diet group × time interaction) followed by pairwise comparisons with Bonferroni adjustment. Homogeneity of variance and sphericity were tested using Levene's test and Mauchly's test, respectively. Significant or near-significant interactions were followed up with an unpaired Student's t test at each time point to examine whether the effect of group depends on the time period. Because of significant between-group differences at baseline, hyperinsulinaemic clamp-derived M-values were also analysed using ANCOVA, with baseline values as a covariate and refeeding scores as the dependent variable. All statistical tests were two-sided and results were considered statistically significant if P< 0·05. Results are presented as means with their standard deviations.
Results
Subject characteristics at baseline
Baseline characteristics of the subjects are summarised in Table 2. There were no significant differences in age, anthropometric variables, body composition, blood pressure and energy expenditure between the LGI and HGI groups (P>0·05).
Subject characteristics at baseline (Mean values and standard deviations)
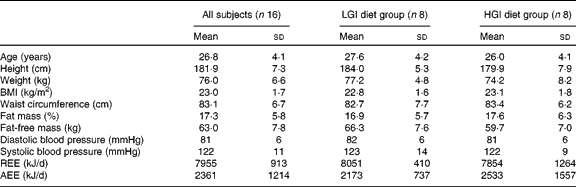
LGI, low glycaemic index; HGI, high glycaemic index; REE, resting energy expenditure; AEE, activity energy expenditure.
Changes in body weight during the intervention
Cumulative body weight changes for the 6-week duration of the study are shown in Fig. 2. When compared with baseline, body weight was significantly reduced following energy restriction ( − 4·3 (sd 0·8) kg, P< 0·001), with no significant difference between the LGI and the HGI groups ( − 4·4 (sd 0·8) v. − 4·1 (sd 0·9) kg, P= 0·50). Following refeeding, body weight was regained in both groups (P< 0·001), but the changes were not significantly different between subjects consuming the LGI and the HGI diets (LGI: 3·4 (sd 1·1) kg, HGI: 2·5 (sd 1·1) kg compared with energy restriction, P= 0·12).
Cumulative body weight changes for the 6-week duration of the study. Values are means, with standard deviations represented by vertical bars.  , Low-glycaemic index group (n 8);
  , high-glycaemic index group (n 8).

Continuous glucose monitoring
Mean 24 h interstitial glucose profiles at the end of the refeeding period are shown in Fig. 3(a). The incremental daytime AUC-CGM was significantly higher in the HGI group, whereas the total nighttime AUC-CGM did not differ between the LGI and HGI groups (Fig. 3(b) and (c)).
Glycaemic responses over 24 h for the low-glycaemic index (LGI, ) and high-glycaemic index (HGI, ) diet groups. A subgroup of individuals (n 8) underwent continuous interstitial glucose monitoring (CGM) at the end of the LGI (n 4) and HGI (n 4) refeeding period. (a) Interstitial glucose concentrations were measured every 10 min for 24 h. Values are means, with standard deviations represented by vertical bars. (b) Incremental areas under the glucose–response curve during daytime (iAUC-CGMday, 08.00–22.00 hours) and (c) total areas under the glucose–response curve during nighttime (tAUC-CGMnight 0–07.00 hours) are shown as an insert. □, LGI; ■, HGI. * Mean values were significantly different between groups (P= 0·04).

Parameters of insulin sensitivity during refeeding compared with energy restriction
Fasting and OGTT-derived parameters of IS following energy restriction and during the refeeding period are shown in Tables 3 and 4. There were no between-group differences in any outcome variable at the end of energy restriction (all P>0·05).
Changes in parameters of insulin sensitivity (IS) from baseline (T0) to energy restriction (T1) in all subjects (Mean values and standard deviations)
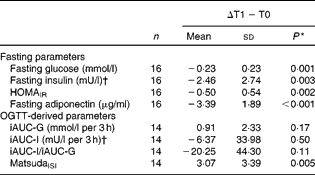
HOMAIR, homeostasis model assessment of insulin resistance; OGTT, oral glucose tolerance test; iAUC, incremental AUC; G, glucose; I, insulin; MatsudaISI, Matsuda insulin sensitivity index.
* Mean values at the end of energy restriction were significantly different from those at baseline (paired t test).
† To convert insulin from mU/l to pmol/l, multiply by 6·945.
Parameters of insulin sensitivity after energy restriction and after refeeding in the low-glycaemic index (LGI) and high-GI (HGI) diet groups (Mean values and standard deviations)

T1, end of energy restriction; T2, end of refeeding; Δ, change; HOMAIR, homeostasis model assessment of insulin resistance; OGTT, oral glucose tolerance test; iAUC, incremental AUC; G, glucose; I, insulin; MatsudaISI, Matsuda insulin sensitivity index.
* Number of subjects in each group.
† Mixed-design ANOVA with time, diet group and time × diet group interaction as factors.
‡ To convert insulin from mU/l to pmol/l, multiply by 6·945.
Fasting parameters of insulin sensitivity
Fasting measures of plasma glucose, serum insulin, serum adiponectin as well as HOMAIR were significantly decreased by energy restriction (Table 3). After 14 d of refeeding, serum adiponectin significantly increased, whereas plasma glucose remained unchanged. ANOVA showed no group × time interactions. In addition, fasting insulin and HOMAIR were significantly increased at the end of refeeding. Greater increases in insulin concentrations and HOMAIR were observed in the HGI group (Table 4).
Fasting levels of insulin and adiponectin were also analysed on days 2 and 4 of refeeding. Paired comparisons revealed that fasting insulin was significantly elevated on day 2 (LGI: +1·99 (sd 2·47) mU/l (+13·80 (sd 17·19) pmol/l), HGI: +3·71 (sd 2·80) mU/l (+25·78 (sd 19·47) pmol/l), P= 0·004) and on day 4 of refeeding (LGI: +3·87 (sd 2·75) mU/l (+26·91 (sd 19·11) pmol/l), HGI: +9·12 (sd 9·78) mU/l (+63·37 (sd 67·95) pmol/l), P= 0·017). At the end of the refeeding period, basal insulin levels remained unchanged when compared with day 4 of refeeding. No group × time interactions were present. Serum adiponectin was unaltered on day 2 (LGI: − 0·22 (sd 1·00) μg/ml, HGI: +0·02 (sd 0·53) μg/ml, P= 1·00 for paired comparison), but was significantly increased on day 4 of refeeding (LGI: +1·33 (sd 0·73) μg/ml, HGI: +1·12 (sd 0·36) μg/ml, P< 0·001 for paired comparison). On day 4 of refeeding, adiponectin concentrations were significantly higher than those at the end of the refeeding period (P< 0·001 for paired comparison). These changes occurred independently of the diet group.
Oral glucose tolerance test-derived parameters of insulin sensitivity
During energy restriction, MatsudaISI significantly improved and glucose-stimulated insulin secretion tended to decline, whereas glucose and insulin responses to oral glucose ingestion remained unchanged (Table 3). After refeeding, iAUC-glucose decreased and glucose-stimulated insulin secretion increased towards baseline values. No group effects were noted. iAUC-insulin was not altered by refeeding in either group. There was a significant interaction between diet group and time, with a refeeding-induced decline in MatsudaISI in the HGI group only (P= 0·005). By contrast, refeeding had no effect on MatsudaISI in the LGI group (P= 0·27) (Table 4).
Parameters of insulin sensitivity at the end of refeeding compared with baseline
Fasting-, OGTT- and clamp-derived parameters of IS at the end of refeeding compared with baseline are shown in Table 5. There were no significant baseline differences between the two diet groups, except for M-values that were significantly higher in the LGI group (P= 0·04).
Parameters of insulin sensitivity at baseline and after refeeding in the low-glycaemic index (LGI) and high-GI (HGI) diet groups (Mean values and standard deviations)

T0, baseline; T2, end of refeeding; Δ, change; HOMAIR, homeostasis model assessment of insulin resistance; OGTT, oral glucose tolerance test; iAUC, incremental AUC; G, glucose; I, insulin; MatsudaISI, Matsuda insulin sensitivity index; SSPG, steady-state plasma glucose; SSSI, steady-state serum insulin.
* Number of subjects in each group.
† Mixed-design ANOVA with time, diet group and time × diet group interaction as factors.
‡ To convert insulin from mU/l to pmol/l, multiply by 6·945.
Fasting parameters of insulin sensitivity
When compared with baseline, fasting glucose was significantly decreased and adiponectin levels tended to be elevated at the end of refeeding. No group × time interactions were observed. There were no significant changes in fasting insulin and HOMAIR in either group at the end of refeeding compared with baseline.
Oral glucose tolerance test-derived parameters of insulin sensitivity
No significant main effect of time or group × time interactions were observed with regard to AUC-glucose, AUC-insulin, insulin secretion and MatsudaISI at the end of refeeding compared with baseline.
Clamp-derived parameters of insulin sensitivity
There were no changes over time in either group with respect to steady-state plasma glucose and steady-state serum insulin during the hyperinsulinaemic–euglycaemic clamp. Although M-values differed significantly between groups at baseline, ANCOVA provided no evidence of a covariate effect (P= 0·86) so that data were analysed using ANOVA. M-values during refeeding were unchanged from baseline and did not significantly differ between the LGI and HGI groups. Fat-free mass did not differ between groups following refeeding (LGI: 63·7 (sd 5·5) kg, HGI: 61·0 (sd 9·5) kg, P= 0·50).
Discussion
In the present study, we investigated whether an LGI v. HGI diet may improve IS during refeeding in healthy, young, non-obese men. Interstitial glucose monitoring confirmed higher glucose responses during the day in the HGI diet group. When compared with the end of the energy restriction period, refeeding-induced decreases in fasting measures of IS were significantly greater in the HGI than in the high-fibre LGI group and OGTT-derived IS was decreased in the HGI group only. At the end of the refeeding period, fasting-, OGTT- and euglycaemic clamp-derived parameters of IS did not statistically differ from baseline values in either group.
Effect of glycaemic index on daylong glycaemia
Interstitial glucose measurements revealed higher glycaemia during the day on the HGI diet (Fig. 3). This shows that an LGI diet can be implemented under realistic conditions in terms of food choice and macronutrient composition to avoid excessive postprandial glucose excursions. By contrast, other authors reported no difference in the 24 h interstitial glucose concentrations in controlled laboratory or at home settings following 7 d macronutrient- and fibre-matched LGI and HGI diets in healthy overweight women(Reference Aston, Laccetti and Mander36). The lower interstitial glucose concentrations on the LGI diet in the present study could therefore be due to the lower GI of the diet as well as to the higher content of indigestible carbohydrates, which may have added to the beneficial effect on blood glucose over the course of the day. This is supported by the fact that the present results are in agreement with a previous study that showed a decrease in 24 h interstitial glucose after 7 d on a free-living LGI diet, with a concomitant increase in dietary fibre intake(Reference Brynes, Adamson and Dornhorst37). The combination of fibre and LGI has been shown to beneficially affect glycaemia at a subsequent meal through the ‘second-meal’ effect(Reference Crombie, Ilich and Dutton19).
Parameters of insulin sensitivity during refeeding compared with energy restriction
When compared with the end of the energy restriction period, the decreases in fasting measures of IS with refeeding were significantly greater in the HGI than in the LGI group (group × time interaction for serum insulin and HOMAIR), and OGTT-derived IS was decreased in the HGI group only (group × time interaction for MatsudaISI) (Table 4). The majority of previous GI interventions were designed as weight maintenance studies and did not find a beneficial effect of LGI diets on parameters of IS in healthy euglycaemic individuals(Reference Kiens and Richter13–Reference Alfenas and Mattes16). By contrast, few controlled studies have investigated the effect of GI during periods of perturbed energy balance. These studies included type 2 diabetic(Reference Heilbronn, Noakes and Clifton38), obese(Reference Raatz, Torkelson and Redmon39, Reference Solomon, Haus and Kelly40), overweight(Reference Heilbronn, Noakes and Clifton38, Reference Pittas, Roberts and Das41) and/or older individuals(Reference Solomon, Haus and Kelly40) markedly improving their metabolic control by weight loss or exercise regimens, whereas our subjects were healthy and predominantly normal-weight at baseline. As opposed to the present findings, the earlier cited studies suggest that the GI effect is superimposed by weight loss or exercise regimens that exert a more pronounced effect on glucose metabolism and parameters of IS(Reference Heilbronn, Noakes and Clifton38–Reference Pittas, Roberts and Das41). A 6-month energy-restricted LGI v. HGI diet ( − 30 % EI), which also differed in glycaemic load, equally improved fasting as well as OGTT-derived IS in overweight subjects, suggesting that GI does not affect glucose–insulin dynamics beyond that associated with weight changes(Reference Pittas, Roberts and Das41). The discrepant findings might not only be due to inclusion of different study populations, but also to differences in energy balance, because the participants of the present study were exposed to an energy surplus instead of a deficit. To our knowledge, there has been no study examining the GI effect in healthy normal-weight individuals during a positive energy balance. Subjects in the LGI group tended to regain slightly more body weight than those in the HGI group (P= 0·12) (Fig. 2). Theoretical work suggests that insulin resistance prevents weight gain(Reference Eckel42, Reference Tremblay, Boule and Doucet43). It has been shown that an elevated IS was associated with the propensity of future weight gain(Reference Swinburn, Nyomba and Saad44). A metabolic setting of increased IS by energy restriction has been related to altered partitioning of lipid fuels with accelerated uptake and storage in adipose tissue(Reference Eckel42).
While energy restriction increased and refeeding decreased IS, adiponectin behaved inversely and decreased with energy restriction or increased with refeeding, respectively (Tables 2 and 3). This contrasts with the positive association between IS and serum adiponectin that is observed in cross-sectional studies(Reference Yamauchi, Kamon and Minokoshi45). However, it has been suggested that a change in adiponectin is not a cause, but rather a consequence of long-term changes in IS(Reference Astrand, Carlsson and Nilsson46, Reference Cook and Semple47).
Parameters of insulin sensitivity at the end of refeeding compared with baseline
At the end of the refeeding period, fasting-, OGTT- and euglycaemic clamp-derived parameters of IS did not statistically differ from baseline values in either group (Table 4). This is in agreement with previous studies focusing on the effect of GI of the diet on IS during isoenergetic or ad libitum feeding(Reference Kiens and Richter13–Reference Alfenas and Mattes16). Whereas a favourable effect of LGI has mainly been found in overweight subjects(Reference Brynes, Mark Edwards and Ghatei8, Reference Krog-Mikkelsen, Sloth and Dimitrov9) or those with cardiometabolic risk factors(Reference Wolever, Jenkins and Vuksan5–Reference Brynes, Mark Edwards and Ghatei8), healthy euglycaemic individuals might be less susceptible to changes in glucose–insulin dynamics in eu-energetic conditions (for reviews, see Jenkins et al. (Reference Jenkins, Kendall and Augustin7) and Livesey et al. (Reference Livesey, Taylor and Hulshof10)). Results of a meta-analysis of GI interventions did not support an improved IS with LGI diets in healthy normal-weight individuals, whereas beneficial effects were seen when fasting glucose levels exceeded 5 mmol/l or fasting insulin levels were above 100 pmol/l(Reference Livesey, Taylor and Hulshof10). Accordingly, a controlled 8 d isoenergetic LGI v. HGI crossover study in young healthy lean adults revealed no group difference in glycaemic and insulinaemic responses to OGTT(Reference Herrmann, Bean and Black14). The present results are also in line with a study by Kiens & Richter(Reference Kiens and Richter13) showing that fasting levels of glucose and insulin as well as whole-body glucose uptake at a low plasma insulin concentration during clamp were similar for isoenergetic LGI and HGI diets after 4 weeks in healthy young men. However, it may be speculated that a prolonged refeeding duration that results in an overfeeding situation with a positive cumulative energy balance could lead to a more pronounced difference in parameters of IS.
Clinical importance and limitations of the findings
Perturbations in energy balance and associated body weight fluctuations are common in normal-to-overweight individuals, as shown by weight gain over the weekend, holidays and during college years, for example(Reference Yanovski, Yanovski and Sovik17–Reference Crombie, Ilich and Dutton19). This weight gain is often followed by weight loss, resulting in repeated weight cycles. As disease progress constitutes a continuum, it is of great interest to study early metabolic characteristics that are associated with these fluctuations in body weight and could precede the development of obesity and impaired glucose metabolism. The present results show that a high-fibre LGI diet may be preventive or may correct early metabolic changes in this group of healthy non-obese subjects under conditions of perturbed energy balance and presumably high insulin secretion. The clinical relevance of modestly reduced day-long glycaemia in the range of normal blood glucose levels is supported by the fact that postprandial glycaemia as low as 5·4 mmol/l has already been associated with an increased cardiac risk(Reference Gerstein and Yusuf24).
As fibre content was significantly higher in the LGI diet, any difference in glycaemia and IS might also be ascribed to a higher intake of soluble and insoluble (mainly cereal) fibre. Soluble fibre has been shown to reduce glycaemia, whereas insoluble cereal fibre is associated with increased IS(Reference Weickert and Pfeiffer48). By contrast, other authors found no relationship between the consumption of whole-grain foods and IS in healthy subjects(Reference Andersson, Tengblad and Karlstrom49). Moreover, although the LGI diet was considerably higher in dietary fibre, the HGI diet was also relatively high in fibre, with daily intakes approximating the recommended 30 g by the German Nutrition Society. It is difficult to create a diet differing in GI with equal fibre content when using commonly consumed food items, because LGI foods do generally have a higher content of indigestible carbohydrates. Moreover, larger differences in GI are difficult to achieve without increasing fibre intake(Reference Aston, Laccetti and Mander36). The combination of a low GI and a high fibre intake has been shown to have the largest effect on disease risk reduction(Reference Livesey, Taylor and Hulshof10). One reason may be the low GI of a high-fibre diet, but there may also be other aspects independent of GI, e.g. reduced nutrient absorption, altered secretion of gut hormones, a shift of the gut microbiota structure and modulation of inflammatory markers(Reference Weickert and Pfeiffer48). However, a lower nutrient absorption linked to a high fibre intake is highly unlikely in the present study, because subjects in the LGI group tended to regain more body weight than those in the HGI group.
Although confounding effects of different fatty acid profiles in the two diets cannot be ruled out, it is likely that the present study protocol was too short and differences in fatty acid quality between diet groups were too small to detect significant effects on IS. Whereas a relationship between dietary fat quality and IS has been shown in a 3-month controlled trial, the majority of controlled and intervention studies in healthy subjects, particularly in the short term, have shown negative results(Reference Galgani, Uauy and Aguirre50).
The present study has several strengths, including the strictly controlled nutrition regimen, monitoring of physical activity and the assessment of IS in the fasting state as well as under dynamic and steady-state conditions. Despite these strengths, the generalisability of the findings is limited by the relatively small sample size. However, effect sizes ranged from 0·31 to 0·54 and support the clinical significance of our findings.
Conclusion
In conclusion, the present study showed that refeeding caused a relative state of insulin resistance when compared with the preceding energy restriction period. The decrease in IS was more pronounced in the high-GI lower-dietary fibre group than in the low-GI high-dietary fibre group. A nutritional stress situation imposed by dietary restriction followed by refeeding may be necessary to evoke a GI/fibre effect in healthy non-obese individuals. Fibre-rich low-GI foods may improve glucose metabolism during a state of physiological vulnerability, i.e. the refeeding phase of a weight cycle or the weight maintenance phase after weight loss.
Supplementary material
To view supplementary material for this article, please visit http://dx.doi.org/10.1017/S000711451200462X
Acknowledgements
We thank Ulrike Preuß (Institute of Human Nutrition and Food Science, Christian-Albrechts University Kiel) for her assistance in food preparation and all the subjects for their participation in the study. The authors declare no conflict of interest. The present study was supported by a grant of the German Ministry of Education and Research (BMBF 0315681) and the German Research Foundation (DFG Bo 3296/1-1). M. J. M. and A. B.-W. designed the research; M. L., J. E., W. L., B. E. and A. B.-W. conducted the research; M. L., D. P., M. J. M. and A. B.-W. discussed the data; M. L. analysed the data; M. L., M. J. M. and A. B.-W. wrote the paper; M. L., A. B.-W. had primary responsibility for the final content. All authors read and approved the final manuscript.



