Obesity has become a global epidemic beyond high-income countries to include many less developed and middle-income countries( Reference Caballero 1 ). In Latin America and the Caribbean the prevalence of obesity and overweight can be as high as, or even higher than, that in developed nations( Reference Filozof, Gonzalez and Sereday 2 – Reference Feinstein, Sabates and Anderson 8 ). For example, by 2008 the Dominican Republic and Mexico reached rates of overweight among the adult female population that surpassed 70 %, and in no country of the region, with the exception of Haiti, was the rate lower than 50 %( 6 ).
The emerging overweight and obesity epidemic in developing regions is partly the result of rapid changes in food environment and diet styles associated with the nutrition transition (NT), made up of several stages in the shift from traditional to contemporary nutritional patterns. Introduced by Popkin in 1993, NT indicates the shift of dietary consumption and the subsequent nutritional change in total energy intake among a population( Reference Feinstein 9 – Reference Popkin and Gordon-Larson 14 ). Due to the low development of food supply technologies (i.e. hunting and gathering food, low-technology agriculture), at the earliest stage of the NT, people have access to foods low in fats and cereal-predominant with still some risk of nutritional deficiency. At the intermediate stage, the diet begins to consist of more fat (especially from animals), sugar and processed foods, with increased rates of overweight and obesity and associated diseases among the population. At the most advanced stage of the NT, extreme access to animal fats, sugar and processed foods results in high overall rates of obesity, but with a growing proportion of the population attempting to control body weight by consuming less fat and processed foods and consuming more fruits and vegetables. Significant shifts towards the intermediate and advanced stages occurred over the last several decades of the 20th century as most regions experienced the ‘Western diet’ – high in saturated animal fats, sugar/sweeteners but low in fibre – effecting changes in average stature, body composition and morbidity( Reference Popkin 13 ). While an advancing NT can alleviate the risk of undernutrition, the great influx of cheap, energy-dense and nutritionally poor foods requires individuals and communities to self-regulate their diet and lifestyle to prevent unnecessary increases in body weight( Reference Feinstein 9 ). In the present study, the NT stage is operationalized as the percentage of energy derived from animal fats and sugars/sweeteners over the total energy intake.
In order to lessen the health challenges of growing overweight in the region, education, with its influence on increased health literacy and accurate decision making, is a potentially important factor: past research frequently finds its role as a social vaccine that assists individuals and communities in improving health and life expectancy( Reference Rivera, Barquera and Gonzalez-Cossío 15 – Reference Renkert and Nutbeam 17 ). The term ‘social vaccine’, as a metaphor to highlight the social determinants of health, has been generally used to describe the preventive role of mass education in public health problems associated with higher morbidity and mortality( Reference Peters, Baker and Dieckmann 18 – Reference Kelly 20 ). Analogous to immunization by a medical vaccine, education is described as a social vaccine to illustrate its potential of raising a person’s capacity to select healthier lifestyles using better knowledge and cognitive skills( Reference Peters, Baker and Dieckmann 18 , 21 ). Consistently, research in high-income countries reports, ceteris paribus, significant effects of formal education on reducing individual risk of being overweight and obese, particularly among women( Reference Feinstein, Sabates and Anderson 8 , Reference Baum, Narayan and Sanders 22 – Reference Sassi, Devaux and Church 27 ). A reverse gradient, however, has been found in some developing countries and in Latin America in particular, where the more educated are often more likely to be overweight( Reference Hook, Altman and Balistreri 5 , Reference Kain, Vio and Albala 7 , Reference Martorell, Khan and Hughes 28 – Reference Monteiro, Conde and Popkin 31 ); also there are reports that education has no effect on overweight in samples from middle-income countries( Reference McLaren 26 , Reference Martorell, Khan and Hughes 28 , Reference Martorell, Khan and Hughes 29 , Reference Jacoby, Goldstein and Lopez 32 ). This leads to speculation that the relationship between educational attainment and risk of overweight may vary by population context, a prominent one being the NT stage. Since, along with a worsening obesity epidemic, the rate of importation of energy-dense foods from the Western food market system varies across Latin American/Caribbean countries, the situation in the region is suitable to examine the dimensions of the influence of education on mother’s overweight across the NT( Reference Kain, Vio and Albala 7 , Reference Popkin and Gordon-Larson 14 ).
There are a number of reasons why education effects on overweight might differ by NT stage, but clear empirical evidence remains unavailable. Cultural and economic explanations suggest that overweight body size is regarded as a symbol of wealth, intelligence or health in developing countries, or that the economic benefits of more education might be used primarily to afford access to more and less healthy food( Reference McLaren 26 ). Others have argued that information on the risks associated with obesity is unavailable or irrelevant in poor countries when food is not sufficient for survival( Reference Drewnowski and Popkin 12 , Reference Popkin 33 ). Despite these speculations, it has yet to be established if counter education gradients across populations are part of a larger consistent pattern, and if the NT plays a role in this. A similar pattern has been found for education effects during the epidemiological transition away from a disease load of mostly communicable diseases to chronic diseases, and during the course of the HIV/AID epidemic in sub-Saharan Africa( Reference Fortson 34 ). And it is likely that these patterns of education effects on disease across changing population contexts are incidences of the same general process known as the ‘population education transition’ (PET) curve( Reference Smith, Anderson and Salinas 35 ). These ideas applied to the NT and to the risk of overweight among women are analysed in two steps.
First, the problem of heterogeneous education effects on overweight status is addressed through an analysis of the optimal functional form of the association between education and mother’s overweight in Latin American/Caribbean populations. For the most part, previous research on obesity and overweight in developing countries has used linear specifications of the education gradient and binary definitions of national development (developing/developed). As a result, existing research pays insufficient attention to a potential non-linear relationship between education and obesity and to the specific dynamics at intermediate developmental stages (e.g. low- to middle-income countries at various NT stages). Across these kinds of transitional populations a non-linear specification might better fit the data, as some education and its impact on status and material resources can lead to higher consumption of fat and sugar but higher levels of education lead to better comprehension of and effective reaction to the rapid changes in the food supply. Indeed, a non-linear relationship between education and health has been reported in different contexts for a number of other diseases and health risks( Reference Fortson 34 – Reference Everett, Rehcopf and Rogers 39 ). Thus, the first hypothesis is that an inverted U-shaped curve will be the optimal functional form to represent the overall relationship between education and overweight across a pooled sample from Latin American/Caribbean countries.
Second, while a non-linear education–overweight association may optimally form across all stages of the NT, the nature of the association may be linear with a positive or negative slope in national populations depending on the countries’ current stage in the transition – the nature of the association likely changes dynamically as the NT progresses( Reference Sobal and Stunkard 23 , Reference McLaren 26 ). For example, prior research from other population transitions and their related health challenges finds that as risks (e.g. tobacco, multi-partner sex, high-alcohol-content liquor) are introduced into a population, superior material and status benefits from education lead to higher risk taking among the more educated, but as the transition deepens the greater knowledge and better decision-making skills about prevention accrued from education lead to a reduction in risk taking and higher prevention behaviours among the educated( Reference Renkert and Nutbeam 17 , Reference Cutler and Lleras-Muney 36 – Reference de Walque 40 ). And as more information and experience with risks accrue within the population, it takes less education to form accurate knowledge and preventive action( Reference Renkert and Nutbeam 17 , Reference Cutler and Lleras-Muney 36 ). Lastly, these dynamics occur while greater access to the risk factors (i.e. less expensive tobacco, high-fat food, etc.) increases health risks in the overall population. Thus, as the NT progresses and Western diets become more accessible in a country, the second hypothesis is that two components of the education–overweight curve will change over cohorts of mothers: (i) as NT status develops, the preventive role of education in reducing overweight prevalence will diffuse to the less educated population; and (ii) the increase of NT will cause a greater probability of being overweight, especially for the less educated population. Taken together, these hypotheses highlight a long-term population transition in the role of education in risk of obesity.
Methods
Data
Data from repeated administrations of the Demographic and Health Surveys (DHS) in eight Latin American countries and one bordering Caribbean country were mainly used to examine the research hypotheses. The data sets have large sample sizes ranging from 5000 to 30 000 households, collecting variables about population and health( Reference Rutstein and Roja 41 ). To capture variation in NT stage, twenty-two ‘country-time’ units were created from the DHS administrations: Bolivia (1994, 1999, 2003 and 2008), Brazil (1996), Colombia (1995, 2005 and 2010), Dominican Republic (1991 and 1996), Guatemala (1995 and 1999), Haiti (1995, 2000 and 2006), Honduras (2006), Nicaragua (1998 and 2001) and Peru (1992, 1996, 2002 and 2008; see Appendix).Footnote * The target population is women of reproductive age (15–49 years) who have given birth at least once at the administration of DHS. In addition to understanding the association between education and women’s weight, focusing on mothers is important given their crucial role in the intergenerational transmission of health inequalities( Reference Bryk and Raudenbush 42 ). The pooled sample across all country-time units includes 143 258 mothers.
The information regarding NT status of each administration is not available in the DHS. Instead, the FAO provides information on food balance by country and by time in its Food Balance Sheets (FBS), including estimates of the total daily energy availability per capita (kcal/d per capita), the energy derived from each dietary source (kcal/d per capita) and the consumed weight of each dietary source (g/d per capita) for each population in a year. The FBS data were used to generate an indicator of the national NT status for each country-time unit (i.e. year of each DHS administration in a country).
For the other population-level information including gross domestic product (GDP) per capita and urbanization, World Bank statistics were used.
Dependent variable
‘Mother’s overweight’ is an individual-level dichotomous measure constructed from BMI calculated as [weight (kg)]/[height (m)]2, with BMI≥25·0 kg/m2 coded as overweight, and the non-overweight group is the reference category( Reference Uauy, Albala and Kain 3 , 6 , Reference Sassi, Devaux and Church 27 ).
Independent variables
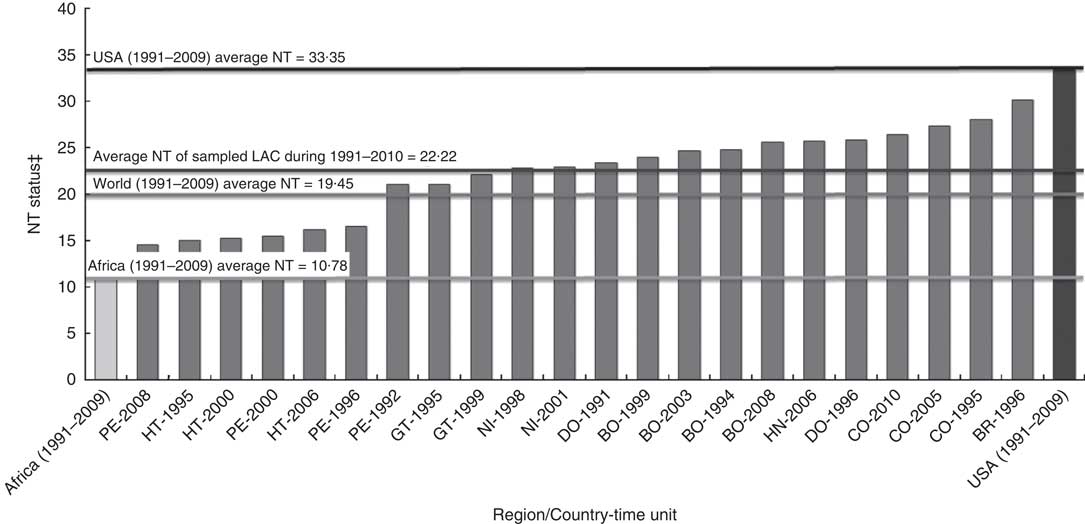
‘Formal education’ is measured as years of schooling completed by the mother. ‘NT status’ of each country-time unit is measured by the standard index constructed for the proportion of animal fats and sugar/sweeteners over the total energy availability per day per capita (kcal/d per capita) in a country in the year of the DHS administration( Reference Feinstein 9 , Reference Drewnowski and Popkin 12 ). In the NT status, animal fats includes all types of fat consumption from all kinds of animal sources and sugar/sweeteners also consists of all types of sweetening sources including non-centrifugal sugar, raw equivalent sugar, honey and other sweeteners. As shown in Fig. 1, falling between African countries at mostly modest levels of NT and the USA at an advanced level, the sampled countries varied in their initial NT status in 1991 as well as in the speed of progression across statuses over the next 20 years.
Nutrition transition (NT) status of the sampled country-time units in comparison with Africa* and the USA (from FAO( 52 ))†. *FAO provides the aggregated information on each continent. This NT status of Africa contains all countries in Northern, Southern, Western and Eastern African regions. †The NT statuses of Africa and the USA indicate the average value during 1991–2009. Note that FAO statistics provide the information related to NT until 2009. Therefore, the NT index of Colombia 2010 was assumed to be the same as that of Colombia 2009. ‡NT status indicates the percentage of animal fats and sugar/sweeteners in the total food supply in each country. For example, 30 in BR-1996 (the second column from the right) means that a Brazilian consumed 30 % of his or her energy intake as animal fats and sugar/sweeteners in 1996 (LAC, Latin American and Caribbean countries; BO, Bolivia; BR, Brazil; CO, Colombia; DO, Dominican Republic; GT, Guatemala; HT, Haiti; HN, Honduras; NI, Nicaragua; PE, Peru)
Control variables
To estimate the impact of education and NT status more exactly, the analysis controlled for six variables related to the probability of overweight. At the individual level, ‘household wealth’ and ‘urbanicity’ influence obesity because of the economic and geographic proximity to Western-style diets and processed foods( Reference Kennedy, Nantel and Shetty 10 , Reference McLaren 26 , Reference Monteiro, Conde and Lu 30 ). In addition, ‘age’ and ‘pregnancy’ are known physiological factors affecting body weight( 6 , Reference Sassi, Devaux and Church 27 ). At the population level, ‘GDP per capita’ and ‘urbanization’ were controlled to consider the relationship between national development, marketization of the food system and the proportion of overweight people( Reference Feinstein 9 , Reference Popkin 13 ).
‘Household wealth’ is measured through a composite score with mean of 0 and sd of 1, generated through a factor analysis that combined data on availability of various home possessions (electricity, radio, television, refrigerator, bike, motorcycle and car), as reported in the DHS.Footnote *
‘Age’ indicates woman’s age ranging from 15 to 49 years.
‘Urbanicity’ is a dichotomous indicator of the area of residence of the mother (urban=1).
‘Pregnancy’ is measured as a dichotomous variable (pregnant woman=1); this is an important control because pregnant women are more likely to weigh more than non-pregnant women.
‘GDP per capita’ of each country-time unit is measured as a natural log-transformed value in order to meet the assumption of normal distribution in the year of DHS administration.
‘Urbanization’ of each country-time unit is measured as the percentage of the population living in urban areas over the total population in the year of DHS administration.
Analytical strategy
Multilevel modellingFootnote † is an adequate method because it allows one to deal with a stratified data structure where individual cases (mothers) nested in the groups (country-time units) are affected by those groups’ contextual influence( Reference Bryk and Raudenbush 42 ). A series of logistic regression models was estimated to calculate the probability of being overweight relative to non-overweight groups based on the following equations.Footnote ‡
Individual level:
 $$\eqalignno{ \quad\ln [P_{i} /(1{\minus}P_{i} )]=\,\beta _{0} {\plus}\beta _{1} ({\rm Education}){\plus}\beta _{2} ({\rm Education}^{{\rm 2}} )\cr{\plus}\beta _{k} ({\rm Controls})$$
Population level:
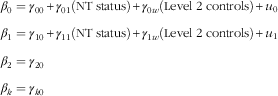 $$\eqalignno{\quad & \beta _{0} =\gamma _{{00}} {\plus}\gamma _{{01}} ({\rm NT \;status}){\plus}\gamma _{{0w}} ({\rm Level\; 2\; controls}){\plus}u_{0} \cr & \beta _{1} =\gamma _{{10}} {\plus}\gamma _{{11}} ({\rm NT \;status}){\plus}\gamma _{{1w}} ({\rm Level \;2\; controls}){\plus}u_{1} \cr & \beta _{2} =\gamma _{{20}} \cr & \beta _{k} =\gamma _{{k0}} $$
In equation (1), the individual-level equation, P i denotes the individual probability of being overweight in the pooled sample. The outcome is the log odds of the probability of overweight (P i ) over the probability of non-overweight (1−P i ). β 0 indicates the initial probability of being overweight among women with no schooling after controlling other variables in the pooled sample.Footnote § β 1 and β 2 represent the linear and quadratic effects of education and β k are coefficients of individual-level covariates. In equation (2), the population-level equation, γ 00 is the average log odds of overweight in all groups after controlling for level 2 explanatory variables, γ 01 describes the effect of national NT on national average of overweight and γ 0w represents the effect of level 2 variables on the average overweight rate. In the level 2 equation on education–overweight slope (β 1), γ 11 indicates the moderating effect of NT on determining the education gradient and γ 1w shows the effect of population-level variables on the linear education–overweight slope. Finally, level 2 residuals are assumed only in the intercept (u 0) and linear slope of education (u 1), because the variance component of the quadratic term of education was estimated to be zero despite the statistical significance. Other slopes of control variables (γ k0) are fixed at zero because the group differences among these covariates are not the focus here.
The initial estimated model on the pooled sample of mothers across all country-time units without including information on NT status evaluates the linear effect of education on the risk of overweight; this initial model is examined including individual covariates. A second model adds the quadratic term of education (education2), testing the first hypothesis postulating a curvilinear relationship between education and overweight across all country-time units. A third model examines the moderating impact of the NT status of each country-time unit on the education–overweight relationship by estimating the effect of NT at level 2 on the education–overweight slope (β 1), as well as on the probability of overweight (β 0), conditioning on county-time units’ level of urbanization and GDP per capita.
Design effects and multiple imputation of missing data
In order to consider design effects of the data set we included individual-level and population-level weighting variables in the analysis.Footnote * The ice option in the STATA 12·0 statistical software package generated five imputed data sets used to derive average corrected coefficients and standard errors of variables in the main analysis( Reference Royston 44 ). Multiple imputations were conducted to estimate and replace missing data.
Results
Descriptive statistics
Table 1 shows the descriptive statistics for the pooled sample; 41·5 % of Latin American mothers were overweight. The average years of schooling among women in the sample was about 6·4 years, their average age was about 29 years, 8 % were pregnant at the moment of the survey and more than half of them resided in an urban area (53·4 %). At the country-time unit level, the average NT status of the pooled sample was 21·823, indicating the proportion of animal fats and sugar/sweeteners in the total dietary intake. As social developmental confounders, GDP per capita was 1911·312 constant 2000 US dollars and approximately 64 % of the population resided in urban areas.
Means or proportions and standard deviations for all variables and sample size
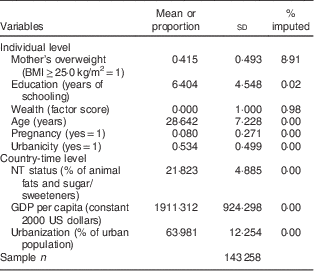
NT, nutrition transition; GDP, gross domestic product.
Functional form
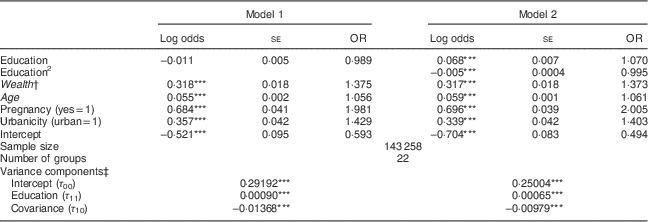
The first two models in Table 2 compare the linear and non-linear functional forms of the effects of education on the risk of mother’s overweight across all NT statuses. In model 1, the coefficient of years of formal schooling is negative but non-significant after conditioning on wealth, age, pregnancy and urbanicity. In model 2, once a quadratic term of education is introduced, both the linear (OR=1·070; P<0·001) and the non-linear (OR=0·995; P<0·001) coefficients are found to be statistically significant, confirming the first hypothesis that an inverted U-shaped curvilinear relationship fits the relationship between education and risk of being overweight across mothers across all NT statuses.
Weighted multilevel logistic regression estimate of the functional form of the education gradient on mother’s overweight among mothers of reproductive age (15–49 years; n 143 258) across twenty-two administrations of the Demographic and Health Survey in nine Latin American/Caribbean countries
***P<0·001.
† Grand-mean centred variables are italicized.
‡ The significance of variance components indicates whether the random effect can be assumed in intercept and coefficients.
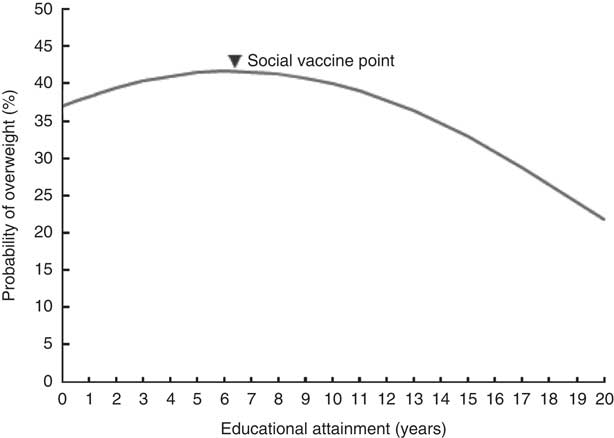
Plotting these findings, Fig. 2 displays a positive slope of increasing probability of being overweight with each additional year of primary education (0–6 years of schooling) up to the critical point at 6·8 years of schooling and then a negative slope through higher education.Footnote † In other words, across the pooled sample, among mothers who have completed at least lower secondary schooling (grade 7), the probability of being overweight decreases with each additional year of schooling. Given this, the critical point of the curve at which the gradient of education changes from a risk factor to a social vaccine can be referred to as the ‘social vaccine point’.
Curvilinear gradient of the education–mother’s overweight association across all nutrition transition statuses (model 2, Table 2) among mothers of reproductive age (15–49 years; n 143 258) across twenty-two administrations of the Demographic and Health Survey in nine Latin American/Caribbean countries
Associations of national nutrition transition status on education–overweight gradients
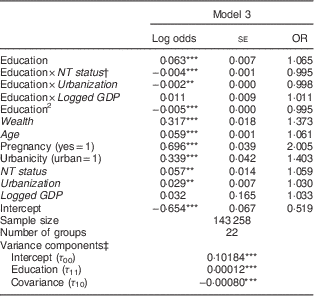
As shown in Table 2, the variance component of the education–overweight slope between groups (τ 11) in models 1 and 2 is statistically significant, indicating that the education–overweight association varies across country-time units. This motivates the analysis of the second hypothesis about the national NT status as a significant contextual factor that mediates the effects of education on overweight across countries.
As displayed in Table 3, model 3 estimates an NT status effect on the initial overweight rate (direct effects) and on the education–overweight slope (cross-level interaction terms) conditioning on urbancity and GDP at population level. As predicted, the Westernization of the food supply has a positive impact on increasing the initial probability of mothers being overweight, indicating that a 1 unit increase of NT status in a country increases by 5·9 % the odds of the national average probability of being overweight (OR=1·059; P<0·01). At the same time, the cross-level interaction term (education×NT) has a negative impact on being overweight (OR=0·995; P<0·001), indicating that in the countries at more advanced NT statuses, the education effect on increasing mother’s overweight declines and eventually shifts to a negative effect. These results suggest that advanced NT status changes the role of education on overweight from a risk factor to a social vaccine.
Weighted multilevel logistic regression estimate of education and mother’s overweight by national nutrition transition (NT) status among mothers of reproductive age (15–49 years; n 143 258) across twenty-two administrations of the Demographic and Health Survey in nine Latin American/Caribbean countries
GDP, gross domestic product.
**P<0·01 ***P<0·001.
† Grand-mean centred variables are italicized.
‡ The significance of variance components indicates whether the random effect can be assumed in intercept and coefficients.
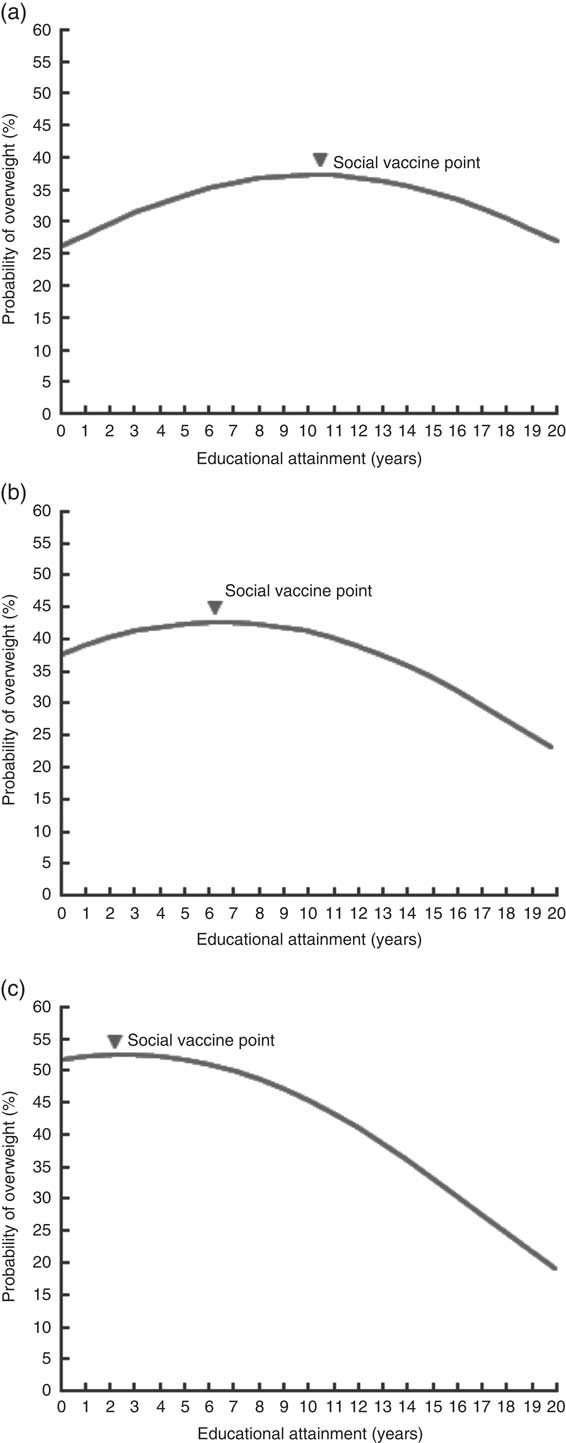
To further illustrate differences in the education–overweight gradient across different NT statuses, Fig. 3 compares estimated education–overweight slopes for three hypothetical groups with different NT levels as follows: (i) low NT status includes the NT index at 2 sd below the pooled sample mean; (ii) medium NT status includes the index within 2 sd of the mean; and (iii) high NT status includes the index at 2 sd above the mean. The curves, net of the control variables, change in the three predicted ways as countries progress across the NT. First, the critical or social vaccine point shifts towards lower education levels from 10 to 7 to just under 3 years of schooling. Second, the positive gradient between education and mothers’ overweight diminishes at the high NT status. And lastly, as countries gain more access to foods high in animal fats, foods high in sugar/sweeteners and processed foods, the risk of overweight for the entire population of mothers substantially increases. For example, mothers with no formal education in countries earlier in the NT have a 25 % probability of being overweight but deeper into the NT this shifts upwards to 36 % and over 50 %. Also, in populations at high NT status, while even a small amount of education lowers the risk of mothers being overweight, it takes advanced levels of education (13–14 years) to reach average risk levels of populations in low NT status.
Curvilinear gradient of the education–mother’s overweight association by nutrition transition (NT) status* (a, low NT status; b, medium NT status; c, high NT status; model 3, Table 3) among mothers of reproductive age (15–49 years; n 143 258) across twenty-two administrations of the Demographic and Health Survey in nine Latin American/Caribbean countries. *The division into different NT statuses is based on the average percentage of NT status in the sampled countries. Low NT status indicates the group with 2 sd below the average NT, medium NT status represents the average group of NT, and high NT status denotes the group with 2 sd above the average NT
Discussion: overweight and the population education transition curve
The fact that approximately 40 % of women of reproductive age were overweight in the present sample from Latin American/Caribbean countries reveals a public health risk of great magnitude for this region. Even though this proportion is lower than the 76·7 %Footnote * recently reported in the USA( 6 ), there is evidence that the rate of overweight continues to grow among Latin American and Caribbean countries. Although education is usually assumed to be negatively related to health risks, the results for our sample of mothers showed a mixed association between educational attainment and overweight. The findings across pooled country-time units indicate that a non-linear inverted U-shaped curve is the best functional form to represent the education effects on probability of mother’s overweight. In the curvilinear relationship, education acted as a risk factor to exacerbate overweight prevalence among the population with less than primary education. At the critical point, referred to as the social vaccine point, education became preventive in reducing the probability of overweight among those in the population with more than primary education. In addition, the curve changed dynamically towards a general social vaccine effect of education, even among the less educated, as the NT status advanced in populations. Therefore, earlier reports of seemingly inconsistent positive and negative education gradients are likely part of a larger PET pattern; a predictable systemic interaction among the multiple, and sometimes contrasting, effects of individual educational attainment on health-related variables caused by changes in social and health environments of the population as a whole( Reference Smith, Anderson and Salinas 35 ). The PET curve reflects the fact that in earlier stages of the NT the more educated are at higher risk of overweight and as the NT progresses the education gradient shifts to a negative slope. Past research on schooling effects shows that education affects health through several mediating channels( Reference Renkert and Nutbeam 17 , Reference Cutler and Lleras-Muney 36 , Reference Ross and Mirowsky 45 ). Salient among these channels are material or economic benefits (e.g. occupation, income or wealth) and improvements in cognitive functioning (e.g. information processing, reasoning and decision-making abilities leading to understanding risks and preventive behaviour) along with attitudinal change (e.g. acquisition of modern values, empowerment to make independent decisions). And the PET curve process hypothesizes that different levels of a population transition can suppress or enhance mediating educational effects. While it is frequently assumed that multiple effects of education work in the same direction relative to health, it can be the case that they have contrasting influences, such as during periods of introduction of luxury items that are potential new health risks, including when the food supply starts to include significant levels of animal fats, sugar/sweeteners and processed food products( Reference Everett, Rehcopf and Rogers 39 , Reference Link and Phelan 46 ). The dynamic changes shown in Fig. 3 are likely the classic case of PET and although a test of this complex hypothesis is beyond the scope here, it is useful to consider the potential implication of the PET curve in light of the global NT and obesity pandemic. In addition, recent globalization in the food market, led predominantly by multinational food and beverage companies, has made much faster the shift of NT to Western-style diet and the subsequent PET in education–overweight gradient among developing countries( Reference Feinstein 9 ).
There are several ramifications, the first of which is that epidemiological conclusions about the role of education in the global obesity epidemic must be sensitive to the NT stages of populations from which research samples are drawn or else misleading conclusions that education is always a risk or social vaccine are likely to muddy the literature. A similar confusion has occurred in epidemiological assessments of education and the HIV/AIDS pandemic in sub-Saharan Africa, where education initially led to more risk, but by the mid-point in the pandemic became the most robust of social factors lowering risk( Reference Smith, Salinas and Baker 38 ).
The PET curve for obesity also has implications for the timing and focus of public health interventions as populations traverse through the NT. Earlier in the NT prevention should be aimed at wealthier and more educated segments of the population, not only because they are initially at highest risk of overweight, but also because this could work to lower the social vaccine point more rapidly. Later in the NT the public health target should include groups with less education, and the intervention itself probably must be richer in its information to match the lower cognitive and literacy skills of these individuals( Reference Halabi, Smith and Collins 47 ). From our analysis, as the NT progresses the overweight rate is predicted to grow to 50 % particularly for the less educated population, while the prevalence of overweight among those who have completed more than a tertiary education (i.e. master’s degree and doctoral degree) is less than 30 %. This finding underlines the fact of increasing vulnerability to the risk of obesity among less educated groups, and should be regarded as a main cause of increasing health inequalities in high NT countries. Lastly, as food security and diet style become global issues, while obesity and its impact on chronic diseases and mortality become more prominent for nations’ health systems, the fact that continued investment in academic education is an essential public health tool must be advanced within governments and world health agencies.
Despite the implications for public health from the PET curve for obesity, there are some caveats about the findings. First, even though the proxy indicator of NT status from the FBS provided the population context of dietary consumption across administrations, the diffusion of the Westernized diet style can vary by sub-populations in a country. Specifically, the dietary Westernization first takes place among younger, more educated and wealthier populations and then the new trend spreads to other population segments( Reference Uusitalo, Sobal and Moothoosamy 48 ). While the aggregate measure of dietary Westernization by FBS provides information on the overall level of NT in a country, it cannot capture these kinds of within-nation differences or the diets of individuals. Second, some potential confounding factors not available in the DHS, such as nutritional knowledge( Reference Baker, Leon and Greenaway 16 ), health-service utilization( Reference Mond, Hay and Rodgers 49 ) and physical activity( Reference Popkin 13 , Reference Renni, Johnson and Jebb 50 , Reference Weinsier, Hunter and Heini 51 ), might distort the estimation. In particular, future research on education and overweight across NT status should consider physical activity, as high levels of sedentary behaviour and low levels of physical activity are well-known factors in increasing the probability of obesity( Reference Renni, Johnson and Jebb 50 , Reference Weinsier, Hunter and Heini 51 ). Indeed, modernization and urbanization during national development can lead to changes in lifestyles characterized by low levels of physical activity in leisure, transportation and work, due to the development of technologies and the shift from high-energy-expenditure activities (e.g. farming) to the service sector( Reference Popkin 13 ).
Conclusions
The present research investigated the dynamics of the changing role of education on reducing the probability of being overweight among mothers of reproductive age in Latin American/Caribbean regions. As NT progresses to the level of Western countries, the association between education and overweight changes from an inverted U-shaped curve to a negative and linear gradient. The dynamics support the PET curve hypothesis on the moderating effect of the population NT on the education–overweight gradient, and these dynamics hold implications for public health interventions in reducing health inequalities caused by increased vulnerability among less educated populations in high NT countries.
Acknowledgements
Financial support: This research received no specific grant from any funding agency in the public, commercial or not-for-profit sectors. Conflict of interest: None. Authorship: H.J. is the leading author who conducted the research. D.S. and D.P.B. gave support in the theoretical explanation and following discussion to better describe the results from analysis. Ethics of human subject participation: Ethical approval was not required.
Appendix
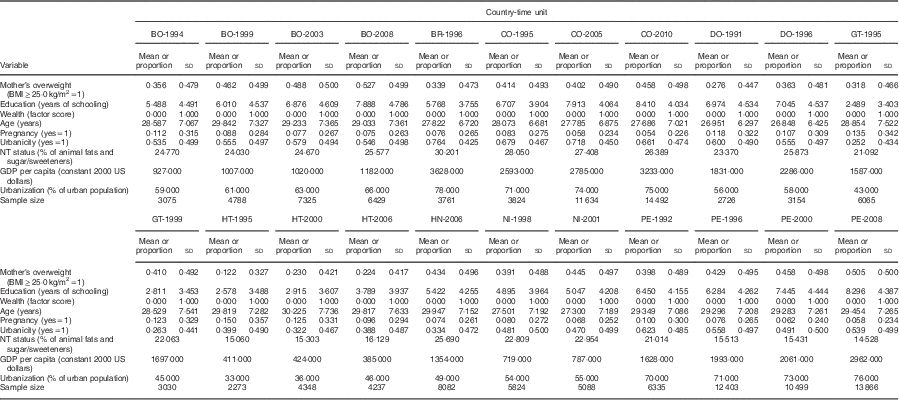
Means or proportions and standard deviations of variables and sample size by country-time unit