

Maternal and child undernutrition accounts for 3·5 million deaths annually, with over half of the global child mortality occurring in sub-Saharan Africa(Reference Black, Allen and Bhutta1, Reference Murray, Laakso and Shibuya2). Most poor households live in rural areas and depend on agriculture for their income and food(3). There is evidence that farmer experimentation and exchanges can stimulate innovations(Reference Snapp, Kanyama and Kamanga4–Reference Humphries, Gonzales and Jiminez6). Most farmer research projects, however, have focused on agricultural issues rather than health. Integrated agricultural programmes that address gender issues, incorporate nutrition education and take the local context into account have been more effective in improving nutritional outcomes(7–Reference Low, Arimond and Osman9).
Smallholder farmers in Malawi, as elsewhere in sub-Saharan Africa, struggle with limited landholdings, diverse and complex agro-ecosystems and high poverty rates(Reference Snapp10, Reference Ndekha, Kulmala and Vaahter11). Child malnutrition rates in Malawi have been high (almost 50 % stunting) for over two decades and are attributed to multiple causes, including low dietary diversity, high rates of poverty and unequal status for women(Reference Arimond and Ruel12–15). The primary staple crop in Malawi is maize, which makes up over half of the total energy in the diet(Reference Ndekha, Kulmala and Vaahter11, Reference Arimond and Ruel12). Maize is high-yielding under optimal conditions but requires more nutrients for growth compared to other staple crops, and does not perform well in nutrient- or water-limited environments. Unequal status of women, resulting in high workloads for women and limited control over household resources, has negative implications for child nutrition. HIV prevalence is high, which further complicates efforts to improve child nutrition and smallholder agriculture(Reference Bezner Kerr16, Reference Bryceson and Fonseca17).
Recent agricultural programmes in Southern Africa have promoted input-intensive agriculture(Reference Denning, Kabambe and Sanchez18), despite evidence that farmer-managed agro-ecological practices in which organic matter is added to soils help to improve soil fertility as well as improve farmers’ capacity to cope with adverse farming conditions and maintain production levels(Reference Snapp, Mafongoya and Waddington19, Reference Kiers, Leakey and Izac20). Growing legumes, harvesting the legumes and burying the crop residue after harvest builds soil fertility, as well as serving as a valuable food source(Reference Snapp, Kanyama and Kamanga4, Reference Snapp, Mafongoya and Waddington19).
In villages surrounding Ekwendeni, a town in Mzimba district, Malawi, over half of the smallholder families experience food insecurity every year; malaria is endemic and child malnutrition rates are similar to the national average of 48 %(Reference Bezner Kerr, Berti and Chirwa21). The present study reports the effects of a participatory agricultural and nutrition education intervention on child nutritional status in this region.
In 2000, a research project, the Soils, Food and Healthy Communities (SFHC) project, was initiated by the Ekwendeni Hospital staff, Malawian and Canadian scientists in the 500 km2 catchment area surrounding Ekwendeni. The SFHC project used an interdisciplinary, participatory approach to assess whether legume intercrops could improve soil fertility, food security and child nutrition. Legume intercrops were chosen based on earlier agricultural research carried out in Malawi(Reference Snapp, Mafongoya and Waddington19). The following legume intercrops were offered to farmers to test: (i) peanut (Arachis hypogaea) and pigeon pea (Cajanus cajan (L.) Mill sp.); (ii) soyabean (Glycine max) and pigeon pea; (iii) pigeon pea intercropped with maize; (iv) velvetbean (Mucuna spp.) rotated with maize; and (v) Tephrosia voglii relay intercropped (i.e. alternating years) with maize. All but Tephrosia are edible, and the first three options were the most popular choices for farmers(Reference Bezner Kerr, Snapp and Chirwa22). Most of the crops (except Mucuna and Tephrosia) were known to farmers but were previously grown in small amounts, and had not been explicitly used by farmers to improve child nutrition.
Individual farmers were self-selected: any farmer in the intervention villages could learn about different legume options and test them on 10 m × 10 m on-farm plots. The overall research project involved a prospective quasi-experimental design, comparing intervention and control households. Multiple research methods were used, including farm surveys, anthropometry measurements, interviews and participatory workshops to assess effects on food security, soil fertility monitoring, child diet assessment and evaluation of social relations. An iterative programme design led to innovations, such as recipe days and crop residue promotion days. Grandmothers were found to play a crucial role in early child feeding, and several important local feeding practices were found to have significant effects on child growth. For example, grandmothers often gave their grandchildren porridge because they believed that the child was hungry and the mother’s milk was insufficient. The porridge, which is not nutrient-dense, may be contaminated with pathogens, and is given in relatively large amounts, thereby displacing breast milk. Porridge was significantly associated with poorer child growth(Reference Bezner Kerr, Berti and Chirwa21, Reference Bezner Kerr24). Therefore, the intervention focused on reducing early feeding of porridge. Gender relations, such as household decision making about legume use, play an important role in addressing child nutrition and household food security(Reference Bezner Kerr24). As a result, gender and nutrition education were incorporated into activities. In six village areas, with 160 families, we initiated intergenerational activities to address gender issues, which involved monthly small group discussions on themes such as early child feeding and sharing of household resources, facilitated in a participatory way. A qualitative study using in-depth interviews provided evidence that families changed feeding practices after involvement in the discussion groups(Reference Satzinger, Bezner Kerr and Shumba25).
Agriculture interventions will more likely improve child health when broad-based and integrated with a nutrition intervention, but the characteristics and duration of the intervention required are not well researched(Reference Ndekha, Kulmala and Vaahter11, Reference Arimond and Ruel12). Owing to the length and multifaceted nature of the intervention, a research question was developed post hoc to compare the impact of duration of participation and intensity of involvement in the project with the hypothesis that the duration and intensity of involvement in the intervention are positively related to the health impact.
Experimental methods
Intervention villages selected for their high levels of child malnutrition were matched with similar environmental conditions, location and level of malnutrition of control villages. The hospital organized public meetings to recruit intervention households, and survey participants were randomly selected from those who joined the intervention. Control households from the control villages were matched with intervention households based on the age of the child and food security status (measured as the month when self-grown maize was finished). All villages that started as controls eventually became intervention villages, due to the demand of the villagers. In total, seventy-seven villages were involved in the project and were recruited for anthropometric assessment, of which sixty-six had data useful for the evaluation of the intervention: fifteen joined in 2001 (seven intervention villages; eight control villages with seven control villages changed to intervention villages in 2002); four control villages joined in 2002 (two changed to intervention in 2005); nine control villages joined in 2003; twenty-eight new intervention villages and one control village joined in 2005; fourteen new control villages and one new intervention village joined in 2006; and two new control villages joined in 2007. Height (or length of children <24 months of age) and weight of children under 3 years were measured following standardized procedures(Reference de Onis, Garza and Victora26, 27) in nine surveys between 2001 and 2007. Age was calculated from the date of birth appearing on the child’s health card. Children under 3 years were the focus of the present study, as this age is most vulnerable to growth faltering(Reference Black, Allen and Bhutta1, Reference Bhutta, Ahmed and Black13).
Ethical approval for the present study was granted by several research institutions: Cornell University’s University Committee on Human Subjects, the National Research Council of Malawi and the Research Ethics Board of the University of Western Ontario. Enumerators obtained informed consent from participants before data collection, and data were collected anonymously and confidentially; data were stored in a locked file, with only researchers having access to this file. The results of the findings were shared with village members through community workshops.
Height (or length) and weight were converted to height-for-age and weight-for-age Z-scores (HAZ and WAZ, respectively) using ‘WHO Anthro version 2·02’ (WHO, Geneva, Switzerland). Z-scores are the number of sd between the observed child’s height (or weight) and the average height (or weight) for age- and sex-matched children in a WHO Multicentre Growth study(27). In total, 3838 valid measures of weight were taken (see Table 1). Data were entered in Excel or EpiInfo (various versions). All analyses were done using the SAS statistical software package version 9·1 (SAS Institute Inc., Cary, NC, USA).
Sample size for weightFootnote * at each survey, by the age of child in months (sexes combined)Footnote †
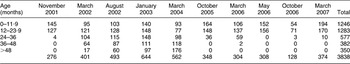
* Sample size for height is slightly lower, with a total of 3801.
† Overall sample is 51 % female. In individual surveys, females ranged from 47 % (November 2001) to 55 % (October 2006).
A simple comparison between control and intervention, using PROC MIXED controlling for age as a random variable, showed no difference between the two groups (Table 2). Discussions with farmers revealed that there was ‘contamination’ of control villages, as reflected in the reported sharing of legume seeds by intervention farmers and ‘control’ villages having large increases in legume consumption (SFHC project, unpublished results).
Comparison of control and intervention U3 children, WAZ and HAZ 2001–2007 (n 3801)

U3 children, children under the age of 3 years; WAZ, weight-for-age Z-score; HAZ, height-for-age Z-score.
Effect of duration of intervention
In a post hoc analysis, in order to control for varying levels of control group ‘contamination’, villages were placed in one of four groups: (i) those which were intervention villages from the beginning in 2001; those villages which were control from the beginning and became intervention in (ii) 2002, (iii) 2003 and (iv) 2005. The fourth group included only three villages and had insufficient sample size to include in the analyses. The growth status of the children in the other three groups was summarized according to the number of months until (or since) becoming intervention villages, and the differences between surveys and between groups were tested using a mixed model (survey and group as fixed effects and child age as a random effect). Multilevel analyses were carried out with cluster (village) as a random effect in the model, using PROC MIXED in the SAS software. The analyses were restricted to children under 3 years, i.e. those for whom there are data both before and after October 2005.
Effect of intensity of intervention
All villages used in the surveys were classified according to their level of involvement at two points in time (2004 and 2007) and this level of involvement was tested as a predictor of child growth. The village involvement score, developed by the field team, was based on the following criteria:
1. The number of people from the village who participated in project activities.
2. The number of people from the village who grew project crops.
3. The number of people from the village who were members of farmer research teams.
4. The frequency with which the project members met in the village to discuss their village’s progress and provide reports.
5. The level of sharing that occurs in the village’s households (e.g. how husband and wife shared household responsibilities and decision making).
6. The village members’ level of knowledge of how to prepare recipes with crops from the project.
7. The number of ideas that the village contributed to the project’s development.
8. The level of work that took place on a village plot.
Key informants in each area ranked the villages in their area on a scale from 1 to 4, with 1 being very involved and 4 reflecting minimal involvement. The effects of level of project involvement were tested in the villages that were involved throughout the 8 years of the project. The children were grouped according to their village scores and the differences within surveys and within groups were tested using a mixed model (survey and score as fixed effects and child age as a random effect). Only the results from the five surveys conducted in March were included to minimize the confounding of seasonal changes, and again, the analyses were restricted to children under 3 years.
Results
A baseline survey carried out in 2001 of control and intervention households showed no significant differences in landholding size (average of 1·1 ha), formal education (86–87 % with some primary education), livestock ownership (72 % v. 78 % of households) or child nutritional status (47 % v. 48 % of children stunted; D Chilima, unpublished results).
Growth at different ages
The growth pattern of children in Ekwendeni, shown in Fig. 1, follows a typical developing country profile, with size at birth being approximately normal and then decreasing until reaching a nadir at about 18 months. There was a slight recovery in weight, but not height between 18 and 36 months.
Average height-for-age Z-score (□; n 1867) and average weight-for-age Z-score (▪; n 1864) in Ekwendeni boys under 5 years of age (data collected between November 2001 and March 2007)

Child growth with time involved in intervention
The least square (LS) means (adjusted for child age) for WAZ for these groups are plotted in Fig. 2. There were 1724 observations of children under 3 years included in this analysis, with an average of 86 per survey group. Note that the x axis is not the date of the survey, but rather months from the survey until or since joining the intervention. While there was still significant heterogeneity between groups, the trend is clear: the longer the village has been an intervention group, the better the growth status of the children. This was tested by comparing the HAZ and WAZ at each point in time for each group (Fig. 2). The results for HAZ (not shown) are similar to those for WAZ.
Change in Ekwendeni children’s weight (under the age of 3 years) between 2004 and 2007 by village involvement in the intervention (t = 0 at month in which village joined intervention). Villages are grouped according to the year in which they became control and intervention villages. Survey group effect was significant (P = 0·04). Significant differences were observed within groups (P < 0·05): (i) control year x–intervention year 2001, 1st survey < 3rd, 4th and 8th, 2nd survey < 3rd, 4th and 7th, 3rd survey < 5th, 6th and 7th, 4th survey < 7th, 5th survey < 7th, 7th survey < 8th; (ii) control year 2001–intervention year 2002, 1st survey > 3rd, 4th and 5th, 2nd survey > 3rd, 3rd survey < 4th and 5th; (iii) control year 2001–intervention year 2003, 1st survey < 4th, 2nd survey < 7th, 3rd survey< 8th, 4th survey < 7th, 5th and 6th surveys < 7th

Child growth with village level of involvement in interventions
Children from thirteen villages were included in these analyses (total n 566). The LS means for WAZ (adjusted for child age) are shown in Fig. 3. All four groups showed improved child growth status from 2002 to 2004. However, for the three groups with data in 2007, the one group that had increased involvement (from 2 to 1) continued to improve, whereas those that had decreased involvement (from 1 to 2 and from 1 to 3 or 4) had decreases in WAZ. The difference in WAZ between groups in 2007 was approximately 0·7.
Average weight of Ekwendeni children (under the age of 3 years) relative to the length of time their village participated in the intervention/control study. Only villages for which involvement score data were available from 2001 to 2007 are included in the analyses. Numbers 1 to 4 represent village-involvement scores in 2004 and 2007. Survey group effect was P = 0·09. Significant differences were observed within groups and within surveys (P < 0·05): (i) within group with score = 1 in 2004 and score = 2 in 2007, March 2002 < March 2004 and January 2003 < March 2004; (ii) within group with score = 1 in 2004 and score = 3 or 4 in 2007, March 2004 > March 2007 and March 2006 > March 2007; (iii) within survey March 2007, group with score = 2 in 2004 and score = 1 in 2007 > group with score = 1 in 2004 and score = 3 or 4 in 2007

Discussion
Child growth status at a particular point in time is the result of the child’s growth trend and seasonal fluctuations around this trend. It is a function of a child’s age (as depicted in Fig. 1) and secular changes (e.g. inadequate feeding, illness, project effects). Changes in child growth status introduced by the SFHC project occurred against the existing background of numerous fluctuations and it is an analytical challenge to separate the effects of the project from this natural variation. These challenges are compounded by the failure to maintain pure controls. In addition to the intentional changing of control villages to intervention villages in response to village demands, there was also documented leakage of the project intervention into control communities. While a simple comparison between control and intervention villages did not indicate significant differences, when the length of time in the project and involvement were considered, there was strong evidence of project impact. These results are presented here as the changes in HAZ and WAZ v. months since joining the project and the changes in growth in children related to the village level of involvement. While these are imperfect tests that were designed to circumvent the problems introduced by inconsistent uptake of the intervention and failure to maintain pure control groups, the magnitude of improvement that they show is substantial. Typically, effective nutrition and health interventions improve child growth by an average of about 0·3 Z-score, although individual projects have recorded increases of up to 1·75(Reference Snapp, Kanyama and Kamanga4, Reference Brown, Peerson and Rivera28–Reference Ramakrishnan, Aburto and McCabe30). Although it is impossible to separate the secular trends from project effects, there appears to have been an improvement over initial conditions of up to 0·6 in WAZ (from −0·4 (sd 0·5) to 0·3 (sd 0·4); Fig. 2). In the villages that had increasing village-involvement scores (2 in 2004 and 1 in 2007), WAZ increased by 0·8 from 2002 to 2007 (from −0·6 (sd 0·4) to 0·2 (sd 0·4)) and it was 0·7 higher than that for the villages with decreasing involvement. Given the intervention’s success in legume consumption and in understanding child-feeding and child-care practices(Reference Bezner Kerr, Berti and Chirwa21–Reference Satzinger, Bezner Kerr and Shumba25), perhaps such improvement is unsurprising; yet improvements in growth status are not often reported in the literature for agriculture-based interventions(7, Reference Berti, Krasevec and Fitzgerald8). The project will now be trying to ‘scale up’ and deepen the results, by extending to other parts of Malawi and focusing on other farmer needs, such as agricultural options for AIDS-affected farmers and climate change adaptation.
Recent reviews of maternal and child undernutrition largely dismissed agricultural interventions as having the potential to improve child growth, due to lack of evidence(Reference Black, Allen and Bhutta1, Reference Bhutta, Ahmed and Black13). Given the approximately 750 million rural people living in poverty and experiencing undernutrition globally, and the limited income opportunities in rural areas, it is incumbent on researchers to find ways for rural farmers to improve child nutrition. The findings reported in the present paper support efforts to take an integrated approach to improving child nutrition.
Acknowledgements
The present study was supported by the International Development Research Centre (Grant no. 101829-001), the Presbyterian World Service and Development and the Canadian FoodGrains Bank (Grant no. R3988A04). As far as the authors are aware, they have no conflicts of interest that would compromise the findings reported in the present paper. R.B.K. is the principal investigator of the research component of the Soils, Food and Healthy Communities (SFHC) project. She conceived of the study, supervised all aspects of its implementation, assisted with interpretation of the results and led the writing. P.R.B. assisted with the study design and implementation, led the analysis and interpretation of results and assisted with the writing. L.S. is the SFHC project coordinator; she led the agriculture and nutrition intervention implementation, supervised the anthropometric data collection and assisted with the writing. All authors helped to conceptualize ideas, interpret findings and review drafts of the manuscript. The authors could not have carried out this research without the support of many others: Rodgers Msachi, Laifolo Dakishoni, Esther Lupafya, the late Marko Chirwa, Keston Ndlovu, Solomon Mkumbwa, Boyd Zimba, Nyles Mhone, David Ryan and all members of the Farmer Research Team. Laura Swift and Rodgers Msachi conducted the very useful ‘involvement’ assessment. Ekwendeni Hospital provided helpful logistical support. The generous support from the International Development Research Centre, Ottawa, Canada, Presbyterian World Service and Development and the Canadian FoodGrains Bank is gratefully acknowledged. Finally, the authors thank the participating members of the SFHC project in Ekwendeni who made the present study possible.


