


Introduction
Evolutionary diversifications are commonly associated with adaptive radiations, when “key innovations” open new adaptive zones linked to ecological opportunities (Simpson Reference Simpson1953; Schluter Reference Schluter2000; Yoder et al. Reference Yoder, Clancey, Roches, Eastman, Gentry, Godsoe, Hagey, Jochimsen, Oswald and Robertson2010; Simões et al. Reference Simões, Breitkreuz, Alvarado, Baca, Cooper, Heins, Herzog and Lieberman2016). However, not all evolutionary diversifications are directly linked to new ecological adaptations (Rabosky Reference Rabosky2017). For example, speciation, high diversity, and morphological variation may be driven by socio-sexual selective factors (Wagner et al. Reference Wagner, Harmon and Seehausen2012; Rabosky Reference Rabosky2017). The fossil record provides insights into evolutionary diversifications across large spatiotemporal scales in geological time (Benton Reference Benton2015). Methodological advancements and the availability of large phylogenies and morphological data sets allow researchers to test patterns and processes of morphological evolution quantitatively, including evolutionary rate and disparity dynamics in highly successful groups (e.g., Brusatte et al. Reference Brusatte, Lloyd, Wang and Norell2014; Hopkins and Smith Reference Hopkins and Smith2015; Close et al. Reference Close, Friedman, Lloyd and Benson2015; Benson et al. Reference Benson, Hunt, Carrano and Campione2018).
Hadrosauroids were a hugely diverse and abundant clade of herbivorous ornithopod dinosaurs (Horner et al. Reference Horner, Weishampel, Forster, Weishampel, Dodson and Osmolska2004; Prieto-Márquez Reference Prieto-Márquez2010a). These megaherbivores were important components in the Late Cretaceous (100–66 million years ago) ecosystems of Eurasia, Antarctica, and the Americas (Prieto-Márquez Reference Prieto-Márquez2010b). Within hadrosauroids, the clade Hadrosauridae (hadrosaurids) radiated significantly during the latest Cretaceous (Santonian–Maastrichtian) (Fig. 1). Quantitative studies show that hadrosaurids had high taxic diversity (Lloyd et al. Reference Lloyd, Davis, Pisani, Tarver, Ruta, Sakamoto, Hone, Jennings and Benton2008; Butler et al. Reference Butler, Barrett, Kenrick and Penn2009) and notably high speciation rates when compared with other contemporaneous dinosaurian clades (Sakamoto et al. Reference Sakamoto, Benton and Venditti2016). The postcranial skeleton of hadrosaurids was apparently morphologically conservative, with a consistent body plan, and most species were large-bodied (7–14 m in length) (Horner et al. Reference Horner, Weishampel, Forster, Weishampel, Dodson and Osmolska2004). However, their cranial and mandibular anatomy shows unique and specialized innovations, potentially linked to their success.
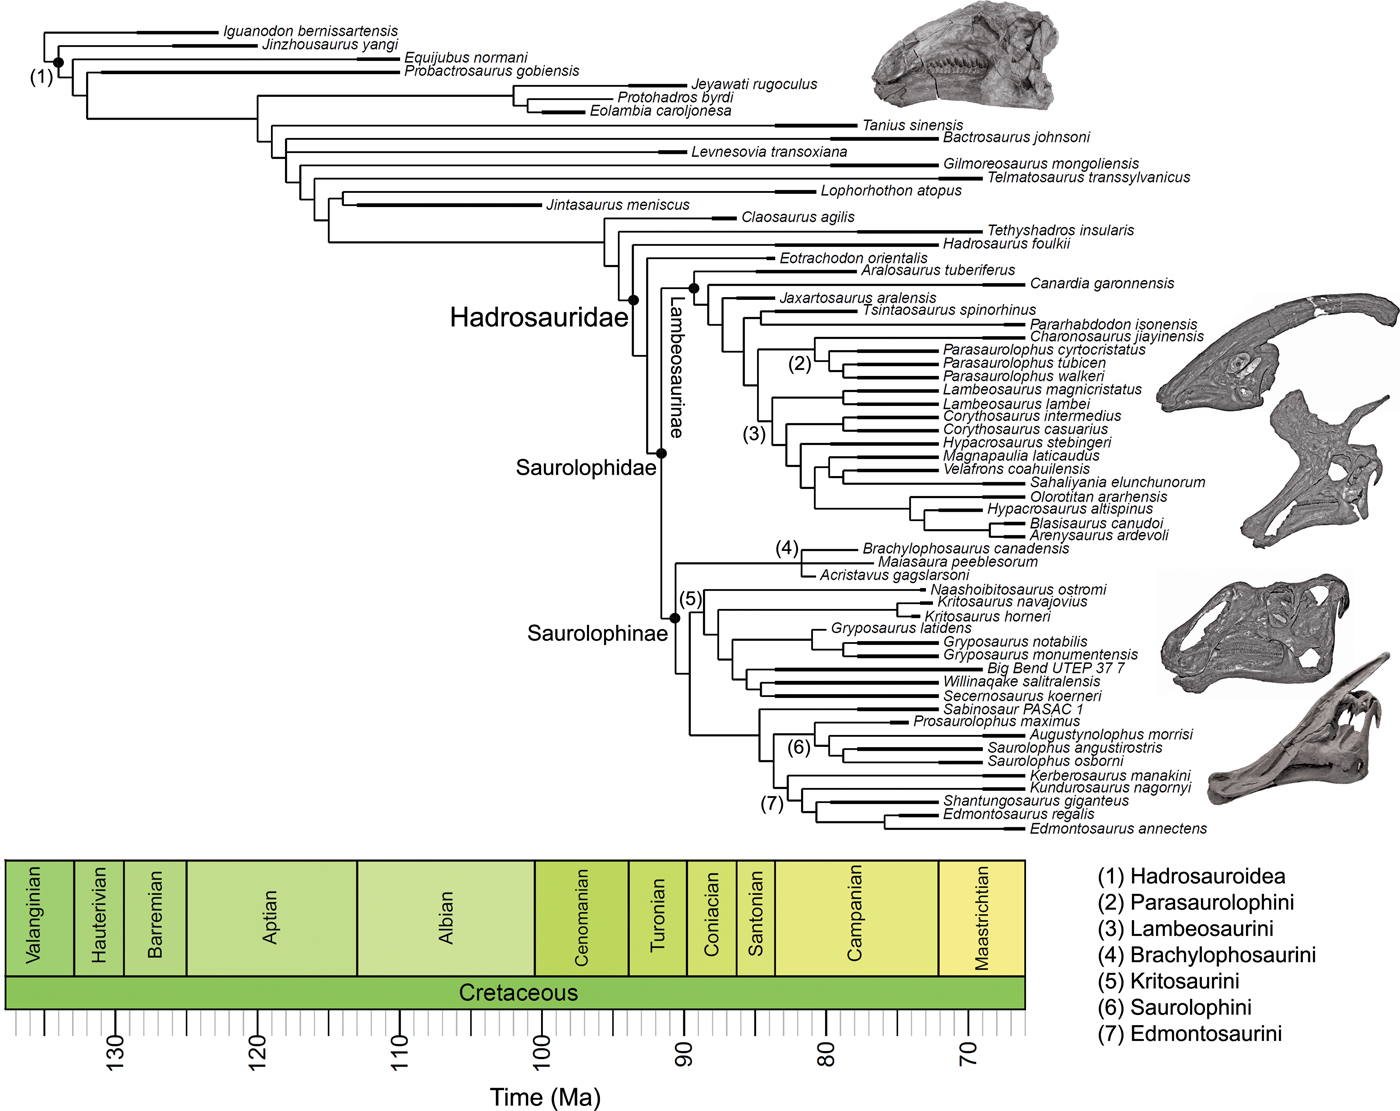
Time-scaled phylogeny of hadrosauroids. The cladogram is a strict consensus tree generated using the four most parsimonious trees from Prieto-Márquez et al. (Reference Prieto-Márquez, Erickson and Ebersole2016). The thicker lines illustrate the upper and lower bounds of stratigraphic ranges. Major clades are highlighted. The figured skulls are from Equijubus normani, Parasaurolophus walkeri, Lambeosaurus lambei, Gryposaurus notabilis, and Saurolophus angustirostris (from top to bottom).
Hadrosaurids are famed for their elaborate solid (most species of the subclade Saurolophinae) and hollow (subclade Lambeosaurinae) cranial crests (Evans Reference Evans2010; Prieto-Márquez et al. Reference Prieto-Márquez, Wagner, Bell and Chiappe2015) (Fig. 1). These exaggerated ornamental structures were formed by extensive modifications to the nasal and frontal bones in saurolophines and the premaxilla and nasal bones in lambeosaurines, and they manifested as an impressive array of shapes, including tubes, lobes, fans, and rounded plates. Crests could also be formed by soft tissues (Bell et al. Reference Bell, Fanti, Currie and Arbour2014). Hadrosaurid crests functioned primarily as visual displays (Hopson Reference Hopson1975; Bell et al. Reference Bell, Fanti, Currie and Arbour2014; Prieto-Márquez et al. Reference Prieto-Márquez, Wagner, Bell and Chiappe2015), and in lambeosaurines the hypertrophied nasal passages inside the crests may have been used for sound production (Weishampel Reference Weishampel1997). The visual and potential auditory signals of hadrosaurid crests were likely important factors in socio-sexual selection, potentially being used for mate competition (Evans Reference Evans2010; Knell and Sampson Reference Knell and Sampson2011; Hone et al. Reference Hone, Naish and Cuthill2011; Bell et al. Reference Bell, Fanti, Currie and Arbour2014). Socio-sexual selection can lead to a great variety of specialized adaptations, with important macroevolutionary consequences, including higher speciation rates (Panhuis et al. Reference Panhuis, Butlin, Zuk and Tregenza2001; Knell et al. Reference Knell, Naish, Tomkins and Hone2013). Crests, such as those in hadrosaurids, represent an important innovation and a source of morphological disparity that is disconnected from traditional macroevolutionary “adaptive zones” (Simpson Reference Simpson1953), as they have no role in the acquisition of food resources or escape from predators.
Important adaptive innovations are seen in the hadrosaurid feeding apparatus. They evolved histologically and biomechanically complex grinding structures made from multitoothed dental batteries with complex structures (Erickson et al. Reference Erickson, Krick, Hamilton, Bourne, Norell, Lilleodden and Sawyer2012). This dentition facilitated crushing and shearing, allowing hadrosaurids to master a broad range of herbivorous diets, while not precluding omnivory (Chin et al. Reference Chin, Feldmann and Tashman2017). Complex dentition was associated with specialized jaw mechanisms, potentially giving hadrosaurids the ability to “chew” (Norman and Weishampel Reference Norman and Weishampel1985; Williams et al. Reference Williams, Barrett and Purnell2009; Cuthbertson et al. Reference Cuthbertson, Tirabasso, Rybczynski and Holmes2012). The success of hadrosaurids has been attributed to this unique feeding apparatus, and previous macroevolutionary work on ornithopod dental disparity proposed that, once this complex dental battery emerged rapidly in hadrosaurids, there was limited further innovation (Strickson et al. Reference Strickson, Prieto-Márquez, Benton and Stubbs2016). Hadrosaurids therefore present an interesting test case for comparing agencies of natural and socio-sexual selection, namely their conservative, but highly successful, feeding apparatus, a classic key innovation, and their highly variable “nonadaptive” cranial crests.
In this study, we present a series of evolutionary rate and disparity analyses that uncover the patterns and processes of morphological evolution during the diversification of hadrosauroids. We address several key questions based on our current understanding of hadrosauroid morphological evolution. First, how do evolutionary rate and disparity dynamics vary between their disparate skulls and seemingly conservative postcranial skeletons? Was hadrosaurid cranial disparity achieved through a single evolutionary burst at one position in the tree, or through multiple bursts of innovation? Did the two major hadrosaurid evolutionary novelties, the disparate cranial crests and the successful feeding apparatus, evolve in the same way—were both associated with a single or multiple evolutionary bursts? Finally, as body-size disparity was a key aspect of dinosaurian evolution and a potential factor in niche partitioning (Barrett Reference Barrett2014; Benson et al. Reference Benson, Hunt, Carrano and Campione2018), we test whether rates of hadrosauroid body-size evolution were homogeneous or a potentially important morphological variable. Our results confirm that hadrosauroid skull evolution was dynamic, while their postcranial skeleton was morphologically conservative. Body-size change is ruled out as an important source of innovation. Importantly, we show that the unique hadrosaurid jaw apparatus evolved fast and then stabilized at the root of the clade, whereas the cranial crests kept diversifying in several bursts of rapid evolution throughout hadrosaurid evolution. This highlights contrasting evolutionary dynamics between adaptive and nonadaptive morphological innovations during the diversification of hadrosauroid dinosaurs.
Material and Methods
Hadrosauroid Phylogeny
The hadrosauroid phylogenies used in this study are from Prieto-Márquez et al. (Reference Prieto-Márquez, Erickson and Ebersole2016). Their study included 60 hadrosauroid species and the out-group Iguanodon, and four most parsimonious trees (MPTs) were generated using maximum parsimony analysis. Overall, hadrosauroid interrelationships were well resolved, with uncertainty only in the positions of Levnesovia and Bactrosaurus and the interrelationships of brachylophosaurin saurolophines (Fig. 1). In this study we perform rate analyses on all four MPTs to gauge the influence of phylogenetic uncertainty. Results are summarized using consensus trees, and individual MPTs are presented in the Supplementary Material.
Phylogenetic Time-scaling
Our evolutionary rate analyses required phylogenies with estimated branch durations. Geological ages for terminal taxa were needed first. Precise temporal occurrence data are rarely known for hadrosauroids, and in most cases, taxon durations represent the bounds of the geological formation(s), stage(s) or substage(s) in which referred fossils are known. Therefore, hadrosauroid ages were recorded as first appearance dates (FADs) and last appearance dates (LADs), using data collected from the primary literature and the geological time scale of Walker et al. (Reference Walker, Geissman, Bowring and Babcock2013) (data in the Supplementary Material S1).
There are multiple methods available for producing time-calibrated phylogenies, and the choice of method can impact results (Bapst Reference Bapst2014; Soul and Friedman Reference Soul and Friedman2017). To account for this, we implement two popular time-scaling approaches, the “Hedman” method and the “minimum branch length” (MBL) approach. The Hedman method uses Bayesian statistics to date nodes, incorporating probability distribution constraints derived from successive out-group taxa ages (Hedman Reference Hedman2010). We utilized a whole-tree extension of the Hedman algorithm using the R functions from Lloyd et al. (Reference Lloyd, Bapst, Friedman and Davis2016). Successive out-group taxa that predate the hadrosauroid plus Iguanodon in-group were required to date the nodes close to, and including, the root. Guided by the supertree from Strickson et al. (Reference Strickson, Prieto-Márquez, Benton and Stubbs2016), which is a composite topology derived from six phylogenetic studies (Butler et al. Reference Butler, Liyong, Jun and Godefroit2011; Makovicky et al. Reference Makovicky, Kilbourne, Sadleir and Norell2011; McDonald Reference McDonald2012; Ősi et al. Reference Ősi, Prondvai, Butler and Weishampel2012; Norman Reference Norman2015; Prieto-Márquez et al. Reference Prieto-Márquez, Erickson and Ebersole2016), we used the occurrence dates of the following out-group taxa: Kukufeldia, Uteodon, Camptosaurus, Callovosaurus, Agilisaurus, Lesothosaurus, Pisanosaurus, Marasuchus, and Euparkeria (ages are listed in the Supplementary Material S1). The MBL dating method uses the age of the oldest descendant to determine internal node ages. When branches are recovered with durations less than an arbitrarily set threshold, they are substituted with a fixed MBL (here we use 1 Myr) (Laurin Reference Laurin2004). The Hedman dating method is considered to be superior to the MBL approach (Lloyd et al. Reference Lloyd, Bapst, Friedman and Davis2016), so here we use the MBL method only in ancillary analyses to check that our results are consistent.
Dating uncertainty for terminal taxa was incorporated when time-scaling the phylogenies. We randomly selected a point age for each taxon from a uniform distribution between its FAD and LAD (dates reflecting bounds of precise temporal occurrence or range) and performed 100 dating replicates for each MPT. In total, 800 time-scaled hadrosauroid phylogenetic trees were used in the evolutionary rate analyses: 100 replicates for each of the four MPTs, for both the Hedman and MBL dating approaches.
Morphological Data
To test rates of skeletal character evolution, we used the discrete morphological character data set from Prieto-Márquez et al. (Reference Prieto-Márquez, Erickson and Ebersole2016). In total, 273 morphological characters are included, describing variation from the entire skeleton (see the Supplementary Material S1). The data set has good coverage of the non-hadrosaurid hadrosauroid grade and both major hadrosaurid subclades; the Lambeosaurinae and Saurolophinae. The data set was partitioned to examine evolutionary rates in specific anatomical subregions. The most basic division was to examine rates in the skull, including the cranium, mandible, and teeth (189 characters), versus the postcranial skeleton (84 characters). Additionally, we divided the skull into separate components: the facial skeleton, the crest-forming elements, and feeding characters. The facial skeleton includes cranial characters, but excludes the braincase, the mandible, and dentition (107 characters). Crest morphology includes characters primarily from the premaxilla and nasal bones and characters relevant to the formation and shape of crests (63 characters). Feeding-related characters are derived from the mandible and dentition (48 characters). Rate analyses were performed separately on these five partitions.
For body-size evolutionary rate analyses, we used maximum femur length as a proxy for hadrosauroid body mass. Femur length is a popular proxy for overall body mass in tetrapods (Carrano Reference Carrano, Carrano, Gaudin, Blob and Wible2006), whereas some studies also use stylopodial shaft circumference (e.g., Benson et al. Reference Benson, Hunt, Carrano and Campione2018). We selected femur lengths, because more data are available for hadrosauroids (37 out of 60 hadrosauroids in our phylogeny, but the other 23 taxa lacked adequate femora). Femur length data are from Benson et al. (Reference Benson, Hunt, Carrano and Campione2018), and this data set could not be expanded further through additional museum visits. Data were log10 transformed before rate analyses (see the Supplementary Material S1).
Discrete Character Evolutionary Rates
Rates of character evolution were examined using maximum-likelihood methods. All character rate calculations were performed in R (R Core Team 2018), using the DiscreteCharacterRate function from the package ‘Claddis’ (Lloyd Reference Lloyd2016), and ancestral states were calculated using the rerootingMethod function in the R package ‘phytools’ (Revell Reference Revell2012). We used protocols established by previous studies (e.g., Lloyd et al. Reference Lloyd, Wang and Brusatte2012; Brusatte et al. Reference Brusatte, Lloyd, Wang and Norell2014; Hopkins and Smith Reference Hopkins and Smith2015; Wang and Lloyd Reference Wang and Lloyd2016; Herrera-Flores et al. Reference Herrera-Flores, Stubbs and Benton2017). The separate analyses required the time-scaled phylogenies and the five partitioned character data sets as input. Rate calculations were based on the number of character changes observed along a branch relative to the duration of that branch. Importantly, the calculations also factored in branch completeness as a denominator (Wang and Lloyd Reference Wang and Lloyd2016). This is important, because the calculations were based on multiple coded morphological characters (here ranging from 189 to 48 characters), and fossil incompleteness and character inapplicability will introduce varying degrees of missing data (both for terminal taxa and reconstructed ancestral nodes). This could influence chances of observing character changes. Therefore, per-branch rates were based on changes per character per lineage million years.
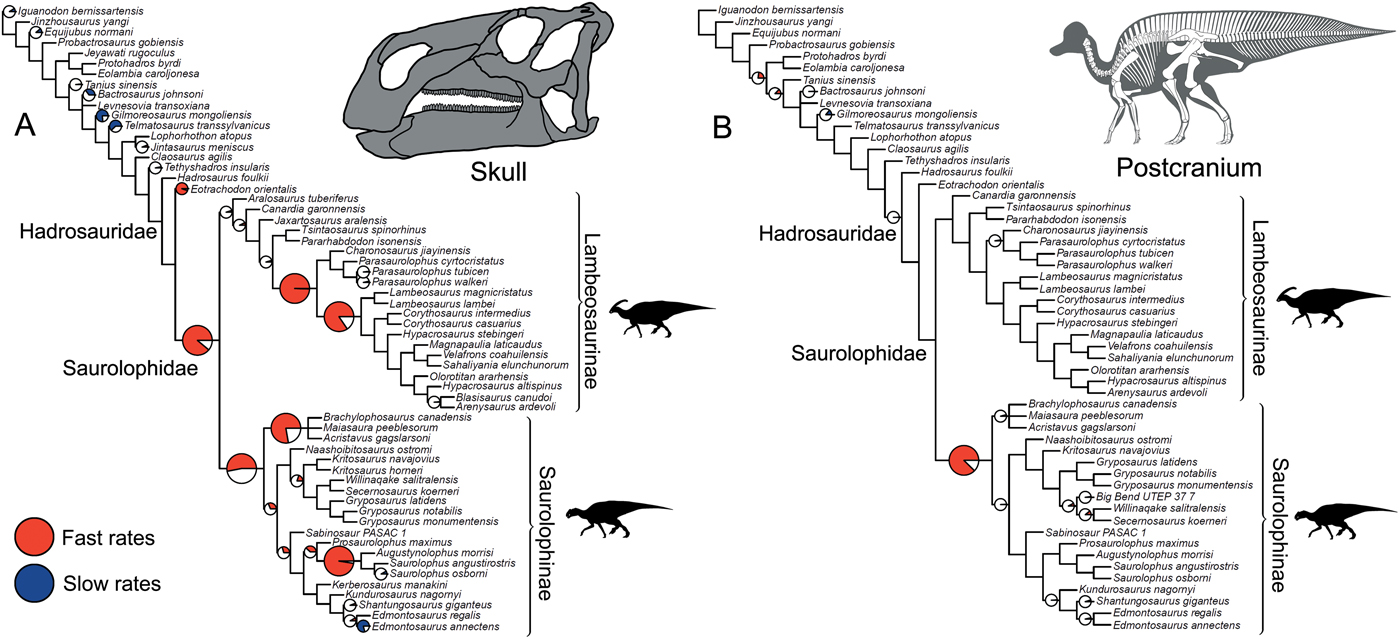
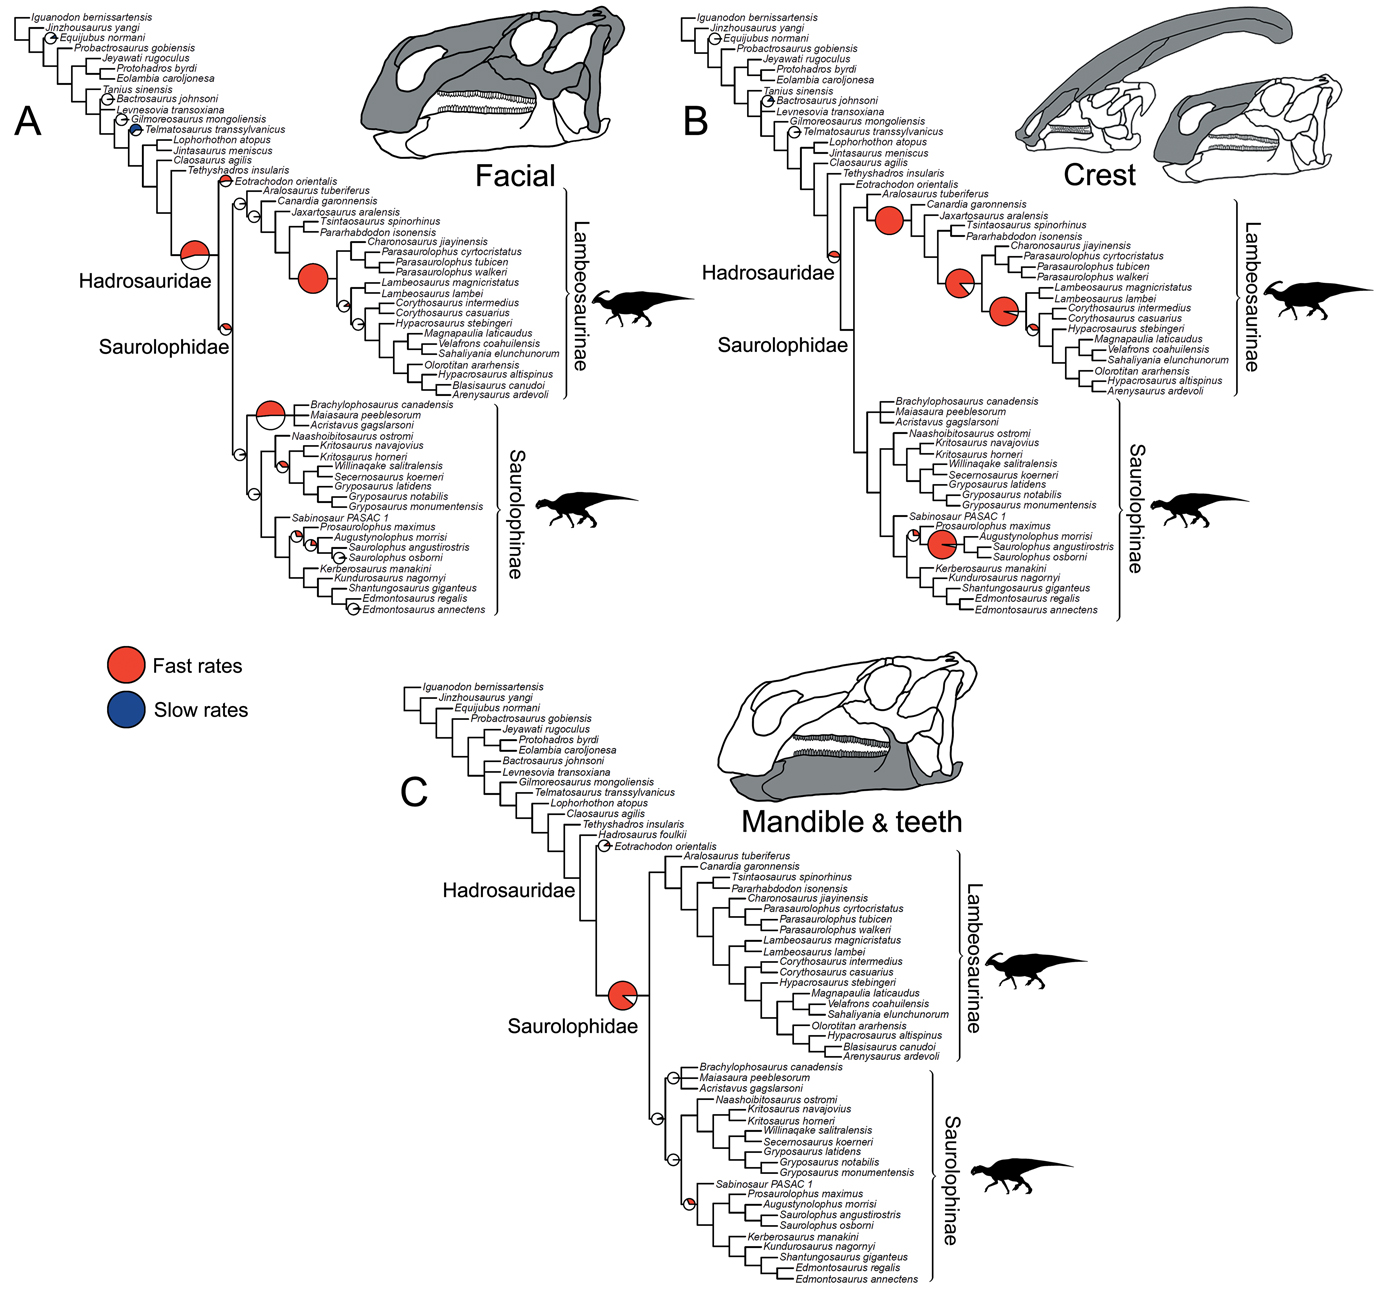
Significance tests were used to examine heterogeneous evolutionary rates and to identify branches with notable rate deviations. Rather than focusing on absolute rate values, we followed previous studies and tested whether all individual branches in a tree exhibit higher or lower rates of morphological evolution than the pooled rate for the rest of the tree (Lloyd et al. Reference Lloyd, Wang and Brusatte2012; Brusatte et al. Reference Brusatte, Lloyd, Wang and Norell2014; Hopkins and Smith Reference Hopkins and Smith2015; Wang and Lloyd Reference Wang and Lloyd2016; Herrera-Flores et al. Reference Herrera-Flores, Stubbs and Benton2017). To determine statistical significance, we used branch likelihood ratio tests, comparing a single rate model (homogeneous rates across the tree) and a two-rate model (individual branch rates different from the rest of the tree). Each branch test gives a p-value, and, following published protocols, we use an alpha threshold of 0.01 to assess significance, with Benjamini-Hochberg false discovery rate correction for multiple comparisons (Benjamini and Hochberg Reference Benjamini and Hochberg1995; Lloyd et al. Reference Lloyd, Wang and Brusatte2012; Brusatte et al. Reference Brusatte, Lloyd, Wang and Norell2014; Hopkins and Smith Reference Hopkins and Smith2015; Wang and Lloyd Reference Wang and Lloyd2016; Herrera-Flores et al. Reference Herrera-Flores, Stubbs and Benton2017). In the main text, results from the branch likelihood tests are summarized on a strict consensus tree derived from the four separately analyzed MPTs, incorporating a total of 400 Hedman-dated phylogenies. We use pie charts to illustrate the proportion of dating replicates that showed significantly high or low rates for each branch (Figs. 2, 3).
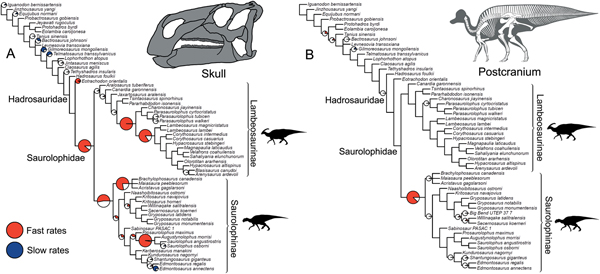
Rates of skeletal character evolution in the skull and postcranial skeleton of hadrosauroids. Cladograms illustrate the results from branch likelihood tests for two morphological partitions: skull (cranium and mandible) (A) and postcranial skeleton (B). In both cladograms, results from the branch likelihood tests are summarized on a strict consensus tree derived from four separately analyzed MPTs, each with 100 dating replicates (a total of 400 Hedman-dated phylogenies). Pie charts on branches illustrate the proportion of dating replicates that showed significantly high rates (red), slow rates (blue), or nonsignificant average rates (white). No pie charts are plotted on branches that showed nonsignificant rates in 100% of dating replicates. Branches that showed high rates (red) in more than 50% of dating replicates are doubled in length. See the Supplementary Material for Hedman-based results plotted separately for each MPT (Supplementary Fig. S2) and for results using the MBL dating method (Supplementary Fig. S3). Silhouettes were created by Scott Hartman and were downloaded from http://phylopic.org (Creative Commons license CC BY 3.0).
Rates of skeletal character evolution in the skulls of hadrosauroids. Cladograms illustrate the results from branch likelihood tests for three morphological partitions: facial bones (A), crest-forming elements (B), and mandible and teeth (C). In all cladograms, results from the branch likelihood tests are summarized on a strict consensus tree derived from four separately analyzed MPTs, each with 100 dating replicates (a total of 400 Hedman-dated phylogenies). Pie charts on branches illustrate the proportion of dating replicates that showed significantly high rates (red), slow rates (blue), or nonsignificant average rates (white). No pie charts are plotted on branches that showed nonsignificant rates in 100% of dating replicates. Branches that showed high rates (red) in more than 50% of dating replicates are doubled in length. See the Supplementary Material for Hedman-based results plotted separately for each MPT (Supplementary Fig. S2) and for results using the MBL dating method (Supplementary Fig. S3). Silhouettes were created by Scott Hartman and were downloaded from http://phylopic.org (Creative Commons license CC BY 3.0).
Body-Size Evolutionary Rates
Body-size evolutionary rates were analyzed in a Bayesian framework using a univariate variable-rates model in BayesTraits v. 2.0.2 and R (Pagel et al. Reference Pagel, Meade and Barker2004; Venditti et al. Reference Venditti, Meade and Pagel2011; Baker et al. Reference Baker, Meade, Pagel and Venditti2016). We examined rate heterogeneity with a Bayesian Markov chain Monte Carlo reversible-jump algorithm. Analyses were run for 10 million (10,000,000) iterations, with parameters sampled every 1000 iterations. The first 10% (1,000,000) of samples were discarded as burn-in, and convergence was assessed based on effective sample size values >200. This method accounts for phenotypic change along branches assuming a homogeneous Brownian process and also introduces a variable-rates model where branch-specific scalars are incorporated that accommodate branches with greater (or less) phenotypic variance than expected from a homogeneous model (Baker et al. Reference Baker, Meade, Pagel and Venditti2016). We assessed the fit of a Brownian (homogeneous) versus variable-rates (heterogeneous) model using Bayes factors (BFs). The marginal likelihood of each model was calculated using stepping-stone sampling, with 100 stones each run for 1000 iterations (Xie et al. Reference Xie, Lewis, Fan, Kuo and Chen2011). Across hadrosauroid phylogeny, branch-specific rates were reported using the mean scalar parameter. In the main text we present the results using a consensus tree from variable-rates analyses using 400 Hedman-dated phylogenies (four MPTs, each with 100 dating replicates).
Morphological Disparity
Disparity analyses were performed to explore the distribution of skeletal morphological variation in Hadrosauroidea. First, the five partitioned character–taxon morphological data sets were used to calculate a pairwise dissimilarity matrix, based on maximum observable rescaled distances (MORD), using the R package ‘Claddis’ (Lloyd Reference Lloyd2016). From this dissimilarity matrix, disparity was then quantified in four taxonomic bins: the non-hadrosaurid hadrosauroid grade (paraphyletic), Hadrosauridae, Lambeosaurinae, and Saurolophinae. These comparisons were made to test whether the hadrosaurid diversification gave rise to significantly greater morphological disparity than was present in the hadrosauroid grade for each morphological partition and to examine how disparity varied between the two major hadrosaurid subclades. We calculated the variance-based disparity metric within-bin weighted mean pairwise dissimilarity (WMPD). WMPD places greater weighting on pairwise dissimilarities derived from more comparable characters and is robust to sample-size variation (Close et al. Reference Close, Friedman, Lloyd and Benson2015). The 95% confidence intervals were generated using a bootstrapping procedure. Supplementary disparity calculations were performed based on unweighted mean pairwise dissimilarity (MPD) and using generalized Euclidean distances.
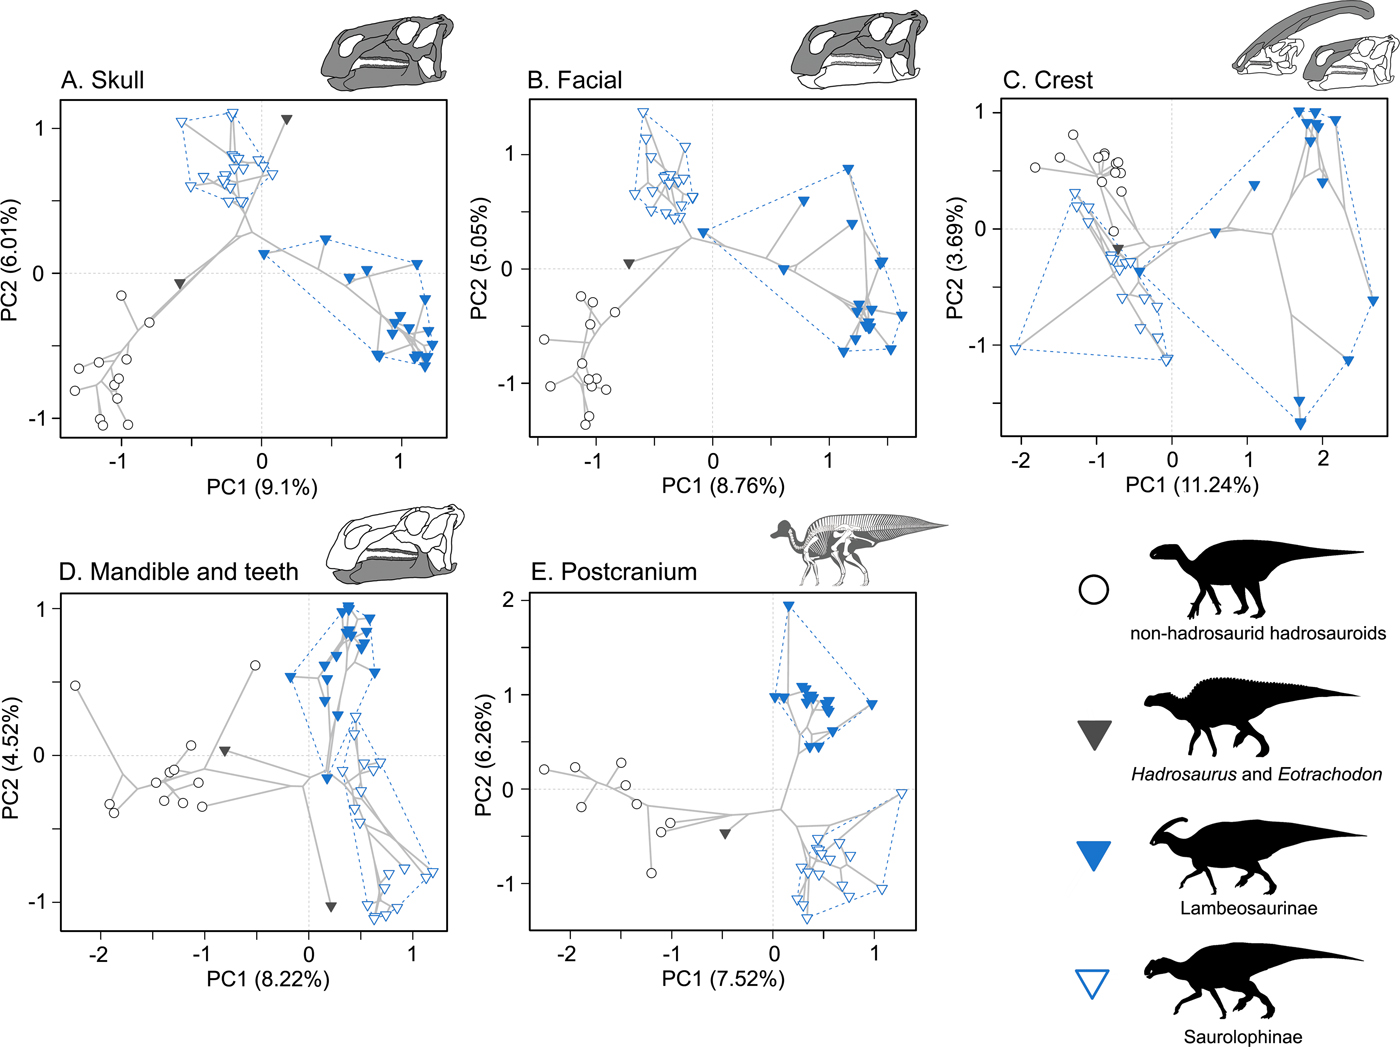
To further examine morphological diversification in Hadrosauroidea, we generated morphospaces for each anatomical region. The separate MORD matrices were subjected to principal coordinates analysis (PCoA) incorporating Calliez negative eigenvalue correction (Cailliez Reference Cailliez1983). Before each PCoA, the function TrimMorphDistMatrix from the R package ‘Claddis’ (Lloyd Reference Lloyd2016) was used to iteratively remove selected taxa from the distance matrices that had no shared coded characters (meaning morphological distances were not calculable). Morphospaces were constructed based on PCoA axes 1 and 2, showing the major axes of morphological variation. It is important to note that applying the Cailliez correction notably reduced the proportion of variance expressed by the major PCoA axes when compared with “uncorrected” PCoA (Supplementary Fig. S7). However, in both analyses, the distribution of taxa within morphospace was nearly identical for the major axes, as previously discussed by Hopkins (Reference Hopkins2016) and Nordén et al. (Reference Nordén, Stubbs, Prieto-Márquez and Benton2018). We used a phylomorphospace approach to visualize the phylogenetic branching pattern. We use a single Hedman-dated phylogeny with the topology of MPT 1 in all phylomorphospace plots. The locations of internal nodes in the phylomorphospaces (the inferred ancestral morphospace positions) were estimated using maximum-likelihood approaches in the R package ‘phytools’ (Revell Reference Revell2012).
Results
Rates of Skeletal Character Evolution
Rates of skeletal character evolution were heterogeneous in hadrosauroids. In all 800 trees examined for each of the five morphological partitions, a null test for homogeneous rates across the whole tree was confidently rejected at an alpha threshold of 0.01. This applied to trees time-scaled using both the Hedman and MBL methods. As a result, individual per-branch tests were required to explore the distribution of rate deviations throughout the phylogenies. The frequencies and positions of evolutionary bursts vary for each morphological partition considered, and these are illustrated using consensus trees from the 400 Hedman-dated phylogenies (Figs. 2, 3; MBL results in Supplementary Fig. S3). There is no evidence that the contrasting numbers of significant high- or low-rate branches in the five morphological partitions is a result of variable character-coding completeness (Supplementary Fig. S4). By examining character changes on branches throughout the phylogenies, we confirm that, in all anatomical partitions, significantly high-rate branches reflect large numbers of novel character changes and do not reflect the rapid recycling of already acquired states (Supplementary Fig. S5).
In the skull, likelihood tests show that significantly high evolutionary rates are concentrated in hadrosaurids, while the hadrosauroid grade shows either nonsignificant rates (neither high nor low) or significantly low rates at the tips (e.g., Gilmoreosaurus and Telmatosaurus) (Fig. 2A). Significantly high rates are seen on the basal hadrosaurid branch giving rise to Saurolophidae. Two branches within Lambeosaurinae also consistently show significantly high rates across dating replicates. Other high-rate branches are seen at the base of saurolophines and brachylophosaurin saurolophines, and on the branch leading to Saurolophus and Augustynolophus. These trends are essentially the same when using the MBL dating method (Supplementary Fig. S3). Evolutionary rates in the postcranial skeleton show contrasting results (Fig. 2B): only one branch, at the origin of saurolophines, shows significantly accelerated rates, and no other significant rate shifts are recovered among hadrosaurids. There is very tentative evidence for high postcranial rates more basally in hadrosauroids, but this is not consistently recovered across dating replicates and is recovered in less than 25% of iterations (Fig. 2B).
Subdividing the skull into constituent parts reveals more nuanced trends (Fig. 3). When considering just the facial complex (skull minus the mandible, teeth, and braincase), significantly accelerated rates are recovered at the base of Hadrosauridae and brachylophosaurin saurolophines, and for one branch within more derived lambeosaurines (Fig. 3A). There is some evidence for further facial high-rate excursions at the base of Saurolophidae and within Kritosaurini and Saurolophini, but these are not consistently recovered in dating replicates (Fig. 3A). When the phylogenies are dated using the MBL approach, high rates in facial characters are consistently seen at the base of Saurolophidae, but not Hadrosauridae. For the crest-related premaxilla and nasal bones, significantly high rates are seen basally in lambeosaurine hadrosaurids, on the branch leading to all members of the clade except Aralosaurus (Fig. 3B). Two further high-rate branches are also consistently recovered in more derived lambeosaurines, at the base of the clade including all members of Parasaurolophini and Lambeosaurini, and again at the branch just for Lambeosaurini. Accelerated rates in crest-related bones are also seen in the Saurolophini within saurolophines (Fig. 3B). There is some support for high crest rates on the basal branch for Hadrosauridae, but this is only recovered in 45% of Hedman-dated trees. Feeding-related characters from the mandible and dentition have significantly accelerated rates on only a single branch, the basal hadrosaurid branch leading to Saurolophidae (Fig. 3C). Nonsignificant rates dominate, and there are no further instances of significant rate shifts in feeding characters within the clade. This result is identical in trees dated using the MBL method (Supplementary Fig. S3).
Hadrosauroid Morphological Disparity
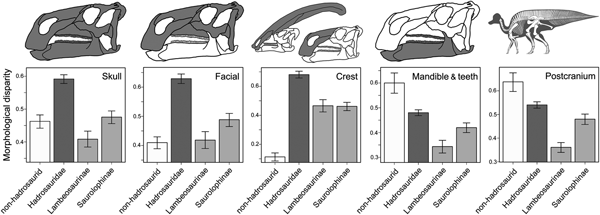
Morphological disparity was unevenly distributed in hadrosauroids (Fig. 4). In the skull, hadrosaurids exhibit significantly greater disparity (WMPD) than the non-hadrosaurid hadrosauroid grade. Within hadrosaurids, saurolophines have greater skull disparity than lambeosaurines. This result is identical when considering only the bones from the facial complex (skull minus the braincase, mandible, and teeth). For the crest-related premaxilla and nasal bones, hadrosaurids once again exhibit significantly greater disparity than the hadrosauroid grade, with the magnitude of difference being even more than when all skull or facial bones are considered. For crest bones, disparity is subequal in lambeosaurines and saurolophines. The hadrosauroid grade has significantly greater disparity in feeding-related characters from the mandible and dentition when compared with hadrosaurids. The same is true when examining the postcranial skeleton (Fig. 4). Disparity results are consistent for unweighted MPD and in calculations using generalized Euclidean distances (Supplementary Fig. S6).
Hadrosauroid morphological disparity. Disparity is weighted mean pairwise dissimilarity (WMPD) calculated from maximum observable rescaled distances (MORD). Results are plotted for the entire skull, the facial skeleton, the crest-forming elements, the mandible and teeth, and the postcranial skeleton. Disparity was calculated for four taxonomic bins: the non-hadrosaurid hadrosauroid grade, Hadrosauridae, Lambeosaurinae, and Saurolophinae. Error bars represent 95% confidence intervals generated using a bootstrapping procedure. Disparity results from unweighted MPD and using generalized Euclidean distances are in the Supplementary Material (Supplementary Fig. S6).

Morphospace trends generally support the conclusions derived from WMPD disparity summary statistics. Morphospaces for the whole skull and just facial bones show that the non-hadrosaurid hadrosauroids occupy a small area of morphospace on both PCoA axes 1 and 2. In contrast, the hadrosaurids have expansive morphospace occupation, and the lambeosaurines and saurolophines radiate on both major axes (Fig. 5A,B). Massive morphospace expansion in hadrosaurids is even more distinct for the crest-related premaxilla and nasal bones (Fig. 5C). Saurolophines are positioned close to the non-hadrosaurid hadrosauroid grade, but they do diverge along PCoA axis 2. The lambeosaurines markedly radiate along PCoA axis 1 and also expand greatly on PCoA axis 2, reflecting the disparate crest morphologies of Parasaurolophini and Lambeosaurini (Fig. 5C). In morphospace for feeding-related characters from the jaws and dentition, the non-hadrosaurid hadrosauroids show a more pronounced expansion along PCoA axis 1 compared with other anatomical regions (Fig. 5D). In comparison, hadrosaurids are densely concentrated in a relatively limited expanse of PCoA axis 1. This may explain the reduced WMPD value for hadrosaurids in this character subset (Fig. 4). Saurolophines and lambeosaurines do differ in characters of the jaws and dentition, but this divergence is seen on PCoA axis 2 (Fig. 5D). Similar morphospace trends are seen in the postcranial skeleton, where hadrosaurids do not show such expansive occupation along PCoA axis 1 and are densely concentrated (Fig. 5E).
Morphospace trends in Hadrosauroidea. Phylomorphospace plots are based on PCoA axes 1 and 2 for five morphological character partitions: skull (55 taxa) (A), facial bones (55 taxa) (B), crest-forming elements (51 taxa) (C), mandible and teeth (52 taxa) (D), and the postcranial skeleton (44 taxa) (E). The major comparative groupings are denoted by different symbols and convex hulls: the non-hadrosaurid hadrosauroid grade (white circles), Hadrosauridae (triangles), Lambeosaurinae (blue filled triangle online) and Saurolophinae (white filled triangles). The percentage proportional contributions to variance for the plotted axes with/without Calliez correction are: skull (PC 1 9.1%/32.71%, PC 2 6.01%/16.82%) (A), facial bones (PC 1 8.76%/37.63%, PC 2 5.05%/15.5%) (B), crest-forming elements (PC 1 11.24%/50.7%, PC 2 3.69%/10.22%) (C), mandible and teeth (PC 1 8.22%/39.05%, PC 2 4.52%/13.8%) (D), and the postcranial skeleton (PC 1 7.52%/28.55%, PC 2 6.26%/18.01%) (E). Plots illustrating the proportional contribution to variance for all PCoA axes for each character partition are presented in the Supplementary Material (Supplementary Fig. S7). Silhouettes were created by Pete Buchholz, Scott Hartman, and Iain Reid and were downloaded from http://phylopic.org (Creative Commons license CC BY 3.0).
Rates of Body-Size Evolution
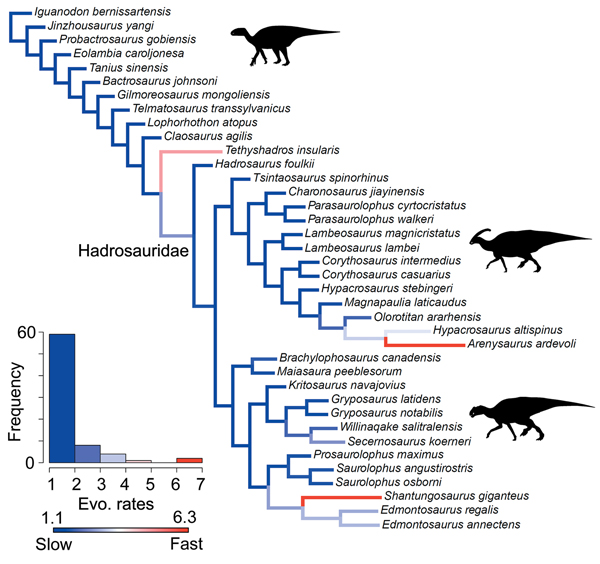
A heterogeneous rate (variable-rates) model for body-size evolution in hadrosauroids received mixed support. Across the 400 analyzed Hedman-dated phylogenies, 37.5% showed very strong evidence for heterogeneity (BFs > 10), 79.25% showed strong evidence (BFs > 5), and 92.75% showed positive evidence (BFs > 2). High-rate branches are rare, and they are concentrated at the terminal branches for Arenysaurus, Shantungosaurus, and Tethyshadros (Fig. 6). High-rate internal branches are seen in the clades containing Shantungosaurus, Edmontosaurus regalis, and Edmontosaurus annectens, and Hypacrosaurus and Arenysaurus (Fig. 6). Body-size rate trends are consistent in trees dated using the MBL scaling method (Supplementary Fig. S9). The support for heterogeneous rates is comparable (36.25% BFs > 10, 76.75% BFs > 5, 90.75% BFs > 2). High rates are seen at the same terminal branches, and relatively slow evolutionary rates dominate.
Rates of body-size evolution in hadrosauroids estimated using the variable-rates model in BayesTraits. Femur length was used as a proxy for hadrosauroid body mass. The cladogram is a consensus phylogeny showing the results from four separately analyzed MPTs, each with 100 dating replicates (a total of 400 Hedman-dated phylogenies). Phylogenetic branches are colored and scaled by estimates of the mean relative rate of body-size evolution (mean scalar parameter). Branch lengths represent the rate scale parameter, so longer branches equal faster rates. The histogram shows the distribution of mean rates across all edges in the tree. See the Supplementary Material for Hedman-based results plotted separately for each MPT (Supplementary Fig. S8) and for results using the MBL dating method (Supplementary Fig. S9). Silhouettes were created by Scott Hartman and Iain Reid and were downloaded from http://phylopic.org (Creative Commons license CC BY 3.0).

Discussion
Morphological Innovation and Hadrosaurid Evolution
We show that hadrosaurid skull disparity was achieved through a series of evolutionary bursts driven by high evolutionary rates, both at the base of Hadrosauridae and at more derived positions within lambeosaurines and saurolophines (Figs. 2, 3). Our results also confirm that hadrosauroid skull evolution was complex and dynamic, but their postcranial skeleton became morphologically conservative. Overall skull disparity was significantly greater in hadrosaurids than the paraphyletic grade of non-hadrosaurid hadrosauroids, but the opposite was seen in the postcranial skeleton (Fig. 4).
The role of morphological innovations during evolutionary diversifications is a key topic in evolutionary biology (Simpson Reference Simpson1953; Briggs et al. Reference Briggs, Fortey and Wills1992; Foote Reference Foote1997; Benton Reference Benton2015; Simões et al. Reference Simões, Breitkreuz, Alvarado, Baca, Cooper, Heins, Herzog and Lieberman2016; Rabosky Reference Rabosky2017; Cooney et al. Reference Cooney, Bright, Capp, Chira, Hughes, Moody, Nouri, Varley and Thomas2017). Our study suggests the hadrosaurid radiation was linked to both multiple bursts of innovation, which generated variety, and to a key innovation, associated with low disparity. This was revealed by dividing the skull into subunits, which highlighted contrasting evolutionary dynamics between the facial complex and crests and characters associated with the feeding apparatus (Figs. 3, 4, 5). We show that high skull disparity was driven by the facial complex and crest-related characters. Both these subunits have significantly greater disparity in hadrosaurids than in the paraphyletic grade of non-hadrosaurid hadrosauroids, and rate analyses pinpoint multiple phylogenetic branches where evolutionary innovation is accelerated. In contrast, mandibular and dental disparity is significantly reduced in hadrosaurids, when compared with their hadrosauroid out-groups, and branch likelihood tests reveal just one high-rate branch at the base of Saurolophidae, the inclusive clade including all saurolophines and lambeosaurines (Figs. 3, 4, 5). Together, these analyses suggest that a significant burst of phenotypic evolution took place on a single phylogenetic branch, leading to the development of the hadrosaurid feeding apparatus, and was followed by limited subsequent changes or a slower pace of evolution, resulting in low variance.
The Hadrosaurid Feeding Apparatus
Directly linking putative key innovations to successful clades is problematic (Rabosky Reference Rabosky2017). However, the trends reported here are consistent with those expected when a key innovation facilitates the invasion of a new adaptive zone, leading to increased diversification. Morphological changes that occurred during the evolution of the hadrosaurid dental battery and derived jaw mechanism would have resulted in more sophisticated oral food processing, improving efficiency when processing tough vegetation, decayed wood, and even crustaceans (Erickson et al. Reference Erickson, Krick, Hamilton, Bourne, Norell, Lilleodden and Sawyer2012; Leblanc et al. Reference Leblanc, Reisz, Evans and Bailleul2016; Chin et al. Reference Chin, Feldmann and Tashman2017). This advantageous adaptation could have served as a catalyst for diversification. We show that rapid evolutionary rates occur on just one branch at the base of Saurolophidae (Fig. 3C). Saurolophids/hadrosaurids were incredibly diverse and had high speciation rates in the latest Cretaceous when compared with the grade of non-hadrosaurid hadrosauroids and other ornithopods (Prieto-Márquez Reference Prieto-Márquez2010a; Strickson et al. Reference Strickson, Prieto-Márquez, Benton and Stubbs2016; Sakamoto et al. Reference Sakamoto, Benton and Venditti2016). Unlike Strickson et al. (Reference Strickson, Prieto-Márquez, Benton and Stubbs2016), we did not identify a rate shift at the base of saurolophines, most likely due to the different taxonomic scope of the studies and the inclusion of mandibular characters in our data.
Our result, that a key innovation is associated with low variance-based disparity in hadrosaurids, is perhaps counterintuitive, but it may suggest that innovation could not substantially diverge from the successful functional ideal, or the trend may result from high hadrosaurid diversity and morphospace saturation (Figs. 4, 5). The morphospace trends documented here show that innovation in hadrosaurid jaws and dentition was expressed on PCoA axis 2, but the group was densely concentrated in a reduced area of morphospace on the primary axis (PCoA axis 1) (Fig. 5D). This apparent saturation pattern mirrors the “morphospace packing” trend reported by Nordén et al. (Reference Nordén, Stubbs, Prieto-Márquez and Benton2018), based on an analysis of dental and jaw disparity in all Cretaceous herbivorous dinosaurs. When coupled with high diversity, such morphospace saturation or packing can reduce disparity values for distance-based metrics (Fig. 4) (Nordén et al. Reference Nordén, Stubbs, Prieto-Márquez and Benton2018).
Crest Innovations
An important question in the evolutionary history of dinosaurs, particularly in the hadrosaurids, is how and why the great disparity of exaggerated cranial structures evolved (Hopson Reference Hopson1975; Evans et al. Reference Evans, Ridgely and Witmer2009; Evans Reference Evans2010; Prieto-Márquez and Wagner Reference Prieto-Márquez and Wagner2013; Gates et al. Reference Gates, Organ and Zanno2016; Knapp et al. Reference Knapp, Knell, Farke, Loewen and Hone2018). Comparative anatomy has revealed the anatomical transformations involved in producing these complex structures. In hadrosaurids, extreme morphological transformations occurred in the premaxilla and nasal bones, involving significant caudal and dorsal migration of facial elements (Evans Reference Evans2010; Prieto-Márquez and Wagner Reference Prieto-Márquez and Wagner2013; Prieto-Márquez et al. Reference Prieto-Márquez, Wagner, Bell and Chiappe2015). Our study augments this, and places hadrosaurid crest evolution in a phylogenetic comparative context (Fig. 3B). We reveal multiple pulses of rapid phenotypic evolution. One rate shift is seen basally in lambeosaurines, moving them away from the ancestral condition and resulting in morphospace expansion (Fig. 5C). Further high-rate branches are recovered in more derived lambeosaurines, at the base of the clade including all members of the Parasaurolophini and Lambeosaurini, and again on the branch leading to just Lambeosaurini (Fig. 3B). It is interesting that high rates in crest-associated characters are also recovered in the Saurolophini. Members of this clade, Augustynolophus and Saurolophus, evolved caudally projecting crests on the skull roof, similar in gross morphology to those seen in some lambeosaurines (Fig. 1) (Prieto-Márquez et al. Reference Prieto-Márquez, Wagner, Bell and Chiappe2015). This implies that rapid evolutionary rates are important for producing these exaggerated structures, a hypothesis that could be explored further in other vertebrate groups.
What was the potential significance of crest innovations in driving hadrosaurid diversity? It is well supported that hadrosaurid crests were display structures and most likely functioned as intraspecific displays (Evans Reference Evans2010; Bell et al. Reference Bell, Fanti, Currie and Arbour2014; Prieto-Márquez et al. Reference Prieto-Márquez, Wagner, Bell and Chiappe2015). Other potential functions, such as thermoregulation, respiration, defense, and feeding, have generally been ruled out (Hone et al. Reference Hone, Naish and Cuthill2011). Therefore, these species-specific structures could have been important in driving speciation through socio-sexual selection (Isles Reference Isles2009). In the ancestral hadrosauroid condition, the crest-forming bones make up the preorbital dorsal surface of the rostrum. In lambeosaurines and convergently in Saurolophini, phenotypic innovations, such as bone lengthening, migration, and rotation, resulted in crests that rise significantly over the skull table. These transformations were associated with fast evolutionary rates (Fig. 3B) and high disparity (Figs. 4, 5), and they highlight a potential common selection pressure for increasing the area, visibility, and elaboration of the displayed structure (Prieto-Márquez et al. Reference Prieto-Márquez, Wagner, Bell and Chiappe2015). Socio-sexual selection has been widely reported as an important evolutionary driver (Panhuis et al. Reference Panhuis, Butlin, Zuk and Tregenza2001; Maan and Seehausen Reference Maan and Seehausen2011; Wagner et al. Reference Wagner, Harmon and Seehausen2012; Knell et al. Reference Knell, Naish, Tomkins and Hone2013). In non-maniraptoriform theropods, the evolution of bony cranial ornamentation has been linked to elevated rates of body-size evolution and gigantism (Gates et al. Reference Gates, Organ and Zanno2016). Elaborated ornamental plumage has been posited as an important factor in the diversification of Cretaceous birds (Maia et al. Reference Maia, Rubenstein and Shawkey2013; O'Connor et al Reference O'Connor, Wang, Sullivan, Zheng, Tubaro, Zhang and Zhou2013). In pterosaurs, the development of large display crests represents the major component of cranial and mandibular disparity (Knell et al. Reference Knell, Naish, Tomkins and Hone2013; Navarro et al. Reference Navarro, Martin-Silverstone and Stubbs2018).
Body Size and Postcranial Evolution
Body-size innovations were not an important factor in the radiation of hadrosauroids. Hadrosauroid body-size evolution was not characterized by bursts of rapid evolutionary change on internal branches. Instead, rate heterogeneity is driven by three exceptional terminal taxa showing higher-rate excursions: Tethyshadros, Arenysaurus, and Shantungosaurus (Fig. 6). Tethyshadros and Arenysaurus are smaller-bodied species and have been identified as insular dwarfs (Dalla Vecchia Reference Dalla Vecchia2009; Cruzado-Caballero et al. Reference Cruzado-Caballero, Fortuny, Llacer and Canudo2015). Shantungosaurus is a gigantic saurolophine (body mass estimated at 17,400 kg), and one of the largest ornithischians known (Benson et al. Reference Benson, Hunt, Carrano and Campione2018). Previous quantitative studies of dinosaurian body-size evolution have documented high-rate shifts more basally in Ornithopoda. This occurred during the Middle to Late Jurassic in iguanodontians, long preceding the radiation of hadrosaurids in the Late Cretaceous (Benson et al. Reference Benson, Campione, Carrano, Mannion, Sullivan, Upchurch and Evans2014, Reference Benson, Hunt, Carrano and Campione2018).
Saurolophines differ from lambeosaurines in displaying accelerated rates of postcranial evolution ancestrally on a single branch (Fig. 2B). This is congruent with anatomical observations that suggest further transformations occurred in certain postcranial regions in saurolophines that did not take place in lambeosaurines. For example, the lambeosaurine ischium is notable for possessing a thumb-shaped process for articulating with the ilium and a “boot-like” process at the end of the ischial shaft (Brett-Surman and Wagner Reference Brett-Surman, Wagner and Carpenter2007). These features are absent in saurolophines but present in the out-groups. Therefore, the absence of these characters in saurolophines is the derived condition, while lambeosaurines exemplify a retention of these features with little modification.
Future Directions
Hadrosaurid macroevolution shows many interesting parallels to ceratopsians, particularly the derived larger-bodied quadrupedal ceratopsids (Ceratopsidae). Ceratopsids were also important components of Late Cretaceous terrestrial ecosystems, particularly in western North America (Lyson and Longrich Reference Lyson and Longrich2011). Ceratopsids experienced a rapid radiation in the Late Cretaceous, with fast speciation rates and high taxic diversity (Dodson et al. Reference Dodson, Forster, Sampson, Weishampel, Dodson and Osmolska2004; Sakamoto et al. Reference Sakamoto, Benton and Venditti2016). They share ecomorphological characteristics in the jaw (Bell et al. Reference Bell, Snively and Shychoski2009), and ceratopsids evolved a distinctive slicing dentition with complex tissues, aiding the processing of tough plant materials (Erickson et al. Reference Erickson, Sidebottom, Kay, Turner, Ip, Norell, Sawyer and Krick2015). Ceratopsids also possessed conspicuous and highly disparate cranial ornamentation in the form of nasal and postorbital horns and caudodorsally expanded parieto-squamosal frills (Brown and Henderson Reference Brown and Henderson2015). These structures likely functioned as displays in socio-sexual signaling (Hone et al. Reference Hone, Naish and Cuthill2011; Brown and Henderson Reference Brown and Henderson2015; Knapp et al. Reference Knapp, Knell, Farke, Loewen and Hone2018), as well as in combat and for the attachment of jaw musculature (Maiorino et al. Reference Maiorino, Farke, Kotsakis and Piras2017). As in hadrosaurids, the postcranial skeleton in neoceratopsians is morphologically conservative (Dodson et al. Reference Dodson, Forster, Sampson, Weishampel, Dodson and Osmolska2004). Future studies incorporating evolutionary rate and disparity analyses for ceratopsians and other archosaurs may uncover similar dynamics to those reported here and provide further insights into the evolution of adaptive and nonadaptive morphological innovations.
Acknowledgments
Many thanks to G. Lloyd, M. Puttick, and C. Venditti for methodological advice. We thank the reviewers for their constructive input and guidance. This work was funded by NERC grant NE/I027630/1 and ERC grant 788203 (INNOVATION) to M.J.B. and T.L.S., and NERC grant NE/L002434/1 to A.E. A.P.-M. was funded by a Marie Curie Intra-European Fellowship for Career Development grant (European Commission, Research and Innovation), the Generalitat de Catalunya (CERCA Program), and the Ramón y Cajal program from the Ministerio de Economía, Industria y Competitividad del Gobierno de España (RyC-2015-17388).


 Open access