


Se is an essential trace element for the synthesis of selenoproteins, which have various biological functions in humans and animals. However, there are conflicting findings regarding the protective action of Se and its adverse effects on glycaemic disorders(Reference Dubey, Thakur and Chattopadhyay1,Reference Vinceti, Filippini and Jablonska2) .
Experimental studies have demonstrated the insulin-mimicking effects of Se(Reference Stapleton3). In db/db mice with diabetes, oral administration of selenate for 9 weeks resulted in decreased glucose levels and increased insulin synthesis and secretion(Reference Wang, Yang and Zhang4). Similar effects have been observed in rodents with diabetes after sodium selenite supplementation(Reference Chen, Qiu and Dou5).
In addition, the absence of selenocysteine lyase, an enzyme that supplies Se for selenoprotein biosynthesis in mice, leads to hyperinsulinaemia, glucose intolerance and hepatic steatosis, even without dietary restriction of Se. These effects suggest that glucose and lipid homoeostasis depend on selenoprotein activity(Reference Seale, Hashimoto and Kurokawa6). In individuals with CHD, a reduction in oxidative stress(Reference Ju, Li and Li7), a decrease in glycated Hb (HbA1c) and regulation of seven genes involved in insulin signalling(Reference Jablonska, Reszka and Gromadzinska8) were also noted after Se supplementation.
In contrast, a secondary analysis of the Nutritional Prevention of Cancer showed, for the first time, an increased risk of type 2 diabetes mellitus in healthy subjects who received 200 µg/d of Se for an extended period(Reference Stranges, Marshall and Natarajan9). Mice developed insulin resistance using an equivalent dose of Nutritional Prevention of Cancer, 4 ppm Se/d(Reference Labunskyy, Lee and Handy10). Other animal studies have indicated that ingestion of high doses of Se can trigger hyperinsulinaemia, insulin resistance and glucose intolerance(Reference Zhou and Huang11). Elevated selenoprotein P concentrations have also been associated with worsening glucose metabolism through impaired insulin secretion in patients with type 2 diabetes mellitus (Reference Misu, Takamura and Takayama12–Reference Saito14).
The most recent meta-analysis identified that the relationship between Se and type 2 diabetes mellitus differs between observational studies and randomised controlled trials; therefore, further investigations into the effects of Se on glucose metabolism are needed(Reference Kohler, Foote and Kelley15). However, to date, no meta-analysis has been conducted on preclinical studies to analyse the effects of Se supplementation.
The attractive antioxidant functions of Se(Reference Calder, Carr and Gombart16), together with the association between its deficiency and the risk of mortality in patients with COVID-19(Reference Moghaddam, Heller and Sun17), can promote an increase in the intake of this metal by healthy individuals without considering the risks of excessive consumption(Reference Aldosary, Sutter and Schwartz18–Reference Ashar20).
Therefore, the effects of Se supplementation on glucose metabolism need to be investigated further, exploring possible mechanisms in healthy animal models, in order to resolve the controversies presented, since high blood glucose is the third factor associated with premature mortality(21), and there is no known recommendation to restrict Se supplementation in healthy populations to prevent type 2 diabetes mellitus.
This systematic review and meta-analysis are the first to provide insights into the effects of Se supplementation on markers of glycaemic control in healthy rodents.
Methods
This systematic review and meta-analysis was conducted according to the Preferred Reporting Items for Systematic Review and Meta-analysis guidelines(Reference Page, McKenzie and Bossuyt22). The protocol was registered at https://www.crd.york.ac./prospero/uk (PROSPERO) as CRD42021212011 and has been published recently(Reference Ferreira, de Sousa and Oliveira23). In addition, it includes the Systematic Review Center for Laboratory Animal Experimentation (SYRCLE) checklist items(Reference Hooijmans, Rovers and de Vries24).
Search strategy and eligibility of studies
The MEDLINE/PubMed, Web of Science, CINAHL Embase and Scopus databases were searched between January 1998 and May 2022. Grey literature searches and manual searches of the reference lists of the included articles were conducted to identify additional studies that were not retrieved through the search equations.
Next, two equations were built from the combination Boolean, Medical Subject Headings (MeSH) and entry terms as ‘animal model,’ ‘Rodentia,’ ‘selenium supplementation,’ ‘selenium,’ ‘selenite,’ ‘blood sugar,’ ‘glucose tolerance test,’ ‘insulin,’ ‘insulin response,’ ‘glucose metabolism,’ ‘glutathione peroxidase,’ ‘GPx expression’ and ‘selenoprotein P’ (online Supplementary Table 1. S1). Filters were used to identify animal models in PubMed and Embase databases. Language restrictions were not included in this search.
The following research question was used to determine the eligibility of the studies: ‘Does Se supplementation affect glycaemic control in healthy rodents?’ Thus, only studies on healthy rodents with glycaemic control markers and detection of Se biomarkers as the reported outcomes were included. Non-experimental studies, studies conducted with animal models of diseases, in vitro, ex vivo and in silico, with a population of pregnant animals, with the use of combined supplementation of Se and other micronutrients, or without treatment of glycaemia and Se status as control variables in the outcomes, were excluded from the review.
Fasting blood glucose was considered the primary endpoint, while Hb1Ac, insulin concentration, homeostatic assessment index, plasma Se concentration and GPX activity in tissues (liver, heart, kidney and pancreas) were considered secondary endpoints.
Study selection and data extraction
All articles retrieved in the search strategy were exported to the Rayyan QCRI® (The Systematic Reviews Web App). Two investigators (R. L. U. F. and A. W. F. S.) independently selected the studies by analysing the titles, abstracts and keywords. Disagreements were resolved by consensus or by a third investigator. Two investigators independently read the selected articles (R.L.U.F and A.W.F.S). Data extraction was performed in duplicate by the investigators using a standardised form (Online Supplementary Table 2. S2). A meta-analysis was conducted when it was possible to combine and analyse the results of at least two studies using the Stata software version 15.1 (Stata Corp.). Continuous variables were converted to the same scale, and the standardised mean difference (SMD) was calculated using the difference in means between the intervention and control groups divided by the pooled sd. The reviewers requested incomplete information from the corresponding author (a maximum of two attempts) via email. After selecting studies according to the eligibility criteria, references were checked to identify additional studies that were not retrieved in the search strategy.
Quality assessment
The risk of bias for each included study was assessed by two independent reviewers (R. L. U. F. and A. W. F. S.) using the SYRCLE(Reference Hooijmans, Rovers and de Vries24) bias tool. The studies included were classified as high, low or uncertain risk of bias, according to each of the tool’s ten domains (D1: random sequence generation (selection bias); D2: baseline characteristics; D3: allocation concealment (selection bias); D4: random housing; D5: blinding of caregivers/investigators; D6: random outcome assessment; D7: blinding of outcome assessment (detection bias); D8: incomplete outcome data (attrition bias); D9: selective reporting (reporting bias); and D10: other bias). The Collaborative Approach to Meta-Analysis and Review of Animal Data from Experimental Studies(Reference Macleod, O’Collins and Howells25) checklist was used to combine the reporting of various measures to reduce bias with external validity indicators. Therefore, the quality scores were calculated for each study. Studies with scores between 1 and 5 were considered ‘low quality,’ whereas studies with scores from 6 to 10 were classified as ‘high quality.’ Disagreements were resolved through discussion with a third reviewer (R. N. C.).
Data synthesis and statistical analysis
The results of the eligible studies were described in a narrative and graphic summary with the characteristics of the study, population (animals), form of Se supplementation used, intervention time and empirical comparison. A meta-analysis was conducted when it was possible to combine and analyse the results of at least two studies using the Stata software version 15.1 (Stata Corp.). Continuous variables were converted to the same scale, and the SMD was calculated as the difference in means between the intervention and control groups, divided by the pooled standard deviation. Furthermore, 95 % CI was also calculated. Heterogeneity between studies was verified using the I² test, with values > 50 % representing high heterogeneity. A random-effects model was used to pool the data, and a subgroup analysis was conducted according to intervention time and Se supplementation dose. Publication bias could not be analysed using a funnel plot because the number of studies included in the meta-analysis was less than ten(Reference Egger, Davey Smith and Schneider26,Reference Sterne, Sutton and Ioannidis27) .
Results
Search results
The literature search flow diagram is presented in Fig. 1. Overall, 2359 articles were identified using the search strategy. Thirteen studies were included in this systematic review. Of these thirteen studies, nine yielded data combined in the meta-analysis. Eight of the selected articles(Reference Zou, Qiu and Chen28–Reference Pillai, Sugathan and Indira35) had a primary outcome different from that of this review; however, they were included because they reported the effects of Se supplementation on glycaemic markers in healthy rodents.
Flow chart of the article screening process based on Preferred Reporting Items for Systematic Reviews and Meta-Analyses (PRISMA)(Reference Page, McKenzie and Bossuyt22).

Characteristics of included studies
A description of the studies included in this review is provided in Table 1. Sodium selenite was the form of intervention in eleven studies used at doses of 0·5 µg/d(Reference Mukherjee, Anbazhagan and Roy33), 1 μg/kg/d(Reference Pillai, Sugathan and Indira35,Reference Dhanya, Swathy and Indira36) , 500 μg/kg/d(Reference Kiełczykowska, Kocot and Kurzepa34), 864·7 μg/kg/d(Reference Ayaz, Ozdemir and Ugur29,Reference Can, Ulusu and Kilinç31,Reference Ulusu and Turan32,Reference Ayaz, Celik and Aydin37) , 1000 μg/d(Reference Zou, Qiu and Chen28), 1000 μg/kg/d(Reference Baş and Kalender38)and 4000 μg/kg/d(Reference Sheng, Huang and Xu39). The preferred routes of administration were oral, orogastric, intragastric, gavage and injection. The treatments ranged from 24 to 42 d. Most of the studies used the standard diet ad libitum to feed rodents(Reference Zou, Qiu and Chen28,Reference Ayaz, Ozdemir and Ugur29,Reference Can, Ulusu and Kilinç31–Reference Baş and Kalender38,Reference Al-Quraishy, Dkhil and Abdel Moneim40) , but none of the studies reported whether the diet administered was as recommended by AIN-93(Reference Reeves, Nielsen and Fahey41). Wistar rat models have been more frequently used in previous studies(Reference Zou, Qiu and Chen28,Reference Ayaz, Ozdemir and Ugur29,Reference Can, Ulusu and Kilinç31,Reference Ulusu and Turan32,Reference Kiełczykowska, Kocot and Kurzepa34,Reference Ayaz, Celik and Aydin37,Reference Baş and Kalender38,Reference Al-Quraishy, Dkhil and Abdel Moneim40) . Two other studies with Se nanoparticles (SeNP)(Reference Al-Quraishy, Dkhil and Abdel Moneim40,Reference El-Borady, Othman and Atallah42) were conducted in male albino Wistar rats with similar sample sizes, but different doses and treatment times were used.
Characteristics of studies included in analysis

SeNP, zero valent selenium nanoparticles; Na2SeO3, sodium selenite; FBG, fasting blood glucose; GPx, glutathione peroxidase; G1, control group untreated; G2, control group treated.
* P ≤ 0·05.
Effect of selenium supplementation on glucose homoeostasis
Fig. 2(a) presents all doses and forms of Se used for supplementation in the included studies and the respective effects on FBG and insulin, according to the time of administration.
Effects of Se supplementation on FBG, insulin and glutathione peroxidase (GPX) activity (blood and liver) according to Se form, dose and duration time of intervention. FBG, fasting blood glucose; SeNP, zero-valence Se nanoparticles; d, day; (*) means P < 0·05; (+) means dose of 867·7 μg/kg/d for 28 d without significant increase(Reference Ayaz, Celik and Aydin37); (#) means dose of 1 μg/kg/d for 30 d without significant changes(Reference Dhanya, Swathy and Indira36).
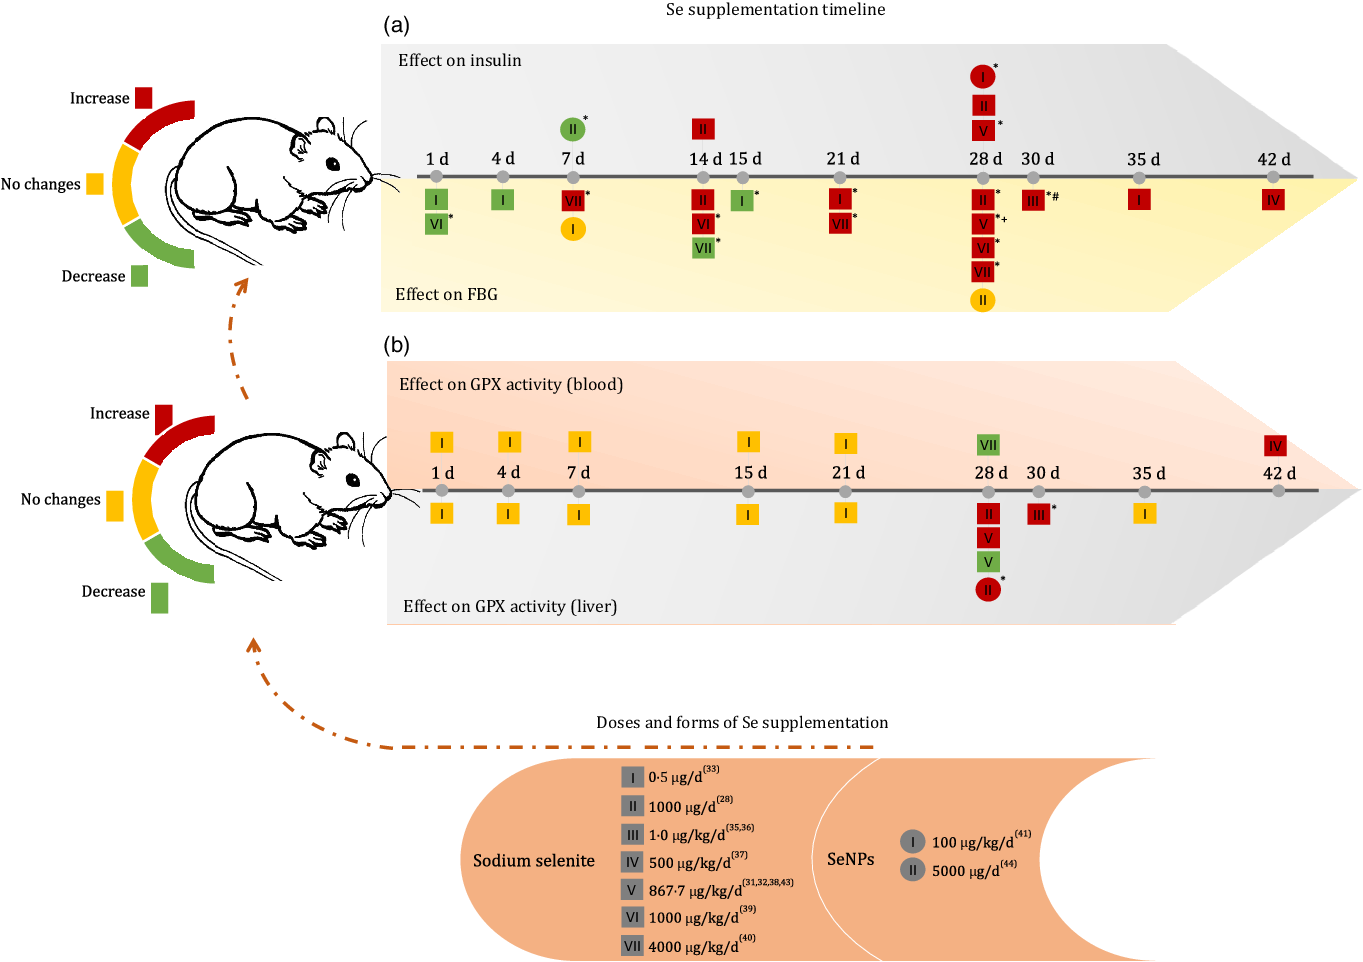
When analysing the first 15 d of the supplementation timeline, it was observed that a dose of 1000 μg/kg/d reduced blood glucose after the first day of supplementation and increased blood glucose levels after 14 d of administration(Reference Baş and Kalender38). At doses of 4000 μg/kg/d, sodium selenite showed a reverse effect, as blood glucose was increased after 7 d and reduced after 14 d of supplementation(Reference Sheng, Huang and Xu39). However, at the lower dose of 0·5 μg/d, the FBG level remained reduced after 1 d, 4 d and significantly after 15 d of supplementation(Reference Mukherjee, Anbazhagan and Roy33).
After 21 d of intervention, sodium selenite supplementation caused an increase in FBG levels, regardless of the dose administered(Reference Zou, Qiu and Chen28,Reference Ayaz, Ozdemir and Ugur29,Reference Can, Ulusu and Kilinç31,Reference Ulusu and Turan32,Reference Ayaz, Celik and Aydin37–Reference Sheng, Huang and Xu39) . In both treatments with SeNP, no change in glucose level was observed, regardless of the dose and treatment time(Reference Al-Quraishy, Dkhil and Abdel Moneim40,Reference El-Borady, Othman and Atallah42) .
The insulin level increased after 14 d of supplementation at doses of 864·7 μg/kg/d(Reference Ayaz, Ozdemir and Ugur29) and 1000 μg/d(Reference Zou, Qiu and Chen28) of sodium selenite and 100 μg/kg/d of SeNP(Reference Al-Quraishy, Dkhil and Abdel Moneim40). In contrast, supplementation with 5000 μg/d of SeNP significantly reduced insulin levels after 7 d of administration(Reference El-Borady, Othman and Atallah42).
Pillai et al. (2012)(Reference Pillai, Sugathan and Indira35) and Dhanya et al. (2014)(Reference Dhanya, Swathy and Indira36) also observed the effect of sodium selenite supplementation on glycated Hb (%), demonstrating that 1 μg/kg/d for 30 d could not induce significant changes in this marker.
Effect of selenium supplementation on selenium biomarkers
GPX activity in the blood and liver was the most commonly used biomarker in the included studies (Fig. 2(b)). Regardless of the time of supplementation, a dose of 0·5 μg/d of sodium selenite was unable to change GPX activity in the blood and liver(Reference Mukherjee, Anbazhagan and Roy33). Doses of 1 and 500 μg/kg/d sodium selenite for 30 d and 42 d, respectively, increased GPX activity in the liver and blood(Reference Kiełczykowska, Kocot and Kurzepa34,Reference Pillai, Sugathan and Indira35) . However, supplementation with higher doses of sodium selenite (864·7 μg/kg/d) for 28 d showed controversial results for this biomarker in the liver(Reference Can, Ulusu and Kilinç31,Reference Ayaz, Celik and Aydin37) . Dose II (1000 μg/d) of sodium selenite during 28 d increased GPX activity in the liver and dose VII (4000 μg/kg/d) reduced GPX activity in the blood(Reference Baş and Kalender38,Reference Sheng, Huang and Xu39) . Similar effects were observed with treatment using 100 μg/kg/d of SeNP(Reference Al-Quraishy, Dkhil and Abdel Moneim40). Additionally, Bas and Kalender (2016)(Reference Baş and Kalender38) observed increased GPX activity in the kidney after the administration of 1000 μg/kg/d of Se supplement for 28 d, and Dhanya et al. (2014)(Reference Dhanya, Swathy and Indira36) reported an increase in GPX activity in the heart after administration of 1 μg/kg/d Se supplement for 30 d.
Some included studies also measured plasma Se concentration, showing an increase after 28 d of supplementation with a dose of 864·7 μg/kg/d of sodium selenite(Reference Ayaz, Celik and Aydin37) and 4000 μg/kg/d for 7 and 28 d(Reference Sheng, Huang and Xu39). A steady increase in total blood Se level was observed at low doses (0·5, 1, 4, 15, 21 and 35 d of treatment)(Reference Mukherjee, Anbazhagan and Roy33).
The Se concentration in tissues was analysed by Ulusu and Turan (2005)(Reference Ulusu and Turan32) and Sheng et al. (2004)(Reference Sheng, Huang and Xu39), both of which applied 28 d of supplementation. The first study (864·7 μg/kg/d) observed an increase in Se concentration in the heart, and the second (4000 μg/kg/d) found a similar effect in the spleen and brain, but observed decreased Se levels in the liver and kidneys.
Animals treated with SeNP alone had increased Se concentrations in the liver, kidney and intestine and increased GPX activity (kidney) after treatment with 100 μg/kg/d of Se supplements for 28 d(Reference Al-Quraishy, Dkhil and Abdel Moneim40). After 7 d of administering 5000 μg/d of Se supplement, GPX (erythrocyte) activity increased significantly(Reference El-Borady, Othman and Atallah42).
Assessment of risk of bias
The SYRCLE(Reference Hooijmans, Rovers and de Vries24) tool does not recommend assigning weights to each isolated study as a score. A summary of the results is presented in Supplementary Fig. S1. The results of the risk of bias analysis of the studies are shown in Fig. 3. For selection biases (D1, D2 and D3), most studies used random allocation methods for animals (D1 = 92·3 %). Further, more than half of the studies did not report details regarding blinding of evaluators (D3 = 61·5 %), indicating a high risk and uncertain risk of bias. In addition, all studies presented information on the basal characteristics and pairing of animals in specific groups (D2 = 100 %).
Risk of bias among included studies according to the reviewers’ judgement and using the SYRCLE(Reference Hooijmans, Rovers and de Vries24) tool.

Regarding performance biases (D4 and D5), less than half of the studies indicated a random allocation of animals during the experiment (D4 = 46·2 %), and all omitted information regarding the blinding of evaluators during the treatment of the groups (D5 = 100 %). For detection bias, none of the studies reported whether there was a random selection of animals (D6 = 100 %) or whether evaluators were blinded (D7 = 100 %). The studies did not adequately address the incomplete outcome data (D8 = 100 %), indicating a risk of friction bias. However, 100 % of the included studies were free from biased results and did not have potential sources of bias (D9 and D10).
Quality assessment
According to the CAMARADES(Reference Macleod, O’Collins and Howells25) evaluation, most studies(Reference Zou, Qiu and Chen28,Reference Ayaz, Ozdemir and Ugur29,Reference Can, Ulusu and Kilinç31–Reference Mukherjee, Anbazhagan and Roy33,Reference Pillai, Sugathan and Indira35–Reference Sheng, Huang and Xu39) had low methodological quality, with scores ranging from 2·5 to 5·0 points. In spite of this, 92·3 % of the studies were published in peer-reviewed journals, 100 % used appropriate animal models (healthy/without associated diseases), 61·5 % reported data on temperature control and 53·8 % randomly allocated groups.
Although none of the studies reported a blind evaluation of the results or demonstrated sample size calculations, three studies(Reference Kiełczykowska, Kocot and Kurzepa34,Reference Al-Quraishy, Dkhil and Abdel Moneim40,Reference El-Borady, Othman and Atallah42) (23 %) were classified as high quality, reaching a score of 7·0 points. In addition, more than half of the studies did not report allocation concealment (76·9 %) or potential conflicts of interest (76·9 %), and 61·5 % did not describe animal welfare regulations (Table 1). A summary of the results is provided in Supplementary Table S3.
Results of the meta-analysis
Statistical analyses were not performed in four studies(Reference Ulusu and Turan32,Reference Sheng, Huang and Xu39,Reference Al-Quraishy, Dkhil and Abdel Moneim40,Reference El-Borady, Othman and Atallah42) , as these studies showed their results in figures, making it impossible to accurately extract the numerical data. The authors were contacted via email to ensure complete data recovery. However, these attempts were unsuccessful. All nine studies included in the meta-analysis used only sodium selenite. The Hb1Ac data were not meta-analysed, as all experiments were below the average Hb1Ac shelf life of approximately 120 d(43).
In the subgroup analysis performed according to the duration of the intervention, sodium selenite supplementation increased FBG in healthy rodents into bands of 1–4, 14–15, 21–28 and 30–42 d. Sodium selenite supplementation increased FBG in healthy rodents, according to the pooled estimate (SMD = 2·57 (95 % CI (1·07, 4·07)), I² = 93·5 % (P = 0·001)). The effect size was larger for interventions lasting between 21 and 28 d (SMD = 5·74 (95 % CI (2·29, 9·18)), I² = 96·1 % (P = 0·001)) (Fig. 4).
Forest plot of subgroup analysis according to the duration time of the Se intervention on fasting blood glucose (FBG). Random effect model and standardised mean distribution (SMD); 95 % CI.

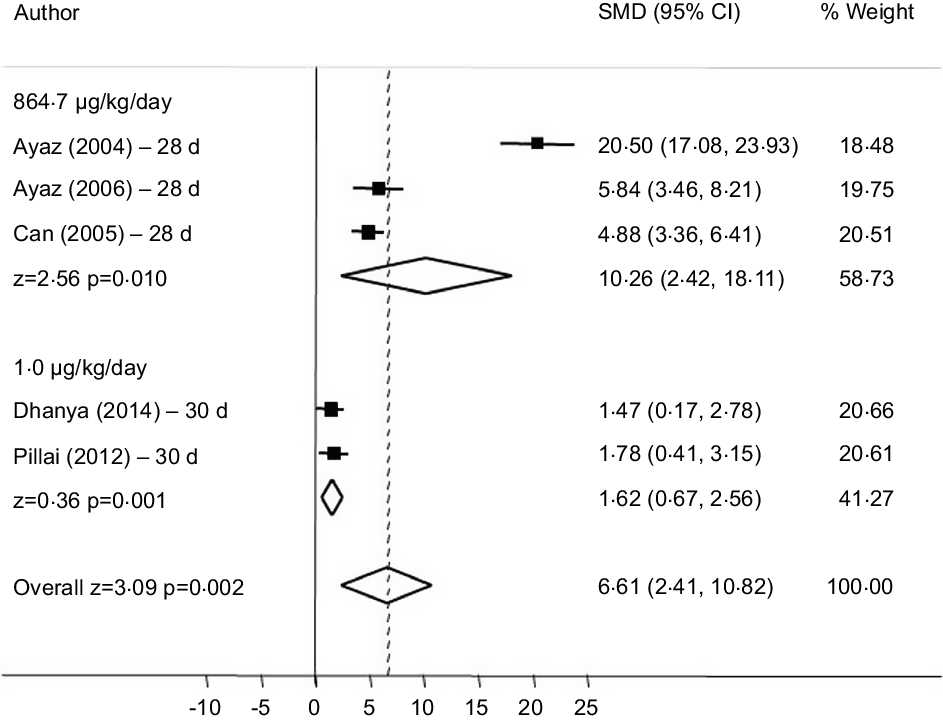
In the subgroup analysis that combined doses of sodium selenite corresponding to 1 g μg/kg and 864·7 μg/kg/d we observed increased FBG. A dose of 864·7 μg/kg/d of sodium selenite (28 d) had the greatest effect (SMD = 10·26 (95 % CI (2·42, 18·11)), I² = 97·1 % (P = 0·010)) (Fig. 5). Four studies were excluded because of dose discrepancies.
Forest plot of subgroup analysis according to different doses of sodium selenite on fasting fasting blood glucose (FBG). Random effect model and standardised mean distribution (SMD); 95 % CI.
Regarding the influence of the intervention with sodium selenite and Se biomarkers, only GPX activity in the liver had sufficient data to be grouped. The meta-analysis indicated that the intervention had a low effect on the increase in this enzyme, (SMD = 0·60 (95 % CI (-0·71, 1·91)), I² = 83·2 % (P = 0·37)) (Fig. 6). All analyses described above showed high data heterogeneity.
Forest plot of subgroup analysis according to the duration time of the Se intervention on glutathione peroxidase (GPX) activity in the liver. Random effect model and standardised mean distribution (SMD), 95 % CI.

Discussion
To the best of our knowledge, this systematic review and meta-analysis provides the first quantitative estimates of the effects of Se supplementation on FBG levels in experimental studies. Cumulative evidence suggests that the administration of sodium selenite in healthy rodents can increase FBG levels, and that the effect size increases when the duration of the intervention is between 21 and 28 d and when the administered dose is 864·7 μg/kg/d. However, the methodological quality of the studies was low, and there was a high risk of bias owing to the high heterogeneity between the studies.
Considering these results, it is possible to observe that the adverse effects of Se supplementation on FBG in healthy rodents depend on the trinomial, form of Se supplementation, dose of Se administered and duration of the intervention.
According to Constantinescu-Aruxandei et al. (Reference Constantinescu-Aruxandei, Frîncu and Capră44), SeNP show a lower risk of toxicity owing to greater bioavailability and slow and controlled release, unlike sodium selenite or selenate salts(Reference Kumar and Prasad45). However, inorganic forms have been the first choice for Se supplementation, considering their availability and price(Reference Zeng, Zhang and Fan46).
In this sense, it was expected to obtain only negative results with sodium selenite supplementation; however, observing the timeline (Fig. 2) revealed that experiments lasting 1–4 d are capable of reducing blood glucose, regardless of the dose. This is supported by the subgroup analysis (SMD = -1·16 (95 % CI (-1·98, −0·34)), I² = 0·0 % (P = 0·005)) (Fig. 4). Interventions from 21 d onwards clearly indicated the adverse effects of Se on glucose homoeostasis, as all studies, regardless of the dose of administration, had increased FBG levels. Evidence of the direct influence of administration time on the interpretation of the effects of sodium selenite supplementation.
Considering other forms of supplementation, El-Borady et al. (Reference El-Borady, Othman and Atallah42) demonstrated that supranutritional doses of SeNP administered for only 7 d significantly reduced plasma insulin concentrations. This suggests that healthy rats treated with SeNP do not secrete insulin because of the mimetic properties of Se(Reference Wang, Lin and Gao47). After 28 d of treatment with high concentrations of SeNP, Al-Quraishy et al. (Reference Al-Quraishy, Dkhil and Abdel Moneim40) observed an increase in serum insulin concentrations. It was suggested that SeNP would probably act as a mimic for the short term and would impact insulin production and secretion in the medium term. Thus, it is suggested that these adverse effects also depend on the form of Se administered.
This imbalance in glucose homoeostasis might be related to GPX expression. Previous studies have demonstrated the diabetogenic effect of high doses of Se due to decreased insulin sensitivity caused by GPX overexpression(Reference Zhou and Huang11,Reference Rayman and Stranges48) . The existence of a ‘redox paradox’ in insulin signalling may explain the adverse effects of Se on glucose homoeostasis. This theory argues that the action of insulin is facilitated by reactive oxygen species, specifically hydrogen peroxide (H2O2), which reversibly inhibits protein tyrosine phosphatase 1b when stimulated by insulin and increases its early action cascade(Reference Mahadev, Zilbering and Zhu49–Reference Brigelius-Flohé and Flohé51).
This indicates that normal or minimal intracellular H2O2 concentrations are required to sensitise cells to insulin signalling. In turn, overexpression of GPx in the hepatic insulin receptor may accelerate the reduction of intracellular H2O2 after insulin stimulation, resulting in reduced inhibition of tyrosine phosphatase activity and subsequent attenuation of insulin receptor phosphorylation(Reference McClung, Roneker and Mu52).
A significant increase in liver GPX activity was observed in healthy rodents 30 d after supplementation with 1 μg/kg/d of sodium selenite(Reference Pillai, Sugathan and Indira35) and after 28 d of administering 5000 μg/d of SeNP(Reference Al-Quraishy, Dkhil and Abdel Moneim40). However, other studies with doses of 864·7 μg/kg/d, 0·5 μg/d and 1000 μg/d of sodium selenite did not demonstrate a significant increase in GPX activity. Moreover, the data cumulative results of this meta-analysis showed a low effect of sodium selenite supplementation on GPX activity in the liver (Fig. 6), indicating that the dose of Se may also interfere with the activity of this selenoprotein. In addition, the small sample size and low quality of the included studies may have contributed to this observation.
Pillai et al. (Reference Pillai, Sugathan and Indira35) demonstrated that Sprague–Dawley rats did not survive after supplementation with 8 and 50 μg/kg/d sodium selenite, suggesting that doses greater than 4 μg/kg/d could be harmful. Furthermore, it was observed by Sheng et al.(Reference Sheng, Huang and Xu39) that after 28 d of supplementation with a high dose of 4000 μg/kg/d of sodium selenite, there was an increase in FBG and in the concentration of Se in the plasma, but it did not significantly interfere with GPX activity in the liver.
This relationship is due to the fact that the biosynthesis of hepatic selenoproteins or the activity of the main selenoenzymes do not increase with supranutritional doses, the ingestion of these doses can generate reactive Se metabolites that interfere with signalling or metabolic pathways(Reference Steinbrenner, Duntas and Rayman53). This suggests another hypothesis that justifies changes in blood glucose levels, in addition to GPX overexpression.
Therefore, the results of this review should be interpreted with caution. Failures in methodological quality, random allocation of animals, blinding of evaluators and high risk of bias are frequently observed in studies using animal models, resulting in low internal validity(Reference Kilkenny, Parsons and Kadyszewski54,Reference Henderson, Kimmelman and Fergusson55) . Although the studies generally presented the same intervention form without differing animal characteristics, none described the method used to calculate the sample size. Adequate sample size calculation is essential to detect the intervention of the true effect, which may have affected the high heterogeneity observed and, therefore, the validity of the cumulative evidence(Reference Kumar and Prasad45).
Other limitations include the fact that the studies did not have other Se biomarkers, such as SELENO P, methionine-R-sulfoxide reductase 1 (MSRB1) and selenoprotein S (SELENO S), which are responsive to the overexpression of GPX1(Reference Labunskyy, Lee and Handy10,Reference Saito14) . In addition, none of the studies included in this review presented the total amount of Se consumed throughout the experiment, as all rodents were fed a standard diet ad libitum. The studies also did not report which resolution was used, AIN-73 or AIN-93, which is another major bias, as AIN-73 recommends sodium selenite and AIN-93 sodium selenate(Reference Reeves, Nielsen and Fahey41).
Given the current context of immunity and prevention of chronic diseases, the search for dietary supplements containing Se is concerning because of reports of toxicity caused by excessive administration(Reference Aldosary, Sutter and Schwartz18–Reference Ashar20). Thus, new experimental studies with good methodological quality, standardised doses, less toxic forms of Se and more sensitive Se biomarkers for individual calibration are required.
In conclusion, supplementation with sodium selenite in healthy animal models significantly increased FBG levels compared with those in non-supplemented rodents, and this effect was responsive to time and doses of Se supplementation.
Acknowledgements
Coordination for the Improvement of Higher Education Personnel (CAPES, Brazil), Finance Code 001.
L. F. C. P, R. L. U. F. and R. N. C. designed the research; R. L. U. F. and A. W. F. S. conducted the systematic literature search and performed the quality assessment and data extraction; A. A. R., A. W. F. S. and R. N. C. analysed the data; A. G. O. performed the statistical analysis and R. L. U., L. F. C. P. and R. N. C. wrote the paper. L. F. C. P. was primarily responsible for the final content. All authors contributed to the writing and reviewing of the manuscript and approved the final manuscript.
The authors declare that there are no conflicts of interest.
Supplementary material
For supplementary material/s referred to in this article, please visit https://doi.org/10.1017/S0007114522003506


