





1. Introduction
Strong gust encounters present a substantial challenge in aviation because of their time-variant, transient dynamics with strong nonlinearity. Such gust encounters exert large unsteady aerodynamic loads on wings, negatively impacting flight stability and aircraft structures (Fuller Reference Fuller1995; Wu, Cao & Ismail Reference Wu, Cao and Ismail2019; Jones, Cetiner & Smith Reference Jones, Cetiner and Smith2022). Especially for small-scale air vehicles, such as drones, the relative scale of gust disturbances can be disproportionally large, a consequence of the small size and low cruise velocity associated with these vehicles (Mueller & DeLaurier Reference Mueller and DeLaurier2003; Jones et al. Reference Jones, Cetiner and Smith2022). For instance, during low-speed manoeuvre operations of small-scale aircraft, such as takeoff or landing in confined urban environments, the relative strength of gusts can be significantly high. Typically, when the gust ratio $G$
– the ratio between characteristic gust velocity and cruise velocity – exceeds 1, the aerodynamic environment is considered unflyable. When
$G$
– the ratio between characteristic gust velocity and cruise velocity – exceeds 1, the aerodynamic environment is considered unflyable. When $G\gt 1$
, the dynamics of the flow is referred to as extreme aerodynamics (Fukami & Taira Reference Fukami and Taira2023; Lopez-Doriga, Jones & Taira Reference Lopez-Doriga, Jones and Taira2026; Taira Reference Taira2026). To enable the use of small-scale aircraft for transportation, agriculture and search-and-rescue (Cai, Dias & Seneviratne Reference Cai, Dias and Seneviratne2014; Hassanalian & Abdelkefi Reference Hassanalian and Abdelkefi2017; Ahirwar et al. Reference Ahirwar, Swarnkar, Bhukya and Namwade2019; Mishra et al. Reference Mishra, Garg, Narang and Mishra2020) during adverse weather, it is crucial to advance our understanding of extreme aerodynamics.
$G\gt 1$
, the dynamics of the flow is referred to as extreme aerodynamics (Fukami & Taira Reference Fukami and Taira2023; Lopez-Doriga, Jones & Taira Reference Lopez-Doriga, Jones and Taira2026; Taira Reference Taira2026). To enable the use of small-scale aircraft for transportation, agriculture and search-and-rescue (Cai, Dias & Seneviratne Reference Cai, Dias and Seneviratne2014; Hassanalian & Abdelkefi Reference Hassanalian and Abdelkefi2017; Ahirwar et al. Reference Ahirwar, Swarnkar, Bhukya and Namwade2019; Mishra et al. Reference Mishra, Garg, Narang and Mishra2020) during adverse weather, it is crucial to advance our understanding of extreme aerodynamics.
To address this issue, past literature studying unsteady aerodynamics associated with gust–wing interactions provides valuable insights. Early efforts examined the aerodynamics of gust–wing interaction using linear thin aerofoil theory (Press & Mazelsky Reference Press and Mazelsky1954; Horlock Reference Horlock1968; Goldstein & Atassi Reference Goldstein and Atassi1976). They treated gusts as weak perturbations, assuming attached flows. For instance, Atassi (Reference Atassi1984) derived lift formulas for a thin aerofoil with small camber at a low angle of attack subjected to a vertical gust, incorporating the effect of the distortion of the gust structure. Their theoretical analysis was later shown to be in good agreement with experimental results (Cordes et al. Reference Cordes, Kampers, Meißner, Tropea, Peinke and Hölling2017).
More recent studies have explored gust ratios in the range of $0 \lt G\lesssim 1$
, where massive flow separation occurs around wings. These studies analysed vortex interactions and aerodynamic force responses for various types of gust encounters (Jones & Cetiner Reference Jones and Cetiner2021), including transverse gusts (Wang et al. Reference Wang, Feng, Cao and Wang2024), streamwise gusts (Ma et al. Reference Ma, Yang, Li and Li2021) and vortex gusts (Martínez-Muriel & Flores Reference Martínez-Muriel and Flores2020). For instance, Peng & Gregory (Reference Peng and Gregory2017) experimentally examined load distributions on a two-dimensional (2-D) wing during vortex gust encounters in the context of blade–vortex interactions. Furthermore, Herrmann et al. (Reference Herrmann, Brunton, Pohl and Semaan2022) designed a closed-loop controller using an actuated trailing-edge flap on an aerofoil to attenuate lift fluctuation during vortical gust encounters. Building upon this body of work, extreme vortex-gust–wing interactions with
$0 \lt G\lesssim 1$
, where massive flow separation occurs around wings. These studies analysed vortex interactions and aerodynamic force responses for various types of gust encounters (Jones & Cetiner Reference Jones and Cetiner2021), including transverse gusts (Wang et al. Reference Wang, Feng, Cao and Wang2024), streamwise gusts (Ma et al. Reference Ma, Yang, Li and Li2021) and vortex gusts (Martínez-Muriel & Flores Reference Martínez-Muriel and Flores2020). For instance, Peng & Gregory (Reference Peng and Gregory2017) experimentally examined load distributions on a two-dimensional (2-D) wing during vortex gust encounters in the context of blade–vortex interactions. Furthermore, Herrmann et al. (Reference Herrmann, Brunton, Pohl and Semaan2022) designed a closed-loop controller using an actuated trailing-edge flap on an aerofoil to attenuate lift fluctuation during vortical gust encounters. Building upon this body of work, extreme vortex-gust–wing interactions with $G\gtrsim 1$
were recently investigated at a Reynolds number of 100 by Fukami & Taira (Reference Fukami and Taira2023) and Fukami, Nakao & Taira (Reference Fukami, Nakao and Taira2024). They observed massive flow separation with high levels of transient lift change and developed a lift-attenuation strategy based on a low-order manifold around which the extreme dynamics evolves.
$G\gtrsim 1$
were recently investigated at a Reynolds number of 100 by Fukami & Taira (Reference Fukami and Taira2023) and Fukami, Nakao & Taira (Reference Fukami, Nakao and Taira2024). They observed massive flow separation with high levels of transient lift change and developed a lift-attenuation strategy based on a low-order manifold around which the extreme dynamics evolves.
While the previously mentioned studies mainly focus on 2-D or spanwise periodic wings in the absence of tip vortices (TiVs), there exists some work that examined gust encounters by a finite wing. Barnes & Visbal (Reference Barnes and Visbal2018a
,Reference Barnes and Visbal
b
) investigated the evolution of boundary layers and the force load on a finite wing during vortex-gust encounters. Control strategies, such as passive twist wingtips, for force load attenuation on a finite wing during vertical gust encounters were also proposed by Guo, Espinosa De Los Monteros & Liu (Reference Guo, Espinosa De Los Monteros and Liu2015) and He et al. (Reference He, Guo, Liu and Luo2021). However, their work is primarily centred around $G\lesssim 1$
at a low angle of attack. Therefore, building a foundational understanding of gust–finite-wing interactions in a regime of
$G\lesssim 1$
at a low angle of attack. Therefore, building a foundational understanding of gust–finite-wing interactions in a regime of $G\gtrsim 1$
is critical to further advancing the field of extreme aerodynamics.
$G\gtrsim 1$
is critical to further advancing the field of extreme aerodynamics.
This study aims to elucidate the aerodynamics of extreme finite-wing–vortex-gust interactions at a Reynolds number of $600$
. The Reynolds number is sufficiently high to trigger massive flow separation, yet still low enough to preserve a laminar flow. Note that the core vortical structures observed in massively separated flows maintain topological similarities between low- and high-Reynolds-number regimes (Hunt et al. Reference Hunt, Abell, Peterka and Woo1978; Dallmann Reference Dallmann1988; Délery Reference Délery2001), while the varying scales of vortical structures present at high Reynolds numbers significantly complicate flow analysis, especially without an understanding of large-scale vortex behaviour. Furthermore, for extreme aerodynamics, there is a disparity between the advective time scale and the viscous time scale, with the former being considerably smaller than the latter (Taira Reference Taira2026). As such, the vortex core dynamics is similar across a range of Reynolds numbers. Large-scale vortical similarities between laminar and turbulent extreme aerodynamics are also discussed in a recent study (Odaka, Lopez-Doriga & Taira Reference Odaka, Lopez-Doriga and Taira2026). By exploring the large-scale vortical dynamics in the absence of turbulence, this work aims to establish a foundation for understanding extreme gust encounters by finite wings, setting a stepping stone for future investigations at higher Reynolds numbers.
$600$
. The Reynolds number is sufficiently high to trigger massive flow separation, yet still low enough to preserve a laminar flow. Note that the core vortical structures observed in massively separated flows maintain topological similarities between low- and high-Reynolds-number regimes (Hunt et al. Reference Hunt, Abell, Peterka and Woo1978; Dallmann Reference Dallmann1988; Délery Reference Délery2001), while the varying scales of vortical structures present at high Reynolds numbers significantly complicate flow analysis, especially without an understanding of large-scale vortex behaviour. Furthermore, for extreme aerodynamics, there is a disparity between the advective time scale and the viscous time scale, with the former being considerably smaller than the latter (Taira Reference Taira2026). As such, the vortex core dynamics is similar across a range of Reynolds numbers. Large-scale vortical similarities between laminar and turbulent extreme aerodynamics are also discussed in a recent study (Odaka, Lopez-Doriga & Taira Reference Odaka, Lopez-Doriga and Taira2026). By exploring the large-scale vortical dynamics in the absence of turbulence, this work aims to establish a foundation for understanding extreme gust encounters by finite wings, setting a stepping stone for future investigations at higher Reynolds numbers.
In the present study, we perform direct numerical simulations of extreme vortex gust encounters by a square wing and analyse the complex interplay between flow structures, including a gust vortex, wing-surface separation and TiVs. Moreover, we identify vortical structures that serve prominent roles in aerodynamics. The rest of the paper is structured as follows. The computational set-up for an extreme vortex-gust encounter by a square wing is described in § 2. We present the vortex dynamics of the encounters and identify primary vortical structures responsible for the high lift changes in § 3. We also discuss the attenuation of lift variations due to TiV dynamics and wing positions against an impacting gust vortex, providing insights into mitigation strategies of the transient lift fluctuations. Concluding remarks are offered in § 4.
2. Problem set-up
We analyse flows around a NACA0015 finite wing impacted by a vortex gust, as presented in figure 1 $(a)$
. The vortex gust is modelled as a spanwise-oriented vortex column with the circumferential velocity profile of a Taylor vortex (Taylor Reference Taylor1918):
$(a)$
. The vortex gust is modelled as a spanwise-oriented vortex column with the circumferential velocity profile of a Taylor vortex (Taylor Reference Taylor1918):
 \begin{equation} u_{\theta }=u_{\theta , \textit{max}} \frac {r}{R} \exp \left [ \frac {1}{2} \left ( 1- \frac {r^2}{R^2} \right ) \right ]\!, \end{equation}
where $u_{\theta , \textit{max}}$
is the maximum rotational velocity at radius
$u_{\theta , \textit{max}}$
is the maximum rotational velocity at radius $r=R$
. This vortex gust is characterised by the gust ratio
$r=R$
. This vortex gust is characterised by the gust ratio
 \begin{equation} G \equiv u_{\theta ,\textit{max}}/u_{\infty }, \end{equation}
where $u_{\infty }$
is the free-stream velocity. The circumferential velocity profile and the spanwise vorticity distribution are provided in figure 1
$u_{\infty }$
is the free-stream velocity. The circumferential velocity profile and the spanwise vorticity distribution are provided in figure 1 $(b)$
.
$(b)$
. $(a)$
A NACA0015 square wing encountering a gust vortex modelled as a Taylor vortex. The Q-criterion isosurface is shown.
$(a)$
A NACA0015 square wing encountering a gust vortex modelled as a Taylor vortex. The Q-criterion isosurface is shown. $(b)$
Circumferential velocity profile and spanwise vorticity distribution of a Taylor vortex with a positive orientation.
$(b)$
Circumferential velocity profile and spanwise vorticity distribution of a Taylor vortex with a positive orientation. $(c)$
Computational domain and discretisation.
$(c)$
Computational domain and discretisation.

We consider a square wing (semi-aspect ratio $\textit{sAR}=0.5$
) with a straight-cut wingtip at an angle of attack of
$\textit{sAR}=0.5$
) with a straight-cut wingtip at an angle of attack of $\alpha =14^\circ$
and a chord-based Reynolds number of
$\alpha =14^\circ$
and a chord-based Reynolds number of $\textit{Re}=u_{\infty }c/\nu =600$
, where
$\textit{Re}=u_{\infty }c/\nu =600$
, where $c$
is the chord length and
$c$
is the chord length and $\nu$
is the kinematic viscosity. The aspect ratio is selected to effectively study tip effects, while the angle of attack is chosen to ensure a leading-edge flow separation is present for the undisturbed flow. We selected the Reynolds number to examine large-scale vortical dynamics in the absence of turbulence. The steady baseline (undisturbed) flow imposes a lift of
$\nu$
is the kinematic viscosity. The aspect ratio is selected to effectively study tip effects, while the angle of attack is chosen to ensure a leading-edge flow separation is present for the undisturbed flow. We selected the Reynolds number to examine large-scale vortical dynamics in the absence of turbulence. The steady baseline (undisturbed) flow imposes a lift of $C_{L,\textit{base}}=0.22$
, where the lift coefficient is defined as
$C_{L,\textit{base}}=0.22$
, where the lift coefficient is defined as $C_L \equiv F_L/({1}/{2}) \rho u_\infty ^2 bc$
. Here,
$C_L \equiv F_L/({1}/{2}) \rho u_\infty ^2 bc$
. Here, $F_L$
is the
$F_L$
is the $y$
component of the force load on the wing,
$y$
component of the force load on the wing, $\rho$
is density and
$\rho$
is density and $b$
is the half-span length.
$b$
is the half-span length.
We perform direct numerical simulations with the compressible flow solver CharLES (Brès et al. Reference Brès, Ham, Nichols and Lele2017), a finite-volume solver with second-order and third-order accuracy in space and time, respectively. The Mach number $u_\infty /a_\infty =0.1$
is used to minimise compressible flow effects. The computational domain is shown in figure 1
$u_\infty /a_\infty =0.1$
is used to minimise compressible flow effects. The computational domain is shown in figure 1 $(c)$
, where we respectively define
$(c)$
, where we respectively define $x$
,
$x$
, $y$
and
$y$
and $z$
as the streamwise, vertical and spanwise coordinates with the leading edge of the wing root at the origin
$z$
as the streamwise, vertical and spanwise coordinates with the leading edge of the wing root at the origin $(0,0,0)$
. We impose a Dirichlet boundary condition of
$(0,0,0)$
. We impose a Dirichlet boundary condition of $u_\infty /a_\infty =0.1$
at the inlet and farfield boundaries, an adiabatic wall boundary condition at the wing surface and a sponge boundary condition at the outlet boundary. Along the
$u_\infty /a_\infty =0.1$
at the inlet and farfield boundaries, an adiabatic wall boundary condition at the wing surface and a sponge boundary condition at the outlet boundary. Along the $z/c=0$
plane (wing root), we prescribe a symmetry boundary condition. The time step is selected such that the local Courant number is less than 1 throughout the entire computational domain. The present simulation is verified through a grid convergence study and validated with the lift coefficient for similar
$z/c=0$
plane (wing root), we prescribe a symmetry boundary condition. The time step is selected such that the local Courant number is less than 1 throughout the entire computational domain. The present simulation is verified through a grid convergence study and validated with the lift coefficient for similar $\textit{sAR}=0.5$
and
$\textit{sAR}=0.5$
and $\textit{sAR}=2$
wings reported in Zhang et al. (Reference Zhang, Hayostek, Amitay, Burtsev, Theofilis and Taira2020) and Ribeiro et al. (Reference Ribeiro, Neal, Burtsev, Amitay, Theofilis and Taira2023), as detailed in Appendix B.
$\textit{sAR}=2$
wings reported in Zhang et al. (Reference Zhang, Hayostek, Amitay, Burtsev, Theofilis and Taira2020) and Ribeiro et al. (Reference Ribeiro, Neal, Burtsev, Amitay, Theofilis and Taira2023), as detailed in Appendix B.
We select four values of gust ratios $G= \{-1.2,-3,1.2,3 \}$
with a fixed gust radius of
$G= \{-1.2,-3,1.2,3 \}$
with a fixed gust radius of $R/c=0.25$
. We introduce the gust vortex at a fixed streamwise location of
$R/c=0.25$
. We introduce the gust vortex at a fixed streamwise location of $x_0/c=-3$
and varied vertical positions of
$x_0/c=-3$
and varied vertical positions of $y_0/c=\{-0.25,0,0.25\}$
in the fully converged undisturbed flow and allow it to convect with the free stream. We define a reference time
$y_0/c=\{-0.25,0,0.25\}$
in the fully converged undisturbed flow and allow it to convect with the free stream. We define a reference time $\tau =u_\infty t / c$
, such that
$\tau =u_\infty t / c$
, such that $\tau =0$
corresponds to the time at which the centre of the vortex column would reach the leading edge if there were no diffusion or interaction between the gust and any other flow structures. For comparison, we also simulate extreme vortex gust encounters with a NACA0015 2-D wing over a strictly 2-D domain, where we use the same free-stream and vortex conditions as in the square-wing case.
$\tau =0$
corresponds to the time at which the centre of the vortex column would reach the leading edge if there were no diffusion or interaction between the gust and any other flow structures. For comparison, we also simulate extreme vortex gust encounters with a NACA0015 2-D wing over a strictly 2-D domain, where we use the same free-stream and vortex conditions as in the square-wing case.
3. Results
Let us begin by examining the lift response experienced by the wings encountering an extreme gust vortex initially introduced at $(x_0/c,y_0/c)=(-3,0)$
. The time traces of lift coefficients for
$(x_0/c,y_0/c)=(-3,0)$
. The time traces of lift coefficients for $G= \{-1.2,-3,1.2,3 \}$
are shown in figure 2, where dashed and solid lines represent the 2-D and square wings, respectively. The baseline flow around the 2-D wing is unsteady with
$G= \{-1.2,-3,1.2,3 \}$
are shown in figure 2, where dashed and solid lines represent the 2-D and square wings, respectively. The baseline flow around the 2-D wing is unsteady with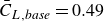 $\bar {C}_{L,\textit{base}}=0.49$
, while the baseline flow around the square wing is steady with
$\bar {C}_{L,\textit{base}}=0.49$
, while the baseline flow around the square wing is steady with $C_{L,\textit{base}}=0.22$
. Note that the unsteady unperturbed flow for the 2-D wing can capture the unsteady flow physics even from the start of the gust encounter. Although the baseline flow for the 2-D wing exhibits unsteady wake, we confirm that the timing of the gust encounter with respect to the oscillation in the baseline lift causes no significant difference in the transient lift during the extreme encounters, similar to a recent study with an infinite-span wing (Fukami, Smith & Taira Reference Fukami, Smith and Taira2025). This is because the large lift fluctuation due to the extreme encounters is much more significant than the lift fluctuation of the undisturbed case.
$C_{L,\textit{base}}=0.22$
. Note that the unsteady unperturbed flow for the 2-D wing can capture the unsteady flow physics even from the start of the gust encounter. Although the baseline flow for the 2-D wing exhibits unsteady wake, we confirm that the timing of the gust encounter with respect to the oscillation in the baseline lift causes no significant difference in the transient lift during the extreme encounters, similar to a recent study with an infinite-span wing (Fukami, Smith & Taira Reference Fukami, Smith and Taira2025). This is because the large lift fluctuation due to the extreme encounters is much more significant than the lift fluctuation of the undisturbed case.
In the 2-D case, the maximum lift load in the vortex encounters exceeds five times the baseline value for $G=1.2$
and eleven times for
$G=1.2$
and eleven times for $G=3$
, as shown in figure 2. Compared with the 2-D wing, the square wing experiences notably lower lift spikes. However, despite this reduction, the finite wing still undergoes substantial lift fluctuations. In the following sections, we explain what vortex dynamics are responsible for the large lift changes and what the key three-dimensional dynamics are that cause the reduced lift response compared with the 2-D wing.
$G=3$
, as shown in figure 2. Compared with the 2-D wing, the square wing experiences notably lower lift spikes. However, despite this reduction, the finite wing still undergoes substantial lift fluctuations. In the following sections, we explain what vortex dynamics are responsible for the large lift changes and what the key three-dimensional dynamics are that cause the reduced lift response compared with the 2-D wing.
3.1. Vortex encounters by the 2-D wing
We analyse the flow dynamics during the extreme vortex gust encounters by the 2-D wing with $y_0/c=0$
. The evolutions of spanwise vorticity
$y_0/c=0$
. The evolutions of spanwise vorticity $\omega _z$
are shown in figure 3 at the four temporal instances from
$\omega _z$
are shown in figure 3 at the four temporal instances from $\tau =\tau _1$
to
$\tau =\tau _1$
to $\tau _4$
noted in figure 2. For positive vortex cases (
$\tau _4$
noted in figure 2. For positive vortex cases ( $G=1.2$
and
$G=1.2$
and $3$
in figure 3), the increasing effective angle of attack due to the incoming gust vortex promotes vorticity generation from the leading edge, forming a large leading-edge vortex (LEV) above the wing. Furthermore, the approaching gust vortex increases the wall-normal velocity gradient on the bottom surface of the wing, increasing the vorticity contained within the boundary layer. The attached lower boundary layer with an increased level of vorticity flux on the bottom surface, coupled with a separated upper boundary layer, leads to the formation of a trailing-edge vortex (TEV). Accordingly, the lift peak rises to
$3$
in figure 3), the increasing effective angle of attack due to the incoming gust vortex promotes vorticity generation from the leading edge, forming a large leading-edge vortex (LEV) above the wing. Furthermore, the approaching gust vortex increases the wall-normal velocity gradient on the bottom surface of the wing, increasing the vorticity contained within the boundary layer. The attached lower boundary layer with an increased level of vorticity flux on the bottom surface, coupled with a separated upper boundary layer, leads to the formation of a trailing-edge vortex (TEV). Accordingly, the lift peak rises to $2.47$
and
$2.47$
and $5.49$
for
$5.49$
for $G=1.2$
and
$G=1.2$
and $G=3$
, respectively.
$G=3$
, respectively.
Lift history for the 2-D (dashed line) and square (solid line) wings with $G= \{-1.2,-3,1.2,3 \}$
. Representative temporal instances are indicated with
$G= \{-1.2,-3,1.2,3 \}$
. Representative temporal instances are indicated with $\tau =\tau _1$
,
$\tau =\tau _1$
, $\tau _2$
,
$\tau _2$
, $\tau _3$
and
$\tau _3$
and $\tau _4$
.
$\tau _4$
.

Snapshots of spanwise vorticity $\omega _z$
for the 2-D wing with
$\omega _z$
for the 2-D wing with $G= \{-1.2,-3,1.2,3 \}$
at four temporal instances
$G= \{-1.2,-3,1.2,3 \}$
at four temporal instances $\tau =\tau _1$
to
$\tau =\tau _1$
to $\tau _4$
noted in figure 2. Lift elements
$\tau _4$
noted in figure 2. Lift elements $L_e$
(green and purple contours) with lined contours of
$L_e$
(green and purple contours) with lined contours of $\omega _z$
are inset at the top right of each subplot.
$\omega _z$
are inset at the top right of each subplot.

Focusing our attention on times $\tau =\tau _2$
and
$\tau =\tau _2$
and $\tau _3$
for
$\tau _3$
for $G=1.2$
and
$G=1.2$
and $3$
, the gust vortex is significantly deformed when it impinges upon the leading edge of the wing. The lower part of the gust vortex merges with the boundary layer on the bottom surface of the wing, while the upper part of the gust vortex convects upward and downstream, forming a vortex-pair-like structure including the LEV. By
$3$
, the gust vortex is significantly deformed when it impinges upon the leading edge of the wing. The lower part of the gust vortex merges with the boundary layer on the bottom surface of the wing, while the upper part of the gust vortex convects upward and downstream, forming a vortex-pair-like structure including the LEV. By $\tau =\tau _3$
, the LEV separates from the wing, causing the wing to lose the major lift-generating structures while the negative-lift-contributing structures on the lower surface remain – the lift coefficient peak drops to
$\tau =\tau _3$
, the LEV separates from the wing, causing the wing to lose the major lift-generating structures while the negative-lift-contributing structures on the lower surface remain – the lift coefficient peak drops to $-3.22$
for
$-3.22$
for $G=3$
. By
$G=3$
. By $\tau =\tau _4$
, the leading-edge shear layer gradually starts reforming, restoring the baseline flow state.
$\tau =\tau _4$
, the leading-edge shear layer gradually starts reforming, restoring the baseline flow state.
The evolutions of 2-D, negative vortex cases are similar to those of the positive vortex cases, but with a reversal in the direction of the gust-induced velocity. As shown for $G=-1.2$
at
$G=-1.2$
at $\tau =\tau _1$
in figure 3, vertically downward velocity from the approaching gust vortex delays separation above the wing while vorticity generation is promoted below the wing although it does not grow enough to form an LEV. For
$\tau =\tau _1$
in figure 3, vertically downward velocity from the approaching gust vortex delays separation above the wing while vorticity generation is promoted below the wing although it does not grow enough to form an LEV. For $G=-3$
, the downward velocity by the approaching gust vortex is so strong that an LEV develops beneath the wing, causing the lift coefficient
$G=-3$
, the downward velocity by the approaching gust vortex is so strong that an LEV develops beneath the wing, causing the lift coefficient $C_L$
to drop below
$C_L$
to drop below $-4$
.
$-4$
.
For both $G=-1.2$
and
$G=-1.2$
and $-3$
, the gust vortex merges with the leading-edge shear layer on the upper surface around
$-3$
, the gust vortex merges with the leading-edge shear layer on the upper surface around $\tau =\tau _2$
. Moreover, for
$\tau =\tau _2$
. Moreover, for $G=-3$
, the LEV forming below the wing induces counter-rotating vorticity between itself and the wing, generating another vortical structure, as observed at
$G=-3$
, the LEV forming below the wing induces counter-rotating vorticity between itself and the wing, generating another vortical structure, as observed at $\tau =\tau _2$
in figure 3. This structure grows along with the LEV until it disrupts the vortical sheet feeding the LEV, resembling the dynamics observed around a revolving wing (Garmann & Visbal Reference Garmann and Visbal2014). Afterward, this opposite-signed vortical structure rolls up over the leading edge, eventually forming a secondary LEV on the top side of the wing, as seen at
$\tau =\tau _2$
in figure 3. This structure grows along with the LEV until it disrupts the vortical sheet feeding the LEV, resembling the dynamics observed around a revolving wing (Garmann & Visbal Reference Garmann and Visbal2014). Afterward, this opposite-signed vortical structure rolls up over the leading edge, eventually forming a secondary LEV on the top side of the wing, as seen at $\tau =\tau _3$
and
$\tau =\tau _3$
and $\tau _4$
.
$\tau _4$
.
To quantify the contribution of vortical structures to lift, we use force element analysis (Chang Reference Chang1992; Menon & Mittal Reference Menon and Mittal2021), a method to identify flow structures responsible for load generation on the wing. We derive an auxiliary potential $\phi _y$
under a boundary condition of
$\phi _y$
under a boundary condition of $-\boldsymbol{n}\boldsymbol{\cdot }\boldsymbol{\nabla }\phi _y=\boldsymbol{n}\boldsymbol{\cdot }\boldsymbol{e}_y$
on the wing surface, where
$-\boldsymbol{n}\boldsymbol{\cdot }\boldsymbol{\nabla }\phi _y=\boldsymbol{n}\boldsymbol{\cdot }\boldsymbol{e}_y$
on the wing surface, where $\boldsymbol{e_y}$
is the unit vector in the
$\boldsymbol{e_y}$
is the unit vector in the $y$
direction. By integrating the inner product of the Navier–Stokes equations with
$y$
direction. By integrating the inner product of the Navier–Stokes equations with $\boldsymbol{\nabla }\phi _y$
over the fluid domain, we can express the lift force as
$\boldsymbol{\nabla }\phi _y$
over the fluid domain, we can express the lift force as
 \begin{equation} F_L=\int _V\boldsymbol{\omega }\times \boldsymbol{u}\boldsymbol{\cdot }\boldsymbol{\nabla }\phi _y\, {\rm d}V + \frac {1}{\textit{Re}}\int _S \boldsymbol{\omega }\times \boldsymbol{n}\boldsymbol{\cdot }\left ( \boldsymbol{\nabla }\phi _y+\boldsymbol{e}_y \right )\,{\rm d}S. \end{equation}
The first integrand represents volume lift elements while the second integrand represents surface lift elements. For the current flows at $\textit{Re} = 600$
, the volume lift elements have dominant contributions to lift force compared with the surface elements (Ribeiro et al. Reference Ribeiro, Neal, Burtsev, Amitay, Theofilis and Taira2023). We hereafter refer to the volume lift element as lift element
$\textit{Re} = 600$
, the volume lift elements have dominant contributions to lift force compared with the surface elements (Ribeiro et al. Reference Ribeiro, Neal, Burtsev, Amitay, Theofilis and Taira2023). We hereafter refer to the volume lift element as lift element $L_e$
.
$L_e$
.
The lift element plot is inset at the top right of each subplot in figure 3, where green and purple contours correspond to lift-increasing and lift-decreasing elements, respectively. For the positive vortex cases, the LEV is the prominent contributor to positive lift, while the boundary layer on the lower surface and the gust vortex merged with it primarily yield negative lift. For instance, the lift contribution from the LEV at $\tau =\tau _1$
for
$\tau =\tau _1$
for $G=3$
totals
$G=3$
totals $4.63$
, where the lift elements with
$4.63$
, where the lift elements with $L_e\geqslant 0.015$
inside the vortex are integrated and scaled by
$L_e\geqslant 0.015$
inside the vortex are integrated and scaled by $({1}/{2}) \rho u_\infty ^2 c$
. In contrast, for the negative gust vortex cases, the LEV and shear layer below the wing mainly contribute to negative lift, whereas the gust vortex merged with the shear layer on the top surface and the secondary LEV predominantly generate positive lift; e.g. at
$({1}/{2}) \rho u_\infty ^2 c$
. In contrast, for the negative gust vortex cases, the LEV and shear layer below the wing mainly contribute to negative lift, whereas the gust vortex merged with the shear layer on the top surface and the secondary LEV predominantly generate positive lift; e.g. at $\tau =\tau _1$
for
$\tau =\tau _1$
for $G=-3$
, the LEV below the wing accounts for a total negative-lift contribution of
$G=-3$
, the LEV below the wing accounts for a total negative-lift contribution of $-2.63$
(integration of the lift elements with
$-2.63$
(integration of the lift elements with $L_e\leqslant -0.015$
inside the vortex). In the next subsection, we explore the effects of the wing being finite (in the spanwise direction) on the vortex dynamics and lift fluctuations in extreme vortex gust encounters.
$L_e\leqslant -0.015$
inside the vortex). In the next subsection, we explore the effects of the wing being finite (in the spanwise direction) on the vortex dynamics and lift fluctuations in extreme vortex gust encounters.
Top-port views for the square-wing cases with $G=1.2$
and
$G=1.2$
and $3$
at the four temporal instances noted in figure 2. The Q-criterion isosurface is shown in grey with three representative vortex lines coloured in black, aqua and orange. Spanwise slices of lift elements
$3$
at the four temporal instances noted in figure 2. The Q-criterion isosurface is shown in grey with three representative vortex lines coloured in black, aqua and orange. Spanwise slices of lift elements $L_e$
(colour contours) with
$L_e$
(colour contours) with $\omega _z$
(line contours) along the root
$\omega _z$
(line contours) along the root $z/c=0$
and near the tip
$z/c=0$
and near the tip $z/c=0.48$
are shown on the right of each subplot. Sectional lift distributions at
$z/c=0.48$
are shown on the right of each subplot. Sectional lift distributions at $\tau _0=-0.6$
and
$\tau _0=-0.6$
and $\tau =\tau _1$
to
$\tau =\tau _1$
to $\tau _4$
are presented at the bottom.
$\tau _4$
are presented at the bottom.

3.2. Positive vortex encounters by the square wing
Let us examine the three-dimensional vortex gust encounters by the square wing, focusing on vortical structures responsible for large lift variation and its attenuation compared with the 2-D wing. The temporal evolution of vortical structures for the positive gust vortex cases with $y_0/c=0$
is presented in figure 4, where we visualise a Q-criterion isosurface in grey and three representative vortex lines in black, aqua and orange at each instance. Note that the plotted vortex lines are shown to facilitate describing the details of vortical structures, and lines in the same colour do not necessarily represent the same structures being tracked over time. Each panel also presents spanwise slices of lift element
$y_0/c=0$
is presented in figure 4, where we visualise a Q-criterion isosurface in grey and three representative vortex lines in black, aqua and orange at each instance. Note that the plotted vortex lines are shown to facilitate describing the details of vortical structures, and lines in the same colour do not necessarily represent the same structures being tracked over time. Each panel also presents spanwise slices of lift element $L_e$
(coloured contour) and
$L_e$
(coloured contour) and $\omega _z$
(lined contour) along the root
$\omega _z$
(lined contour) along the root $z/c=0$
and near the wingtip
$z/c=0$
and near the wingtip $z/c=0.48$
on the right.
$z/c=0.48$
on the right.
We first note that the vertical position of the positive gust vortex at impact is lower for the square-wing case than for the 2-D wing case. This is attributed to a lower upward velocity upstream of the leading edge of the wing, induced by the bound circulation around the square wing, compared with the 2-D wing. This comparison of the vertical position of the gust vortex can be seen for both $G=1.2$
and
$G=1.2$
and $3$
cases in gust position relative to
$3$
cases in gust position relative to $y/c=0$
at
$y/c=0$
at $\tau =\tau _1$
in figure 3 and the spanwise slices in figure 4.
$\tau =\tau _1$
in figure 3 and the spanwise slices in figure 4.
Let us discuss the effects of TiVs, some of the primary vortices present in flows around the square wing but absent in the 2-D wing cases. When the gust vortex is approaching the wing, the TiVs grow in size and strength, particularly towards the leading edge. This occurs because the enhanced upward velocity from the incoming gust vortex increases the pressure difference between the upper and lower surfaces of the wing. The strengthened TiVs locally produce enhanced downwash, as indicated in a larger sectional lift drop near the tip at $\tau =\tau _1$
than
$\tau =\tau _1$
than $\tau =\tau _0$
in the last row of figure 4, which displays the time evolution of sectional lift distribution at
$\tau =\tau _0$
in the last row of figure 4, which displays the time evolution of sectional lift distribution at $\tau _0=-0.6$
and
$\tau _0=-0.6$
and $\tau =\tau _1$
to
$\tau =\tau _1$
to $\tau _4$
. An additional discussion on the enhanced downwash is provided in Appendix A. After the gust vortex passes the wing, its vertical velocity around the wing directs downward. This reduces the pressure difference between both sides of the wing, weakening the TiVs. The TiV evolution can be seen in figure 4, where the TiVs strengthen as the gust vortex approaches the wing and weaken after it moves past the wing.
$\tau _4$
. An additional discussion on the enhanced downwash is provided in Appendix A. After the gust vortex passes the wing, its vertical velocity around the wing directs downward. This reduces the pressure difference between both sides of the wing, weakening the TiVs. The TiV evolution can be seen in figure 4, where the TiVs strengthen as the gust vortex approaches the wing and weaken after it moves past the wing.
Next, let us examine how the vortices form and interact with each other around the finite wing. As observed at $\tau _1$
in figure 4, the LEV, TiVs and boundary layer on the wing bottom form a closed loop of a vortex line. By
$\tau _1$
in figure 4, the LEV, TiVs and boundary layer on the wing bottom form a closed loop of a vortex line. By $\tau =\tau _2$
, the LEV around the tips is anchored to the wing corners, transforming into an arch vortex. For
$\tau =\tau _2$
, the LEV around the tips is anchored to the wing corners, transforming into an arch vortex. For $G=1.2$
at
$G=1.2$
at $\tau =\tau _3$
, arch vortices convect above the wing, with their legs connecting to the TiVs (the vortex line in aqua) or the boundary layer on the bottom surface (the vortex line in black). Over time, the arch vortices convect downstream, exhibiting kinks near the tip (
$\tau =\tau _3$
, arch vortices convect above the wing, with their legs connecting to the TiVs (the vortex line in aqua) or the boundary layer on the bottom surface (the vortex line in black). Over time, the arch vortices convect downstream, exhibiting kinks near the tip ( $\tau =\tau _4$
).
$\tau =\tau _4$
).
For $G=3$
at
$G=3$
at $\tau =\tau _2$
, part of the LEV becomes connected with the upper portion of the gust vortex, forming a vortex loop (the vortex line in black). Another part of the LEV forms a loop with the TEV (the vortex line in orange). The aqua-coloured vortex line depicts part of the gust vortex connecting to vortical structures that have opposite-sign spanwise vorticity outside of the gust vortex core. At
$\tau =\tau _2$
, part of the LEV becomes connected with the upper portion of the gust vortex, forming a vortex loop (the vortex line in black). Another part of the LEV forms a loop with the TEV (the vortex line in orange). The aqua-coloured vortex line depicts part of the gust vortex connecting to vortical structures that have opposite-sign spanwise vorticity outside of the gust vortex core. At $\tau =\tau _3$
, the LEV connects to the gust vortex (black), the boundary layer below the wing (aqua) and the TEV (orange). By
$\tau =\tau _3$
, the LEV connects to the gust vortex (black), the boundary layer below the wing (aqua) and the TEV (orange). By $\tau =\tau _4$
, the vortical structure represented by the vortex line in black distorts around the arch vortex.
$\tau =\tau _4$
, the vortical structure represented by the vortex line in black distorts around the arch vortex.
Let us turn our attention to the vortical structures responsible for the large lift change through the lens of lift elements in figure 4. We find similarities with the 2-D wing cases. The LEV remains the primary contributor to positive lift, while the boundary layer on the bottom surface and the gust vortex merged with it play a dominant role in negative lift; e.g. the lift elements of the LEV total 1.91 at $\tau =\tau _1$
, where the volume integral of lift elements with
$\tau =\tau _1$
, where the volume integral of lift elements with $L_e\geqslant 0.015$
inside the vortex is performed and normalised by
$L_e\geqslant 0.015$
inside the vortex is performed and normalised by $({1}/{2}) \rho u_\infty ^2 bc$
.
$({1}/{2}) \rho u_\infty ^2 bc$
.
However, in the finite-wing case, another prominent source of positive lift emerges: the TiVs, particularly notable at $\tau =\tau _1$
and
$\tau =\tau _1$
and $\tau _2$
. While the TiVs cause sectional lift reduction due to their local downwash, the TiVs, strongly amplified by the impacting gust vortex, generate large low-pressure cores above the wing, enhancing their local contribution to vortex lift (Lee et al. Reference Lee, Hsieh, Chang and Chu2012; Smith & Taira Reference Smith and Taira2024). Specifically, at
$\tau _2$
. While the TiVs cause sectional lift reduction due to their local downwash, the TiVs, strongly amplified by the impacting gust vortex, generate large low-pressure cores above the wing, enhancing their local contribution to vortex lift (Lee et al. Reference Lee, Hsieh, Chang and Chu2012; Smith & Taira Reference Smith and Taira2024). Specifically, at $z/c=0.48$
, the sectional lift attributed to the TiV for
$z/c=0.48$
, the sectional lift attributed to the TiV for $G=3$
is 0.89, which is nearly three-quarters of that by the LEV (
$G=3$
is 0.89, which is nearly three-quarters of that by the LEV ( $=1.24$
), where we integrate lift elements with
$=1.24$
), where we integrate lift elements with $L_e\geqslant 0.015$
inside each vortex along the spanwise slice. Although the lift contribution of the TiVs is pronounced only around the tip, their contribution to the total lift is 0.34 at
$L_e\geqslant 0.015$
inside each vortex along the spanwise slice. Although the lift contribution of the TiVs is pronounced only around the tip, their contribution to the total lift is 0.34 at $\tau =\tau _1$
, which is over 10 % of it. The positive-lift effect of the TiVs is also observed in the sectional lift distribution visualised in figure 4, where, with the growth of the TiVs, the section lift has a positive peak near the wingtips, a trend particularly pronounced at
$\tau =\tau _1$
, which is over 10 % of it. The positive-lift effect of the TiVs is also observed in the sectional lift distribution visualised in figure 4, where, with the growth of the TiVs, the section lift has a positive peak near the wingtips, a trend particularly pronounced at $\tau =\tau _2$
.
$\tau =\tau _2$
.
We further examine key three-dimensional vortex dynamics that attenuate lift fluctuation compared to the 2-D case. First, the effective angle of attack is reduced likely due to the enhanced downwash by the strengthened TiVs, decreasing positive lift around the first peak at $\tau =\tau _1$
. Additionally, the formation of the arch vortex suppresses LEV development (Lee et al. Reference Lee, Hsieh, Chang and Chu2012), further reducing positive lift. The arch vortex also plays a role in attenuating the negative peak at
$\tau =\tau _1$
. Additionally, the formation of the arch vortex suppresses LEV development (Lee et al. Reference Lee, Hsieh, Chang and Chu2012), further reducing positive lift. The arch vortex also plays a role in attenuating the negative peak at $\tau =\tau _3$
by keeping the LEV closer to the upper surface near the tips. Moreover, spanwise vorticity generation in the lower-surface boundary layer is suppressed around the wingtips while the gust vortex merging with the boundary layer distorts around the wing corners, leading to a decreased level of spanwise vorticity on the underside of the wing – and consequently, a reduction in negative-lift elements compared with the 2-D wing. This loss of negative-lift elements near the tips leads to an increasing trend in the sectional lift towards the wingtip, as seen particularly at
$\tau =\tau _3$
by keeping the LEV closer to the upper surface near the tips. Moreover, spanwise vorticity generation in the lower-surface boundary layer is suppressed around the wingtips while the gust vortex merging with the boundary layer distorts around the wing corners, leading to a decreased level of spanwise vorticity on the underside of the wing – and consequently, a reduction in negative-lift elements compared with the 2-D wing. This loss of negative-lift elements near the tips leads to an increasing trend in the sectional lift towards the wingtip, as seen particularly at $\tau =\tau _3$
in the last row of figure 4.
$\tau =\tau _3$
in the last row of figure 4.
We therefore find two opposing effects of the TiVs on the large lift fluctuations induced by an extreme positive gust vortex. First, they contribute to positive lift by creating large low-pressure cores near the tips above the wing. Second, they attenuate the large lift surge and drop, due to enhancing downwash with their growth and forming arch vortices. The second effect, combined with reduced spanwise vorticity generation in the lower-surface boundary layer and the distortion of the gust vortex around the tips, dominates the first, resulting in the finite wing undergoing smaller lift fluctuations than the 2-D wing. This suggests that further promoting TiVs during interaction with a positive gust vortex could lead to a greater attenuation of large transient lift fluctuations.
Same isosurface, spanwise slices and sectional lift distributions as in figure 4 for $G=-1.2$
and
$G=-1.2$
and $-3$
.
$-3$
.

3.3. Negative vortex encounters by the square wing
Let us analyse the negative gust vortex cases, shown in figure 5. First, the evolution of the TiVs follows an opposite trend to that observed in the positive gust vortex cases. Specifically, TiVs first weaken and even reverse orientation, particularly near the leading edge, because the downward velocity of the approaching gust vortex applies higher pressure on the top surface and temporarily inverts the pressure and suction effects on the wing. Note that the reversed TiVs induce local upwash effects, as can be seen in the sectional lift at $\tau =\tau _1$
in the last row of figure 5, where the sectional lift exhibits a sharp increase near the wingtip. An additional discussion on the upwash is presented in Appendix A. Once the gust vortex passes, TiVs regain strength in their original orientations, affected by the upward velocity from the gust vortex.
$\tau =\tau _1$
in the last row of figure 5, where the sectional lift exhibits a sharp increase near the wingtip. An additional discussion on the upwash is presented in Appendix A. Once the gust vortex passes, TiVs regain strength in their original orientations, affected by the upward velocity from the gust vortex.
This evolution is observed in the Q-criterion isosurface in figure 5. At $\tau =\tau _1$
, the reversed TiVs around the leading edge are visible, while the TiVs near the trailing edge are too weak to be captured by the isosurface. By
$\tau =\tau _1$
, the reversed TiVs around the leading edge are visible, while the TiVs near the trailing edge are too weak to be captured by the isosurface. By $\tau =\tau _4$
, the TiVs recover in the original orientation, particularly near the leading edge. The sectional lift plot in the last row of figure 5 also reveals the effects of the TiV dynamics. Due to the reversed TiVs, the sectional lift exhibits an increasing trend towards the tips at
$\tau =\tau _4$
, the TiVs recover in the original orientation, particularly near the leading edge. The sectional lift plot in the last row of figure 5 also reveals the effects of the TiV dynamics. Due to the reversed TiVs, the sectional lift exhibits an increasing trend towards the tips at $\tau =\tau _1$
for both
$\tau =\tau _1$
for both $G=-1.2$
and
$G=-1.2$
and $-3$
. Around
$-3$
. Around $\tau =\tau _3$
, the sectional lift trend shifts back to a decreasing one, owing to a recovery of the TiVs in the original orientation.
$\tau =\tau _3$
, the sectional lift trend shifts back to a decreasing one, owing to a recovery of the TiVs in the original orientation.
We now analyse the three-dimensional interactions and connections between vortical structures. Similar to the positive gust vortex cases but on the other side of the wing, the LEV and TiVs interconnect and form arch vortices below the wing, as seen at $\tau =\tau _2$
for both
$\tau =\tau _2$
for both $G=-1.2$
and
$G=-1.2$
and $-3$
in figure 5. For
$-3$
in figure 5. For $G=-1.2$
, the vortices advect downstream along the wing over time, exhibiting kinks around the quarter spans on the upper surface at
$G=-1.2$
, the vortices advect downstream along the wing over time, exhibiting kinks around the quarter spans on the upper surface at $\tau =\tau _4$
affected by the recovered TiVs.
$\tau =\tau _4$
affected by the recovered TiVs.
For $G=-3$
, the legs of the arch vortices in the inboard region are pushed towards and localised around the root by
$G=-3$
, the legs of the arch vortices in the inboard region are pushed towards and localised around the root by $\tau =\tau _3$
(the vortex line in black), while the legs near the wingtips attach to the bottom surface of the wing (the vortex line in aqua). Furthermore, vortex lines connecting the TEV and reversed TiVs link to the gust vortex (the vortex line in orange). By
$\tau =\tau _3$
(the vortex line in black), while the legs near the wingtips attach to the bottom surface of the wing (the vortex line in aqua). Furthermore, vortex lines connecting the TEV and reversed TiVs link to the gust vortex (the vortex line in orange). By $\tau =\tau _4$
, the arch vortex localised inboard is further pushed towards the root and stretched into a hairpin vortex. The formation of this stretched hairpin vortex disrupts the redevelopment of the leading-edge shear layer on the upper surface, as seen in the spanwise slice at the root in figure 5. After
$\tau =\tau _4$
, the arch vortex localised inboard is further pushed towards the root and stretched into a hairpin vortex. The formation of this stretched hairpin vortex disrupts the redevelopment of the leading-edge shear layer on the upper surface, as seen in the spanwise slice at the root in figure 5. After $\tau =\tau _4$
, the stretched hairpin vortex convects above the wing, although the subsequent evolution of the vortices is not shown in figure 5.
$\tau =\tau _4$
, the stretched hairpin vortex convects above the wing, although the subsequent evolution of the vortices is not shown in figure 5.
Next, let us identify the dominant vortical structures responsible for the large lift fluctuations through lift element analysis in figure 5. Similar to the 2-D wing cases, the LEV and shear layer beneath the wing primarily drive the first negative peak at $\tau =\tau _1$
, while the gust vortex merged with the leading-edge shear layer on the upper surface is the main contributor to the positive-lift peak at
$\tau =\tau _1$
, while the gust vortex merged with the leading-edge shear layer on the upper surface is the main contributor to the positive-lift peak at $\tau =\tau _3$
. For the square-wing cases, the reversed TiVs also play a crucial role in negative lift generation by creating low-pressure cores below the wing. This effect is particularly visible for
$\tau =\tau _3$
. For the square-wing cases, the reversed TiVs also play a crucial role in negative lift generation by creating low-pressure cores below the wing. This effect is particularly visible for $G=-3$
at
$G=-3$
at $\tau =\tau _1$
and
$\tau =\tau _1$
and $\tau _2$
, as shown in the lift element visualisations in figure 5, acting in the opposite manner to the strengthened TiVs in the positive vortex cases. The negative spike in the section lift for
$\tau _2$
, as shown in the lift element visualisations in figure 5, acting in the opposite manner to the strengthened TiVs in the positive vortex cases. The negative spike in the section lift for $G=-3$
at
$G=-3$
at $\tau =\tau _2$
in the last row of figure 5 is also a consequence of the lift-decreasing effect by the low-pressure cores of the reversed TiVs.
$\tau =\tau _2$
in the last row of figure 5 is also a consequence of the lift-decreasing effect by the low-pressure cores of the reversed TiVs.
Key structures that contribute to the attenuated lift response compared with the 2-D wing can also be uncovered. The first, negative peak is mitigated likely because of the upwash effects induced by the reversed TiVs. For the attenuation of the positive peak, there appear to be two main mechanisms. First, the arch vortex below the wing decreases lift by positioning the low-pressure regions closer to the bottom surface near the tips. Second, the positive lift attributed to the gust vortex merged with the leading-edge shear layer on the top surface is reduced particularly near the wingtips. This is because coherent spanwise vorticity of the gust vortex is partially lost as the gust vortex distorts around the wing corners, coupled with suppressed shear-layer development near the tips, as shown in figure 5.
We thus find two opposing ways that the finite wing affects the lift fluctuations for negative gust vortex cases: (i) the TiVs, which are low-pressure cores, develop below the wing through interaction with an impacting gust vortex, contributing to initial, large lift drop; (ii) the lift drop and surge are attenuated through the three-dimensional vortex dynamics such as the reversed TiVs and the distortion of the impacting gust vortex around the wing corners. Reminiscent of the positive gust vortex cases, the second effect outweighs the first, causing the square wing to experience a smaller lift variation than the 2-D wing. These results suggest that further amplifying TiV evolution – intensifying TiVs in the opposite orientation to the baseline in response to a negative gust vortex – could enhance the attenuation of the large lift changes.
3.4. Influence of gust vortex vertical position
Let us study the effects of the relative height difference between the wing and the approaching gust vortex. We first present lift fluctuations experienced by the 2-D and square wings encountering a gust vortex introduced at different initial vertical positions. Next, we examine the vortex dynamics around the 2-D wing that contributes to the large lift changes for the varied vertical position cases. We further analyse the flows around the square wing and investigate the finite-wing effects on the lift variations.
Here, we compare the lift histories for the 2-D and square wings subjected to a gust vortex with $G=\pm 3$
introduced at different initial vertical positions
$G=\pm 3$
introduced at different initial vertical positions $y_0/c=\{-0.25,0,0.25\}$
, as shown in figure 6. For the positive gust vortex, the 2-D wing experiences the lowest lift fluctuation for the
$y_0/c=\{-0.25,0,0.25\}$
, as shown in figure 6. For the positive gust vortex, the 2-D wing experiences the lowest lift fluctuation for the $y_0/c= -0.25$
case compared with the other two position cases, although the initial peak is slightly higher than that observed for the
$y_0/c= -0.25$
case compared with the other two position cases, although the initial peak is slightly higher than that observed for the $y_0/c= 0.25$
case. Similarly, the square wing exhibits the lowest lift fluctuation for the
$y_0/c= 0.25$
case. Similarly, the square wing exhibits the lowest lift fluctuation for the $y_0/c=-0.25$
case. For example, the initial lift peak for the
$y_0/c=-0.25$
case. For example, the initial lift peak for the $y_0/c= -0.25$
case with the square wing is
$y_0/c= -0.25$
case with the square wing is $1.67$
while that for the
$1.67$
while that for the $y_0/c= 0$
case is
$y_0/c= 0$
case is $2.70$
. For all three vertical positions considered herein, the lift fluctuations are attenuated for the square wing compared with those for the 2-D wing.
$2.70$
. For all three vertical positions considered herein, the lift fluctuations are attenuated for the square wing compared with those for the 2-D wing.
For the negative gust vortex cases shown in figure 6(b), lift fluctuations are the lowest when both the 2-D and square wings fly beneath the gust vortex ( $y_0/c=0.25$
) among the three vertical position cases considered. The 2-D wing experiences the largest lift fluctuation when the vortex is located at
$y_0/c=0.25$
) among the three vertical position cases considered. The 2-D wing experiences the largest lift fluctuation when the vortex is located at $y_0/c= -0.25$
, whereas the square wing exhibits the largest fluctuation at
$y_0/c= -0.25$
, whereas the square wing exhibits the largest fluctuation at $y_0/c= 0$
. Notably, the lift peaks experienced by the square wing are reduced for all three examined vertical positions compared with the 2-D wing.
$y_0/c= 0$
. Notably, the lift peaks experienced by the square wing are reduced for all three examined vertical positions compared with the 2-D wing.
Lift history for the 2-D (dashed line) and square (solid line) wings encountering a gust vortex with $G=3$
(a) and
$G=3$
(a) and $-3$
(b) initially introduced at different vertical positions
$-3$
(b) initially introduced at different vertical positions $y_0/c=\{-0.25,0,0.25\}$
.
$y_0/c=\{-0.25,0,0.25\}$
.

Let us shift our focus to the vortex dynamics around the 2-D wing, particularly for $y_0/c=\pm 0.25$
, and its relation to the lift fluctuations. In figure 7, we visualise lift element
$y_0/c=\pm 0.25$
, and its relation to the lift fluctuations. In figure 7, we visualise lift element $L_e$
and spanwise vorticity
$L_e$
and spanwise vorticity $\omega _z$
for the 2-D wing with
$\omega _z$
for the 2-D wing with $y_0/c=\pm 0.25$
at
$y_0/c=\pm 0.25$
at $\tau =\tau _1$
and
$\tau =\tau _1$
and $\tau _3$
. Below the visualisation at
$\tau _3$
. Below the visualisation at $\tau =\tau _1$
, we also show the contour lines of
$\tau =\tau _1$
, we also show the contour lines of $\omega _z=-20$
for
$\omega _z=-20$
for $G=3$
and
$G=3$
and $\omega _z=20$
for
$\omega _z=20$
for $G=-3$
to compare the size and position of the LEV between the cases with
$G=-3$
to compare the size and position of the LEV between the cases with $y_0/c=0$
and
$y_0/c=0$
and $\pm 0.25$
.
$\pm 0.25$
.
We examine the 2-D wing flying above the positive gust vortex $(G,y_0/c) = (3,-0.25)$
, as shown in the first column of figure 7. As the gust vortex approaches the wing, a large LEV develops, similar to the positive gust vortex cases discussed in § 3.1. However, due to the lower vertical position of the gust vortex, the size and intensity of the LEV are weakened with its location shifted upstream compared with the
$(G,y_0/c) = (3,-0.25)$
, as shown in the first column of figure 7. As the gust vortex approaches the wing, a large LEV develops, similar to the positive gust vortex cases discussed in § 3.1. However, due to the lower vertical position of the gust vortex, the size and intensity of the LEV are weakened with its location shifted upstream compared with the $(G,y_0/c) = (3,0)$
case. This weaker LEV results in a lower lift peak at
$(G,y_0/c) = (3,0)$
case. This weaker LEV results in a lower lift peak at $\tau =\tau _1$
than the
$\tau =\tau _1$
than the $y_0/c=0$
case. In addition, at
$y_0/c=0$
case. In addition, at $\tau =\tau _1$
, a secondary vortical structure is induced between the LEV and the upper surface. By
$\tau =\tau _1$
, a secondary vortical structure is induced between the LEV and the upper surface. By $\tau =\tau _3$
, this secondary structure disrupts the vortical sheet feeding the LEV and rolls up around the leading edge. Furthermore, the gust vortex convects below the wing and disturbs the bottom-surface boundary layer, resulting in a reduction of vorticity contained in it, as seen in the bottom left panel of figure 7. This causes a loss of negative-lift elements on the lower surface, substantially diminishing the negative-lift peak, compared with the cases where the gust vortex is introduced higher; e.g. the negative-lift peak for the
$\tau =\tau _3$
, this secondary structure disrupts the vortical sheet feeding the LEV and rolls up around the leading edge. Furthermore, the gust vortex convects below the wing and disturbs the bottom-surface boundary layer, resulting in a reduction of vorticity contained in it, as seen in the bottom left panel of figure 7. This causes a loss of negative-lift elements on the lower surface, substantially diminishing the negative-lift peak, compared with the cases where the gust vortex is introduced higher; e.g. the negative-lift peak for the $(G,y_0/c) = (3,-0.25)$
case of the 2-D wing is
$(G,y_0/c) = (3,-0.25)$
case of the 2-D wing is $-0.49$
while that for the
$-0.49$
while that for the $(G,y_0/c) = (3,0)$
case is
$(G,y_0/c) = (3,0)$
case is $-3.10$
.
$-3.10$
.
Lift element $L_e$
(colour contour) and spanwise vorticity
$L_e$
(colour contour) and spanwise vorticity $\omega _z$
(line contour) for the 2-D wing cases of
$\omega _z$
(line contour) for the 2-D wing cases of $G=\pm 3$
with
$G=\pm 3$
with $y_0/c=\pm 0.25$
at
$y_0/c=\pm 0.25$
at $\tau =\tau _1$
and
$\tau =\tau _1$
and $\tau _3$
. At
$\tau _3$
. At $\tau =\tau _1$
, contour lines of
$\tau =\tau _1$
, contour lines of $\omega _z=-20$
for
$\omega _z=-20$
for $G=3$
and
$G=3$
and $\omega _z=20$
for
$\omega _z=20$
for $G=-3$
are also visualised below to compare the LEV between
$G=-3$
are also visualised below to compare the LEV between $y_0/c =0$
(dotted-line contour) and
$y_0/c =0$
(dotted-line contour) and $\pm 0.25$
(solid-line contour indicated by the coloured arrows).
$\pm 0.25$
(solid-line contour indicated by the coloured arrows).

Considering the 2-D wing flying below the positive gust vortex $(G,y_0/c) = (3,0.25)$
, as shown in the second column of figure 7, we observe similar vortex dynamics to the case with
$(G,y_0/c) = (3,0.25)$
, as shown in the second column of figure 7, we observe similar vortex dynamics to the case with $(G,y_0/c) = (3,0)$
presented in § 3.1. That is, at
$(G,y_0/c) = (3,0)$
presented in § 3.1. That is, at $\tau =\tau _1$
, a large LEV forms on the upper surface while the approaching gust vortex increases the wall-normal velocity gradient in the bottom-surface boundary layer, enhancing vorticity generation. However, compared with the
$\tau =\tau _1$
, a large LEV forms on the upper surface while the approaching gust vortex increases the wall-normal velocity gradient in the bottom-surface boundary layer, enhancing vorticity generation. However, compared with the $(G,y_0/c) = (3,0)$
case, the LEV has a smaller growth with its location shifted downstream, resulting in a lower positive-lift peak. By
$(G,y_0/c) = (3,0)$
case, the LEV has a smaller growth with its location shifted downstream, resulting in a lower positive-lift peak. By $\tau =\tau _3$
, the gust vortex convects downstream above the wing, forming a vortex-pair-like structure with the LEV. As a result, the wing loses most of the vortical structures contributing to positive lift. In contrast, vortical structures on the lower surface that contribute to negative lift persist, leading to a pronounced negative-lift peak.
$\tau =\tau _3$
, the gust vortex convects downstream above the wing, forming a vortex-pair-like structure with the LEV. As a result, the wing loses most of the vortical structures contributing to positive lift. In contrast, vortical structures on the lower surface that contribute to negative lift persist, leading to a pronounced negative-lift peak.
Let us next focus on the negative vortex encounter with $(G,y_0/c)=(-3,-0.25)$
by the 2-D wing, as shown in the third column of figure 7. As the negative vortex approaches the wing, a strong LEV develops below the wing, leading to a significant negative-lift peak around
$(G,y_0/c)=(-3,-0.25)$
by the 2-D wing, as shown in the third column of figure 7. As the negative vortex approaches the wing, a strong LEV develops below the wing, leading to a significant negative-lift peak around $\tau =\tau _1$
. Concurrently, a secondary vortical structure is induced between the LEV and the lower surface. However, as the gust vortex convects below the wing by
$\tau =\tau _1$
. Concurrently, a secondary vortical structure is induced between the LEV and the lower surface. However, as the gust vortex convects below the wing by $\tau =\tau _3$
forming a vortex-pair-like structure with the LEV, this secondary structure does not continue to grow, unlike the
$\tau =\tau _3$
forming a vortex-pair-like structure with the LEV, this secondary structure does not continue to grow, unlike the $(G,y_0/c)=(-3,0)$
case discussed in § 3.1. On the top surface, the gust vortex induces a large wall-normal velocity gradient in the shear layer near the leading edge by
$(G,y_0/c)=(-3,0)$
case discussed in § 3.1. On the top surface, the gust vortex induces a large wall-normal velocity gradient in the shear layer near the leading edge by $\tau =\tau _3$
, generating a high level of vorticity, and, hence, large positive lift. This contributes to a significant second, positive-lift peak.
$\tau =\tau _3$
, generating a high level of vorticity, and, hence, large positive lift. This contributes to a significant second, positive-lift peak.
For the 2-D wing flying under the negative gust vortex $(G,y_0/c)=(-3,0.25)$
as in the fourth column of figure 7, a smaller LEV develops below the wing at
$(G,y_0/c)=(-3,0.25)$
as in the fourth column of figure 7, a smaller LEV develops below the wing at $\tau =\tau _1$
, compared with the cases where the wing flies higher. As a result, the first lift peak for this case is the smallest among the three examined different vertical position cases. A secondary vortical structure induced between the LEV and the lower surface at
$\tau =\tau _1$
, compared with the cases where the wing flies higher. As a result, the first lift peak for this case is the smallest among the three examined different vertical position cases. A secondary vortical structure induced between the LEV and the lower surface at $\tau =\tau _1$
rolls up around the leading edge by
$\tau =\tau _1$
rolls up around the leading edge by $\tau =\tau _3$
, resembling the dynamics discussed for the
$\tau =\tau _3$
, resembling the dynamics discussed for the $(G,y_0/c)=(-3,0)$
case in § 3.1. However, the positive-lift elements associated with this secondary vortical structure around the leading edge are not as substantial as those observed in the
$(G,y_0/c)=(-3,0)$
case in § 3.1. However, the positive-lift elements associated with this secondary vortical structure around the leading edge are not as substantial as those observed in the $(G,y_0/c)=(-3,0)$
case because of the smaller development of the LEV, resulting in a lower positive-lift peak than the
$(G,y_0/c)=(-3,0)$
case because of the smaller development of the LEV, resulting in a lower positive-lift peak than the $(G,y_0/c)=(-3,0)$
case.
$(G,y_0/c)=(-3,0)$
case.
Thus, we find effective vertical positions of the 2-D wing to reduce large lift fluctuations against an impacting gust vortex; flying over the positive gust vortex and flying under the negative gust vortex. A similar trend is also observed in an experimental study by Peng & Gregory (Reference Peng and Gregory2017). They reported that the force fluctuation during vortex-gust encounters by a 2-D wing with $|G|\lt 1$
at
$|G|\lt 1$
at $\textit{Re}=\mathcal{O}(10^5)$
in the context of blade–vortex interactions can be reduced when the aerofoil passes above a positive vortex or below a negative vortex.
$\textit{Re}=\mathcal{O}(10^5)$
in the context of blade–vortex interactions can be reduced when the aerofoil passes above a positive vortex or below a negative vortex.
We now turn our attention to the square-wing cases. Presented in figure 8 are the isosurfaces of Q-criterion and the spanwise slices of lift element $L_e$
and spanwise vorticity
$L_e$
and spanwise vorticity $\omega _z$
along the root and near the tip for the square wing with
$\omega _z$
along the root and near the tip for the square wing with $y_0/c=\pm 0.25$
at
$y_0/c=\pm 0.25$
at $\tau =\tau _1$
and
$\tau =\tau _1$
and $\tau _3$
.
$\tau _3$
.
Isosurfaces of Q-criterion around the square wing and spanwise slices of $L_e$
(colour contour) and
$L_e$
(colour contour) and $\omega _z$
(line contour) along the root and near the tip at
$\omega _z$
(line contour) along the root and near the tip at $\tau =\tau _1$
and
$\tau =\tau _1$
and $\tau _3$
for the
$\tau _3$
for the $y_0/c=\pm 0.25$
cases.
$y_0/c=\pm 0.25$
cases.

For the $(G,y_0/c) = (3,-0.25)$
case, as shown in the first column of figure 8, an LEV develops on the upper surface at
$(G,y_0/c) = (3,-0.25)$
case, as shown in the first column of figure 8, an LEV develops on the upper surface at $\tau =\tau _1$
, connecting to the strengthened TiVs around the wing corners. Similar to the discussion provided in § 3.2, the strengthened TiVs suppress the development of the LEV and induce enhanced downwash, particularly near the wingtips, resulting in a smaller first lift peak than in the 2-D wing case. By
$\tau =\tau _1$
, connecting to the strengthened TiVs around the wing corners. Similar to the discussion provided in § 3.2, the strengthened TiVs suppress the development of the LEV and induce enhanced downwash, particularly near the wingtips, resulting in a smaller first lift peak than in the 2-D wing case. By $\tau =\tau _3$
, the LEV transforms into an arch vortex, with its legs pushed towards and positioned beneath the wing near the tips. The secondary vortical structure, which is induced between the LEV and the upper surface at
$\tau =\tau _3$
, the LEV transforms into an arch vortex, with its legs pushed towards and positioned beneath the wing near the tips. The secondary vortical structure, which is induced between the LEV and the upper surface at $\tau =\tau _1$
, rolls up around the leading edge and shifts to the underside of the wing, particularly near the wingtip. As in the 2-D case, the gust vortex, convecting below the wing, interacts with the bottom-surface boundary layer, weakening negative-lift elements on the lower surface. Moreover, as seen in the spanwise slice at
$\tau =\tau _1$
, rolls up around the leading edge and shifts to the underside of the wing, particularly near the wingtip. As in the 2-D case, the gust vortex, convecting below the wing, interacts with the bottom-surface boundary layer, weakening negative-lift elements on the lower surface. Moreover, as seen in the spanwise slice at $z/c=0.48$
at
$z/c=0.48$
at $\tau =\tau _3$
, the gust vortex loses some coherence in its spanwise structure near the tips, resulting in reduced negative-lift elements.
$\tau =\tau _3$
, the gust vortex loses some coherence in its spanwise structure near the tips, resulting in reduced negative-lift elements.
Let us next examine the square-wing case with $(G,y_0/c) = (3,0.25)$
, as shown in the second column of figure 8. As the gust vortex approaches the wing, a large LEV develops while the TiVs are amplified. As seen in the spanwise slice of the lift element visualisation along
$(G,y_0/c) = (3,0.25)$
, as shown in the second column of figure 8. As the gust vortex approaches the wing, a large LEV develops while the TiVs are amplified. As seen in the spanwise slice of the lift element visualisation along $z/c=0.48$
at
$z/c=0.48$
at $\tau =\tau _1$
, the TiVs contribute to positive lift near the tip due to their large low-pressure cores, similar to the cases discussed in § 3.2. Concurrently, the intensified TiVs locally induce enhanced downwash and suppress the development of the LEV, resulting in a lower initial lift peak compared with the 2-D wing case. By
$\tau =\tau _1$
, the TiVs contribute to positive lift near the tip due to their large low-pressure cores, similar to the cases discussed in § 3.2. Concurrently, the intensified TiVs locally induce enhanced downwash and suppress the development of the LEV, resulting in a lower initial lift peak compared with the 2-D wing case. By $\tau =\tau _3$
, the gust vortex rolls up and lifts the arch vortex and TiVs significantly away from the wing, as visualised by the Q-criterion isosurface. Furthermore, spanwise vorticity generation in the bottom-surface boundary layer is suppressed near the tips, causing a loss of negative-lift elements, similar to the discussion provided in § 3.2. These finite-wing effects contribute to attenuating the negative-lift peak compared with the 2-D wing.
$\tau =\tau _3$
, the gust vortex rolls up and lifts the arch vortex and TiVs significantly away from the wing, as visualised by the Q-criterion isosurface. Furthermore, spanwise vorticity generation in the bottom-surface boundary layer is suppressed near the tips, causing a loss of negative-lift elements, similar to the discussion provided in § 3.2. These finite-wing effects contribute to attenuating the negative-lift peak compared with the 2-D wing.
For the square wing encountering the negative gust vortex with $(G,y_0/c)=(-3,-0.25)$
, as depicted in the third column of figure 8, a large LEV develops below the wing while the TiVs reverse orientation. The reversed TiVs locally induce upwash effects and suppress the LEV development near the tips, attenuating the first negative-lift peak compared with the 2-D wing case. Over time, the gust vortex rolls up the LEV and TiVs beneath the wing, disrupting the vortex sheet feeding the LEV, as visualised by the Q-criterion isosurface and spanwise slices at
$(G,y_0/c)=(-3,-0.25)$
, as depicted in the third column of figure 8, a large LEV develops below the wing while the TiVs reverse orientation. The reversed TiVs locally induce upwash effects and suppress the LEV development near the tips, attenuating the first negative-lift peak compared with the 2-D wing case. Over time, the gust vortex rolls up the LEV and TiVs beneath the wing, disrupting the vortex sheet feeding the LEV, as visualised by the Q-criterion isosurface and spanwise slices at $\tau =\tau _3$
. On the upper surface, the development of the leading-edge shear layer, enhanced by the impacting gust vortex as discussed for the 2-D wing case, weakens near the tips because the coherent structure of the gust vortex distorts around the wing corners. The weaker leading-edge shear layer results in reduced positive-lift elements, contributing to the damping of the second lift peak compared with the 2-D wing case.
$\tau =\tau _3$
. On the upper surface, the development of the leading-edge shear layer, enhanced by the impacting gust vortex as discussed for the 2-D wing case, weakens near the tips because the coherent structure of the gust vortex distorts around the wing corners. The weaker leading-edge shear layer results in reduced positive-lift elements, contributing to the damping of the second lift peak compared with the 2-D wing case.
For the square-wing case with $(G,y_0/c)=(-3,0.25)$
, as presented in the fourth column of figure 8, a smaller LEV forms below the wing at
$(G,y_0/c)=(-3,0.25)$
, as presented in the fourth column of figure 8, a smaller LEV forms below the wing at $\tau =\tau _1$
than in the cases where the gust vortex is introduced lower. The reversed TiVs develop beneath the wing, inducing upwash effects, suppressing the development of the LEV, and thereby mitigating the first lift peak compared with the 2-D wing case. By
$\tau =\tau _1$
than in the cases where the gust vortex is introduced lower. The reversed TiVs develop beneath the wing, inducing upwash effects, suppressing the development of the LEV, and thereby mitigating the first lift peak compared with the 2-D wing case. By $\tau =\tau _3$
, the LEV forms an arch vortex, rolls up around the leading edge to the upper surface and separates from the wing with the legs connected to the TiVs. Similar to the 2-D case, the secondary vortical structure, which is induced between the LEV and the bottom surface at
$\tau =\tau _3$
, the LEV forms an arch vortex, rolls up around the leading edge to the upper surface and separates from the wing with the legs connected to the TiVs. Similar to the 2-D case, the secondary vortical structure, which is induced between the LEV and the bottom surface at $\tau =\tau _1$
, rolls up around the leading edge by
$\tau =\tau _1$
, rolls up around the leading edge by $\tau =\tau _3$
. As visualised in the spanwise slices at
$\tau =\tau _3$
. As visualised in the spanwise slices at $\tau =\tau _3$
, the positive-lift elements associated with this secondary vortical structure are reduced near the wingtips, because the development of the LEV was suppressed around
$\tau =\tau _3$
, the positive-lift elements associated with this secondary vortical structure are reduced near the wingtips, because the development of the LEV was suppressed around $\tau =\tau _1$
due to the reversed TiVs. These attenuated positive-lift elements contribute to a mitigated positive-lift peak compared with the 2-D wing case.
$\tau =\tau _1$
due to the reversed TiVs. These attenuated positive-lift elements contribute to a mitigated positive-lift peak compared with the 2-D wing case.
Finally, to gain enhanced insights from the present results, we provide figure 9, where the side view of the Q-criterion and spanwise vorticity $\omega _z$
along the root at
$\omega _z$
along the root at $\tau =0$
are shown for
$\tau =0$
are shown for $(G,y_0/c)=(3,-0.25)$
and
$(G,y_0/c)=(3,-0.25)$
and $(-3,0.25)$
with the square wing. For the case of the positive vortex encountering the square wing, as shown in figure 9(a), a strong compact LEV develops on the top surface, leading to a significant positive-lift peak. Furthermore, the TiVs strengthen through interaction with the gust vortex and generate large low-pressure cores above the wing, contributing to substantial vortex lift near the wingtips. However, the strengthened TiVs locally induce enhanced downwash and suppress further LEV development, attenuating the large lift peak compared to the 2-D wing. Notably, the large lift fluctuation is reduced when the square wing flies over the positive gust vortex as visualised in figure 9(a), due to smaller LEV development and a loss of negative-lift elements in the bottom-surface boundary layer by the impact.
$(-3,0.25)$
with the square wing. For the case of the positive vortex encountering the square wing, as shown in figure 9(a), a strong compact LEV develops on the top surface, leading to a significant positive-lift peak. Furthermore, the TiVs strengthen through interaction with the gust vortex and generate large low-pressure cores above the wing, contributing to substantial vortex lift near the wingtips. However, the strengthened TiVs locally induce enhanced downwash and suppress further LEV development, attenuating the large lift peak compared to the 2-D wing. Notably, the large lift fluctuation is reduced when the square wing flies over the positive gust vortex as visualised in figure 9(a), due to smaller LEV development and a loss of negative-lift elements in the bottom-surface boundary layer by the impact.
Conversely, when the negative gust vortex encounters the square wing, as presented in figure 9(b), a strong compact LEV and reversed TiVs develop below the wing, resulting in a significant negative-lift peak. Simultaneously, the reversed TiVs locally induce upwash and suppress LEV growth, attenuating the lift peak compared with the 2-D wing. Opposite to the aforementioned positive gust vortex case, the large lift fluctuation caused by the negative gust vortex can be reduced by the wing flying under the gust vortex, as visualised in figure 9(b). These findings inform potential strategies for lift attenuation during extreme gust–finite-wing interactions by taking advantage of wing positions and TiVs.
(a,b) Side view of the Q-criterion isosurface $Q=5$
and colour contours of the spanwise vorticity
$Q=5$
and colour contours of the spanwise vorticity $\omega _z$
along the root at
$\omega _z$
along the root at $\tau =0$
for the
$\tau =0$
for the $(G,y_0/c)=(3,-0.25)$
and
$(G,y_0/c)=(3,-0.25)$
and $(-3,0.25)$
cases with the square wing.
$(-3,0.25)$
cases with the square wing.

4. Concluding remarks
This study identified key vortex dynamics that generates large lift fluctuations in extreme vortex-gust encounters by a square-planform wing and cause lift attenuation when compared with the case of a 2-D wing. We conducted direct numerical simulations of flows over an $\textit{sAR}=0.5$
wing at
$\textit{sAR}=0.5$
wing at $\textit{Re}=600$
and performed lift element analysis on the unsteady flow field. We uncovered that TiVs play two opposing roles in the large lift changes during extreme vortex gust encounters by the finite wing: (i) contributing to the lift surge or drop by developing large low-pressure cores near the wingtips; (ii) mitigating the lift variations through three-dimensional vortex dynamics, such as enhanced downwash or upwash. The second effect dominates the first, causing the square wing to undergo a smaller lift change than the 2-D wing. In addition, we revealed effective vertical positions of the wing to reduce the lift change against an incoming gust vortex – flying over the positive gust vortex and flying beneath the negative one. The current insights obtained in the laminar flow setting can establish a foundation for extreme gust–finite-wing interacting flows and direct future efforts in developing control strategies or wing configurations to leverage TiV dynamics and mitigate large lift fluctuations at higher Reynolds numbers.
$\textit{Re}=600$
and performed lift element analysis on the unsteady flow field. We uncovered that TiVs play two opposing roles in the large lift changes during extreme vortex gust encounters by the finite wing: (i) contributing to the lift surge or drop by developing large low-pressure cores near the wingtips; (ii) mitigating the lift variations through three-dimensional vortex dynamics, such as enhanced downwash or upwash. The second effect dominates the first, causing the square wing to undergo a smaller lift change than the 2-D wing. In addition, we revealed effective vertical positions of the wing to reduce the lift change against an incoming gust vortex – flying over the positive gust vortex and flying beneath the negative one. The current insights obtained in the laminar flow setting can establish a foundation for extreme gust–finite-wing interacting flows and direct future efforts in developing control strategies or wing configurations to leverage TiV dynamics and mitigate large lift fluctuations at higher Reynolds numbers.
Funding
This work was supported by the US Department of Defense Vannevar Bush Faculty Fellowship (N00014-22-1-2798) and the Air Force Office of Scientific Research (FA9550-21-1-0174). H.O. acknowledges partial support from Honjo International Scholarship Foundation.
Declaration of interests
The authors report no conflict of interest.
Appendix A. Enhanced TiVs and reversed TiVs
We present in figure 10 $(a)$
the transverse velocity
$(a)$
the transverse velocity $u_y$
and streamwise vorticity
$u_y$
and streamwise vorticity $\omega _x$
along the streamwise slice
$\omega _x$
along the streamwise slice $x/c=0.3$
at
$x/c=0.3$
at $\tau =\tau _0$
and
$\tau =\tau _0$
and $\tau _1$
for the cases of
$\tau _1$
for the cases of $G=\pm 3$
with
$G=\pm 3$
with $y_0/c=0$
. For
$y_0/c=0$
. For $G=3$
, the TiV grows in size and intensity from
$G=3$
, the TiV grows in size and intensity from $\tau =\tau _0$
to
$\tau =\tau _0$
to $\tau _1$
. Regarding the
$\tau _1$
. Regarding the $G=-3$
case, we can see coherent positive streamwise vorticity below the wing near the tip – the reversed TiV – at
$G=-3$
case, we can see coherent positive streamwise vorticity below the wing near the tip – the reversed TiV – at $\tau =\tau _1$
, which is not present at
$\tau =\tau _1$
, which is not present at $\tau =\tau _0$
.
$\tau =\tau _0$
. $(a)$
Transverse velocity
$(a)$
Transverse velocity $u_y$
(colour contours) and streamwise vorticity
$u_y$
(colour contours) and streamwise vorticity $\omega _x$
(line contours) along the streamwise slice
$\omega _x$
(line contours) along the streamwise slice $x/c=0.3$
at
$x/c=0.3$
at $\tau =\tau _0$
and
$\tau =\tau _0$
and $\tau _1$
for the cases of
$\tau _1$
for the cases of $G=3$
and
$G=3$
and $-3$
with
$-3$
with $y_0/c=0$
. Solid-line contours correspond to positive streamwise vorticity while dashed-line contours correspond to negative streamwise vorticity.
$y_0/c=0$
. Solid-line contours correspond to positive streamwise vorticity while dashed-line contours correspond to negative streamwise vorticity. $(b)$
Velocity
$(b)$
Velocity $u_y$
(colour contours and black line contours) and
$u_y$
(colour contours and black line contours) and $\omega _z$
(green line contours) around the 2-D wing and the spanwise slice along
$\omega _z$
(green line contours) around the 2-D wing and the spanwise slice along $z/c=0.35$
of the square wing at
$z/c=0.35$
of the square wing at $\tau =\tau _1$
for
$\tau =\tau _1$
for $G=3$
and
$G=3$
and $-3$
.
$-3$
.

Additionally, in figure 10 $(b)$
, we compare the transverse velocity
$(b)$
, we compare the transverse velocity $u_y$
of the 2-D wing with the spanwise slice along
$u_y$
of the 2-D wing with the spanwise slice along $z/c=0.35$
of the square wing for
$z/c=0.35$
of the square wing for $G=\pm 3$
. For
$G=\pm 3$
. For $G=3$
, the region with a large downward velocity above the wing (indicated by the arrow in figure 10
b) is located lower for the square-wing case compared with the 2-D wing case. This indicates the downwash effects of the enhanced TiVs. For
$G=3$
, the region with a large downward velocity above the wing (indicated by the arrow in figure 10
b) is located lower for the square-wing case compared with the 2-D wing case. This indicates the downwash effects of the enhanced TiVs. For $G=-3$
, a larger upward velocity distribution below the wing is observed in the square-wing case compared with the 2-D wing case, suggesting the upwash effects of the reversed TiVs.
$G=-3$
, a larger upward velocity distribution below the wing is observed in the square-wing case compared with the 2-D wing case, suggesting the upwash effects of the reversed TiVs.
Appendix B. Verification and validation
We verify the grid convergence of the current mesh against a refined mesh. The current mesh, referred to as a regular mesh, consists of approximately $4.9\times 10^6$
control volumes. The refined mesh comprised of approximately
$4.9\times 10^6$
control volumes. The refined mesh comprised of approximately $2.4 \times 10^7$
control volumes includes increased resolution in all three spatial directions around the wing. Grid convergence is assessed by comparing the lift coefficient change and the instantaneous Q-criterion isosurface during the gust encounter with
$2.4 \times 10^7$
control volumes includes increased resolution in all three spatial directions around the wing. Grid convergence is assessed by comparing the lift coefficient change and the instantaneous Q-criterion isosurface during the gust encounter with $(G,y_0/c) = (-3,0)$
, as shown in figure 11. We also validate the current mesh and numerical simulation with the time-averaged lift coefficient examined in Zhang et al. (Reference Zhang, Hayostek, Amitay, Burtsev, Theofilis and Taira2020) and Ribeiro et al. (Reference Ribeiro, Neal, Burtsev, Amitay, Theofilis and Taira2023), as shown in table 1. Based on these agreements, the regular mesh is deemed sufficient to perform the direct numerical simulations in this study.
$(G,y_0/c) = (-3,0)$
, as shown in figure 11. We also validate the current mesh and numerical simulation with the time-averaged lift coefficient examined in Zhang et al. (Reference Zhang, Hayostek, Amitay, Burtsev, Theofilis and Taira2020) and Ribeiro et al. (Reference Ribeiro, Neal, Burtsev, Amitay, Theofilis and Taira2023), as shown in table 1. Based on these agreements, the regular mesh is deemed sufficient to perform the direct numerical simulations in this study.
Validation of the present simulation. Zhang et al. (Reference Zhang, Hayostek, Amitay, Burtsev, Theofilis and Taira2020) use an incompressible flow solver whereas the current study uses the compressible flow solver.

Lift coefficient change for the $(G,y_0/c) = (-3,0)$
case with the regular and refined meshes. A front view of the instantaneous Q-criterion isosurface
$(G,y_0/c) = (-3,0)$
case with the regular and refined meshes. A front view of the instantaneous Q-criterion isosurface $Qc^2/u_\infty ^2=6$
around the second lift peak is also shown for the two different meshes.
$Qc^2/u_\infty ^2=6$
around the second lift peak is also shown for the two different meshes.


 (a)
(a) (b)
(b) (c)
(c)
 G={−1.2,−3,1.2,3}
 τ=τ1
τ=τ1 τ2
τ2 τ3
τ3 τ4
τ4
 ωz
ωz G={−1.2,−3,1.2,3}
 τ=τ1
τ=τ1 τ4
τ4 Le
Le ωz
ωz
 G=1.2
G=1.2 3
3 Le
Le ωz
ωz z/c=0
z/c=0 z/c=0.48
 τ0=−0.6
 τ=τ1
τ=τ1 τ4
τ4
 G=−1.2
 −3
−3
 G=3
G=3 −3
−3 y0/c={−0.25,0,0.25}
 Le
Le ωz
ωz G=±3
G=±3 y0/c=±0.25
 τ=τ1
τ=τ1 τ3
τ3 τ=τ1
τ=τ1 ωz=−20
 G=3
G=3 ωz=20
ωz=20 G=−3
G=−3 y0/c=0
 ±0.25
±0.25
 Le
Le ωz
ωz τ=τ1
τ=τ1 τ3
τ3 y0/c=±0.25
 Q=5
Q=5 ωz
ωz τ=0
τ=0 (G,y0/c)=(3,−0.25)
 (−3,0.25)
 (a)
(a) uy
uy ωx
ωx x/c=0.3
 τ=τ0
τ=τ0 τ1
τ1 G=3
G=3 −3
−3 y0/c=0
 (b)
(b) uy
uy ωz
ωz z/c=0.35
 τ=τ1
τ=τ1 G=3
G=3 −3
−3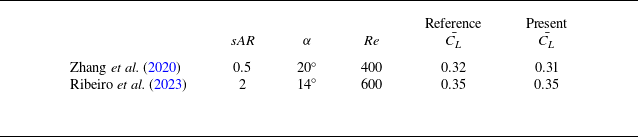

 (G,y0/c)=(−3,0)
 Qc2/u∞2=6
 Open access

