


Introduction
Systemic lupus erythematosus (SLE) is a chronic multisystem autoimmune disease associated with significant morbidity and reduced life expectancy (Smith & Gordon, Reference Smith and Gordon2010). SLE is nine times more common in women than men and most commonly presents in women of reproductive age. SLE patients present with variable clinical features ranging from mild rash and arthritis to severe, even life-threatening renal, hematologic, or central nervous system manifestations. The disease course is relapsing and remitting and the clinical picture is often complicated by the simultaneous presence of inflammation due to lupus disease activity, chronic multiorgan damage, medication side effects, infection and other co-morbidities including anxiety and depression (Smith & Gordon, Reference Smith and Gordon2010).
Cognitive dysfunction is common in SLE with reported prevalence varying from 20 to 81%. The broad range of these estimates is due, at least in part, to methodological differences in test selection, how impairments were defined and comparator groups (Al Rayes et al., Reference Al Rayes, Tani, Kwan, Marzouk, Colosimo, Medina-Rosas, Mustafa, Su, Lambiris and Mosca2018; Hanly & Fisk, Reference Hanly and Fisk2011; Raghunath et al., Reference Raghunath, Guymer, Glikmann-Johnston, Golder, Kandane Rathnayake, Morand, Stout and Hoi2022). Cognitive dysfunction is reported by many SLE patients to be one of the most distressing symptoms of their disease (Al Rayes et al., Reference Al Rayes, Tani, Kwan, Marzouk, Colosimo, Medina-Rosas, Mustafa, Su, Lambiris and Mosca2018; Arntsen et al., Reference Arntsen, Wildman and Gross2018), affecting their quality of life and employment (Appenzeller et al., Reference Appenzeller, Cendes and Costallat2009; Panopalis et al., Reference Panopalis, Julian, Yazdany, Gillis, Trupin, Hersh, Criswell, Katz and Yelin2007; Raghunath et al., Reference Raghunath, Guymer, Glikmann-Johnston, Golder, Kandane Rathnayake, Morand, Stout and Hoi2022). Despite this high reported prevalence, screening for cognitive dysfunction and formal testing of cognition is rarely performed as part of clinical assessment of SLE patients, resulting in significant under-detection. Consequently, most patients who experience cognitive decline in the context of SLE are not assisted with the psychoeducational and other nonpharmacological strategies that may help them deal with cognitive changes. Furthermore, unlike many other manifestations of SLE, for which we have treatments with substantiated benefits, no evidence-based options yet exist for pharmacological management of cognitive dysfunction in SLE (Kello et al., Reference Kello, Anderson and Diamond2019).
Previous studies examining cognition in SLE have pinpointed some of the cognitive domains involved (Glanz et al., Reference Glanz, Schur, Lew and Khoshbin2005; Kozora et al., Reference Kozora, Arciniegas, Filley, West, Brown, Miller, Grimm, Devore, Wingrove and Zhang2008; Kozora et al., Reference Kozora, Ellison and West2004; Kozora et al., Reference Kozora, Zell, Swigris, Strand, Duggan, Burleson and Make2015; Olazarán et al., Reference Olazarán, López-Longo, Cruz, Bittini and Carreño2009). The most commonly affected cognitive domains are attention, episodic memory, working memory, and executive function, whereas performance on tests of language, reasoning, and motor speed is less often affected. The relative severity of the domains affected in SLE has not been characterized in detail and is one of the aims of our study. At the level of individual studies, however, results from a given cognitive test are often inconsistent. In addition, varied definitions of cognitive dysfunction have been applied, both in terms of cut-offs used and application of normative data, with many studies not adjusting for education level or premorbid IQ (Hanly & Fisk, Reference Hanly and Fisk2011). Therefore, a better understanding of cognitive dysfunction in SLE is needed to improve screening and assessment protocols for both clinical and research purposes. Further, characterization of the cognitive deficits enables comparisons to cognitive dysfunction in other conditions, which may provide insights into pathogenesis.
This study aims to characterize patterns of cognitive deficits in SLE patients and to measure the prevalence of cognitive dysfunction in a well-characterised SLE cohort. Specifically, our aim was to extend the understanding of cognitive domains affected in SLE, by assessing a broad range of cognitive domains, using a well-matched healthy control group, and comparing several quantitative definitions of cognitive dysfunction. We hypothesized that patients with SLE had deficits in tests of attention, working memory, executive function, and episodic memory, consistent with published reports. Further, by comparing the SLE group to a well-matched healthy control group, we aimed to extend the literature, to describe which cognitive tests highlight areas of weakness, relative to strengths in performance.
Methods
Participants
We prospectively studied 95 SLE participants consecutively recruited from the Monash Lupus clinic (Melbourne, Australia), a hospital based tertiary service, between October 2018 and February 2020. All were enrolled in the Australian Lupus Registry and Biobank (ALRB), a national multi-centre registry in which longitudinal clinical data is prospectively collected (O’Neill et al., Reference O’Neill, Morand and Hoi2017). All patients fulfilled classification criteria for SLE; either the 1997 American College of Rheumatology (ACR) revised criteria (Hochberg, Reference Hochberg1997) or the 2012 Lupus International Collaborating Clinics (SLICC) criteria (Petri et al., Reference Petri, Orbai, Alarcon, Gordon, Merrill, Fortin, Bruce, Isenberg, Wallace, Nived, Sturfelt, Ramsey-Goldman, Bae, Hanly, Sanchez-Guerrero, Clarke, Aranow, Manzi, Urowitz, Gladman, Kalunian, Costner, Werth, Zoma, Bernatsky, Ruiz-Irastorza, Khamashta, Jacobsen, Buyon, Maddison, Dooley, van Vollenhoven, Ginzler, Stoll, Peschken, Jorizzo, Callen, Lim, Fessler, Inanc, Kamen, Rahman, Steinsson, Franks, Sigler, Hameed, Fang, Pham, Brey, Weisman, McGwin and Magder2012). We restricted inclusion to adults under the age of 65 to avoid comorbid cognitive disorders associated with ageing. Patients with neurological conditions not definitively related to SLE (such as traumatic brain injury) were also excluded.
We also recruited a demographically matched healthy control (HC) group (N = 48), who were matched on age, gender and premorbid IQ to the SLE group. Exclusion criteria included a personal history of autoimmune disease (except stable thyroid disease), presence of a central nervous system neurological condition, any organ failure, or use of immunosuppressive therapy. Control participants were recruited from friends and family of the SLE group participants as well as via advertisement in the local community, university and hospital staff.
In these multicultural cohorts, in order to be inclusive but ensure sufficient English language proficiency to complete the cognitive assessments, inclusion criteria for both groups required participants to have completed at least part of their high school years in English. This study was completed in accordance with Helsinki Declaration research standards (Association, Reference Association2001). All participants provided informed written consent and the study protocol was approved by the Monash Health Human Ethics Committee. Participants received no monetary compensation for this study.
Cognitive testing
We performed cross-sectional cognitive assessment of all participants using the 1-hr conventional neuropsychological test battery recommended by the American College of Rheumatology for use in SLE patients (Liang et al., Reference Liang, Corzillius, Bae, Lew, Fortin, Gordon, Isenberg and Denburg1999). This battery has been validated against a longer 4 hr neuropsychological test battery (Kozora et al., Reference Kozora, Thompson, West and Kotzin1996) in SLE patients with 90% agreement (Kozora et al., Reference Kozora, Ellison and West2004) in classifying patients as having cognitive impairment. Cognitive tests were administered by a trained examiner (SR) under the guidance of a clinical neuropsychologist (YGJ).
The California Verbal Learning Test (CVLT, version III) was used to measure verbal learning and memory (Delis, 2017). In this word-list learning test, the examiner read a list of 16 words and asked participants to immediately recall as many words as possible. The same word list and recall attempt is then repeated five times, followed by a distracter word list trial. Participants were then asked to recall the initial list again (known as the short delay recall) and subsequently 20 min later are again asked to recall the list (long delay recall). Finally, participants were asked to identify words from the list with yes or no responses when read a longer list including distracters (48 words total). The outcome measures used were the sum of correct items from the immediate recall trials one to five (maximum score of 80), both the short and long delay recall scores (maximum score 16) and the recognition discriminability index (RDI) calculated from the list word identification task which reflects the ability of the participant to identify target items and reject distractor items as a percentage (Delis et al., Reference Delis, Kramer, Kaplan and Ober2017).
The Rey-Ostrrieth Complex Figure Test (ROCF, Form A) was used to assess visuospatial construction and memory (Rey, Reference Rey1941). In this paper and pencil task, participants were required to copy a complex figure, and 30 min later were asked to recall this figure on a blank piece of paper. The outcome measures were the copy and 30-min recall scores, which were each marked using a detailed rubric (score range 0–36).
The Coding test from the Wechsler Adult Intelligence Scale fourth edition (WAIS-IV), was used to assess processing speed and attention (Wechsler, Reference Wechsler2008). In this pencil and paper test participants must fill in as many empty boxes as they can within 2 min with the correct symbols corresponding to numbers using the provided key. The outcome measure is the number of correct symbols entered (raw score).
The Letter Number Sequencing test from the WAIS-IV was used to assess verbal working memory and attention (Wechsler, Reference Wechsler2008). In this test, the examiner reads sequences of mixed numbers and letters and participants are required to repeat them back with numbers and letters in sequential numerical and alphabetical order. If participants are able to order sequences correctly, they progress to attempt longer sequences up to a maximum of 30 sequences. The outcome measure is the number of sequences recalled correctly (raw score).
The Controlled Oral Word Association Test was used to assess verbal fluency (Benton, Reference Benton1969). We tested categorical fluency by asking participants to name as many animals as they could in 1 min, with the outcome measure being the number of unique responses. Phonemic fluency was measured by three 1-min trials in which participants were asked to name as many words as they could beginning with the letters F, A and S with the outcome measure being the summation of correct responses over these three trials.
The Trail Making Tests A and B were used to assess psychomotor speed, complex attention and cognitive sequencing (Bowie & Harvey, Reference Bowie and Harvey2006). In the Trail Making Test A participants were required to join a jumbled group of numbers in consecutive order as quickly as possible using pen and paper. In the Trail Making Test B participants were given a mixed group of numbers and letters and were required to join these in consecutive order alternating between number and letter (i.e., 1A-2B-3C) as quickly as possible. The outcome measure for both parts A and B was time in seconds.
The Stroop Colour-Word test (Victorian version) was used to assess cognitive flexibility and high-level attention (Strauss et al., Reference Strauss, Sherman and Spreen2006). In this task, participants are shown three cards and for each card are asked to name the colour of the consecutive items as quickly as possible. The first card depicts six rows of alternating red, blue, yellow and green dots and the second card shows six rows of random words in these four colors. The third card has six rows of the words red, blue, yellow and green in multiple orders in alternating colors. The outcome measure for this test is the time taken to read the third card in seconds.
A Finger Tap Test was used to measure fine motor speed (Strauss et al., Reference Strauss, Sherman and Spreen2006). Participants tapped a counter as many times as possible in 25 s performing four trials with each hand. The outcome measures were the average number of taps for both the dominant and non-dominant hands.
The Test of Premorbid Functioning (TOPF) was used to assess premorbid IQ to match the academic ability of the two groups (Wechsler, Reference Wechsler2011). This is a reading test where participants are asked to read a list of 70 words with atypical pronunciations. The outcome measure is a scaled IQ score, which is determined using the correct number of pronounced words and an age-based reference table.
We first looked at complete American College of Rheumatology battery of 15 test scores which can be split into the following seven domains; visual memory, verbal memory and learning, verbal fluency, working memory, processing speed, complex attention and psychomotor speed. For the purpose of defining cognitive dysfunction, we then selected one test to represent each domain. Where there was more than one test for a specific domain, we selected the test with the best distribution (most normally distributed, or able to be transformed to a normal distribution to allow comparison to the HC group mean) and largest effect size (comparing SLE and HC groups). Using this method, the seven tests included when defining cognitive dysfunction were the Rey-Ostrrieth Complex Figure Test delayed recall score (visual memory), California Verbal Learning Test trials 1–5 sum (verbal memory and learning), Controlled Oral Word Association Test FAS sum (verbal fluency), Letter Number Sequencing raw score (working memory), Coding raw score (processing speed), Trail Making Test part B time (complex attention), and finger tap dominant hand average score (psychomotor speed). We considered whether a cognitive composite measure would have been more useful in describing these data, but elected to present the individual cognitive tests instead to preserve a more detailed account of the performance of individual tests within this cohort.
Statistical analysis
SLE and HC groups comparison
Demographic and clinical characteristics were compared between groups using Mann-Whitney, Chi-squared or t-tests depending on the data distribution and variable types. To compare cognitive performance between the SLE group and healthy controls we used independent samples t-tests or Mann-Whitney U tests for each of the cognitive tests separately, depending on data distribution. Normality was assessed both visually using histograms and with Shapiro-Wilk as well as skewedness and kurtosis testing (sktest STATA function). Four test scores were log10 transformed to ensure normality (CVLT RDI, Trail making Test A and B, and Stroop). Two tests were non-normally distributed due to ceiling effects, CVLT short and long delay, mainly from the HC group, and were unable to be normalized with transformation. Although these variables were included when comparing cogntive performance between groups, we excluded them from the analysis for defining prevalence of cognitive deficits, and from the cluster analysis. To determine the magnitude of effect in group comparison for each cognitive test, effect size was estimated using Cohen’s d statistic. All data analyses and visualizations were performed using STATA (version 15) and R (version 4.0.2) software.
Heatmapping and cluster analysis
To visualize individual patient data, we used heat mapping of cognitive test results ordered by Z-scored mean (average across all tests) generated using the Heatmap() function from the [ComplexHeatmap] R package. Ten cognitive tests were chosen for inclusion in the cluster analysis, because our sample size limited us to a maximum of ten covariates to form a robust model. This included the same seven tests that were used when defining cognitive dysfunction (as described above) as well as three additional tests (COWAT Animals, Trail making test A, and Stroop interference condition) which had good distribution and effect size. The clustering tendency of the data set was evaluated using Hopkins statistics (using get_clust_tendency() function from the [factoextra] R package), in combination with the visual assessment of cluster tendency algorithm which is based on the assessment of the ordered pairwise dissimilarity matrix using Euclidean distance (fviz_dist() function from the R [factoextra] package). Additional details regarding the cluster analysis method are provided in supplementary information.
Prevalence of cognitive impairment
To determine the prevalence of cognitive dysfunction within the SLE cohort, we first computed standard deviations (SD) for each score for each patient using the health control group mean and SD as the comparison. We then classified participants as having significant or lesser impairment on a given task using two different thresholds of impairment. These classifications were based on American College of Rheumatology 2007 response criteria for neurocognitive impairment in SLE clinical trials, which proposed a threshold of >2 SD below normative data (the bottom 2.5th percentile) as significant, and a threshold of >1.5 SD as a lesser level of impairment (Mikdashi, Reference Mikdashi2007). Once we classified the impairment levels for each test for each participant, we determined the percentage of SLE patients with cognitive impairment specifying the number of domains affected.
Results
Group comparisons on sample demographics
In the SLE cohort, median (range) age was 45 years (21–64), with 66% having completed tertiary education (Table 1). 62% of SLE participants were Caucasian and the rest predominantly of Asian ethnicity. The SLE and HC groups were well matched demographically with no significant differences between the two groups in age, gender, ethnicity, premorbid IQ or education level (Table 1). There were significantly higher rates of unemployment, depression and anxiety in the SLE group compared to HC. The SLE group had median (range) disease duration of 12.5 years (0.2–38.7 years), disease activity score (SLEDAI-2K (Touma et al., Reference Touma, Urowitz and Gladman2010)) of 3 (0–12), and damage index (SLICC-SDI) score of 1 (0–7) (Table 2). A history of cerebrovascular disease was present in 8%, seizures in 6% and cranial neuropathy in 5% of the SLE group (Table 2).
Demographic and clinical characteristics of study groups

P-values derived from Mann-Whitney, Chi-squared and t-test tests.
a Premorbid IQ measured by Test of Premorbid Functioning scaled score.
Acronyms: SLE – Systemic Lupus Erythematosus, HC – Healthy Controls.
Clinical characteristics of SLE patients (n = 95)

ANA: anti-nuclear antibodies, dsDNA: anti-double stranded DNA antibodies, APLS: anti-phospholipid syndrome antibodies (Anti-cardiolipin, Beta2glycoprotein and lupus anticoagulant), SLEDAI-2K: Systemic Lupus Erythematosus Disease Activity Index 2000, SDI: Systemic Lupus International Collaborating Clinics-American College of Rheumatology Damage Index.
Patterns of cognitive dysfunction
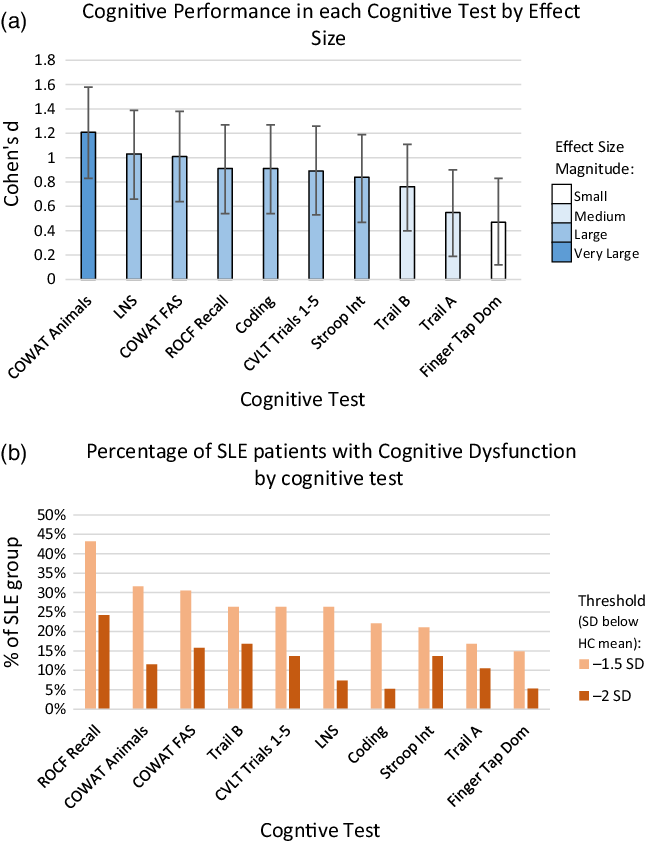
The SLE group performed significantly worse than the HC group on every cognitive test. Table 3 shows the comparisons between the raw score means for each group. Using conventional qualitative descriptors for effect sizes, the effect sizes are considered large or very large for verbal fluency, Letter-Number Sequencing, ROCF recall, Coding, CVLT list learning, and the interference condition of the Stroop Test (Figure 1). The two Trail-making conditions had medium effects, and the finger tapping test had a small effect.
Summary of cognitive performance of SLE and healthy control groups

a Values are given as mean ± SD and range; a higher score indicates better performance except for the Trail Making Test and Stroop Test.
b As measured by Cohen’s d.
c Percentage of SLE patients performing ≥2 SD below the HC group mean in the corresponding task (bottom 2.5th percentile).
d Non-normally distributed hence reported as median and comparison using Mann-Whitney U tests; Cohen’s d has still been performed which we acknowledge is not methodologically robust for non-normally distributed data but has been included here for the purpose of comparison.
e Time in Seconds.
f Dominant finger tap n = 94 and non-dominant side n = 92 as patients with hand weakness or severe deformity were excluded.
SLE: Systemic Lupus Erythematosus, HC: Healthy Control, CVLT: California Verbal Learning Test, RDI: Recognition Discriminability Index, ROCF: Rey-Ostrrieth Complex Figure Test, LNS: Letter Number Sequencing subset of the Wechsler Adult Intelligence Scale IV, COWAT: Controlled Oral Word Association Test, Stroop Int: Stroop test interference condition.
Cognitive performance of SLE group by cognitive test. a. Cognitive Performance in each Cognitive Test by Effect Size. Magnitude of effect as measured by Cohen’s d in SLE (N = 95) compared to HC group of each cognitive test. Bars indicate 95% confidence intervals. b. Percentage of SLE patients with Cognitive Dysfunction by cognitive test. Percentage of SLE patients (N = 95) with impairment in each cognitive test using a threshold of 1.5 or 2 SD below the HC group mean. SLE: Systemic Lupus Erythematosus, HC: Healthy Control, SD – Standard Deviations, ROCF Recall: Rey-Ostrrieth Complex Figure Test Recall Score, COWAT: Controlled Oral Word Association Test. Trail A & B: Trail making test subsets A and B, CVLT Trails 1–5: California Verbal Learning Test trails 1–5 sum, LNS: Letter Number Sequencing subset of the Wechsler Adult Intelligence Scale IV raw score, Coding: Coding subset of the Wechsler Adult Intelligence Scale IV raw score, Stroop Int: Stroop test interference condition, Finger tap dominant – Finger tapping speed dominant hand.
Visual inspection of cognitive test performance at the individual SLE participant level using heat mapping revealed substantial variability between patients in both the severity and patterns of cognitive deficits (Figure 2). We utilized cluster analysis techniques to identify underlying structures in the data set, to determine whether there were specific patterns among SLE patients with varying performance on cognitive testing. The data set was considered clusterable based on Hopkins statistics value of 0.64 and the ordered pairwise dissimilarity matrix shown in Supplementary Figure 1. Compared to hierarchical clustering, k-means appeared to be the optimal clustering approach (see Supplement). Poor performance of hierarchical clustering was further confirmed with a coefficient of correlation between cophenetic distances and the Euclidean distances lower than 0.75 for all tested linkage methods. The optimal number of clusters (k = 2) for k-means clustering was confirmed by the elbow method, the silhouette method and the NbClust function, albeit not by the gap statistics (average silhouette width: 0.26; Dunn index: 0.22, Supplementary Figures 2A–D).
Heat map of individual SLE patients ordered from lowest to highest mean cognitive test score. Each row represents a cognitive test and each column an individual SLE patient (n = 95). The brown gradient colour bar on the row above the heatmap represent the ordering of SLE patients from lowest to highest mean cognitive test score (average across all 10 select tests – see Methods). The timed tests Stroop test, Trail A and Trail B tests were inversed so that higher Z scores indicate better performance (i.e. lower times), as all other tests are scored as higher Z scores indicating better performance. The highest and lowest values are displayed as pure blue or red, respectively. SLE: Systemic Lupus Erythematosus, ROCF: Rey-Osterrieth Complex Figure Test, CVLT: California Verbal Learning Test, COWAT: Controlled Oral Word Association Test. LNS: Letter Number Sequencing subset of the Wechsler Adult Intelligence Scale IV, Coding: Coding subset of the Wechsler Adult Intelligence Scale IV, TMT A & B: Trail making test subsets A and B, Stroop Int: Stroop test interference condition, Finger tap dominant – Finger tapping speed dominant hand.

We identified that two clusters of patients optimally fitted the data set (Figure 3a). Visual inspection via heat mapping, with SLE participants grouped according to their cluster number, did not reveal any specific pattern of affected cognitive domains within the more impaired cluster 1 (Figure 3b), but rather segregated participants on the magnitude of their cognitive performances, along with demographic characteristics (Table 4). Cluster 1 SLE patients were significantly younger, had higher premorbid IQ, and better performance on cognitive tests compared to Cluster 2. Performance on individual cognitive tests was consistently better in Cluster 1 with all mean cognitive test Z-scores being within 1 SD of the HC mean (mean Z-scores range −0.14 to −0.7) compared to Cluster 2 patients who demonstrated significant impairment across all tests (mean Z-scores range −0.9 to −2.3). Following the identification of these two clusters and the high rate of cognitive impairment in Cluster 2, we conducted an post hoc exploratory analysis to determine whether rates of psychiatric illness were also higher in this group. There were significantly higher rates of psychiatric illness in Cluster 2 compared to Cluster 1 (62% vs. 28%) (Table 4).
Cluster analysis of SLE patients using k-means algorithm. a: Metric multidimensional scaling plot of k-means cluster analysis of SLE patient. b: Heat map of cognitive test performance organised by cluster number. Unsupervised clustering of 94 SLE patients performed using k-means algorithm with K = 2. (a) Metric multidimensional scaling (MDS) plot of clusters of SLE patients; the green dots and orange triangles represent the two clusters of patients with SLE, namely Cluster 1 and Cluster 2. (b) Heatmap of the clusters of SLE patients; the green and orange colours on the row above the heatmap represent the two clusters of patients with SLE, where the highest and lowest values are displayed as pure blue and pure red, respectively. Each row represents a cognitive test and each column one individual SLE patient. Patients are grouped by cluster. The timed tests Stroop test, Trail A and Trail B tests were inversed so that higher Z scores indicate better performance (i.e. lower times), as all other tests are scored as higher Z scores indicating better performance. Z-scores were standardised (Z-score) across the 10 tests in order to perform cluster analysis. The highest and lowest values are displayed as pure blue and pure red, respectively. SLE: Systemic Lupus Erythematosus, ROCF: Rey-Ostrrieth Complex Figure Test, CVLT: California Verbal Learning Test, COWAT: Controlled Oral Word Association Test. LNS: Letter Number Sequencing subset of the Wechsler Adult Intelligence Scale IV, Coding: Coding subset of the Wechsler Adult Intelligence Scale IV, TMT A & B: Trail making test subsets A and B, Stroop Int: Stroop test interference condition, Finger tap dominant – Finger tapping speed dominant hand.

Comparison of demographics and cognitive test results by cluster

a Comparisons between the SLE and healthy control groups using Mann-Whitney, Chi squared and t tests.
b Z-scores in comparison to HC group mean.
HC: Healthy Control, ROCF: Rey-Ostrrieth Complex Figure Test, CVLT: California Verbal Learning Test, COWAT: Controlled Oral Word Association Test. LNS: Letter Number Sequencing subset of the Wechsler Adult Intelligence Scale IV, Coding: Coding subset of the Wechsler Adult Intelligence Scale IV, TMT A & B: Trail making test subsets A and B, Stroop Int: Stroop test interference condition, Finger tap dominant – Finger tapping speed dominant hand.
Prevalence of cognitive dysfunction in SLE
In terms of the prevalence of cognitive dysfunction, using the threshold of ≥ 2 tests 1.5 SD below the HC mean 49% of SLE patients were considered impaired (Table 5). Utilising a more conservative definition of cognitive dysfunction of ≥ 2 tests 2 SD below the HC mean, 19% of SLE patients were considered impaired.
Percentage of cognitively impaired SLE patients by threshold

Impairment defined by number of cognitive domains either 1.5 or 2 SD below healthy control group mean. Seven subtest scores were included; Rey-Ostrrieth Complex Figure Test (ROCF) Recall score, California Verbal Learning Test (CVLT) trials 1–5 sum, Controlled Oral Word Association Test (COWAT) FAS sum, Letter Number Sequencing raw score, Coding Raw score, Trail Making B test time and Finger tapping speed dominant hand average score. See Table 4 for specific domains of these tests.
SLE – Systemic Lupus Erythematosus, HC – Healthy Control, SD – Standard Deviations.
Discussion
Our study results provide unequivocal evidence that cognitive dysfunction is common in SLE, with SLE patients, as a group, performing worse on every cognitive test when compared to the HC group. In terms of the cognitive domains most often affected in SLE, attention and working memory had qualitatively larger effect sizes and motor speed was relatively less affected, findings generally consistent with previous studies in SLE (Coin et al., Reference Coin, Vilar-Lopez, Peralta-Ramirez, Hidalgo-Ruzzante, Callejas-Rubio, Ortego-Centeno and Perez-Garcia2015; Glanz et al., Reference Glanz, Schur, Lew and Khoshbin2005; Kozora et al., Reference Kozora, Arciniegas, Filley, West, Brown, Miller, Grimm, Devore, Wingrove and Zhang2008; Kozora et al., Reference Kozora, Ellison and West2004). We also found that verbal fluency was one of the most significantly affected domains, but previous studies have had inconsistent findings on this test, with some studies suggesting a similar prevalence of impairment to our findings (Coin et al., Reference Coin, Vilar-Lopez, Peralta-Ramirez, Hidalgo-Ruzzante, Callejas-Rubio, Ortego-Centeno and Perez-Garcia2015; Olazarán et al., Reference Olazarán, López-Longo, Cruz, Bittini and Carreño2009), while others reporting it to be relatively preserved (Glanz et al., Reference Glanz, Schur, Lew and Khoshbin2005; Kozora et al., Reference Kozora, Zell, Swigris, Strand, Duggan, Burleson and Make2015; Loukkola et al., Reference Loukkola, Laine, Ainiala, Peltola, Metsanoja, Auvinen and Hietaharju2003). Similarly, reports on psychomotor speed impairment in SLE have revealed inconsistent results (Emori et al., Reference Emori, Matsushima, Aihara, Ohta, Koike, Miyasaka and Kato2005; Glanz et al., Reference Glanz, Schur, Lew and Khoshbin2005; Loukkola et al., Reference Loukkola, Laine, Ainiala, Peltola, Metsanoja, Auvinen and Hietaharju2003; Monastero et al., Reference Monastero, Bettini, Del Zotto, Cottini, Tincani, Balestrieri, Cattaneo, Camarda, Vignolo and Padovani2001; Montero-Lopez et al., Reference Montero-Lopez, Santos-Ruiz, Navarrete-Navarrete, Ortego-Centeno, Perez-Garcia and Peralta-Ramirez2016; Nishimura et al., Reference Nishimura, Omori, Katsumata, Sato, Gono, Kawaguchi, Harigai, Mimura, Yamanaka and Ishigooka2015; Skeel et al., Reference Skeel, Johnstone, Yangco, Walker and Komatireddy2000); our findings place it among the least severely affected domains, although still significantly affected. The rationale of looking for consistent abnormality in specific functional domains is based on the possibility that these observations can give us further insight into which specific brain systems are most subject to the impact of SLE, which could then be further investigated with imaging studies.
Factors that are likely contributors to the inconsistent results in previous studies of cognitive dysfunction in SLE include diverse demographic and disease characteristics of the groups studied, and methods of defining cognitive dysfunction. Inclusion criteria for SLE patients in cognitive studies have ranged from only including SLE patients with prior psychiatric or neurological history (Cesar et al., Reference Cesar, Dwyer, Shucard, Polak, Bergsland, Benedict, Weinstock-Guttman, Shucard and Zivadinov2015; Covey et al., Reference Covey, Shucard, Shucard, Stegen and Benedict2012), to studies that specifically exclude these patients (Coin et al., Reference Coin, Vilar-Lopez, Peralta-Ramirez, Hidalgo-Ruzzante, Callejas-Rubio, Ortego-Centeno and Perez-Garcia2015; Glanz et al., Reference Glanz, Schur, Lew and Khoshbin2005; Kozora et al., Reference Kozora, Arciniegas, Filley, West, Brown, Miller, Grimm, Devore, Wingrove and Zhang2008; Mak et al., Reference Mak, Ren, Fu, Cheak and Ho2012; Montero-Lopez et al., Reference Montero-Lopez, Santos-Ruiz, Navarrete-Navarrete, Ortego-Centeno, Perez-Garcia and Peralta-Ramirez2016; Olazarán et al., Reference Olazarán, López-Longo, Cruz, Bittini and Carreño2009; Shucard et al., Reference Shucard, Parrish, Shucard, McCabe, Benedict and Ambrus2004; Skeel et al., Reference Skeel, Johnstone, Yangco, Walker and Komatireddy2000). Other inclusion criteria which have been applied inconsistently include high disease activity (Nishimura et al., Reference Nishimura, Omori, Katsumata, Sato, Gono, Kawaguchi, Harigai, Mimura, Yamanaka and Ishigooka2015), medication use (Nishimura et al., Reference Nishimura, Omori, Katsumata, Sato, Gono, Kawaguchi, Harigai, Mimura, Yamanaka and Ishigooka2015), neuroimaging changes (Emori et al., Reference Emori, Matsushima, Aihara, Ohta, Koike, Miyasaka and Kato2005), and combinations of these factors (Kozora et al., Reference Kozora, Zell, Swigris, Strand, Duggan, Burleson and Make2015). Given the likely effects of these factors on cognition, selection criteria for study participation would be expected to influence rates and even types of cognitive impairments found. For example, glucocorticoids may affect language abilities (Prado & Crowe, Reference Prado and Crowe2019) and SLE patients with past neurological history may have more deficits in psychomotor speed compared those with no neurological history (Loukkola et al., Reference Loukkola, Laine, Ainiala, Peltola, Metsanoja, Auvinen and Hietaharju2003). Finally, methods used to define cognitive dysfunction vary greatly regarding the data used for comparison, the cut-off definition thresholds used and whether individual tasks or composite measures were utilised. Some studies use comparison groups of healthy controls (Glanz et al., Reference Glanz, Schur, Lew and Khoshbin2005; Kozora et al., Reference Kozora, Ellison and West2004) while others use published normative data (Skeel et al., Reference Skeel, Johnstone, Yangco, Walker and Komatireddy2000), both with varying degrees of demographic matching. We used a HC group that was well-matched to the SLE group for age, gender, premorbid IQ and educational level, which are known to influence cognitive test abilities (Lezak et al., Reference Lezak, Howieson, Bigler and Tranel2012).
The finding of high inter-individual variability in the pattern of cognitive dysfunction, as demonstrated by heat mapping, has also been noted in prior studies (Monastero et al., Reference Monastero, Bettini, Del Zotto, Cottini, Tincani, Balestrieri, Cattaneo, Camarda, Vignolo and Padovani2001; Olazarán et al., Reference Olazarán, López-Longo, Cruz, Bittini and Carreño2009). This variability is potentially attributable at least in part to comorbidities and the diverse and variable clinical manifestations of SLE itself. Comorbidities such as mood disorders, fibromyalgia and discrete neurological events are common in SLE and may affect cognition. Mood disorders have been found to correlate with both cognitive symptoms and objective cognitive deficits in SLE (Hanly et al., Reference Hanly, Su, Omisade, Farewell and Fisk2012; Petri et al., Reference Petri, Naqibuddin, Carson, Wallace, Weisman, Holliday, Sampedro, Padilla and Brey2010; Vogel et al., Reference Vogel, Bhattacharya, Larsen and Jacobsen2011). Fibromyalgia is a common comorbidity in SLE (Torrente-Segarra et al., Reference Torrente-Segarra, Carbonell-Abell, Castro-Oreiro and Manresa-Dominguez2010), known to be associated with deficits on cognitive testing but especially impacts patient-reported cognitive symptoms (Raghunath et al., Reference Raghunath, Guymer, Glikmann-Johnston, Golder, Kandane Rathnayake, Morand, Stout and Hoi2022). Discrete neurological events such as seizures or stroke are common in SLE and have been found to increase the prevalence of cognitive dysfunction (Kozora et al., Reference Kozora, Ellison and West2004; Loukkola et al., Reference Loukkola, Laine, Ainiala, Peltola, Metsanoja, Auvinen and Hietaharju2003). However, it should be noted that cognitive dysfunction is found in the absence of overt neurological insult in SLE patients (Monastero et al., Reference Monastero, Bettini, Del Zotto, Cottini, Tincani, Balestrieri, Cattaneo, Camarda, Vignolo and Padovani2001; Nishimura et al., Reference Nishimura, Omori, Katsumata, Sato, Gono, Kawaguchi, Harigai, Mimura, Yamanaka and Ishigooka2015), which is consistent with our data in that less than 10% of patients had a history of stroke, seizure, or cranial neuropathy. Finally, cognitive function in SLE can be adversely affected by medications used in its treatment, many of which, including glucocorticoids and methotrexate, may negatively affect cognition (McLaurin et al., Reference McLaurin, Holliday, Williams and Brey2005; Meade et al., Reference Meade, Manolios, Cumming, Conaghan and Katz2018). The interplay between comorbidities, medication, and cognition within our SLE cohort will be the subject of separate study.
Our cluster analysis has confirmed the merit of a dichotomous approach in classifying SLE patients with cognitive dysfunction. Using an unbiased machine learning approach, we showed that the data forms two clusters with one being significantly cognitively impaired. The fact that both cognitive deficits and psychiatric illness are more common in this group suggests more brain involvement; the extent and structural impact of this warrants further research. The other cluster appears to have relatively preserved cognition, although across this cluster, many participants display abnormalities in one or more cognitive tests. Cluster analysis has previously been applied in IgG4 disease, another chronic multisystem autoimmune disease, delineating three to five groups of patients with specific clinical and serological associations (Li et al., Reference Li, Peng, Zhang, Zhang, Liu, Lu, Peng, Zhu, Xue and Zhao2020; Niwamoto et al., Reference Niwamoto, Handa, Matsui, Yamamoto, Yoshifuji, Abe, Matsumoto, Kodama, Chiba and Seno2021). To the best of our knowledge, this is the first application of cluster analysis to cognitive dysfunction in SLE. Given the heterogeneity of SLE cognitive dysfunction and the multiple etiological factors and comorbidities involved, we hypothesized that this approach would reveal subgroups that shared cognitive test performance characteristics, but instead we found the optimal cluster number was two, allowing us to dichotomise more severe patients from less severely affected patients. A cluster analysis only including impaired patients may be able to better delineate patterns among SLE patients with cognitive dysfunction. Larger cohorts would be required for such analysis, or multi-centre studies, again highlighting the importance of consistent methodologies.
In terms of prevalence, previous studies have reported on very wide differences in prevalence, but as we see in this study, the prevalence can differ widely based on the definition used. A metanalysis of 35 studies using conventional cognitive test batteries in SLE patients found that prevalence of cognitive dysfunction varied from 15 to 79% with a pooled prevalence of 38% (Al Rayes et al., Reference Al Rayes, Tani, Kwan, Marzouk, Colosimo, Medina-Rosas, Mustafa, Su, Lambiris and Mosca2018). We sought here to study a well-characterised cohort of SLE patients using a matched control group and pre-set thresholds for definition of cognitive dysfunction. The prevalence of cognitive dysfunction in SLE patients was 49%, based on a threshold of >1.5 SD below the mean of the HC group in at least two cognitive domains.
Our study demonstrates that the patterns of cognitive dysfunction in SLE are complex. As many SLE patients have preserved cognition, using whole group comparison to define impairment may result in an under representation of the impairment experienced by individual patients. For example, in the study of Kozora et al. (Kozora et al., Reference Kozora, Arciniegas, Filley, West, Brown, Miller, Grimm, Devore, Wingrove and Zhang2008), only one of 16 cognitive tests that were used significantly differed between the SLE participants and healthy controls at the group level. However, at least 10% of SLE participants were impaired on 13 of 16 cognitive tests, and 40–50% of patients had impaired performance on at least two cognitive measures. Hence, while it may seem cumbersome, future study should report both group level comparative data and the proportion of patients impaired, to accurately represent cognition within an SLE cohort.
Our study has certain limitations. The sample size of the subgroup of cognitively impaired SLE patients was insufficient to perform cluster analysis among impaired patients only; the prevalence of cognitive impairment was not known until the study was fully recruited and analyzed. Future research with a larger sample size to allow better exploration of patterns within cognitively impaired patients would be of benefit. Another potential limitation was the high education levels compared to previous studies (Kozora et al., Reference Kozora, Ellison and West2004; Olazarán et al., Reference Olazarán, López-Longo, Cruz, Bittini and Carreño2009), with 66% having completed tertiary education, however, we accounted for this by the use of a well-matched control group.
In conclusion, our study showed that there is a high prevalence of cognitive dysfunction in patients with SLE. This suggests that screening for cognitive dysfunction should be part of routine assessment of SLE, therefore we have evaluated a screening tool in a subsequent study (Raghunath et al., Reference Raghunath, Glikmann-Johnston, Morand, Stout and Hoi2021). Importantly, despite the clear separation between impaired and unimpaired patients, substantial variability in the pattern of cognitive dysfunction was seen, indicating that patients in whom screening leads to formal neuropsychological testing should be tested over a broad range of domains. Despite significant variability in performance of cognitive tests among individual patients, our unbiased mathematical approach has shown that on a group level patients cluster into impaired and unimpaired groups, supporting the use of a binary definition of cognitive dysfunction that could be applied in future studies.
Supplementary material
The supplementary material for this article can be found at https://doi.org/10.1017/S1355617722000418
Acknowledgements
We would like to acknowledge the participants in this study for volunteering their time.
Author contributions
SR performed data acquisition, data analysis and draft manuscript preparation. All authors contributed to study concept and design, data interpretation and manuscript editing.
Funding statement
There was no specific funding for this study.
Conflicts of interest
SR reports research grant from Lupus Victoria, SR also reports postgraduate scholarships from the National Health and Medical Research Council (NHMRC), Arthritis Australia and the Australian Rheumatology Association. YGJ is supported by Huntington’s Disease Society of America HD Human Biology Fellowship. FBV was supported by an AFA/ARA Heald Fellowship from Arthritis Australia, the School of Clinical Sciences at Monash Health, and an NHRMC Investigator Grant (EL1). FBV was also awarded a Grant from Janssen-Cilag outside the submitted work. EFM – reports grants from National Health and Medical Research Council, Australia, during the conduct of the study; EFM also reports grants and personal fees from Astra Zeneca, BristolMyersSquibb, Eli Lilly, EMD Serono, Janssen, GlaxoSmithKline, as well as personal fees from Biogen, Servier, and Amgen which were outside the submitted work. JCS – is a Director of Zindametrix, Pty Ltd, which provides cognitive assessment advice and assists in the implementation of cognitive testing in commercial and academic clinical trials in Huntington’s disease. She also conducts professional consultation in neuropsychology via Stout Neuropsych Pty Ltd. AH – reports grants from Astra Zeneca and EMD Serono outside the submitted work, sponsorship of the Australian Lupus Registry and Biobank (chaired by AH) is received from Janssen, BMS, Astra Zeneca, and UCB, and honoraria from Abbvie.


 Open access