


Teaching a required course in undergraduate methods is difficult. A cursory exploration of the Scholarship of Teaching and Learning (SoTL) literature in political science quickly confirms this basic assertion. Previous studies investigated when to sequence the methods course (Bergbower Reference Bergbower2017); how to sequence the material within the course (Bernstein and Allen Reference Bernstein and Allen2013); how games make the material more engaging and digestible for students (Kollars and Rosen Reference Kollars and Rosen2017); how the types of questions we ask in class contribute to learning (Combes Reference Combes2018); how to introduce R (Li Reference Li2021); various ways to overcome students’ self-created barriers to entry (Bos and Schneider Reference Bos and Schneider2009; Murphy Reference Murphy2015; Oldmixon Reference Oldmixon2018); and how to make innovative use of data visualizations (Rom Reference Rom2015). All of this research is only a sampling of the myriad ways that political science professors have tried to improve learning and engagement with statistical concepts. Clearly, it is an ongoing challenge.
Much of this previous research uses interventions and techniques that directly interact with students; therefore, there is little ambiguity around whether the treatments reach their intended targets. However, the emergence of online education (especially in response to the COVID-19 pandemic–induced lockdowns) has increased the prevalence of scenarios in which pedagogical innovations and interventions are delivered through asynchronous posting rather than synchronous interactions. These asynchronous scenarios require a way to monitor student engagement with the material in addition to standard efforts to determine whether that engagement is successful. This article describes an approach to the problem by asking: What is the relationship between student engagement and student performance? Using Blackboard (i.e., a resource for online learning) tracking data over 10 semesters, I found fairly modest effects of students’ engagement with online “data labs” on their performance.
This study aligns with the broader literature on teaching research methods referenced previously. However, this is a narrative about an intervention that had limited success: students who accessed the materials performed better, but the performance gains were not sufficiently large to improve overall course grades. These modest effects raise important questions about the limits of pedagogy in the face of trenchant resistance. That is, what happens when the obstacles described by Bos and Schneider (Reference Bos and Schneider2009) are not overcome? This research also contributes to a growing literature on how learning management systems (LMSs) and digital resources can be leveraged to collect and make productive use of data on students’ behaviors (Chang Reference Chang2025; Mathews and LaTronica-Herb Reference Mathews and LaTronica-Herb2013; Schuster Reference Schuster2023).
The article proceeds as follows. First, I review the literature on engagement, performance, and digital tools as it relates to political science and teaching methods. Second, I provide background on the methods course, what the data lab interventions consist of, and how students were performing in the course overall. Third, I discuss how the LMS was used to measure student engagement with the course materials. Next, the results show modest effects of engagement on student performance. The conclusion discusses how future research could build on these findings.
LITERATURE REVIEW
This study emerged from two well-acknowledged challenges in political science education: (1) it is difficult to teach methods, and (2) student engagement matters. During the past 10 to 15 years, these two foci of SoTL research in political science have been joined by a third pressing concern about online education and digital tools. I am writing at the intersection of these three areas. How does students’ online engagement with a digital resource impact their performance in an in-person methods course? Before the specifics of the course and the intervention are described, it is important to briefly discuss these three intersecting ideas.
Engagement typically is conceptualized in at least three ways: behavioral, emotional, and cognitive (Fredricks, Blumenfeld, and Paris Reference Fredricks, Blumenfeld and Paris2004). Behavioral refers to whether students are doing the actual work, emotional is how students feel about the course (or school in general), and cognitive focuses on how invested students are in their own learning. Fredricks, Blumenfeld, and Paris (Reference Fredricks, Blumenfeld and Paris2004) argued that studies of engagement, especially in terms of the relationship between engagement and student performance, are not always clear about which dimensions of engagement are driving the desired outcomes. This is a fair critique; however, in practice, it often is difficult to disentangle the facets of engagement because they interact with one another. A major thread of the literature on teaching methods is geared explicitly toward tackling students’ lack of emotional engagement as a means of increasing their behavioral and cognitive engagement (Bos and Schneider Reference Bos and Schneider2009; Oldmixon Reference Oldmixon2018). Bernstein and Allen (Reference Bernstein and Allen2013) found that a progression from qualitative to quantitative methods can ease student anxiety; Hansen (Reference Hansen2025) showed that collaborative projects are another sustainable way to increase students’ confidence and performance; Murphy (Reference Murphy2015) demonstrated that organizing the course around real examples of student research helps students by overcoming their fears and increasing their efficacy (i.e., emotional and cognitive engagement); and Kollars and Rosen (Reference Kollars and Rosen2017) emphasized how games can help to bypass the emotional obstacles to buying-in, doing the work, and learning.
In addition to methods courses, research on adaptive learning and simulations is premised on the idea that these approaches will improve learning via enhanced engagement. Brown et al. (Reference Brown, Grussendorf, Shea and DeMas2022) described an extensive redesign of a course on global issues to incorporate adaptive learning technology. A stated goal of that redesign was to increase the engagement with the class, and their overall results showed that the adaptive versions of the course received higher ratings from students and had lower DFW rates (i.e., a grade of D or F or withdrawal). Cox (Reference Cox2021) found that a simulation increased engagement but did not have a clear improvement in student performance. Shanks and Zhang (Reference Shanks and Zhang2024) further complicated the narrative by using an experimental method to elicit the effects of simulations on performance. They found strong and clear gains in student learning and self-reported engagement as a result of the simulations; however, the actual measures of engagement were not related to student performance. This brief discussion of recent scholarship is not intended to be exhaustive; however, it illustrates that questions about the relationship between engagement and student performance are well rooted in the political science education literature—especially in terms of teaching methods.
Course modality and digital tools more broadly comprise the third component of this study. The intervention (discussed in the next section) was a set of online videos and files of sample code that were available through the online LMS. Early studies of student engagement and online learning resources showed positive relationships (Chen, Lambert, and Guidry Reference Chen, Lambert and Guidry2010; Kuh and Hu Reference Kuh and Hu2001). More recent research agreed that digital technologies improve student engagement but found no effect on student performance (Rashid and Asghar Reference Rashid and Asghar2016). Studies in political science also are mixed. Adaptive learning strategies had less impact in online sections of a course (Brown et al. Reference Brown, Grussendorf, Shea and DeMas2022); online lecture videos did not increase student performance (Schuster Reference Schuster2023); and online sections have higher withdrawal rates (Bolsen, Evans, and Fleming Reference Bolsen, Evans and Fleming2016; Lee and Choi Reference Lee and Choi2011) but students who complete a course have higher levels of political knowledge and engagement. Bolsen, Evans, and Fleming (Reference Bolsen, Evans and Fleming2016) found that students rated the online, interactive textbook more highly than a traditional textbook. This is an important facet of engagement: Do students want to use the online resources? An understudied aspect of online platforms is that they provide instructors with analytics on student engagement (Bergbower and Valdes Reference Bergbower and Valdes2024; Clarke Reference Clarke2021; Mathews and LaTronica-Herb Reference Mathews and LaTronica-Herb2013). Chang (Reference Chang2025) used those analytics to show that Perusall (i.e., a social annotation platform for course readings) increased engagement in terms of whether students accessed and read the material. This study builds on Schuster (Reference Schuster2023) and Chang (Reference Chang2025) by using platform analytics to measure the effectiveness of online videos on student performance.
BACKGROUND
The focus of this study was a research methods course at my small Historically Black liberal arts college. Our curriculum has one required methods course for all political science majors. Its primary purpose is to introduce students to the basic methodological tools of the discipline. Beginning in Fall 2015, the course required students to complete a data project using statistical software. Students are assigned a dependent variable from a publicly available dataset and then they must formulate a research question; write a hypothesis; identify independent and control variables within their dataset; perform basic statistical tests (i.e., crosstabs, comparison of means, t-tests, and regression); and interpret their results.
CREATING A VIRTUAL DATA LAB
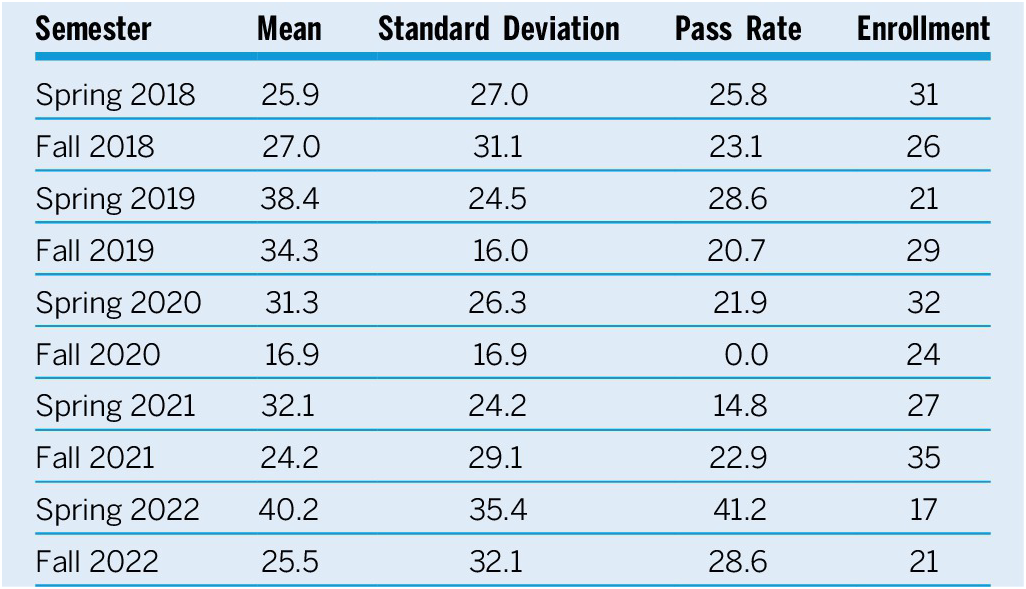
From Fall 2015 until Spring 2017, students were taught SPSS. In Fall 2017, I began teaching the course in R. For various reasons, the course did not go well that first semester. A valuable lesson from that experience was that the course needed a “data lab” dedicated solely to helping students learn R. I created a voluntary data lab in Spring 2018. Each lab session was designed to cover all of the code that was necessary to complete a specific aspect of the semester-long data project. Unfortunately, attendance at the voluntary sessions was extremely poor—only two or three students showed up consistently out of a class of 32.Footnote 1 To compensate for the lack of attendance, I created data lab materials for students to access via Blackboard. These materials took two primary forms: video tutorials and sample code with commented instructions. The videos were created by recording my computer screen and narrating each step while live coding. I then went back to more thoroughly comment the code that was written during the videos, which was made available as the sample code. In terms of content, the video and code were identical to what was covered in the in-person data lab session.
In response to students’ concerns about having such important course material delivered outside of regular class hours, the data lab was reintegrated into the normal class sessions in Fall 2018. Typically, between eight and 12 class sessions each semester were dedicated data labs. In those sessions, the entire class time was spent live coding in R, and that arrangement was maintained through the Spring 2020 semester. Throughout this period, updated versions of the videos and sample code were available on Blackboard. These materials covered the exact same content that was presented during in-class sessions. Finally, a formal co-requisite lab section debuted in Fall 2020, which created an additional two-hour block on students’ schedules. The course is structured such that the first 30 to 45 minutes of class time are used for live-coding demonstrations; during the remainder of the class time, students collaboratively apply the lesson to a specific assignment. Table 1 summarizes changes to the course. Throughout these various iterations, the data lab materials on Blackboard were constantly available. The purpose of this study was to gauge the impact of these materials on students’ performance on the data project.
Summary of Changes to Course Software and Data Labs

OVERVIEW OF STUDENT PERFORMANCE
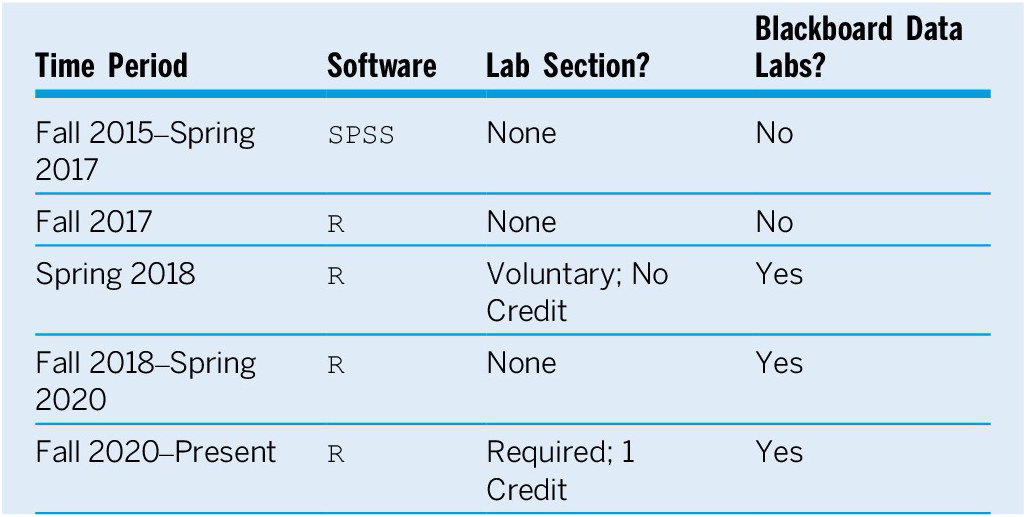
In general, students have not performed well in this course. Table 2 presents the proportion of points scored on the data projectFootnote 2 and the proportion of students who passed the course in each semester.Footnote 3
Mean Scores on Data Project Assignments and the Proportion of Students Who Passed the Course
The difficulty of the required methods course from the perspectives of students and instructors has been acknowledged repeatedly in the literature (Bernstein and Allen Reference Bernstein and Allen2013; Bos and Schneider Reference Bos and Schneider2009; Fisher and Justwan Reference Fisher and Justwan2018; Kollars and Rosen Reference Kollars and Rosen2017; Oldmixon Reference Oldmixon2018). Even considering this context, these rates are disturbingly low. The best-performing semester was Spring 2022, when students earned 40% of the points on the data project and 41% passed the course. Conversely, Fall 2020 had the worst performance, when students earned only 17% of the data project points and none earned a passing grade (Platt Reference Platt2026).
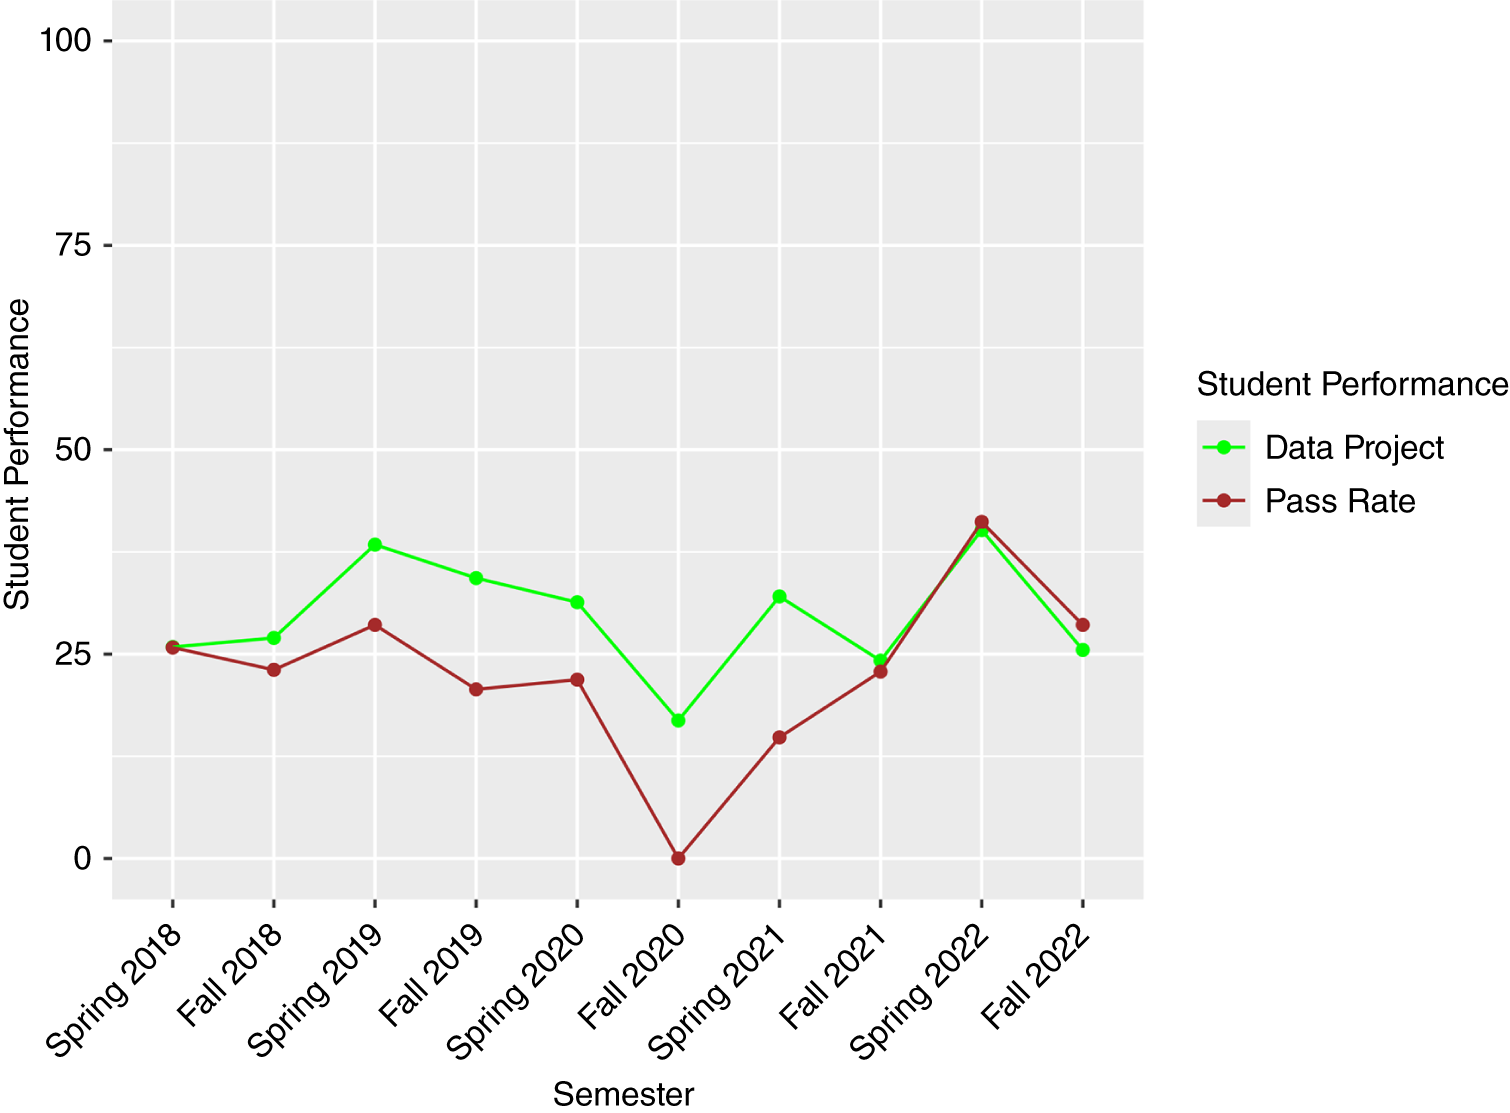
Figure 1 is a visualization of the data in table 2. It is interesting how the two lines diverged from one another from Fall 2018 to Spring 2021 but closely tracked one another beginning in Fall 2021 and throughout the remaining period of study.
Mean Data Project Scores and Pass Rates Over Time

A full investigation of the reasons for the low level of student performance is beyond the scope of this article. My own internal study of the problem revealed that a significant driver of the poor performance was that students did not even submit their assignments. The psychology of why students do not submit work is well beyond my expertise (clearly); however, it is possible that they believed they lacked sufficient resources to help them complete their assignments. This is the more narrow focus of the data lab intervention: providing students with tutorial videos and sample code should help them to overcome the initial “where do I start” hurdle for writing code in R. The following hypothesis was derived from that basic logic:
Hypothesis: Students who engage more with the data lab materials will score higher on the data project than those who engage less with the data lab materials.
…providing students with tutorial videos and sample code should help them to overcome the initial “where do I start” hurdle for writing code in R.
USING THE LMS TO MEASURE ENGAGEMENT
To test this hypothesis, engagement must be measured. I define engagement as the extent to which a student interacts with the course material. Thus, engagement with the data lab materials can be measured as the number of interactions that a student has with the videos or sample code. The LMS becomes extremely useful for this.
Blackboard is the LMS at my college. Whenever an instructor posts to Blackboard, there is an option to “Track Number of Views.” By default, this option is switched to “no.” In all of my courses, I select “yes” so that the LMS is tracking everything with which the students are interacting. An instructor can extract these tracking data for individual students using the “Course Reports” functionality within Blackboard.Footnote 4 These activity reports measure interaction in terms of both the amount of time and the number of times that an item was accessed. In my course, the data lab materials are links to either sample code that can be downloaded immediately or videos that are housed in the college’s cloud-storage platform. As a result, the length of time that an item was accessed would not be informative because students click the links and then are taken elsewhere. Therefore, engagement is measured by the number of times an item was accessed.
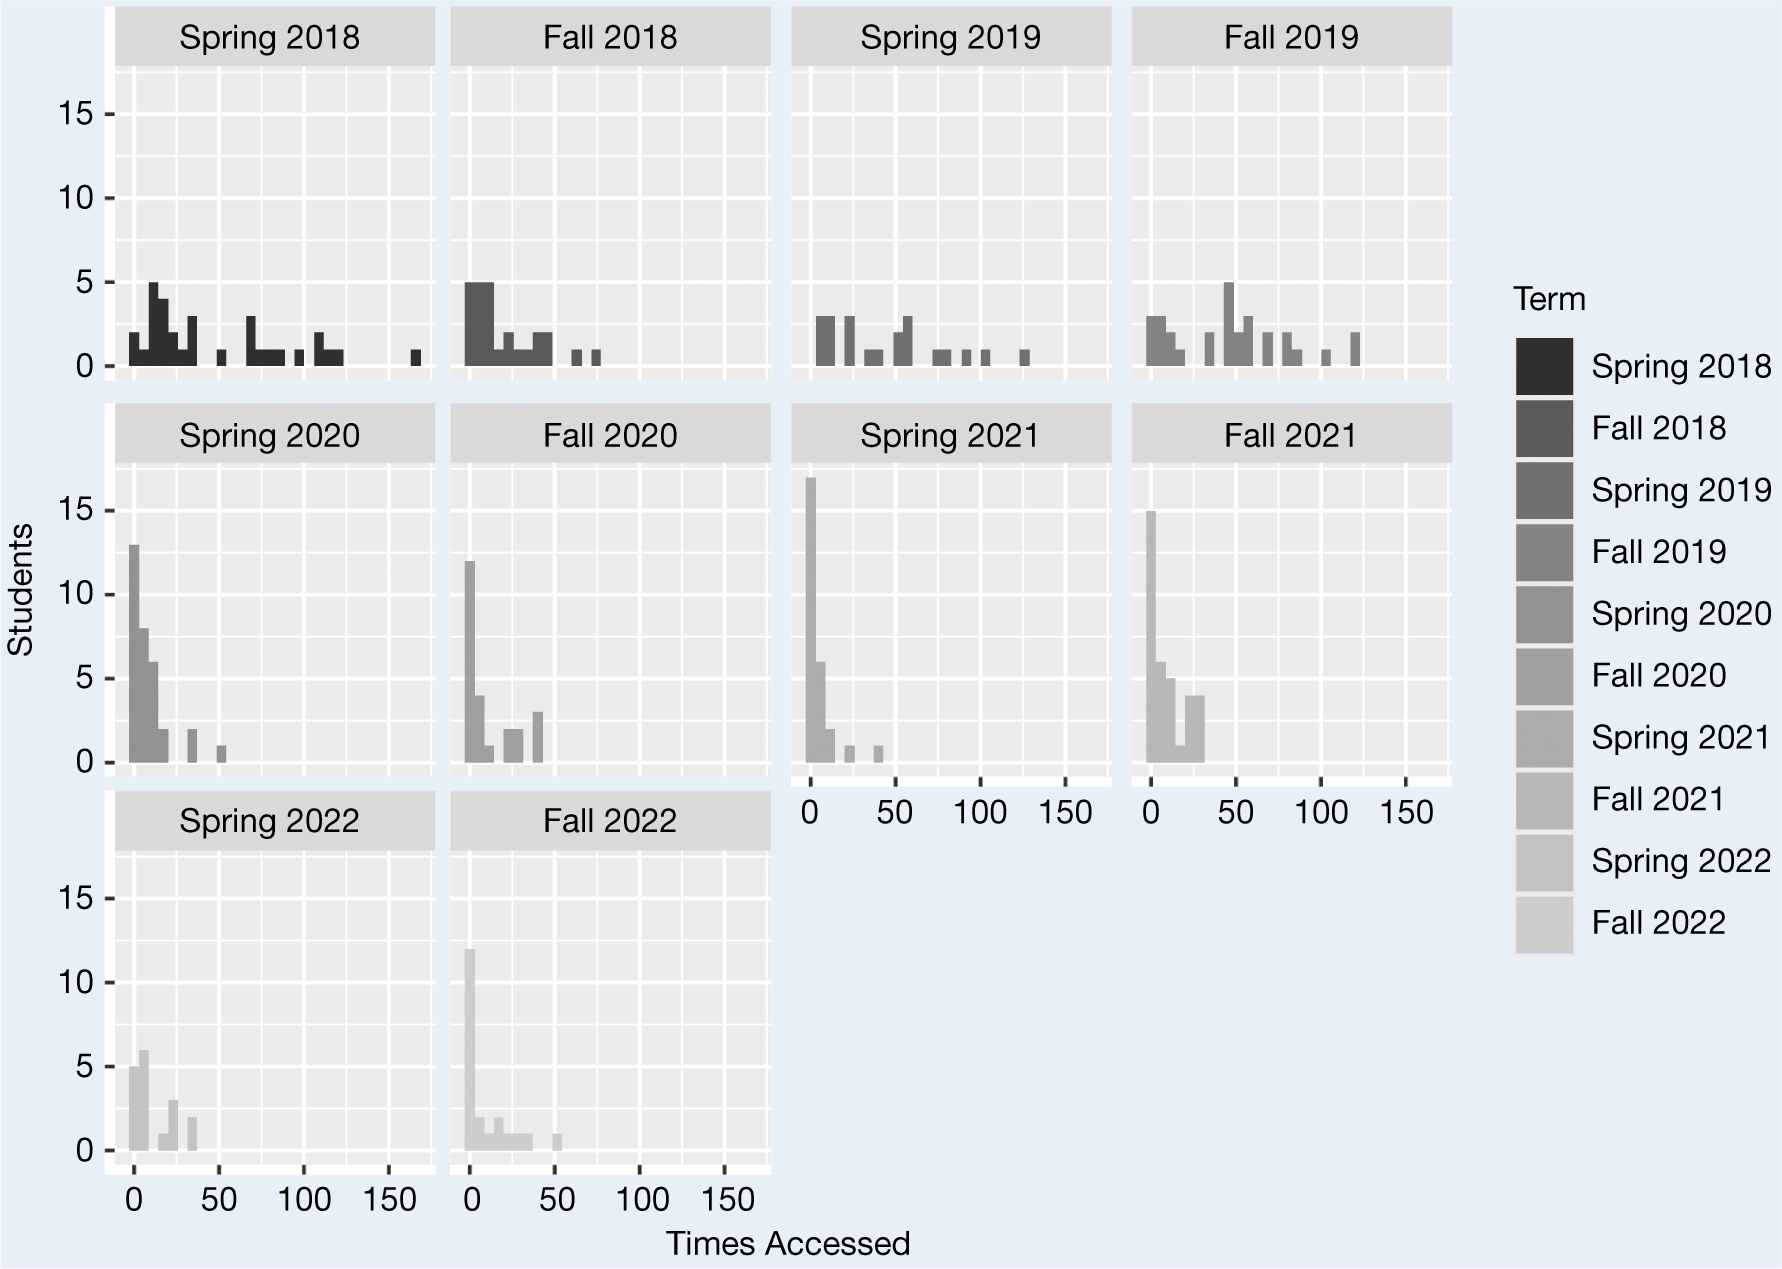
I compiled a database of how many times every student accessed each of 23 distinct items distributed across nine data labs.Footnote 5 These total numbers for the individual items then were aggregated up to the level of the nine data labs (dlab1–dlab9), with the total number of times a student engaged with any of the sample code (allcode), with any of the tutorial videos (allvideo), and with any of the data lab materials (datalab). Figure 2 presents histograms of the datalab variable for each semester.
Distribution of Student Engagement with Data Lab Materials by Semester

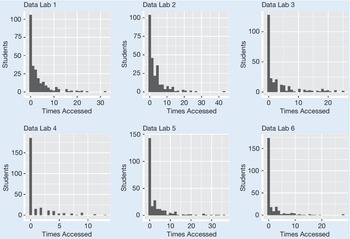
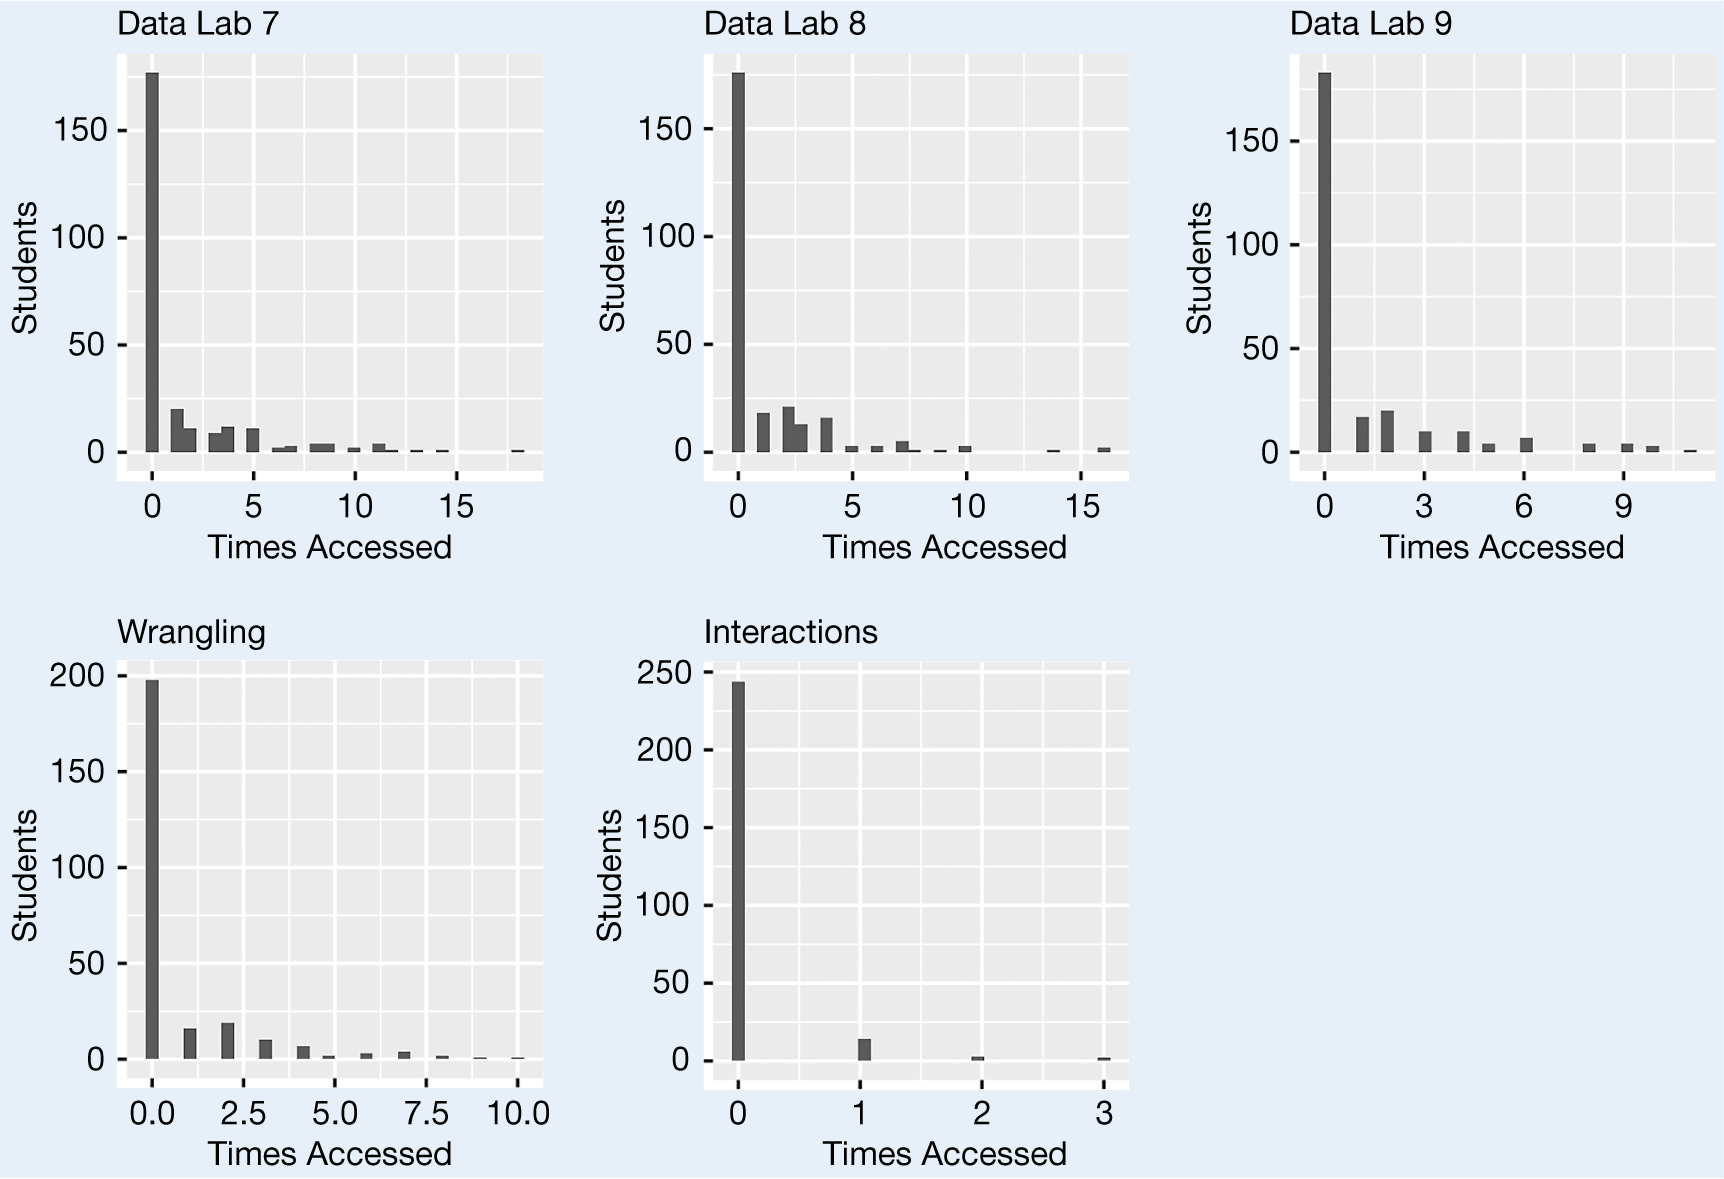
In addition to gaining a better sense of how engagement is measured, a decline in engagement was observed beginning in 2020. First, the number of students who did not access any of the data lab materials spiked in Spring 2020 and continued at a high rate throughout the remaining semesters. Second, the breadth of engagement was curtailed. Before the Spring 2020 semester, students engaged at very high rates (i.e., accessing the materials 50 times or more), but only one student reached that level of engagement after 2020. Figures 3 and 4 present histograms for the number of times that each set of materials was accessed.
Histograms of Engagement for Each Set of Data Lab 1-6 Materials

Histograms of Engagement for Each Set of Data Lab 7-11 Materials

Based on these figures, engagement declined over the course of the semester.Footnote 6 By the end of the semester—Data Lab 8, Data Lab 9, and Interactions—the majority of students were not accessing any materials. This decline is particularly ill-advised given that the complexity of what students were asked to do increased over the semester.
Based on these figures, engagement declined over the course of the semester. By the end of the semester—Data Lab 8, Data Lab 9, and Interactions—the majority of students were not accessing any materials.
These data on student engagement were combined with the previous data on their performance. I also collected their cumulative GPAs at the beginning of the semester in which they took the course (gpa). I used gpa to control for student quality. With this basic understanding of how students performed in the course and how they engaged with the data lab materials, the relationship between the two can be examined.
THE IMPACT OF ENGAGEMENT ON STUDENT PERFORMANCE
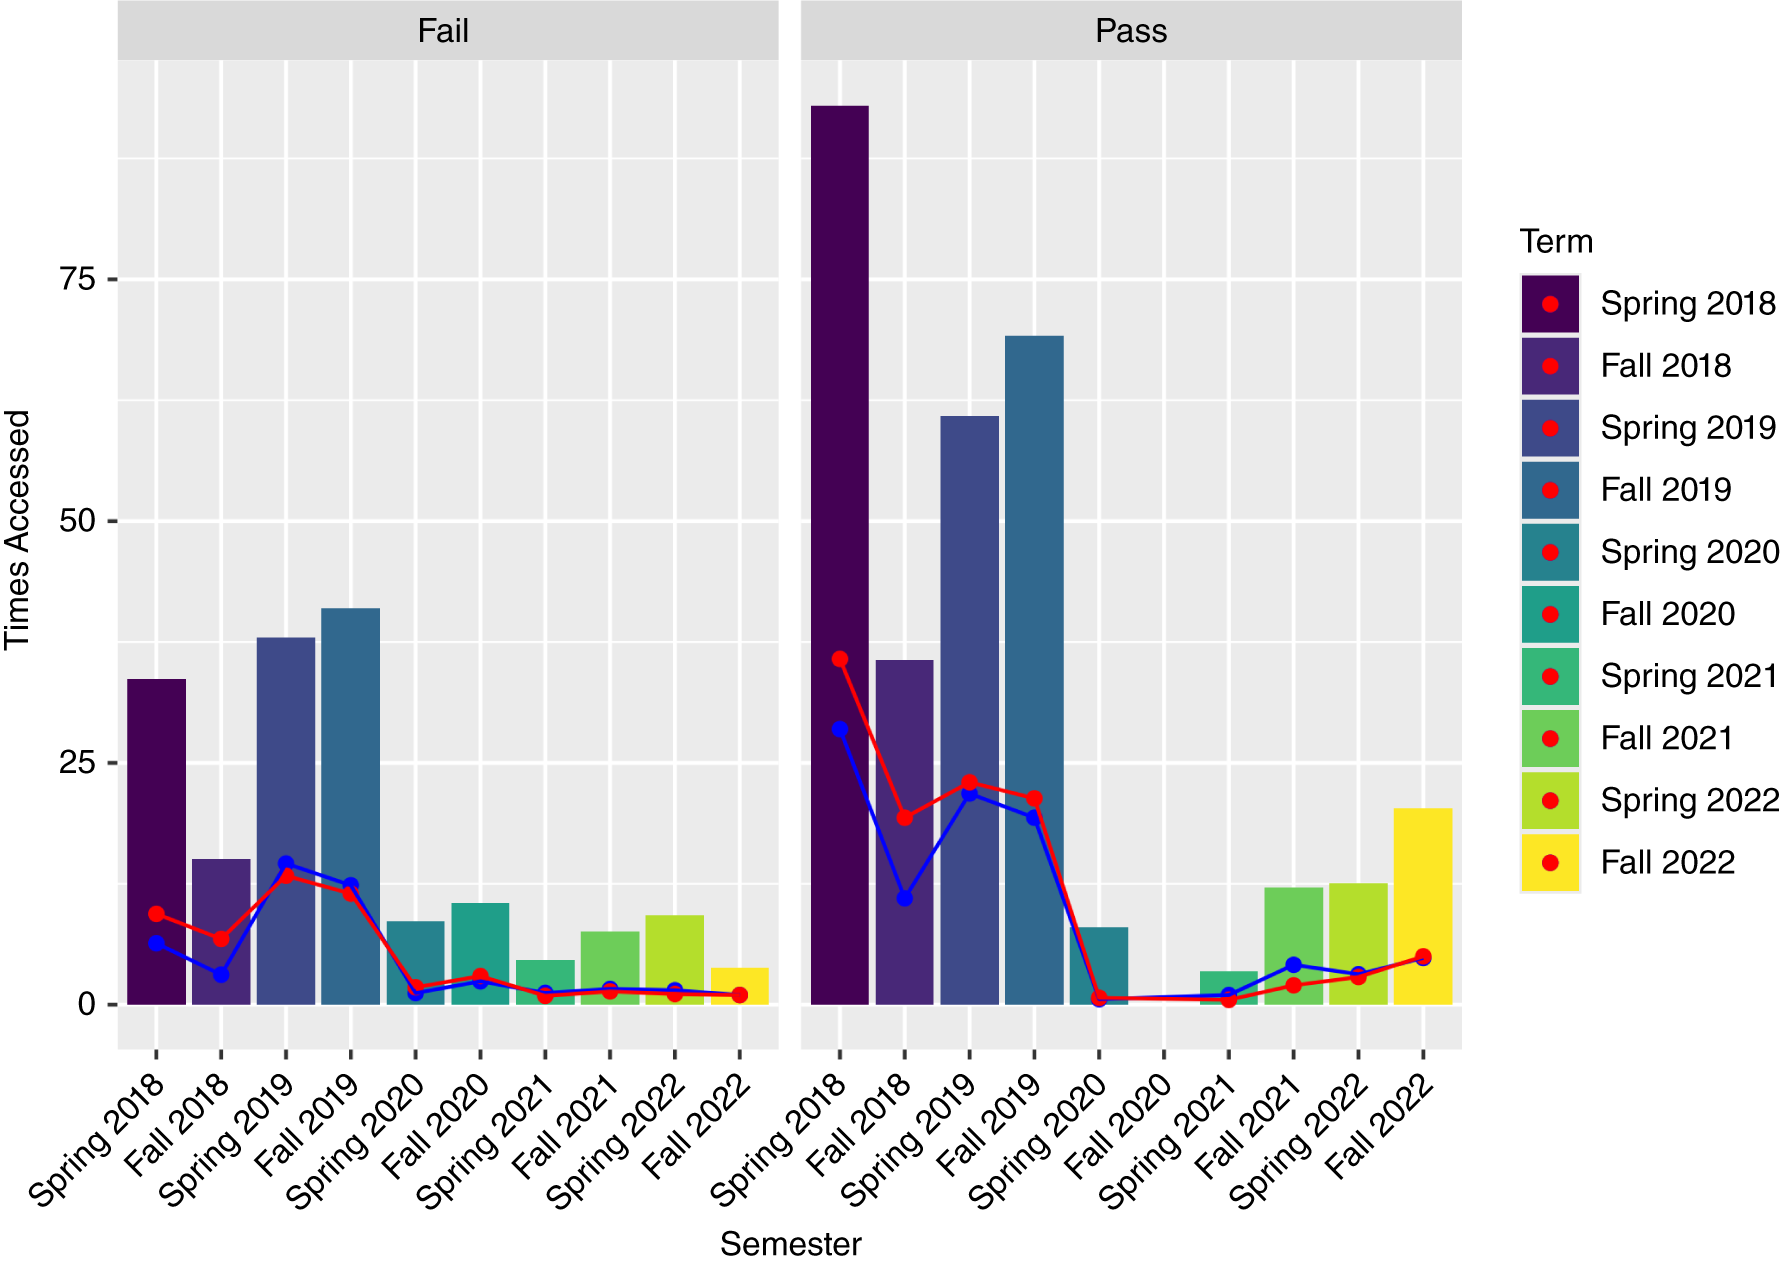
I hypothesized that higher engagement with the data lab materials would be associated with higher scores on the data project. Before delving into that relationship, I examined how engagement related to earning a passing grade in the course.Footnote 7 Figure 5 presents the average level of engagement (i.e., the colored bars) by semester and whether students passed or failed the course.
Level of Engagement with Data Labs for Students Who Passed Versus Those Who Failed

The dotted red and blue lines in the figure show that relationship for engagement with the sample code and the videos, respectively. For Spring 2018 through Fall 2019, students who passed the course had substantially higher levels of engagement with the data lab materials than those who failed. That relationship appears to disappear for calendar year 2020, partly because no students earned a passing grade in Fall 2020. Then, from Fall 2021 to Fall 2022, more engaged students had higher passing rates. Figure 5 presents suggestive evidence that engagement matters for students’ overall performance in the course. However, there are elements of overall course performance that were not related to the study’s primary interest in assessing their mastery of quantitative data analysis. For a more focused analysis, the data project assignments must be reviewed.
As mentioned previously, students are required to complete a semester-long data project that encompasses various elements of data analysis. The project is divided into smaller assignments that focus on these specific elements, and a final project requires them to complete and interpret all of the analysis as either a short research essay or poster. For the remainder of this article, performance is measured as the proportion of points that a student earned for all data project assignments.Footnote 8 Scatterplots for engagement and student performance by semester are shown in figure 6.
Scatterplots of the Relationship Between Engagement and Student Performance by Course Semester

The triangles in figure 6 represent students who passed the course; the dots represent those who failed the course; and the line is a loess curve. These plots highlight how distinctive the students are from one another, which makes sense given the distributions of engagement shown in figure 2. It is interesting that most of the loess curves are concave. Some students engaged with data lab materials and performed well in the course, whereas others apparently engaged more with the data lab materials because they were confused and not doing well in the course.
Some students engaged with data lab materials and performed well in the course, whereas others apparently engaged more with the data lab materials because they were confused and not doing well in the course.
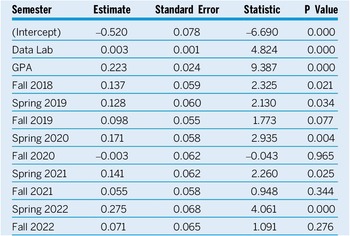
Two additional insights are observed in figure 6. First, the “tale of two students” conveyed by the loess curves strongly indicates a need to control for the quality of the student. This justifies the use of gpa as a control variable. Second, there was significant variation across semesters that is not neatly captured by any available variables. With this in mind, I estimated a linear regression with student performance as the dependent variable, engagement as the independent variable, student’s GPA as a control variable, and fixed effects for each semester. Table 3 presents the regression results and figure 7 illustrates the estimated relationship between engagement and performance for a student with the median GPA in Fall 2019.Footnote 9
Results from a Regression of Data Project Scores on Data Lab Access, GPA, and Course Semester

Plot Showing the Predicted Data Project Score as the Level of Engagement Increases

The effects were modest but important. Creating the data labs in Spring 2018 was a worthwhile investment of time in that it provided a needed resource to improve student learning. Students who engaged more with the data lab tutorials scored marginally better on the data project than those who did not engage with them. However, as shown in figure 7, these changes in scores were minimal. Students’ scores increased by approximately 3 percentage points for each additional 10 instances of accessing the materials. It was not surprising that students with a higher GPA performed better in the course.
DISCUSSION
Based on these results, there is evidence to support the hypothesis that greater engagement with the data lab materials would be associated with higher scores on the data project. However, the relationship is more nuanced than the hypothesis suggests. A practical takeaway is that students definitely performed better with some versus no engagement. However, as suggested in figure 6, it is unlikely that engagement would continue to be beneficial beyond a specific threshold, which makes intuitive sense. After a sufficiently high level of engagement, continuing to access the data lab materials indicates a fundamental difficulty that could not be overcome by more exposure to these types of learning materials. The decline of engagement with materials throughout the semester shown in figure 4 could be positive or negative. On the positive side, it is possible that the materials were serving the intended purpose of helping students to ease into R and that their comfort level was sufficiently high later in the semester that they no longer needed to rely on the videos or code. A negative interpretation could be that students began the semester with a sincere effort but that effort did not translate into the performance for which they hoped and therefore the engagement declined when they decided the materials were not helpful. In future projects, it would be beneficial to survey students to better understand their mindset when they access these resources.
Although these results do not describe a pedagogical triumph, they are aligned with recent research that found similarly mixed or muted effects (Becker, Gilbert, and Bezerra Reference Becker, Gilbert and Bezerra2024; Cox Reference Cox2021; Schuster Reference Schuster2023; Shanks and Zhang Reference Shanks and Zhang2024). These studies examined the creation of additional course material that was intended to supplement the existing course instruction. They discuss how implementation, form, and perceived quality (by the students) of the materials likely contribute to the success of these types of interventions. In this project, I retrospectively was attempting to make sense of a course rather than simultaneously designing both an intervention and its assessment. As a result, the data are limited in important ways. I already discussed the lack of survey-based insights. Similarly, the use of external links and downloadable materials prevented me from gauging the quality or duration of student engagement with the data labs. These limitations could be addressed in future research.
A second practical point to take away from this article is that the LMS can be a helpful tool for self-study. Before we make informed decisions about how to improve our course materials, we first need to know if those materials are even being absorbed. Tracking student engagement in the LMS provides meaningful information that allows faculty members to ask and answer important questions about our own courses. It would be helpful for other studies to make use of the analytics collected by the LMS, adaptive learning platforms, and digital textbook replacements (Chang Reference Chang2025). More research is needed to create a comprehensive model of student learning outside of the classroom.
DATA AVAILABILITY STATEMENT
Research documentation and data that support the findings of this study are openly available at the PS: Political Science & Politics Harvard Dataverse at https://doi.org/10.7910/DVN/SFR7VQ.
CONFLICTS OF INTEREST
The author declares that there are no ethical issues or conflicts of interest in this research.



 Open access

