


Medieval universities, together with other bottom-up institutions such as monasteries, guilds, and communes, are considered central to the development of Europe (Greif Reference Greif2006). Still, after having played a pivotal role in the Scientific Revolution of the sixteenth–seventeenth centuries, many of these grand institutions seem to have plunged into an intellectual coma thereafter. This is particularly true for Southern European universities. One possible culprit for this decline is the loss of mobility of persons and ideas following the Protestant Reformation and the ensuing Catholic Counter-Reformation. The literature has already stressed several important effects of the Protestant Reformation on the development of Europe (Cantoni, Dittmar, and Yuchtman Reference Cantoni, Dittmar and Yuchtman2018; Cantoni Reference Cantoni2015; Becker and Woessmann Reference Becker and Woessmann2009; Becker, Pfaff, and Rubin Reference Becker, Pfaff and Rubin2016). In addition to the mechanisms stressed in that literature, Ridder-Symoens (Reference Ridder-Symoens1996) argues that the Reformation led to clustering of universities, which shaped the mobility patterns of students in early modern times.Footnote 1 Beyond students’ mobility, clustering might also affect the mobility patterns of teachers and scholars, who may be even more subject to restrictions than students.
In this paper, we analyze teachers’ mobility across Europe and provide a global view of the effect of the Reformation on the mobility network of universities and on their individual positions within the network. The objects (nodes) in the network are universities active before 1793 in Europe. A connection (edge or link) between two universities is defined as the presence of the same scholar in both universities. To take a famous example, the English philosopher Roger Bacon (1219–1292) lectured in Oxford (c. 1233), then accepted an invitation to teach in Paris (c. 1237). This established (or rather reinforced, as Bacon was not alone in that case) a connection between those two universities, facilitating the flow of ideas, manuscripts, and students between the two places. Connections between universities are built from the database of university scholars RETE developed by De la Croix (Reference De la Croix2021). The sources used to build this database are primary (published cartularia and matricula), secondary (books on history of universities and on biographies of professors at a specific university), and tertiary (biographical dictionaries by topic or regions and encyclopedias).
Our main motivation for the study of the network of universities lies in the idea that the structure of a network plays a crucial role in the diffusion of information (Jackson, Rogers, and Zenou Reference Jackson, Rogers and Zenou2017). The way universities were connected to each other through the mobility of scholars might have affected the propagation speed of knowledge, ideas, and the intensity of academic production. Our paper aims to explore the extent to which documented decline in scientific production of universities during the seventeenth and eighteenth centuries can be explained by the reorganization of the network induced by the Reformation.
Beyond the effect of the Reformation on the structure of the network, which is the focus here, there are multiple margins which likely affected universities and scholars: university growth (new universities needed to train pastors), increase in competition between universities (including between Calvinists and Lutherans), the greater importance placed on writing in the Protestant culture, and a larger supply of local students following the rise in literacy. These additional effects have the potential to offset, for Protestant universities, the reduction in network centrality. For Catholic universities, there are fewer such offsetting forces. This prompts a debate on the Little Divergence occurring within Europe in the early modern period, and on its institutional and cultural determinants (De Pleijt and Van Zanden 2016; Henriques and Palma Reference Henriques and Palma2019; Rota and Weisdorf Reference Rota and Weisdorf2020). Although universities themselves contributed little to the advancement of applied sciences in the early modern period, the quality of universities can still impact development through enhancing the quality of human capital in general, and of its upper tail in particular.
To study the effect of the Reformation on the network of European universities, we build seven successive networks over the period from 1000 (creation of the first associations of professors or students dedicated to education) until 1793 (French Revolution). Each network covers a period of about 100 years. The Reformation started around 1523 (creation of a higher-education college in Strasbourg, followed by the creation of the first fully fledged Protestant university in Marburg, Germany). We thus obtain four networks before the Protestant Reformation and three networks after the emergence of Protestantism. We analyze the main characteristics of the network through time and find that the Reformation correlates with a lower density and more division in the network. In fact, we observe a sharp, clear-cut divide between Protestant and Catholic universities in the network after the Reformation, with only 6.05 percent of all links connecting them in 1598–1684. This is all the more striking as connections between universities that would convert to Protestantism and universities that would remain Catholic reach 27.51 percent of all links on the brink of the Reformation. This proportion of interfaith links falls to 3.99 percent in 1685–1793, suggesting a long-lasting impact of the Reformation on the mobility of scholars. Of course, we need to distinguish the effect of religion from geographical or vernacular effects. Using dyadic regressions, we show that religion is a strong determinant of network structure. Moreover, fragmentation increases not only between Protestant and Catholic universities, but also within those broad groups.
Looking at data through the lens of graph theory also endows us with powerful tools to study how well universities are connected in the network. In particular, we find that publications of the top five scholars in each university are strongly correlated with classical measures of centrality in the network over the period under study. In order to isolate the impact of the Reformation on each university centrality, we predict the network structure from dyadic regressions with and without religions. In the world without religions, there is no confessionalization process at work; the identity of every university remains, say, Catholic, thereby removing all faith-driven barriers to mobility. This allows us to compute universities’ predicted centrality, along with the “natural” centrality of universities in a non-religious world. We compare these two simulated centrality measures and find that the divide generated by the Reformation and the Counter-Reformation harmed most universities. The effect varies by period, by religious affiliation, and by the centrality measure that is chosen. Finally, we find that the Reformation impacted directly and positively the publications of top five scholars in Protestant universities. This positive effect was stronger than the negative effect following the deterioration of their position in the network. These trends seem particularly relevant for explaining the scientific decline of the universities in the South of Europe (including France) in the modern period.
This paper speaks to the literature on the effect of Protestantism on the development of Europe. It offers a new angle based on unique data about the mobility of university professors. Compared to Cantoni, Dittmar, and Yuchtman (Reference Cantoni, Dittmar and Yuchtman2018), Cantoni (Reference Cantoni2015), Becker and Woessmann (Reference Becker and Woessmann2009), and Becker, Pfaff, and Rubin (Reference Becker, Pfaff and Rubin2016), we analyze an additional consequence of the Reformation and the Counter-Reformation based on the relationships between people and universities.
Our paper belongs to a tradition in economic history that uses the conceptual framework offered by network theory to describe how relations between nodes shape certain economic or social outcomes. The seminal paper using networks in economic history is probably Padgett and Ansell (Reference Padgett and Ansell1993). They construct a network of marriages in early Renaissance Florence and analyze its characteristics (centrality, etc.) to understand how the Medici gained political control. Another important paper is by Puga and Trefler (Reference Puga and Trefler2014), who construct a similar network for Venice in the Middle Ages to study monopolization of the galley trade. Compared to these approaches, we introduce a methodological novelty. We use a dyadic regression to predict links, and inspired by the quantitative macroeconomics literature, we run counter-factual simulations to show how the network would look if religion did not play a role. A counter-factual network is useful to illustrate the importance of religious affiliation compared to the importance of geographical proximity.
To our knowledge, few other papers study phenomena related to the Protestant Reformation from a network angle. Kim and Pfaff (Reference Kim and Pfaff2012) document the key role of university students in diffusing Evangelical ideas or Catholic orthodox ideology in their places of origin. They explore city-to-university ties in the Holy Roman Empire between 1523 and 1545 and show that cities exposed to Evangelical activism through student enrollments in Wittenberg and Basel universities were more likely to implement reform. In contrast, reform was less likely in hometowns of students enrolled in the universities of Cologne and Louvain, the two leading bastions of Roman orthodoxy. Becker et al. (Reference Becker, Hsiao, Pfaff and Rubin2020) build Luther’s network of interpersonal relations using data on his correspondence, his visits, and the students he could have met in Wittenberg. Using a counterfactual simulation exercise (not too dissimilar from the one used in this paper), they show that Luther’s personal network, as well as the network of trade routes, mattered for the adoption of the Reformation by German cities.
Our analysis is, moreover, related to the literature on mobility of researchers and scientific production, since the network position of a university reflects, by construction, the mobility of scholars. De la Croix et al. (Reference De la Croix, Docquier, Fabre and Stelter2024) analyze the mobility of the same scholars used here (an earlier version of the RETE database) but without the religious dimension. They conclude that market forces in Medieval and Early Modern Europe influenced the rise of universities, shaped scholar distribution, and fostered the Scientific Revolution. Ejermo, Fassio, and Källström (Reference Ejermo, Fassio and Källström2020) show with contemporary Swedish data that mobility between universities significantly increases the scientific publications of researchers. The arrival of new scholars in a university department can also have positive spillover effects thanks to the diffusion of ideas (Moser, Voena, and Waldinger Reference Moser, Voena and Waldinger2014).
The paper is organized as follows. We first define our network of European universities and present the main mechanisms we have in mind in the second section. We describe the data we built on professors and universities in the third section, and then we describe the main features of the network before and after the Reformation in the fourth section. The fifth section is dedicated to disentangling the impact of geography and vernacular languages from the influence of religion. The sixth section looks at effects on academic production. Finally, the seventh section concludes.
THEORY
A NETWORK OF UNIVERSITIES
Let N = {1,2, …, n} be the set of universities in the network g. For two universities i, j ∈ N, we define gij ∈ {0,1} as the link or edge between them, with gij = 1 signifying that at least one individual scholar has taught in both universities and gij = 0 otherwise. We consider that the links are undirected: if a scholar has moved from university i to university j, this generates a link between i and j, and not a link from i to j only. Formally, gij = gji for all universities i and j. The strength of the link bij is given by the number of scholars who have taught in both universities i and j. If all scholars of a given university stayed in this same university during their entire career, then this university is an isolate in the network. This means that it has no connection with other universities in the network. The network of universities, g, is thus the collection of universities (nodes) and the links between them. We define such a network of universities for each period of time that we study.
Note that we do not address the creation of nodes (universities) or the endogenous formation of the network. We take the network as given by the data.
DIFFUSION AND LEARNING THROUGH THE NETWORK OF UNIVERSITIES
The idea behind our definition of the network is as follows. When a given professor had appointments in two (or more) places during his life, it established a relationship enhancing the flow of ideas, manuscripts, and students between the two places, which might last well beyond the professor’s death. The network of universities can then reflect privileged ways of diffusion and learning (Jackson Reference Jackson2008, chaps. 7 & 8). Several mechanisms are at play.
First, during the pre-industrial era, knowledge was partly codified in books, but more importantly, it was embodied in people. When a scholar moves, she brings knowledge from one place to another. This is why competition to attract talent was fierce among universities, leading to permanent flows between them (Denley Reference Denley2013). There are many examples of knowledge diffusion through physical moves. Let us mention the rediscovery of Roman law, which was superior to customary law at regulating complex transactions, spread from Italy to France in the Middle Ages either through the hiring by French universities of Italian professors or by having some French professors be appointed to Italian universities (Arabeyre, Halpérin, and Krynen Reference Arabeyre, Halpérin and Krynen2007). Second, codified knowledge in books can also travel physically with scholars. Even though books became more affordable after the invention of the movable-type printing press, they were not as accessible as today. Biographical dictionaries contain many examples of professors donating their book collections to the university by testament. Probably the best example of the role of books carried by scholars in the diffusion of knowledge is when the Greek scholars fled the fall of the Byzantine Empire, bringing forgotten books by Greek philosophers to the many Italian universities where they were hired (Harris Reference Harris1995). Third, links are established by the presence of doctoral students. When a scholar moves to another university but maintains a connection with current or former students at her original university, a link is established. Students and professors cannot be systematically tracked with the available data, but some examples can be documented using the Mathematics Genealogy Project,Footnote 2 linking students to masters in the (broad) field of mathematics. Fourth, when a newly created university hires professors from an existing one, a long-lasting relationship is established. For example, the University of Dublin, founded in 1592, was originally populated by scholars coming from Cambridge (Venn Reference Venn1922). This established a long-lasting, well-documented link between the two universities. This is also true for Louvain (founded 1425), which started with several professors hired from Cologne, itself founded in 1388 (Lamberts and Roegiers Reference Lamberts and Roegiers1990).
In some cases, links are established when a professor has to flee war or persecution. This happened in particular after the Reformation, when scholars relocated according to their faith (or in some cases changed faith to keep their current location). Still, an intellectual link was created by this move. For example, the Calvinist Reformation developed in Geneva in the sixteenth century owes much to lawyers active in Bourges during the preceding centuries. This relates to the literature on how practical knowledge flowed from France to Prussia with the expulsion of the Huguenots (Hornung Reference Hornung2014).
CONFESSIONALIZATION
As soon as we classify universities as either Catholic or Protestant, we use the notion of Confessionalization. According to Lotz-Heumann (Reference Lotz-Heumann, Bamji, Janssen and Laven2016), Confessionalization refers to the process of “confession-building.” This had the consequence of creating distinctive confessional identities. This process paved the way to early modern state formation, increasing the segmentation of Europe (Schilling Reference Schilling, Brady, Oberman and Tracy1995). The extent and strength of Confessionalization is hard to measure, particularly at the European level, and this is one contribution of our approach.
THE SCIENCE-RELIGION NEXUS
When we raise the question of the relationship between scientific output and religious affiliation, we implicitly touch upon the delicate question of the attitude of religions with respect to science. Why did the Catholics engage in repressing new knowledge in the sixteenth century, for example, by censoring publications (Blasutto and De la Croix Reference Blasutto and De la Croix2023), while they were more open to science before the Reformation? Our analysis in terms of networks of universities may highlight the different positions of Catholic and Protestant universities within the network in terms of centrality vs. marginalization.
PROFESSORS AND UNIVERSITIES
In this section, we describe the data on scholars used to construct the network of universities, and we report qualitative and quantitative evidence on the decline of Southern universities in the seventeenth and eighteenth centuries.
The data on professors we use are obtained from the sources listed in detail in Online Appendix B. More details can be found in the collection Repertorium Eruditorum Totius Europae (https://shiny-lidam.sipr.ucl.ac.be/scholars/) with a summary in De la Croix (Reference De la Croix2021). We detail here the main sources for some important samples, to highlight to the reader the strengths and weaknesses of the individual data on which the network of universities will be built. With 3,285 professors, the University of Bologna (founded 1088) provides the largest sample, thanks to its seven centuries of existence and to the excellent coverage found in the secondary literature. Almost all the data were encoded from the book by Mazzetti (Reference Mazzetti1847), which provides short biographies for these professors, including whether they held appointments at other universities. The University of Heidelberg (founded 1386) is the German university with the highest number of recorded scholars, 1,210 professors. For the University of Louvain (founded 1425), an important university in the Renaissance and the university of one of the authors of this paper, collecting data was more complicated, as there was no catalogue of professors for this once famous university. Data were collected from a variety of sources. Each person was searched for in biographical dictionaries. The combinations of these various sources unearthed 1,138 professors, hence a good coverage of this university. A similar strategy of combining several secondary sources was applied for the University of Paris. English universities, Oxford and Cambridge, are covered by the books on their alumni. Finally, we took the liberty of adding some important higher education institutions to the list of “official universities” provided by Frijhoff (Reference Frijhoff1996), such as Gresham College in London and the Herborn Academy in the Holy Roman Empire (this is detailed in Online Appendix B).
Even if the coverage of the smaller universities is sometimes unequal, the coverage of the persons who matter for our study remains high: mobile scholars are indeed more likely to be identified, as they would appear in multiple sources. Productive scholars are also more likely to be in the database, as they would be mentioned in books about each university, even if those books are very incomplete (such as books celebrating the xth anniversary of the university).
While searching for professors, we found many qualitative elements about the decline of universities in the seventeenth century. The view in the literature is that Catholic universities became unattractive during the seventeenth–eighteenth centuries, partly because of religious views (the Counter-Reformation, the Inquisition). Some compelling examples are detailed in Online Appendix H. This qualitative evidence is confirmed by a more quantitative approach. We first classify universities according to their religious affiliation as reported in Frijhoff (Reference Frijhoff1996). Four broad groups are defined as follows. The set C includes all universities that have never ceased to endorse the Catholic faith over the period considered. The set P includes the universities that either converted to Protestantism at some point or were created as such from the beginning.Footnote 3 Within C, it becomes useful to distinguish universities that were run by the Jesuits after the Counter-Reformation, belonging to CJ from the universities that remained secular, belonging to CS where secular here means not belonging to a religious order or a congregation (like secular clergy). The Jesuits’ congregation, the Society of Jesus, operated a large number of schools and universities throughout Europe (Grendler Reference Grendler2017), with the aim of educating virtuous leaders who would act for the common good (and fight the Reformation). The oldest and most prestigious Catholic universities fought the influence of this new congregation and kept the Jesuits out (Louvain, Paris, Bologna, Padua, Krakow). Within P, we will distinguish the four brands of Protestantism: PP for Presbyterian (only in Scotland), PL for Lutheran (Germanic, Nordic), PC for Calvinist (Dutch, French, Swiss, German), and PA for Anglican (English, Irish), with PP ∪ PL ∪ PC ∪ PA = P.
The period under study goes from 1000 to 1793. We divide time into seven periods. Following a tradition in history, we use major events to define seven periods rather than centuries: (1) from the creation of the first associations of professors and students dedicated to education in 1000 until 1199; (2) from the creation of the university of Paris in 1200 until 1347; (3) from the Black Death in 1348 until 1449; (4) from the creation of the printing press in 1450 until 1522; (5) from the creation of the first Protestant university in 1523 until 1597; (6) from the Edict of NantesFootnote 4 in 1598 until 1684; (7) from the Revocation of the Edict of Nantes in 1685 until 1793, when French universities were abolished by the Revolution.
Focusing on the two main types of universities, C and P, we compute the total number of scholars of universities and their publications over time. Results are shown in Table 1. Detailed data are reported in Online Appendix C (Tables C.2 to C.8). These numbers are computed by summing all the publications recorded in VIAF (Virtual International Authority File) by members of universities. VIAF provides a comprehensive contemporary measure of scientific output. One could argue that a measure of output should be based on the works published while the author was still alive. What was published after the death of the person might reflect how the author gained popularity post-mortem, which might not be relevant for determining his/her productivity. This, however, is not possible to implement because many first editions of books are not available anymore. For example, there is no doubt that Pierre Abélard (1079–1142) was a philosopher of great renown during his life. All his written output available in the libraries today, from philosophical works to love letters, was published after 1600.
PUBLICATIONS AND SCHOLARS OVER TIME

Table 1 Long description
The table presents data on the total number of publications and scholars per period for old and new universities. Old universities are defined as those founded before 1523, while new universities are those founded after 1523. The table is divided into two main sections: A and B. Section A focuses on the total number of publications per period, with subcategories for old and new universities. Section B focuses on the total number of scholars per period, also with subcategories for old and new universities. The table includes columns for different time periods ranging from 1000 to 1793. For each period, the table lists the total number of publications (C) and the total number of scholars (P) for both old and new universities. Additionally, the table provides ratios of C to P for both old and new universities. Notable trends include a significant increase in the number of publications and scholars over time, particularly for new universities. The data highlights the growth and development of academic institutions over the centuries.
Notes: P bef. 1523 covers universities which converted later to Protestantism. “Publications” sum titles of members as reported in www.viaf.org.
Source: Authors’ computations.
Another issue with measuring academic output from contemporaneous library catalogues arises from the possible loss of some publications over time. This does not seem to be of major importance, though. Chaney (Reference Chaney2020) compares the books contained in the Universal Short Title Catalogue database of St. Andrews (2019) (https://ustc.ac.uk/) with those referenced in VIAF. The USTC aims to cover all books published in Europe between the invention of printing and 1650. Chaney successfully located 81 percent of these authors in the VIAF data. Such a high level of coverage is consistent with the claim that VIAF provides a reasonable approximation to the population of known European authors.
The total publications of Catholic and Protestant universities founded before 1523 are reported in the first two rows of Panel A in Table 1. They are obtained by summing the publications of their members. When a person taught at several universities over her life, we divide her publications by the number of affiliations and allocate this amount to each university. The numbers show the rise of publications following the invention of the printing press. The printing press was adopted quickly throughout Europe, with no differences between countries (Timperley Reference Timperley1839). Later, there is growth in the last three periods among old Protestant universities. There is a stagnation among Catholic universities, with around 14k publications, despite a large and increasing number of scholars, from 6k in 1527–97 to 7.8k in 1685–1793 (Panel B of Table 1). The rise of Protestant publications is even more striking when we consider new universities. In new institutions, the total output of Protestant scholars is five times that of Catholic scholars, despite some absolute growth in the Catholic world, driven mostly by the new elite institutions created by the kings of France (Collège Royal and Jardin des Plantes).
To account for heterogeneous coverage of obscure scholars across sources and universities, we restrict the sample to published scholars in Panel C of Table 2. We observe that the productivity of publishing scholars in old Catholic universities systematically decreases over time relative to productivity in old Protestant universities. Within new institutions, publishing scholars are on average 50 percent more productive in Protestant universities than in Catholic universities, from 1523 until 1793. Finally, to address concerns about a possible heterogeneous coverage of publications by publishing scholars, we consider only publications by the top five scholars per period, for which we have very good coverage. Panel D of Table 2 confirms the decline of old Catholic universities relative to old Protestant universities over time. Moreover the top five scholars in new Protestant universities publish almost three times more than their counterparts in the Catholic world from 1598 to 1793.
PUBLICATIONS PER PUBLISHING SCHOLAR AND OF TOP SCHOLARS OVER TIME

Table 2 Long description
The table presents data on publications per publishing scholar and the top five scholars over different time periods. It is divided into two main sections: C and D. Section C shows the number of publications per scholar in old and new universities, categorized by Catholic and Protestant institutions. Section D focuses on the top five scholars, listing their publications and the ratios of publications to citations. The table spans from the year 1000 to 1793, with notable trends indicating a decline in productivity in old Catholic universities relative to old Protestant universities. New Protestant universities show higher productivity compared to new Catholic universities. The data highlights significant differences in scholarly output between Catholic and Protestant institutions over time.
Notes: P bef. 1523 covers universities which converted later to Protestantism. “Publications” sum titles of members as reported in www.viaf.org.
Source: Authors’ computations.
Finally, we report some statistics on the broad academic fields taught by the scholars in Table 3. This measure is not very precise (e.g., we do not know what all of the Oxbridge fellows actually taught), but it is informative. The changes over time were driven by the new universities, which did not reproduce what the older ones were doing, more than by drastic changes in existing curricula. Several facts are presented in Table 3. Sciences were rising with time, from 4 percent to 12 percent, with no difference between Catholics and Protestants. Medicine was steady at 10–13 percent. Theology was declining before the Reformation, but received a boost with the Reformation, both in Catholic and Protestant places, but more so in Protestant places. This contrasts with the results of Cantoni, Dittmar, and Yuchtman (Reference Cantoni, Dittmar and Yuchtman2018), according to whom the Reformation paved the way for secularization. Here we observe the opposite, but we consider professors and not students, and we cover the entire Protestant world, while they cover only the Holy Roman Empire (hence not including England, Scotland, Scandinavia, Switzerland, and the Netherlands). The share of theology reverted to a lower level only in the last period, when the heat of the Reformation had cooled down. Law was on a steady decline, and its share was structurally more important in Catholic universities (heir of the written law tradition).
SHARE OF SCHOLARS IN EACH ACADEMIC FIELD BY PERIOD AND RELIGION IN PERCENT

Table 3 Long description
The table presents the share of scholars in various academic fields across different periods and religions, measured in percentages. It includes five periods: before 1450, 1450-1522, 1523-1597, 1598-1684, and 1685-1793. The academic fields are Theology, Law, Humanities, Medicine, and Sciences. Each field is further divided into Catholic (C) and Protestant (P) shares. The table has five rows for the periods and six columns for the academic fields, with sub-columns for Catholic and Protestant shares. Notable trends include a rise in Sciences from 4 percent to 12 percent, steady Medicine at around 10-13 percent, a decline in Law, and fluctuations in Theology influenced by the Reformation.
Notes: Academic field determined by teaching.
Source: Authors’ computations.
Table 4 extends the analysis by weighing scholars based on their publications, offering a sharper view of the shifting intellectual landscape. The data highlights the surge of theological dominance following the Reformation, followed by a marked secularization process during the final period. Until 1685, approximately one-third of all publications from Protestant universities were authored by theologians. Between 1685 and 1793, this share declines to one-fifth, coinciding with the rise of science and medicine.
SHARE OF PUBLICATIONS IN EACH ACADEMIC FIELD BY PERIOD AND RELIGION IN PERCENT

Table 4 Long description
The table presents the share of publications in various academic fields across different periods and religions, measured in percentages. The fields include Theology, Law, Humanities, Medicine, and Sciences. The periods are categorized as Before 1450, 1450-1522, 1523-1597, 1598-1684, and 1685-1793. Each period is further divided into Catholic (C) and Protestant (P) publications. Notable trends include a surge in theological publications following the Reformation and a subsequent decline in theology's dominance, coinciding with the rise of science and medicine. The table has six rows and six columns, with the columns labeled as Period, Theology, Law, Humanities, Medicine, and Sciences. Each cell contains the percentage share of publications for the respective field and period.
Notes: Academic field determined by teaching.
Source: Authors’ computations.
This secularization of higher education was driven in part by the establishment of new universities (Koch Reference Koch2008). For instance, the University of Halle (founded in 1694) prioritized secular disciplines more than older institutions, which often remained closely tied to religious authorities. Halle emerged as a forerunner of the Humboldtian model of education, emphasizing academic freedom and research—a framework that later shaped European universities.
Similarly, the University of Göttingen (established in 1734) was founded with a strong focus on modern sciences and liberal arts, operating under secular governance in the Electorate of Hanover. The University of Edinburgh (Scotland, founded in 1583) underwent significant reforms in the eighteenth century, prioritizing practical education in fields such as medicine, law, philosophy, and science (Grant Reference Grant1884). Notable figures like Adam Smith (economics) and David Hume (philosophy) challenged traditional religious orthodoxy, further driving the institution’s secular shift.
Table 4 also reveals evidence of secularization within Catholic institutions, reflected in changing disciplinary proportions. For example, at the University of Turin, under the House of Savoy, Enlightenment-inspired reforms transformed the curriculum. Natural sciences, engineering, and modern languages gained prominence, while governance increasingly centralized under the state, reducing ecclesiastical influence (Vallauri Reference Vallauri1875). Secularization works in opposition to confessionalization. However, as we will see, it was insufficient to fully counteract the restrictive effects of confessionalization on academic mobility, even in the final period under consideration.
THE NETWORK OF UNIVERSITIES
We build the network of European universities for each period, and thus obtain four networks before the Reformation, which started around 1523, and three networks after. The replication files are available in de la Croix and Morault (2025). In Figures 1 and 2, we map out these networks of universities before and after the Reformation.
NETWORKS BEFORE THE REFORMATION
Note: Universities that would remain Catholic after the Reformation are purple, while universities that would convert to Protestantism are orange.
Source: Authors’ illustration.

Figure 1 Long description
Four network graphs illustrate the connections between universities from 1000 to 1522. Each graph represents a different time period: 1000-1199, 1200-1347, 1348-1449, and 1450-1522. Universities that remained Catholic after the Reformation are marked in purple, while those that converted to Protestantism are marked in orange. The graphs show the evolution of university networks over time, highlighting the increasing complexity and interconnectedness of these institutions. Key universities such as Paris, Oxford, and Bologna are central nodes in these networks, with numerous connections to other universities. The networks expand and become more intricate over the centuries, reflecting the growing mobility of students and scholars. The final graph, covering 1450-1522, shows the most extensive network, indicating a peak in university connections before the Reformation.
NETWORKS AFTER THE REFORMATION
Note: Secular Catholic universities are purple, while Jesuit universities are blue-filled. Lutheran, Presbyterian, Calvinist, and Anglican universities are respectively orange, brown, yellow, and pink.
Source: Authors’ illustration.

Figure 2 Long description
The image contains three network graphs representing university connections during different historical periods. The first graph, labeled 1523-1597, shows a dense network of connections among various universities, with secular Catholic universities marked in purple and Jesuit universities in blue. The second graph, labeled 1598-1684, displays a more spread-out network with similar color coding for different religious affiliations. The third graph, labeled 1685-1793, illustrates further changes in the network structure. Each graph highlights the mobility patterns of students and scholars during these periods, with lines indicating connections between universities. The networks show how the Protestant Reformation and the Catholic Counter-Reformation influenced the clustering and mobility of academic institutions. All values are approximated.
A connection between two universities illustrates the transfer of one or several scholars between them, without considering the direction of transfer. More specifically, each network captures all the displacements of scholars that occurred by period. The 1523–1597 network in Figure 2 is particular, as it witnesses a reallocation of scholars to fit the new religious conditions: French and Belgian Protestants moving North, but also British Catholics moving to France (Rheims and Douai, see (Bideaux and Fragonard Reference Bideaux and Fragonard2003)).Footnote 5 We consider that this reallocation of scholars ends in 1598, when the Edict of Nantes is promulgated, granting rights to French Protestants, including the right to have their own universities. We code universities according to their religious affiliation. Before the Reformation, all universities were Catholic, but in the network, we nonetheless distinguish between purple universities that remain Catholic after the Reformation and orange universities that convert to Protestantism. After the Reformation, each different branch of Protestantism gets its own color: Anglicans are pink, Calvinists yellow, Lutherans orange, and Presbyterians are maroon. The Jesuit universities that actively took part in the Counter-Reformation are blue, while Secular Catholic universities are purple. Let us point out that the positioning of universities in these figures is determined by the standard Fruchterman-Reingold force-directed algorithm (Fruchterman and Reingold Reference Fruchterman and Reingold1991), which groups universities more closely together when they are linked to each other. So the positioning of universities is not based on geography, religion, or other university attributes. Overall, we already observe a clear-cut divide between Protestant and Catholic universities in the last two networks after the Reformation, based on the mobility of scholars only.
Our figures also show the centrality of each university by changing the size of its circle. We are measuring here closeness centrality, which will be described in more detail later. Our network maps can be used to give a crash course on the history of the academic landscape in Europe. It goes as follows. In the first period (1000–1199), the burgeoning Paris and Bologna are, as expected, the two most central universities. The medical centers of Montpellier and Salerno are also quite central, as is the cathedral school of Chartres. Oxford is the little sister of Paris. In the second period (1200–1348), the Bologna-Paris-Oxford-Montpellier group is rejoined by Padova, Avignon (which may have benefitted from the presence of the pope’s court), and Toulouse. Salerno is declining, and Chartres has disappeared from the map. After the Black Death (1349–1450), it is the Italian moment. The studium in Florence, the university of the Pope in Rome (Sapienza), and Parma rejoin the group of highly central universities. The newly founded universities of Vienna and Louvain start to appear on the map. During the last period before the Reformation (1451–1522), there are additional newcomers, some of whom will ultimately become Protestants, such as the universities of Leipzig, Greifswald, and Wittenberg. Paris is still there; Louvain centrality has grown, and Oxford centrality has shrunk. The period of the Reformation (1523–1597) is one in which many universities display a high degree of centrality. The network is made of a core of universities having multiple links between each other, with a periphery of less connected places. We note the emergence of a new type of university in blue, those either founded by the Jesuits, or in which the Jesuits played a key role. In the period during which Protestantism was tolerated in France (1598–1685), the network is obviously split into two blocks: the Protestants and the Catholics. The Catholic universities are still the most central, but they are of two types: the Secular Catholic, not run by any specific monastic order, and the Jesuit universities. We observe that the mothership of all Jesuit universities, the Gregoriana, is indeed the most central one in their network. It is surprising not to see the Dutch universities emerging at this stage. For the German universities, many were engulfed in the Thirty Years’ War. In the last period (1686–1793), there is a complete reversal of the situation, at least seen from the point of view of centrality. The Lutheran universities, led by the newly founded Universities of Gottingen and Halle, are now the most central ones, followed by the Calvinist universities in Holland. The other nodes in the network have lost the centrality they previously had, including the Jesuit universities.
The comparison of the network in 1598–1684 with any other of its predecessors is striking. After the Reformation, the network was literally cut into two distinct parts.
We now examine the main macro characteristics of the networks. Let us first define them. The density of the network is the ratio of observed links in a network to the maximum number of possible links. For an undirected network with n nodes, the maximum number of links is n(n – 1)/2, so the density for an undirected network is: 2L/[n(n – 1)], where L is the number of observed links in the network. The degree of a university i,
 $${{\cal D}_i}$$
, is the number of distinct universities with which the university i is connected. Formally
$${{\cal D}_i}$$
, is the number of distinct universities with which the university i is connected. Formally
 $${{\cal D}_i}$$
= #|j: gij = 1|. The average degree of the network g, denoted
$${{\cal D}_i}$$
= #|j: gij = 1|. The average degree of the network g, denoted
 $${\cal D}$$
(g), is the mean of the degrees of all connected universities in the network. The distance l(ij) between two universities i and j is the length of the shortest path between them. The diameter is the largest distance between any two universities in the network. The average distance of all pairs of universities in the network g is denoted l(g). The average number of communities is computed thanks to several community detection algorithms from the igraph package in R (Csárdi et al. Reference Csárdi, Nepusz, Traag and Horvát2006). These community detection algorithms are designed to identify internally cohesive subgroups that are also, to a certain extent, separated from other groups or nodes. Note that we compute these statistics for each network without taking isolates into account. Statistics defined previously are displayed in Table 5.
$${\cal D}$$
(g), is the mean of the degrees of all connected universities in the network. The distance l(ij) between two universities i and j is the length of the shortest path between them. The diameter is the largest distance between any two universities in the network. The average distance of all pairs of universities in the network g is denoted l(g). The average number of communities is computed thanks to several community detection algorithms from the igraph package in R (Csárdi et al. Reference Csárdi, Nepusz, Traag and Horvát2006). These community detection algorithms are designed to identify internally cohesive subgroups that are also, to a certain extent, separated from other groups or nodes. Note that we compute these statistics for each network without taking isolates into account. Statistics defined previously are displayed in Table 5.
DESCRIPTIVE STATISTICS OF THE NETWORKS

Table 5 Long description
The table presents descriptive statistics of networks over various time periods, ranging from 1000 to 1199 up to 1685 to 1793. It includes data on the number of universities, connected universities, connected pairs, scholars in connected pairs, density, average degree, diameter, average distance, and the average number of communities. The table has 10 columns and 8 rows, with each row representing a different time period and each column representing a specific statistic. Notable trends include an increase in the number of universities and connected universities over time, with a peak in the number of connected pairs and scholars in connected pairs during the period from 1598 to 1684. The density of the network decreases over time, while the average degree and diameter show variations. The average distance and the average number of communities also exhibit changes across the different periods.
Source: Authors’ computations.
First, we observe a large increase in the number universities across time, going from 17 to 135. In contrast, the number of connected pairs of universities continues to increase before the Reformation, until it reaches a peak during the 1523–1597 period. As we have already discussed, this period is specific as it witnesses a constrained reallocation of scholars due to the emergence of Protestantism. Interestingly, the number of connected pairs decreases during the last two periods after the Reformation. However, when we consider the total number of scholars connecting each pair of universities, it continues to increase over the period. As a result, the average number of scholars connecting two universities increases from 3.30 just before the Reformation to 5.14 in the 1685–1793 period. So a professor in a given university was more likely to move to another university that already had a connection with his current university after the Reformation than just before, even though the number of universities more than doubled between these two periods.
Then, the networks of universities are sparser after the Reformation: the density of the network more than halved. This is due to both the increase in the number of universities in the networks and the decrease of links after the peak mentioned in the 1523–1597 period. The average degree of universities in the networks is quite stable for the three periods just before the Reformation and the two last periods after: on average, universities are connected to about 6.5 other universities over the period. This number strikingly increases to slightly more than 11 during 1523–1597 period: again, this is due to the forced reallocation of scholars during this troubled period, which increased mobility significantly. The average distance of the networks increases after the Reformation. For the first four periods, it requires on average 2.23 steps to connect any pair of universities in the networks and at most 5 steps. In contrast, the average distance of the networks increases to 3.05 and 3.60, and the diameter reaches 6 and 8 in the last two periods. Finally, the average number of communities detected in the networks increases drastically after the Reformation. In the first three periods, we detect on average 3.11 communities in the networks. In contrast, we detect on average 8.84 communities after the Reformation. This indicates that the network of European universities is much more fragmented after the Reformation.
We now explore to what extent the individual positions of universities in the networks correlate with the publications of their top five scholars. As explained in the third section, we focus on top five scholars for whom we have a very good coverage. We consider five classic network measures of centrality. We already defined the first one, the degree of a university i,
 $${{\cal D}_i}$$
, which measures the number of university i’s neighbors. The four other centrality measures are as follows. The strength
$${{\cal D}_i}$$
, which measures the number of university i’s neighbors. The four other centrality measures are as follows. The strength
 $${{\cal S}_i}$$
captures the average strength of existing links of university i with its neighbors. The closeness centrality
$${{\cal S}_i}$$
captures the average strength of existing links of university i with its neighbors. The closeness centrality
 $${{\cal C}_i}$$
describes how quickly university i is reachable from all other universities in the network. The betweenness centrality
$${{\cal C}_i}$$
describes how quickly university i is reachable from all other universities in the network. The betweenness centrality
 $${{\cal B}_i}$$
measures the importance of university i in connecting other universities in the network. The eigenvector centrality
$${{\cal B}_i}$$
measures the importance of university i in connecting other universities in the network. The eigenvector centrality
 $${{\cal E}_i}$$
captures how “well-connected” university i’s neighbors are. We provide detailed definitions of these four measures in Online Appendix G. We regress academic output of top five scholars in each university on the different network measures in a panel over our seven periods. Results are displayed in Table 6.
$${{\cal E}_i}$$
captures how “well-connected” university i’s neighbors are. We provide detailed definitions of these four measures in Online Appendix G. We regress academic output of top five scholars in each university on the different network measures in a panel over our seven periods. Results are displayed in Table 6.
POSITION IN THE NETWORK AND SCIENTIFIC PRODUCTION

Table 6 Long description
The table presents data on the correlation between various network centrality measures and the scientific production of the top five scholars at universities. It includes five centrality measures: Degree, Strength, Closeness, Betweenness, and Eigenvector. Each measure is associated with a coefficient value and a standard error in parentheses. The table has five rows for each centrality measure and additional rows for observations and adjusted R-squared values. Degree has a significant coefficient of 5.739 with a standard error of 0.960. Strength has a coefficient of 0.002 with a standard error of 0.008. Closeness shows a significant coefficient of 1.577 with a standard error of 0.448. Betweenness has a significant coefficient of 5.678 with a standard error of 1.975. Eigenvector centrality has a significant coefficient of 0.824 with a standard error of 0.277. The observations are consistent at 531 for each measure, and the adjusted R-squared values range from 0.616 to 0.650.
Notes: *p<0.1; **p<0.05; ***p<0.01
Includes university and period fixed effects, controls for varying coverage and activity periods.
Source: Authors’ computations.
Every column of Table 6 presents a regression of the inverse hyperbolic sine of publications of the top five scholars of each university, which we denote pit, on our five measures of network position. It includes university and period fixed effects, along with controls for coverage and activity period. The coverage of a university is the number of observed professors who taught there divided by its activity period length. The activity period length of a university is the number of years during which this university is active. We find that, except for strength, all these centrality measures correlate significantly with academic output of the top five scholars. This indicates that the more central a university is in the network along these different dimensions, the higher its academic output. Assuming that the flow of ideas follows the paths created by mobile scholars, we can understand that the more central a university is, the more new and diversified ideas it can access, which would enhance its academic production. Of course, our regressions only allow us to establish correlation between position in the network and academic production, not to infer causality. Moreover, it is also very plausible that causality goes the other way: more prestigious and productive universities likely attract more scholars, which improves their central position in the network. But still, the diffusion of ideas mechanism is also possibly at play.
We now examine more closely how religious affiliation interacts with network structure. Connections between Catholic and Protestant universities over time are shown in Table 7.
CONNECTIONS BETWEEN CATHOLIC AND PROTESTANT UNIVERSITIES

Table 7 Long description
The table presents data on connections between Catholic and Protestant universities over four time periods: 1450-1522, 1523-1597, 1598-1684, and 1685-1793. It includes four rows and five columns. The columns are labeled with the time periods and the rows are labeled with the variables: proportion of C-P edges, IH index for C univ, IH index for P univ, and modularity religion. The proportion of C-P edges decreases over time from 27.51 in 1450-1522 to 3.99 in 1685-1793. The IH index for C univ increases from 0.52 in 1450-1522 to 0.95 in 1685-1793. The IH index for P univ also increases from 0.31 in 1450-1522 to 0.70 in 1685-1793. Modularity religion shows an increase from 0.10 in 1450-1522 to 0.46 in 1685-1793.
Source: Authors’ computations.
We first note that in 1450–1522, just before the Reformation, almost 28 percent of connections are between C universities and would-be P universities, while this share shrinks to 6.05 percent and 3.99 percent during the last two periods after the Reformation. During the first three periods under study, this proportion is low because there are few would-be P universities relative to
 $${\bf{C}}$$
universities. Additionally, Catholic and Protestant universities tend to have more connections with universities of the same religion over and above the relative size of their religious group. We use the inbreeding homophily index developed by Coleman (Reference Coleman1958). It measures the tendency for universities to form connections with others who share the same attribute (religion) (see Online Appendix D for a definition) to compare the degree of homophily among Catholic and Protestant universities across time. The inbreeding homophily index is positive and increases significantly in the last two periods after the Reformation for C and P universities. While the IH index for C universities equals 0.52 from 1450 to 1522, it peaks at 0.87 and 0.95 in 1598–1684 and 1685–1793, respectively. We find a similar pattern for P universities: their IH index increases from 0.31 before the Reformation to 0.71 and 0.70 in the last two periods after the Reformation.
$${\bf{C}}$$
universities. Additionally, Catholic and Protestant universities tend to have more connections with universities of the same religion over and above the relative size of their religious group. We use the inbreeding homophily index developed by Coleman (Reference Coleman1958). It measures the tendency for universities to form connections with others who share the same attribute (religion) (see Online Appendix D for a definition) to compare the degree of homophily among Catholic and Protestant universities across time. The inbreeding homophily index is positive and increases significantly in the last two periods after the Reformation for C and P universities. While the IH index for C universities equals 0.52 from 1450 to 1522, it peaks at 0.87 and 0.95 in 1598–1684 and 1685–1793, respectively. We find a similar pattern for P universities: their IH index increases from 0.31 before the Reformation to 0.71 and 0.70 in the last two periods after the Reformation.
Finally, we use the modularity score to evaluate the extent to which the partition of universities along their religious affiliation explains the structure of the network. We consider a community structure Π based on religions. We distinguish two communities in Π: Catholic and Protestant. The partition of universities along religious affiliations exhibits positive modularity scores, indicating that there are more links in communities than we would expect in a randomly generated graph. However, while the modularity score just before Reformation is 0.10, it reaches 0.39 and 0.46 in the last two periods under study, indicating that religion is a good predictor of the network structure after the Reformation. To make sure that the partition along religious affiliations is a significant community structure, we replicate 1,000 randomized networks that have the same degree distribution as the original data and evaluate their modularity scores for the last two periods after Reformation. We find that no randomized networks have a modularity score higher than 0.39 and 0.46, respectively, in 1598–1684 and 1685–1793. In fact, the maximal modularity scores of these 1,000 networks for these two periods are, respectively, 0.08 and 0.06. Thus, it can be said that division along religious affiliations significantly impacts the structure of the network of universities after the Reformation.
However, we should not omit the fact that religious affiliation is highly correlated with geography and vernacular languages, as most Protestant universities are located in Northern Europe and use a Germanic language for everyday life, and most Catholic universities can be found in Southern European countries and use a Romance language. To ensure that our previous analysis does not simply capture the impact of closer geographic or linguistic distance rather than membership in the same religious group, we disentangle these two effects in the next section.
GEOGRAPHY AND VERNACULAR LANGUAGES VS. RELIGION
In this section, we show that geography and culture (vernacular languages) are also important, which is not surprising, but does not substitute for the role of religion. To do so, we investigate the determinants of the relationship between each possible pair of nodes. In our setting, we investigate the presence or the absence of a link gij. Our aim is to estimate to what extent belonging to the same religious group determines the presence of a connection between two universities, controlling for geography, culture, and curricula. Since there may exist heterogeneous effects across subreligions, we decompose the effect of sharing the same religious affiliation by distinguishing the effect of both being Lutheran from the effect of both being Calvinist, and so on. Our main independent variables of interest are thus the geographic and linguistic distances between any pair of universities, differences in curricula, and dummy functions indicating whether the two universities in the dyad are both Lutheran, Calvinist, etc.
To study the determinants of a connection between two universities, two types of approaches are possible. The first consists of estimating the whole network at once, using, for example, the exponential random graph model (ERGM). In this approach, each dyadic link is potentially affected by all the other links. For example, a major empirical regularity of networks is that they have elevated rates of triadic closure: if Alice knows Bob, and Bob knows Christina, then the probability Christina knows Alice tends to be higher than the probability she knows another randomly drawn person. The ERGM approach allows the model to incorporate network features like the number of triangles in the modeling process (Robins et al. Reference Robins, Pattison, Kalish and Lusher2007). The second consists of estimating dyadic regressions. In this case, the probability that a link between two nodes exists depends only on the characteristics of these two nodes. Two models can be used to estimate such bivariate links: a linear probability model and a generalized linear model (typically, a logit).Footnote 6
The simplest model in this menu is the linear probability model, which we implemented in the working paper version of this work. It is an approach that is widely used in economics, particularly in international trade models. If one needs to simulate the model, it has one major limitation. Nothing guarantees that the fitted probabilities will be between 0 and 1. In our case, for all our regressions, around 30 percent of the fitted probabilities were below 0 (and a small proportion above 1). Such a high share of negative values is not acceptable and indicates that a logit or a probit would be more appropriate.
At the other end of the complexity spectrum, we tried to estimate the full network with the ERGM. Here, the number of independent variables is too high, and convergence is not achieved. This reflects the results of Chandrasekhar (Reference Chandrasekhar, Bramoullé, Galeotti and Brian2016) on the difficulty of estimating networks with ERGM when the size of the network is large. Another drawback of the ERGM approach is that it is not possible to integrate into the analysis node fixed effects.
We thus opted to estimate the dyadic regressions using a logit model. As with the ERGM, estimations based on the standard maximum likelihood estimator suffered from convergence issues related to the number of regressors. The bias-reduced estimator proposed by Kosmidis and Firth (Reference Kosmidis and Firth2020) instead led to satisfactory results. The bias-reduction method is an improvement over traditional maximum likelihood because its estimator is second-order unbiased and has smaller variance than the maximum likelihood estimator, and its corresponding standard errors are always finite, while the maximum likelihood estimates can be infinite. This model enables the integration of node fixed effects, a crucial factor for controlling unobservable attribute variables. Using such a penalized estimator is quite standard in settings where it is important to account for fixed effects; see Chetty, Friedman, and Rockoff (Reference Chetty, Friedman and Rockoff2014). The primary criticism that could be directed at such a network formation model is its potential failure to generate as many triads as observed in real networks. To address this concern, we compare the proportions of triads in our observed networks with those in networks generated using our estimates. We find that our fitted networks produce a similar proportion of triads as are observed in our real networks.Footnote 7 This result reinforces our confidence in the decision to use this network formation model.
Our estimated model is

The dependent variable gij is the dyadic network measure equal to 1 if there is a link between universities i and j, and 0 otherwise.
Geographical distance is defined as ![]() , where costij is the minimum cost it takes to travel from i to j, computed using Özak (Reference Özak2010)’s human mobility index. Parameter
, where costij is the minimum cost it takes to travel from i to j, computed using Özak (Reference Özak2010)’s human mobility index. Parameter ![]() is the minimum cost incurred when traveling within the same city (say from Jardins des Plantes to Sorbonne). We assume it is equivalent to the cost of walking within the old city of Rome between the Vatican City and the Colosseum (3.5 km).
is the minimum cost incurred when traveling within the same city (say from Jardins des Plantes to Sorbonne). We assume it is equivalent to the cost of walking within the old city of Rome between the Vatican City and the Colosseum (3.5 km).
Linguistic distance ℓij is controlled for by including a dummy variable which takes the value 1 when both i and j belong to the same broad linguistic family, and 0 otherwise. We consider three broad language subgroups of the Indo-European language family (Fortson IV 2011), Italic (or Romance), Germanic, Slavic, and the Uralic family. Even if Latin was the common language for research and teaching, vernacular languages may have played a role in everyday life.
We also control for curricular differences across institutions. To measure such a distance, we first compute the share of each broad field f in each institution i, sif. The broad fields are based on what scholars teach and include: theology, law (all sorts), humanities, medicine, sciences, applied sciences, and social sciences. The last two fields are very rare, and only appear in the last period. To measure the similarity between two institutions i and j, we apply the Renkonen similarity index (Renkonen Reference Renkonen1938) to our context. It is a measure of similarity between two biological communities (universities here), based on relative (proportional) abundances of individuals of different species (fields here). This measure of sample similarity is considered robust to sample size and species number. Its formula is:
It ranges from 1 (identical proportional abundances of fields to 0 (no field shared).
Dummy functions I(i, j ∈ PL), etc., indicate whether or not universities i and j are both Lutheran, Calvinist, etc. We include such a dummy function for each subreligion, that is, PL, PC, PP, PA, CS, and CJ. For each specification, we include cross effects to control for the differentiated impact of belonging to different subreligious groups. We introduce dummy functions, captured by the vector Kij, for each configuration except the one that will be the reference category.Footnote 8
We also add two other explanatory variables: the number of overlapping years during which both universities i and j are active, which is denoted υij, and the minimum coverage denoted v ij = min(vi, vj) where the coverage vi of university i is the number of observed professors who taught there divided by its activity period length. This is to control for the fact that two universities that are simultaneously active during a long-time period are more likely to have a connection than two universities that only share a couple of active years. We add minimum coverage controls because we are more likely to observe a connection between two universities for which we have a lot of information in our sample, as is the case for Germany and Italy, than between universities for which we have poorer coverage.
To address the issue of spatial correlation, we use a two-way fixed effect model, which includes a fixed effect for universities i and j, αi and αj (De Weerdt Reference De Weerdt and Dercon2004; De Weerdt, Genicot, and Mesnard 2019). Autocorrelation is the possible correlation between the error term associated with the dyad formed by university i and university j, εij, and all the error terms associated with other dyads in which i or j appear, ε.i, εi., ε.j, and εj. Concretely, we include one dummy for each university that indicates whether the specific university is part of the dyad or not. This means that there are two dummy variables equal to one for each observation. By including these university fixed effects, we control for observable attribute variables; for instance, the fact that large universities may have more connections than universities with small capacities. These university fixed effects also enable us to control for unobserved attribute variables; for instance, universities that encourage mobility are more likely to have more links than universities that do not. Including these dummies thus purges the effects of all attribute variables and therefore eliminates autocorrelation.
To run our dyadic regressions, we make a dataset of all possible unique combinations of two universities. We include in this dataset all universities where at least one scholar taught during the period under study.Footnote 9 For instance, from 1685–1793, we count 135 such universities, so the number of possible dyads is 9,045.Footnote 10 We delete dyads for which the two universities were not active during the same period of time. This is to avoid two potential biases in our estimates. The first one is simply the fact that two universities that were not simultaneously active are less likely to share a connection. For instance, if university i was active until 1690, it is very unlikely that it shares a connection with university j that opened ten years later. Second, even for universities whose active periods are separated by less than 100 years, deleting such dyads mitigates the issue of the mobility of scholars triggered by the closure of their university. Assume that university i closes, forcing its scholars to find another teaching position at another university that is currently active. If university j opens only a few years after the closing of university i, we cannot know whether scholars would have chosen university j or not if it had been active when their previous university i closed. Deleting such dyads removes these possible biases. Thus, our final sample for 1685–1793 is reduced to 8,982 dyads. We show in Table 8 results when the dependent variable is the presence or absence of a link.
DYADIC REGRESSIONS

Table 8 Long description
The table presents dyadic regressions analyzing the presence or absence of a link between universities across various time periods. It includes data from 1000 to 1199, 1200 to 1347, 1348 to 1449, 1450 to 1522, 1523 to 1597, 1598 to 1684, and 1685 to 1793. The table has 10 columns and 10 rows, with each column representing a different time period and each row representing different variables and their coefficients. Key variables include d_ij, q_ij, l_ij, and several indicator variables (I(i,j ∈ P^L), I(i,j ∈ P^C), I(i,j ∈ P^F), I(i,j ∈ P^D), I(i,j ∈ C^S), I(i,j ∈ C^F)). The table also includes observations, log likelihood, and Akaike information criterion for each time period. Notable trends and coefficients are highlighted, showing the statistical significance and impact of each variable on the presence or absence of a link between universities.
Notes: *p<0.1; **p<0.05; ***p<0.01
Includes university fixed effects, controls for varying coverage and activity periods, interaction terms between all subreligion. Reference category: CS–PL dyads.
Source: Authors’ computations.
Our main result is that religion significantly explains the structure of the network of European universities after the Reformation, even when geography, language, and curricula are controlled for. First, the impacts of geographic distance, language, and curricula are, unsurprisingly, significant and consistent across periods. Increasing traveling costs between two universities reduces their odds of being connected (first line of Table 8). The more similar two universities are in terms of curricula, the more likely it is that they share a connection (second line of Table 8). Belonging to the same broad linguistic family increases the odds of being connected (third line of Table 8). We are surprised to see no spectacular increase in the coefficient of linguistic distance over time. Binzel, Link, and Ramachandran (Reference Binzel, Link and Ramachandran2024) claim that by the end of the sixteenth century, vernacular works became the majority, which led to more knowledge production in the early modern period. The use of spoken tongues in teaching may, of course, prevent a professor of medicine from Rome from teaching in Jena, breaking down the homogeneity in the European university landscape. One should, however, not overestimate the importance of vernacularization. The work by Binzel, Link, and Ramachandran (Reference Binzel, Link and Ramachandran2024) is based on all types of works published and may not be an accurate description of scholarly work. To clarify this point, we looked at the languages used in the publications of the university professors in our database and found that Latin persisted longer in academia. It started to decline for professors beginning their career in 1700, implying that vernacularization is a late eighteenth-century phenomenon in academia.
Second, for almost all subgroups, sharing the same religious affiliation is associated with a statistically higher probability of being connected in the network after the Reformation (last three columns of Table 8). The estimated coefficients are almost all significant and quite large for all subreligion dummies. This indicates that subreligions have a strong predictive power for connecting two universities. For instance, between 1685 and 1793, two universities that are both secular are nearly 461 times more likely to share a connection than if one is secular and one is Lutheran, all else being equal.
To further understand the significance of religion, we employ a simulation approach based on dyadic regression. Leveraging the outcomes derived from these dyadic regressions, we create predicted networks and counterfactual networks. In the construction of predicted networks, each dyad is ascribed its anticipated probability of connection between the respective universities. We then generate 1,000 predicted networks using these estimated probabilities. In the counterfactual simulations, we investigate what the structure of the mobility network could be in a non-religious world. To be precise, by non-religious world, we mean a world where universities do not have a religious affiliation, and religion is irrelevant to their activity. There is no perfect way to conduct such a simulation. The challenge resides in setting the constant term in the dyadic regression, which amounts to scaling the probabilities of having links, in a world we do not observe. We considered three possibilities. First, it is possible to set the constant to obtain the same number of connected universities as in the benchmark simulation. In doing so, the counter-factual simulation generates networks with a reasonable number of connections, neither too small nor too large. The negative side of this approach is that, in principle, the Reformation may have changed the number of linked universities. A second approach is to extrapolate to periods 5 to 7 a constant that we estimated for periods 1 to 4. This approach keeps the world as it was before. However, the number of universities increased a lot from period 4 to 5 and 6, so what was observed in period 4 is not representative of anything in periods 5–7. The third way is to assume that, in the absence of Reformation, there would be no Protestant affiliations; moreover, the Jesuits would never have been involved in higher education. All universities, old and new, would be Catholic. We thus use the coefficient of the dummy variable, taking a value of one when both universities are secular, to scale the non-religious world. This is not perfect, because this coefficient has been estimated in a world where there was a Reformation, but it has the merit of clarity: in our non-religious world, we assume all universities behave as Catholic universities. To be precise: in the formation of the non-religious networks, we assign to each dyad its expected probability of connection, keeping only the coefficient linked to the secular dummy variable that we apply to all dyads and excluding all the coefficients linked to other subreligion dummy variables. Another set of 1,000 non-religious networks is then generated based on these probabilities. The 500th draw of both predicted and non-religious networks for the two final periods post-Reformation is illustrated in Figure 3, while Table 9 presents the corresponding descriptive statistics.
SIMULATED NETWORKS
Note: Secular Catholic universities are purple, while Jesuit universities are blue filled. Lutheran, Presbyterian, Calvinist, and Anglican universities are respectively orange, brown, yellow, and pink.
Source: Authors’ illustration.

Figure 3 Long description
The image contains four network graphs illustrating university connections during two distinct time periods. The top two graphs represent the years 1598 to 1684, while the bottom two graphs represent the years 1685 to 1793. Each graph features nodes representing universities and edges indicating connections between them. Secular Catholic universities are marked in purple, while Jesuit universities are shown in blue. Lutheran, Presbyterian, Calvinist, and Anglican universities are represented in orange, brown, yellow, and pink, respectively. The graphs on the left are labeled as 'Predicted Network,' and those on the right are labeled as 'Non-Religious Network.' The nodes are interconnected with lines, illustrating the relationships and mobility patterns among universities during these historical periods.
DESCRIPTIVE STATISTICS OF OBSERVED,’ SIMULATED, AND COUNTERFACTUAL NETWORKS AFTER REFORMATION

Table 9 Long description
The table presents descriptive statistics for observed, predicted, and non-religious networks after the Reformation. It includes data for two periods: 1598-1684 and 1685-1793. The table has four rows and six columns, with headers Observed, Predicted, S.E., Non-Religious, and S.E. Each row provides statistics for different network metrics: Connected Universities, Connected Pairs, Density, Average Distance, Modularity (P-C), and Interfaith Edges (percentage). Notable trends include the increase in connected pairs and density in the predicted and non-religious networks compared to the observed networks. The average distance decreases in the predicted networks but remains relatively stable in the non-religious networks. Modularity and interfaith edges show variations across the different network types and periods.
Notes: Isolated universities included in the computations.
Source: Authors’ computations.
When comparing the main descriptive statistics of the predicted networks with those of the observed network, we find that our simulation performs well for most measures. We then compare predicted networks with non-religious networks. We find that if religion were not a determinant of network structure, the proportion of connections between Protestant and Catholic universities would have risen from about 6 percent to 46 percent on average. If religion had not been a criterion for mobility, we would have observed many more exchanges between scholars in the Protestant and Catholic worlds. The overall structure of the network would have been affected, as illustrated by the drop in modularity scores between the predicted and non-religious networks. While the partition of universities across religions significantly explains the structure of predicted networks with modularity scores around 0.41, it is a poor predictor of the non-religious networks, as their modularity scores do not exceed 0.01. Additionally, it is likely that if religion had not mattered, the network of European universities would have been smaller, as illustrated by the decrease in average distance for non-religious networks. But it is not easy to discern to what extent this drop is due to the removal of the religion effect, or to the increase in links in non-religious networks.
We thus confirm that, in addition to geography and vernacular languages, religion was a strong determinant of network structure. What could be the mechanisms behind this effect? Religious intolerance is an obvious candidate. The economic literature has stressed the importance of intolerance on the Catholic side (Blasutto and De la Croix Reference Blasutto and De la Croix2023; Dewitte et al. Reference Dewitte, Drago, Galbiati and Zanella2022), but Protestants were not immune to intolerance either (see, e.g., the book by Walsham (Reference Walsham2006) on religious persecution in England).
REFORMATION, CENTRALITY, AND ACADEMIC PRODUCTION
In this section, we explore whether universities were harmed after the (Counter-)Reformation in terms of their individual positions in the network. We saw in the fourth section that the positions of universities in the network were significantly correlated with publications of their top five scholars (see Table 6). Moreover, the fifth section showed that the structure of the network of European universities changed radically after the Reformation. Thus, we would like to investigate whether publication performances also changed after the Reformation, through the network structure.
To do so, we compute the average centrality score of each university in the predicted networks,![]() , as well as their average centrality score in the non-religious networks,
, as well as their average centrality score in the non-religious networks,![]() , for several normalized measures of centrality. The centrality score in the non-religious networks can be interpreted as the “natural” centrality score of universities: it tells us what the centrality score of each university would have been if the Reformation had never taken place. The difference between these two scores for university i,
, for several normalized measures of centrality. The centrality score in the non-religious networks can be interpreted as the “natural” centrality score of universities: it tells us what the centrality score of each university would have been if the Reformation had never taken place. The difference between these two scores for university i,![]() , thus measures the increase (or decrease) of its centrality score after Reformation relative to its natural centrality score. If the difference is positive, then it can be said that the Reformation had a positive impact on university i in terms of centrality score. We average these differences in centrality scores for each subreligion after the Reformation. Results on degree, closeness, and eigenvector centralities are shown in Table 10.
, thus measures the increase (or decrease) of its centrality score after Reformation relative to its natural centrality score. If the difference is positive, then it can be said that the Reformation had a positive impact on university i in terms of centrality score. We average these differences in centrality scores for each subreligion after the Reformation. Results on degree, closeness, and eigenvector centralities are shown in Table 10.
CENTRALITY LOSSES FOLLOWING THE REFORMATION

Table 10 Long description
The table presents centrality losses of universities following the Reformation, comparing different subreligions and time periods. It includes data for Lutheran, Calvinist, Anglican, Presbyterian, Catholic secular, and Jesuit universities. The table is divided into three sections: Degree, Closeness, and Eigenvector centralities. Each section lists the centrality losses for the periods 1598-1684 and 1685-1793. For Degree centrality, Lutheran universities show the highest loss in both periods, followed by Calvinist and Anglican. For Closeness centrality, Lutheran universities again show significant losses, with Calvinist and Anglican following. For Eigenvector centrality, Lutheran universities have the highest loss in the first period, while Presbyterian universities show notable loss in the second period. The table provides specific values and standard errors for each measurement.
Source: Authors’ computations.
We observe that average differences in degree, closeness, and eigenvector centrality scores are almost all negative for all subreligious groups after the Reformation. Given the standard errors in parentheses, most of the differences are significantly different from zero, but they are not significantly different from each other (across religious affiliations). In other words, the network reorganization due to the constrained mobility of scholars during the Reformation and Counter-Reformation is associated with losses for most universities in terms of centrality, independent of their affiliation. Note that closeness centrality is the most precisely measured (least volatile across simulations).
Centrality measures in a network of universities competing for talent can provide significant insights into the dynamics of competition. Here’s how different centrality measures could be interpreted in the context of competition analysis.
A university with a high degree centrality attracts talent from many other universities or loses talent to many others. This could indicate high attractiveness as an employer (if primarily receiving talent) or high turnover or instability (if primarily losing talent). High degree centrality universities are likely highly competitive, either as key players in acquiring talent or as targets of competition due to their high turnover.
A university with high closeness centrality has a shorter average distance to all other universities in the network. This suggests they are strategically positioned to attract or lose talent efficiently. High closeness centrality universities are thus well-connected to the broader market. They may quickly respond to changes in competition or shifts in the talent pool.
Universities with high eigenvector centrality are connected to other influential universities. This could indicate that they are at the core of the competitive network. These universities may be part of tightly connected clusters where competition is fierce or where top-tier talent circulates. Their influence might shape industry trends in attracting talent.
Universities with high centrality measures (especially eigenvector or closeness) are likely to be in the core of the competitive landscape, while universities with low centrality measures might be peripheral players or niche competitors. Drops in centrality over time could signal decreased competition.
Interestingly, these centrality measures are significantly associated with a higher volume of publications, as observed in Table 6. This aligns with the idea that heightened competition among universities, reflected in their centrality scores, fosters increased academic output. Consequently, declines in centrality following the Reform could indicate reduced competition and, therefore, diminished incentives to produce academic publications.
Beyond the competition for professors, there is also competition to attract students. Our analysis of the network of universities showed that competition has decreased on the side of professors but stays silent on the side of students or on competition between the Catholic and Protestant churches for religious market share. We know from the literature that such competition between religious groups was exacerbated, in particular during and after the wars of religion. For example, Leeson and Russ (Reference Leeson and Russ2018) show that more intense religious-market contestation led to more intense witch trial activity.
We now want to measure the association between the Reformation and publications through the network structure. We do so by explaining the publications of institutions in a panel of universities over the seven periods. The estimated model is:
The dependent variable pit is the inverse hyperbolic sine of publications of top five scholars. We add a religious dummy I(i ∈ P) indicating whether the university is Protestant. The reference category is Catholic universities. In doing so, we aim at separating a direct correlation between Protestantism and publications from an indirect link through the network of universities. We code all universities as Catholic before 1523. We add centrality in the non-religious network ![]() to capture changes in the non-religious features of the network affecting publications, as well as the difference in centrality between predicted and non-religious networks
to capture changes in the non-religious features of the network affecting publications, as well as the difference in centrality between predicted and non-religious networks ![]() as a measure of the role of religious affiliation through the network. Finally, we add university and period fixed effects, αi, αt. Results are displayed in Table 11.
as a measure of the role of religious affiliation through the network. Finally, we add university and period fixed effects, αi, αt. Results are displayed in Table 11.
RELIGIONS, CENTRALITY, AND PUBLICATIONS

Table 11 Long description
The table presents data on the impact of religion and centrality on the number of publications by top scholars. It includes four columns: Degree, Closeness, Eigenvector, and Adjusted R squared. Each column contains multiple rows with statistical values and their standard errors. The Degree section shows the effect of Protestant affiliation and centrality measures on publications. The Closeness section highlights the influence of closeness centrality and its difference on publications. The Eigenvector section presents the impact of eigenvector centrality and its difference. The Adjusted R squared values indicate the model fit for each section.
Notes: *p<0.1; **p<0.05; ***p<0.01
No. observations: 531
Includes university and period fixed effects. Reference: i ∈ C.
Source: Authors’ computations.
Column (1) of Table 11 shows that becoming Protestant undoubtedly correlates with publications of top five scholars, which is consistent with Table 1. Columns (2) and (3) tell us that becoming more central in terms of degree, closeness, and eigenvector centrality “naturally” correlates with publications, which is consistent with Table 6. In Column (4), the significant coefficient associated with the difference in centrality between predicted and non-religious networks indicates that becoming more central in terms of degree or closeness centrality after the Reformation correlates with publications.
The fact that the coefficient associated with the Protestant dummy is still significant in Column (4) for degree and closeness centrality suggests several interpretations. First, this dummy takes into account the possible benefits of Protestantism for scholars through the emphasis on writing and publishing in Protestant culture. The notion that Protestant cultures have historically placed greater emphasis on written texts over oral traditions, especially in their early stages, is often linked to what is known as the “Protestant print ethic” or the “culture of the book.” This concept stems from the Protestant Reformation’s focus on individual engagement with the Bible, which was facilitated by its translation into vernacular languages and the advent of printing technology. Unlike traditions that prioritize oral customs and liturgical rituals, Protestantism promoted personal reading and interpretation of scripture. This fostered a culture that valued literacy and treated written texts as both authoritative and enduring. Protestantism specifically, Stone (Reference Stone1969) argued, was a culture of the book, of a literate society. Second, the dummy captures the relative direct effect of Protestantism vs. Catholicism. It could be related to a deterioration of the institutional environment in Catholic countries, as stressed by Henriques and Palma (Reference Henriques and Palma2023). In the same vein, the censorship of books prevailing in Catholic countries could have discouraged scientific production or redirected authors to less promising subjects (Blasutto and De la Croix Reference Blasutto and De la Croix2023).
The fact that the two other coefficients of the specification in Column (4) are also positive and significant is an indication that position in the network mattered as well, especially reorganization of positions in the network after the Reformation and Counter-Reformation. We saw that the Reformation and Counter-Reformation induced constrained mobility of scholars during the seventeenth–eighteenth centuries, which likely harmed all universities in the European network. Thus, it can be said that part of the decline of Catholic universities in terms of publications in the modern period, shown in Table 1, correlates with the Reformation. We may also conjecture that the rise of Protestant universities in terms of publications during the same period would have been even greater had the mobility of scholars not been constrained.
As discussed earlier, the loss of centrality following the Reformation can be interpreted as a decline in competition within the academic market. To examine the impact of the Reformation on competition for students, we introduce a new variable,![]() , which represents the shortest distance to a university of the opposite confession with at least 50 percent similarity in the fields of study offered. This distance varies over time as universities are founded or dissolved. For instance,
, which represents the shortest distance to a university of the opposite confession with at least 50 percent similarity in the fields of study offered. This distance varies over time as universities are founded or dissolved. For instance, ![]() is relatively small for French Catholic universities during the period 1598–1684, due to the presence of Protestant universities in France. However, it becomes significantly larger after their dissolution, particularly in the period 1685–1793. In a bivariate regression where publications are regressed on the minimum distance, we find that the coefficient is negative and statistically significant at the 10 percent level (see Table F.10 in the Online Appendix). This result aligns with the hypothesis that increased competition (i.e., shorter distances) fosters greater academic output, as measured by publications. However, the coefficient becomes statistically insignificant when the Protestant dummy and centrality measures are included in the regression. The coefficients of the Protestant dummy and centrality measures remain unaffected by the inclusion of
is relatively small for French Catholic universities during the period 1598–1684, due to the presence of Protestant universities in France. However, it becomes significantly larger after their dissolution, particularly in the period 1685–1793. In a bivariate regression where publications are regressed on the minimum distance, we find that the coefficient is negative and statistically significant at the 10 percent level (see Table F.10 in the Online Appendix). This result aligns with the hypothesis that increased competition (i.e., shorter distances) fosters greater academic output, as measured by publications. However, the coefficient becomes statistically insignificant when the Protestant dummy and centrality measures are included in the regression. The coefficients of the Protestant dummy and centrality measures remain unaffected by the inclusion of ![]() in the model, suggesting that the minimum distance as a measure of competition does not add much to the benchmark specification.
in the model, suggesting that the minimum distance as a measure of competition does not add much to the benchmark specification.
However, we find that the minimum distance is significantly shorter for Protestant universities compared to Catholic universities. On average, the closest competitor to Protestant universities is 6.19Footnote 11 whereas for Catholic universities, it is 6.85.Footnote 12 This difference is statistically significant at the 1 percent level. This provides an additional channel for understanding why, despite the negative effects of the Reformation on centrality, Protestant universities outperformed their Catholic counterparts in terms of publications: the shorter distance to their closest competitor may have intensified competition for students, thereby incentivizing greater academic productivity to enhance their attractiveness.
Finally, we zoom in on the very low proportion of links between Catholic and Protestant universities in 1598–1684 and 1685–1793. In 1598–1684, 25 professors link the Catholic and Protestant worlds, representing only a very small share of the total number of professors who taught in at least two universities in this period (25/1,027 = 2.4%). In 1685–1793, this proportion falls to 0.9 percent, with only 13 scholars connecting Catholic and Protestant universities out of 1,393 mobile scholars. A short biography of these bridge-builders is provided in Online Appendix I. There are several renowned scholars who might be immune from petty religious fights. Who would dare to ask one of the Bernoullis to convert to Catholicism if Padova wants to hire him? We also note that these links involving superstars touch a small number of universities. Padova seems an example of openness. The Dutch universities too seem to have been quite open. We do not observe any connections involving a Spanish or a Polish university. Beyond the stars, we also have a few “obscure” scholars establishing links between the two worlds. This seems to occur more often when they teach a very specialized topic (Hebrew, Arabic). Then, there are cases of conversion, for which we do not know what came first: a true conversion requiring a change of university, or a better job offer requiring a conversion. Finally, we note that there is no systematic pattern in the direction of moves. For example, among the 16 renowned scholars, 6 moved from Catholic to Protestant universities (Bernoulli, Hermann, Tissot, Gronovius, Dempster, Baudier) while 10 moved from Protestant to Catholic universities (Ferrari, Sömmering, Frank, Rhode, van Swieten, Dieze, Forster, Parival, Abudacnus, Jesenius).
Table 12 displays the results of a regression of the inverse hyperbolic sine of the number of academic works on a dummy variable indicating whether a professor connects a Protestant and a Catholic university and, on another dummy, indicating whether a professor is a mobile scholar.
PUBLICATIONS OF THE CONNECTING SCHOLARS

Table 12 Long description
The table presents regression results for the inverse hyperbolic sine of the number of academic works, comparing two time periods: 1598-1684 and 1685-1793. It includes three rows for each period: Constant, Mobile, and Connecting P and C, with corresponding values and standard errors. The table also lists the number of observations and adjusted R-squared values for each period. Notable trends include higher values for the Constant and Connecting P and C variables in the 1685-1793 period compared to the 1598-1684 period.
Notes: *p<0.1; **p<0.05; ***p<0.01
Estimator is OLS. Reference group: immobile scholars.
Source: Authors’ computations.
In both periods, mobile scholars publish significantly more than scholars who stayed at the same university during their entire careers. Publications of mobile scholars are, on average, 65.0 percent and 54.8 percent more numerous than publications of immobile scholars in 1598–1684 and 1685–1793, respectively. Results are even more striking for scholars connecting a Protestant and a Catholic university. In 1598–1684, our 25 connecting persons have, on average, 161.7 percent more publications compared to immobile scholars. In 1685–1793, our 13 connecting scholars publish, on average, 469.7 percent more than immobile scholars.
CONCLUSIONS
For a long time, the European academic world was an interconnected network, with scholars moving between positions at will. With the Reformation and the Counter-Reformation, the academic world became divided. Few people held positions in both worlds. We have shown that this religious divide had severe consequences. Universities were hit hard in terms of centrality, which had repercussions for research output. Publications in the Catholic world peaked at their pre-reform level. On the Protestant side, we show that the Reformation positively impacted their publications through a direct effect; however, this effect was partly offset by losing centrality in the network of European universities.
These results were obtained by looking at a new database of tens of thousands of European scholars through the lens of network theory. We also created a new tool by generating simulated and counter-factual networks as predicted from a dyadic regression. With this tool, it is possible to separate the effect of religion and show that the proportion of connections between Protestant and Catholic universities would have been multiplied by a factor of seven if religion had not intervened.
Our conclusion is derived from examining the medium-term impact of the Reformation on the network of universities. It does not explicitly model other potential effects of Protestantism on scholars and universities, addressing them only through fixed effects, nor does it consider the very long-term impact of this division. By provoking a new division within Christianity, and being divided in itself, Protestantism contributed to democracy and pluralism. For Bruce (Reference Bruce2019), “The fragmentation of Protestantism represented an important element in the development of religious tolerance,” but it took centuries to be achieved.
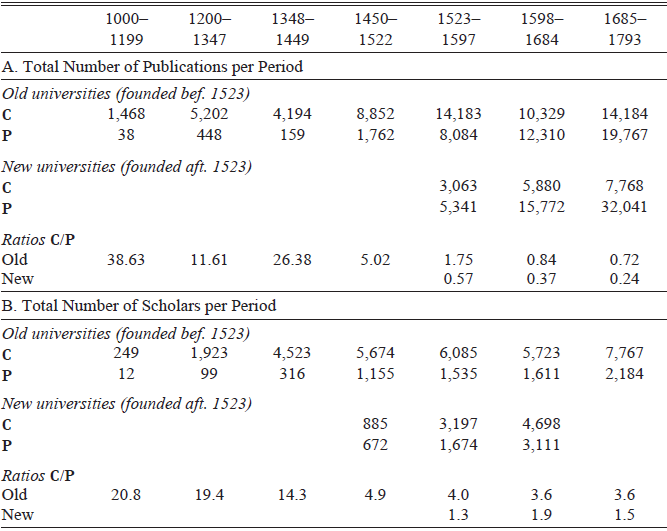
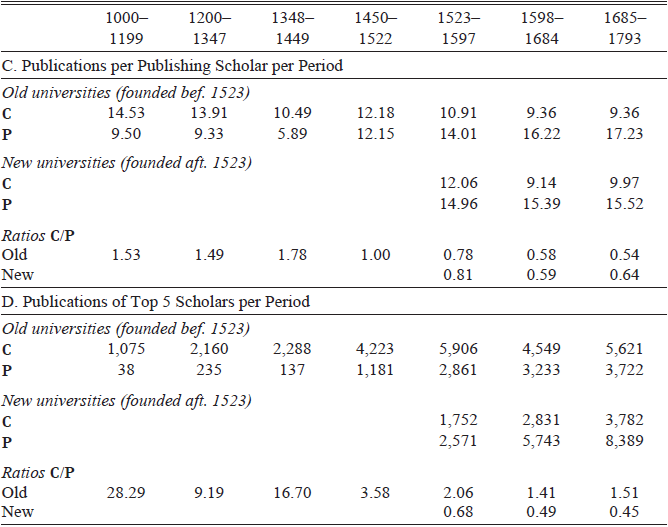
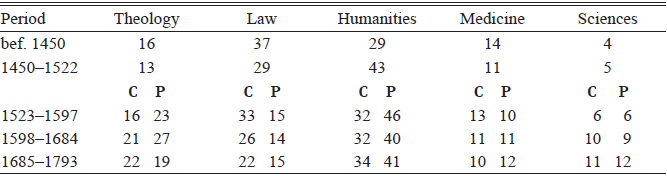
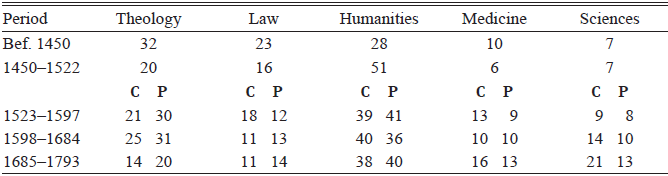
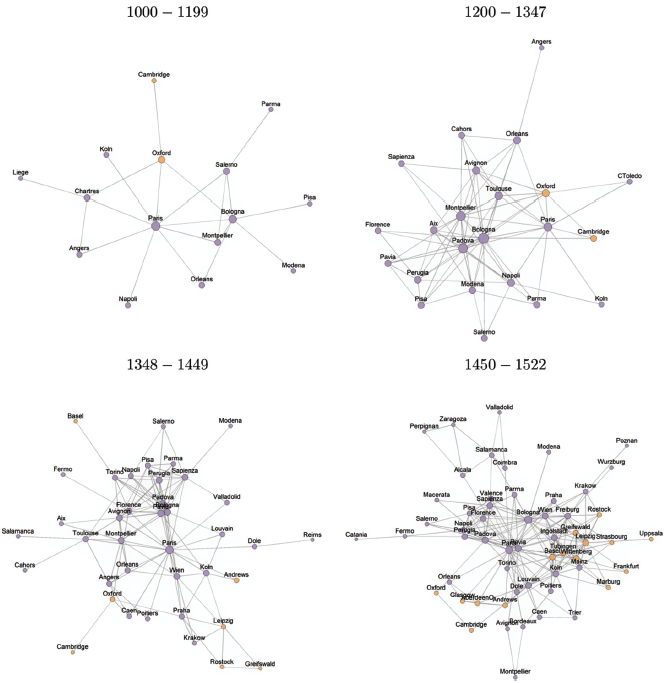
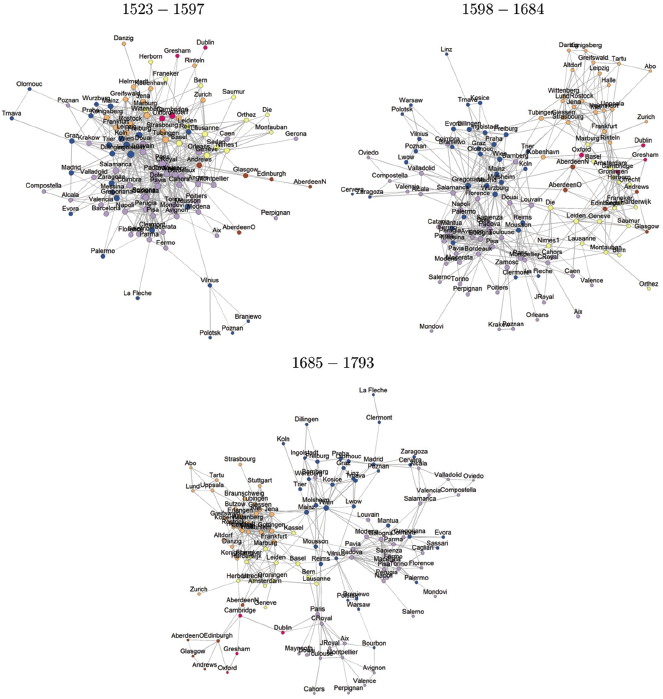
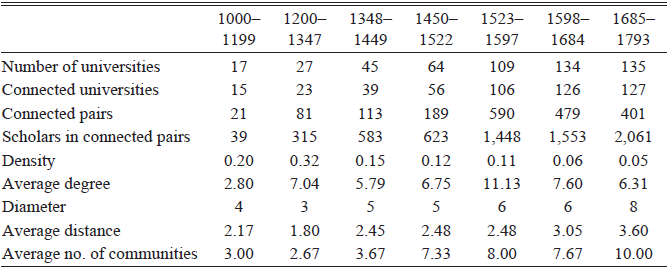
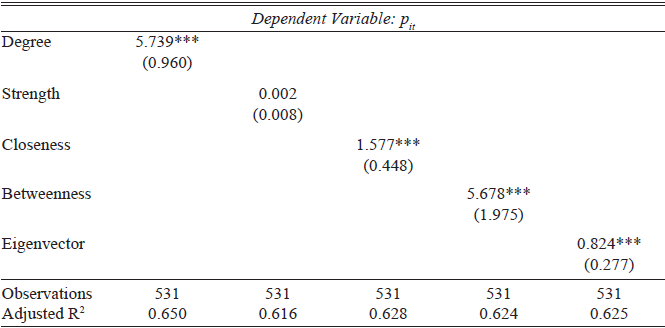
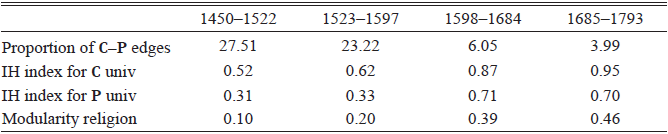
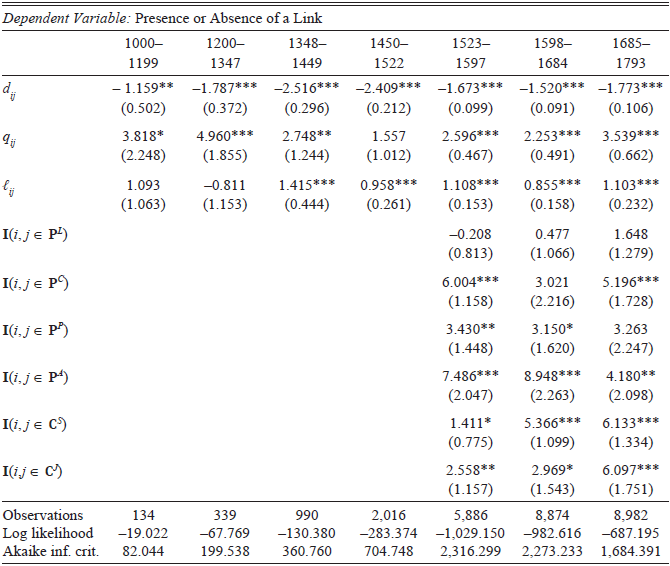
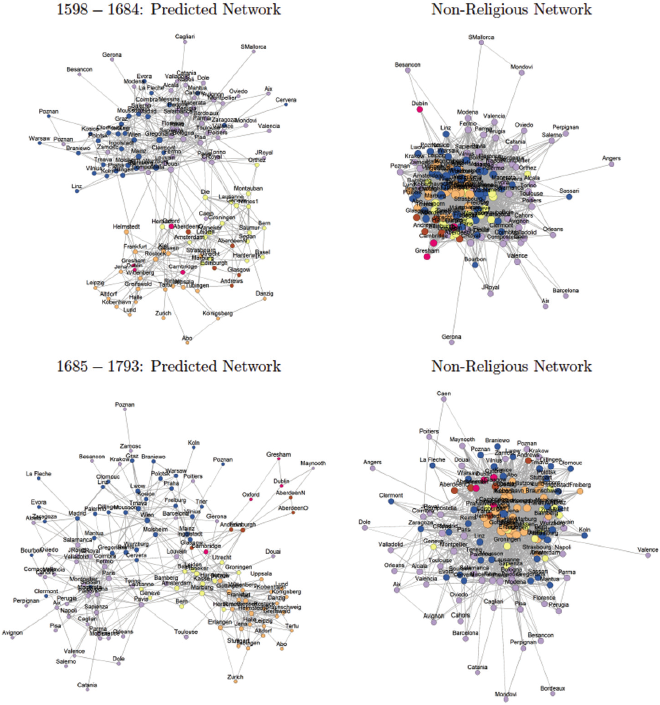
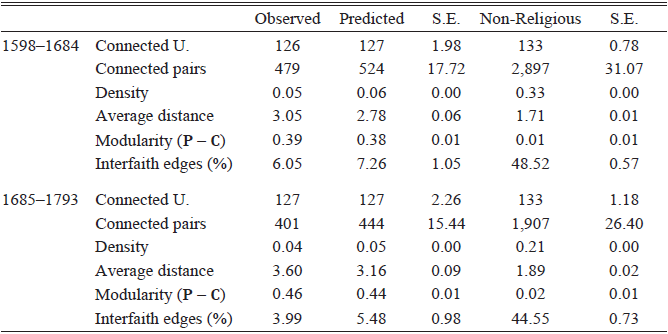
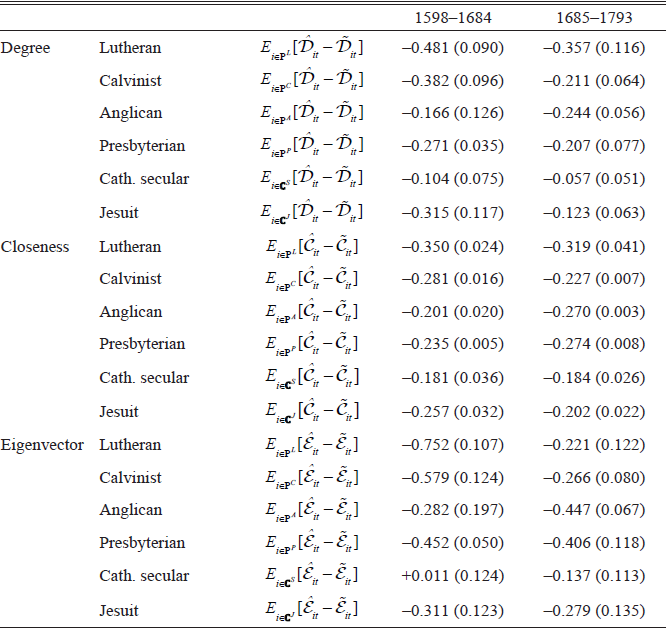
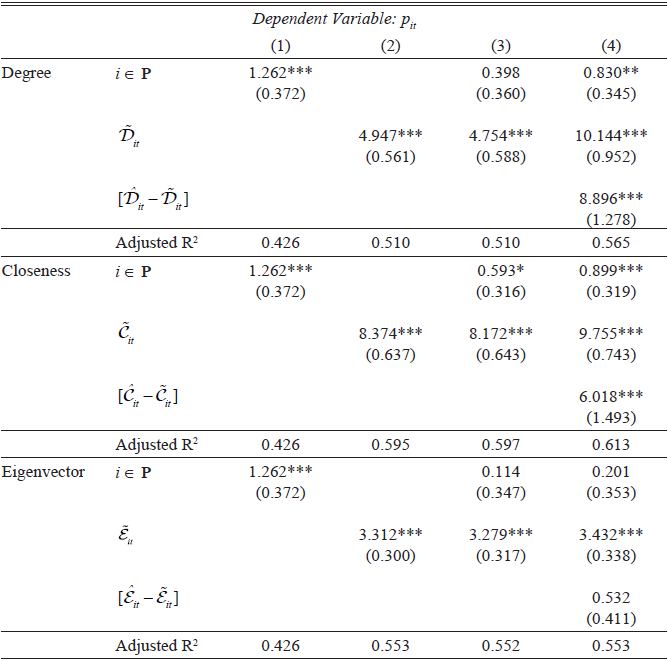
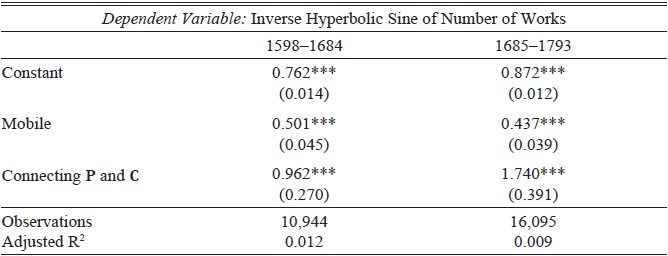


 Open access