

Childhood and adolescence represent dynamic periods of rapid growth and weight gain( Reference Cole, Freeman and Preece 1 ). Chronic intake of excess energy and sedentary behaviours however promote a state of positive energy balance and expansion of adipose tissue (AT) mass beyond that which is expected during normal maturation( Reference Anderson, Economos and Must 2 , Reference Savage, Mitchell and Smiciklas-wright 3 ). The short- and long-term health consequences of elevated BMI in childhood and adolescence remain unclear. While some prospective studies suggest that excess weight gain during these developing years is directly associated with adverse future health outcomes, including incidence of type 2 diabetes (T2D)( Reference Bhargava, Sachdev and Fall 4 , Reference Forsen, Eriksson and Tuomilehto 5 ), CVD( Reference Eriksson, Tuomilehto and Osmond 6 , Reference Tirosh, Shai and Afek 7 ) and some cancers( Reference Jeffreys, Smith and Martin 8 , Reference Renehan, Tyson and Egger 9 ), others disagree( Reference Salonen, Kajantie and Osmond 10 – Reference Lloyd, Langley-Evans and McMullen 12 ). Studies that fail to show a relationship between childhood weight and disease outcome in adulthood have suggested that significant relationships dissipate when adjusted for adult BMI( Reference Lloyd, Langley-Evans and McMullen 12 ). Furthermore, healthy weight adults who were obese during childhood have similar risk for T2D and heart disease as individuals who have maintained a healthy weight throughout life( Reference Juonala, Magnussen and Berenson 13 ). These data suggest that direct associations between childhood BMI and later metabolic disease risk may reflect tracking of weight status and persistent obesity rather than an independent effect. The more immediate metabolic consequences of overweight and obesity in children and adolescents are considerably variable. Despite marked obesity, up to 95 % of children and adolescents maintain normal glucose tolerance (NGT)( Reference Invitti, Guzzaloni and Gilardini 14 , Reference Sinha, Fisch and Teague 15 ). Although it is established that adiposity significantly correlates with insulin resistance (IR) in obese children and adolescents( Reference Tershakovec, Kuppler and Zemel 16 – Reference Maffeis, Manfredi and Trombetta 18 ), the relatively moderate nature of this association (R 2 0·05–0·40)( Reference Tershakovec, Kuppler and Zemel 16 – Reference Maffeis, Manfredi and Trombetta 18 ) strongly suggests a more complex relationship which is likely to involve an interplay between genetic and environmental factors.
Despite varying inter-individual obese phenotypes, successful weight management interventions consistently demonstrate improvements in LDL cholesterol, TAG and fasting insulin in this cohort( Reference Ho, Garnett and Baur 19 ). However, achieving a significant reduction in BMI is difficult for this age-group( Reference McGovern, Johnson and Paulo 20 ). Also, long-term studies have shown that weight regain frequently occurs( Reference Rolland-Cachera and Thibault 21 , Reference Gately, Cooke and Butterfly 22 ). Therefore there is growing interest in the investigation of dietary approaches that may improve metabolic outcome in the absence of weight loss. In this regard, cross-sectional and observational studies have suggested a relationship between dietary fat quality and metabolic phenotype, wherein SFA are inversely associated with insulin sensitivity, whereas MUFA and PUFA are positively associated with a favourable metabolic phenotype( Reference Perreault, Zulyniak and Badoud 23 – Reference Rump, Popp-Snijders and Heine 27 ). Additionally, animal studies have demonstrated that the replacement of SFA with MUFA or PUFA attenuates IR and dyslipidaemia, despite positive energy balance( Reference Korotkova 28 – Reference Massiera, Saint-Marc and Seydoux 37 ). However, results from randomised controlled trials (RCT) are less consistent( Reference Nobili, Bedogni and Alisi 38 – Reference Velázquez-López, Santiago-Díaz and Nava-Hernández 48 ), suggesting that energy balance may be the most critical factor regulating metabolic risk. However, there is increasing evidence that responsiveness to dietary interventions may vary depending on the phenotypic characteristics( Reference Gibney and Walsh 49 ); thus personalised nutrition approaches may optimise efficacy of future dietary interventions within a background of weight stability. In order to design effective personalised interventions, it is important to firstly elucidate the determinants and consequences of distinct phenotypes within childhood and adolescent obesity.
Adipose tissue expandability: a determinant of the metabolic phenotype in paediatric obesity?
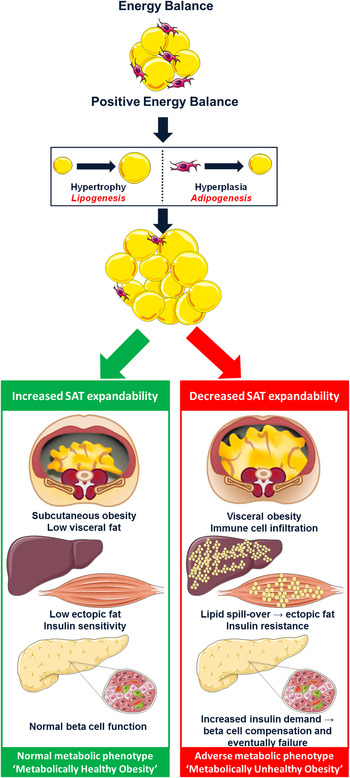
Intrauterine exposures, postnatal growth and family history of T2D may all play a role in discriminating metabolically healthy (MHO) from unhealthy (MUO) obese phenotypes in childhood, perhaps by modulating expandability of subcutaneous adipose tissue (SAT)( Reference Desai, Beall and Ross 50 ). In a state of positive energy balance, expansion of AT mass results from an increase in adipocyte cell size (hypertrophy), cell number (hyperplasia) or both( Reference Jo, Gavrilova and Pack 51 ). Cell number is now considered a key regulator of metabolic function( Reference Arner, Westermark and Spalding 52 ). Hypertrophy is associated with a low generation rate of new adipocytes, whereas the more benign hyperplasia is associated with high adipocyte generation rates from adipogenic precursor cells (adipogenesis) and is linked to a more favourable phenotype( Reference Arner, Westermark and Spalding 52 ). The SAT expandability hypothesis, as presented in Fig. 1, proposes that SAT has a defined restricted capacity to increase its mass safely for any given individual( Reference Virtue and Vidal-Puig 53 ). With persistent energy overload, reduced SAT expansion capacity promotes lipotoxicity( Reference Virtue and Vidal-Puig 54 ). This is characterised by lipid deposition in visceral adipose tissue (VAT), myocytes, hepatocytes and pancreatic β-cells, accompanied by impaired insulin sensitivity, elevated NEFA and TAG and a pro-inflammatory profile; important drivers of MUO( Reference Virtue and Vidal-Puig 53 , Reference Lacasa, Taleb and Keophiphath 55 , Reference Naukkarinen, Heinonen and Hakkarainen 56 ). Thus, metabolic dysregulation within the context of obesity may occur upon exhaustion of an individual's SAT expansion capacity rather than at an absolute AT mass( Reference Gray and Vidal-Puig 57 ). Consistent with this hypothesis, obese adolescents with impaired glucose tolerance (IGT) were shown to have decreased SAT, increased VAT, raised intramyocellular lipid content and impaired non-oxidative glucose disposal compared with NGT controls, despite similar weight, BMI and body fat percentage( Reference Weiss, Dufour and Taksali 58 ). Likewise, when obese adolescents were stratified by proportion of VAT (VAT (cm2)/VAT+SAT (cm2)), those in the highest tertile had significantly increased 2-h glucose, insulin, c-peptide and TAG concentrations( Reference Taksali, Caprio and Dziura 59 ). Most interestingly, these high-risk subjects had a lower BMI and total body fat percentage than their metabolically healthier counterparts( Reference Taksali, Caprio and Dziura 59 ). A recent study of adult weight-discordant monozygotic twins demonstrated SAT hypertrophy, low adipocyte number and down-regulation of the adipocyte differentiation pathway in co-twins with MUO( Reference Naukkarinen, Heinonen and Hakkarainen 56 ). Interestingly, MUO but not MHO was accompanied by low mitochondrial and high inflammatory transcript activity( Reference Naukkarinen, Heinonen and Hakkarainen 56 ). Down-regulation of mitochondrial metabolism reduces the availability of acetyl-CoA and ATP, key substrates necessary to support de novo lipogenesis in adipocytes. Consistently, gene expression analysis in SAT of adolescents with MUO demonstrated down-regulation of key components of the lipogenesis pathway, including sterol regulatory element-binding protein-1 (SREBP-1), acetyl-CoA carboxylase alpha, fatty acid synthase, lipoprotein lipase and PPARγ( Reference Kursawe, Eszlinger and Narayan 60 ). Moreover, results from a second study by the same group revealed that in contrast to SAT, there was increased expression of lipogenic genes such as carbohydrate-responsive element-binding protein, SREBP-1c, patatin-like phospholipase domain-containing protein 3, fatty acid synthase and acetyl-CoA carboxylase in the liver of obese adolescents with IGT/T2D compared with equally obese NGT controls( Reference Kursawe, Caprio and Giannini 61 ). These results highlight the tissue-specific differential implications of lipogenesis and adipogenesis on metabolic health.
(colour online) The subcutaneous adipose tissue expandability hypothesis( Reference Virtue and Vidal-Puig 53 ). The hypothesis proposes that in positive energy balance, subcutaneous adipose tissue (SAT) has a limited capacity to increase its mass. Exceeding this threshold promotes lipotoxicity. Excess lipid accumulates within visceral adipose tissue, liver and skeletal muscle rendering these tissues insulin resistant. In an effort to compensate for reduced insulin sensitivity, hyperinsulinaemia ensues eventually leading to pancreatic β-cell failure and type 2 diabetes (metabolically unhealthy obesity). However, increased capacity to expand SAT protects against lipotoxicity and maintains metabolic homeostasis despite obesity (metabolically healthy obesity). Adapted from Després and Lemieux( Reference Després and Lemieux 62 ).
Adipose tissue expandability: mechanisms of action
AT expansion is dependent upon two mechanisms: adipogenesis and lipogenesis. Adipogenesis is the process wherein new mature adipocytes are generated from adipogenic precursor cells termed preadipocytes( Reference Wernstedt Asterholm, Tao and Morley 63 ). This process involves two major phases; firstly preadipocytes are recruited and proliferated (phase one) after which these precursor cells are differentiated into mature fat cells (phase two)( Reference Avram, Avram and James 64 ). The differentiation step ultimately increases the lipogenic potential of adipocytes, or in other words the capacity of the adipocyte to store lipid as TAG. Adipogenesis involves a cascade of events involving two transcription factor families; PPARγ and CCAAT/enhancer-binding proteins α, β and δ. Lipid accumulation within mature adipocytes is determined by the balance between lipogenesis and lipolysis. Lipogenesis encompasses the synthesis of fatty acids and subsequently TAG from acetyl-CoA, an intermediate of glucose metabolism. Lipogenesis is largely under the control of the insulin-sensitive transcription factor SREBP-1 and Insig1, an endoplasmic reticulum membrane protein( Reference Li, Takaishi and Cook 65 ). Lipolysis involves the release of NEFA from AT TAG( Reference Rosen and Spiegelman 66 ). TNFα, a pro-inflammatory cytokine that is often elevated in MUO is an inducer of lipolysis( Reference Rydén and Arner 67 ). Furthermore, lipolysis is increased in T2D, as insulin fails to appropriately suppress lipolysis promoting ectopic lipid accumulation in peripheral tissues such as liver and skeletal muscle( Reference Virtue and Vidal-Puig 54 ).
Adipogenesis
Animal studies that utilised a high-fat diet (HFD) to mimic an obesogenic environment have confirmed the importance of adipogenesis in the determination of the metabolic phenotype. It has been demonstrated that knockdown of a key adipogenic gene, PPARγ-2 in the ob/ob mouse model promoted decreased fat mass accompanied by severe IR, β-cell failure and dyslipidaemia compared with control mice( Reference Medina-Gomez, Gray and Yetukuri 68 ). Consistently, ob/ob mice overexpressing adiponectin, i.e. adiponectin transgenic mice, were shown to have a near limitless capacity to expand SAT and importantly did not develop components of the metabolic syndrome; demonstrating normal glucose and insulin levels compared with controls( Reference Kim, Van De Wall and Laplante 69 ). Additionally, macrophage infiltration into AT was reduced and PPARγ targets were increased in these adiponectin transgenic mice compared with control ob/ob mice( Reference Kim, Van De Wall and Laplante 69 ). Adiponectin was proposed to signal storage of TAG specifically in AT, while reducing TAG levels in liver and muscle, where ectopic lipid accumulation can impair insulin signalling( Reference Kim, Van De Wall and Laplante 69 ). A dominant negative mutation in PPARγ in human subjects results in lipodystrophy, characterised by significant loss of SAT from the extremities, and severe IR( Reference Barroso, Gurnell and Crowley 70 ). Interestingly, in an animal model, the same phenotype was only observed when these mice were challenged with excess energy availability (ob/ob background)( Reference Gray, Nora and Grosse 71 ). The presence of this PPARγ mutation prevented adipocyte recruitment as well as adipocyte hypertrophy( Reference Gray and Vidal-Puig 57 ). Importantly the present study showed that when AT expandability was limited there was a worsened IR state compared with control ob/ob mice( Reference Gray and Vidal-Puig 57 ). In addition, components of the TNFα and IL-1-β-signalling pathways prevent PPARγ binding to DNA by associating with NF-κB( Reference Suzawa, Takada and Yanagisawa 72 ). This suppresses PPARγ function, which is important for determining stem cells to the adipocyte lineage and therefore prevents hypertrophy( Reference Suzawa, Takada and Yanagisawa 72 ).
Extracellular matrix flexibility
Another important aspect for AT expandability is maintenance of flexibility within the extracellular matrix (ECM). This allows the AT to expand in a healthy manner without any adverse effects. However, with increased obesity, interstitial fibrosis in white adipose tissue (WAT) may decrease ECM flexibility, which eventually leads to adipocyte dysfunction( Reference Sun, Tordjman and Clément 73 ). The ECM and its primary protein collagens are vital for maintaining the structural integrity of adipocytes and are important regulators of adipogenesis and AT formation( Reference Sun, Tordjman and Clément 73 ). During adipocyte differentiation, ECM components are present at variable time-points where initially fibronectin is increased, followed by collagens III, V, VI and I( Reference Kubo, Kaidzu and Nakajima 74 , Reference Nakajima, Muroya and Tanabe 75 ). Several studies have highlighted significant correlations between collagen VIα3 and chronic immune cell infiltration, based on increased M1 macrophages( Reference Pasarica, Gowronska-Kozak and Burk 76 ). Collagen VI is primarily involved in maintaining ECM structure and is composed of three subunits in its mature form: α1; α2; α3( Reference Park, Morley and Scherer 77 ). All three of these isoforms are responsible for formation of a stable protein structure( Reference Park, Morley and Scherer 77 ). Mice lacking collagen VI challenged with either HFD or genetically induced obesity demonstrated increased ECM flexibility and decreased AT fibrosis( Reference Khan, Muise and Iyengar 78 ). There was evidence of unlimited adipocyte expansion and, as a result, there were whole body improvements in energy homeostasis( Reference Khan, Muise and Iyengar 78 ). During normal development of the AT, the ECM is highly dynamic( Reference Tam, Tordjman and Divoux 79 ). However, ECM processes become dysregulated in obesity and coupled with immune cell accumulation in the AT, impair metabolic function and suppress capacity for AT expansion( Reference Sun, Kusminski and Scherer 80 ). Abnormal collagen deposition has been shown to be a hallmark of fibrosis development in AT and is tightly associated with tissue inflammation characterised by the influx of macrophages( Reference Sun, Tordjman and Clément 73 ). In contrast, a study that examined ECM remodelling in developing AT in healthy weight and obese children illustrated characteristics of collagen deposition that differed in normal weight and obese subjects( Reference Tam, Tordjman and Divoux 79 ). Moreover, these features observed in AT of children were distinct from adults with established obesity or animal models of diet-induced obesity such as immune cell infiltration and fibrosis( Reference Tam, Tordjman and Divoux 79 ). Findings from the present study showed that in normal-weight children there was greater collagen deposition in AT, which may restrict growth( Reference Tam, Tordjman and Divoux 79 ). Conversely lower collagen in AT of overweight children was observed, but increased with age and fat cell size allowing for the expansion of fat cell size and thus tissue growth( Reference Tam, Tordjman and Divoux 79 ). These findings may reflect an overall situation of dynamic tissue remodelling reflecting normal physiological growth processes involving increases in fat cell size( Reference Tam, Tordjman and Divoux 79 ). It would be expected that normal growth and expansion of fat cell size would have no adverse effects if ECM remains flexible and there are proportional increases in blood flow and oxygenation( Reference Tam, Tordjman and Divoux 79 ). However, if collagen deposition occurs along with recruitment of M2 macrophages in children, this may inhibit AT expansion( Reference Tam, Tordjman and Divoux 79 ).
Matrix metalloproteinases
Collagenases are involved in the breakdown of excessive accumulation of ECM. A family of endopeptidases, matrix metalloproteinases (MMP), are involved in cleaving collagenous proteins enabling the remodelling of the ECM( Reference Sun, Tordjman and Clément 73 ). The use of a broad MMP inhibitor in a mouse model demonstrated the important role MMP plays in remodelling during obesity( Reference Lijnen 81 ). Administration of this MMP inhibitor reduced collagen degradation, which resulted in the formation of a collagen-rich matrix that impeded AT growth( Reference Lijnen 81 ). Other MMP, such as 2 and 9, are elevated in obesity and increased during adipocyte differentiation( Reference Bouloumie, Sengene and Portolan 82 ). One particular MMP, MT1-MMP plays a role in AT ECM remodelling and is required for the modulation of tight pericellular collagens to allow preadipocytes to grow out of the stroma( Reference Chun, Hotary and Sabeh 83 ). In mice, the absence of MT1-MMP impedes AT development, causing a lipodystrophic phenotype in these mice( Reference Chun, Hotary and Sabeh 83 ).
Hypoxia
Rapid expansion of AT results in a hypoxic state as the adipocytes reach their diffusion of oxygen limit quickly due to the lack of neovasculature establishment for the expanding AT( Reference Sun, Tordjman and Clément 73 ). Therefore this hypoxic state is one of the early determinants of AT dysfunction( Reference Rosen and Spiegelman 66 ). Hypoxia inducible factor-1, which is a transcription factor induced by a hypoxic state can initiate in turn a profibrotic transcriptional programme( Reference Sun, Tordjman and Clément 73 ). With persistent positive energy balance, a point will eventually be reached at which SAT can no longer store excess lipid. When subcutaneous adipocytes overfill, hypoxia inducible factor-1α suppresses β-oxidation via transcriptional repression of sirtuin-1, which deacetylases and thus activates PPARγ coactivator1α( Reference Krishnan, Danzer and Simka 84 ). A lipotoxic state emerges, with net lipid flux to non-adipose organs and ectopic lipid deposition( Reference Krishnan, Danzer and Simka 84 ). HFD induces doubling of the fat cell area and can create a local hypoxia state resulting in increased hypoxia inducible factor-1α( Reference Sun, Tordjman and Clément 73 ). Hypoxia inducible factor-1α is not proangiogenic in AT, but it induces synthesis of ECM components leading eventually to the development of AT fibrosis( Reference Sun, Tordjman and Clément 73 ).
Characteristics of metabolically unhealthy obesity in children and adolescents
Altered lipid partitioning as commonly exhibited by MUO youths may increase risk of IR through a number of potential mechanisms.
Adipose tissue dysfunction
Firstly, VAT to a greater extent than SAT secretes several pro-inflammatory insulin-desensitising cytokines, including TNFfi and IL-6( Reference Fontana, Eagon and Trujillo 85 , Reference Bruun, Lihn and Pedersen 86 ). As a result, macrophages, T-cells and dendritic cells are recruited to VAT via various signals, including chemokines synthesised by adipocytes( Reference Hotamisligil 87 – Reference Hotamisligil, Shargill and Spiegelman 89 ). This favours a pro-inflammatory insulin-desensitising milieu, contributing to local and systemic IR( Reference McArdle, Finucane and Connaughton 90 ). Importantly, many of these pro-inflammatory mediators initially identified in adults have also been confirmed in the circulation of obese children, including elevated leptin, IL-6, C-reactive protein, TNFfi, fibrinogen and vascular adhesion molecules( Reference Corgosinho, de Piano and Sanches 91 – Reference Stelzer, Zelzer and Raggam 94 ). Furthermore, in children and adolescents the anti-inflammatory adipocytokine adiponectin has been shown to correlate negatively with BMI and well as plasma levels of TAG and NEFA, and positively with peripheral insulin sensitivity. These findings confirm that obesity dysregulates inflammation, even in childhood.
Pro-inflammatory cytokines mediate their insulin desensitising effect via serine phosphorylation of insulin receptor substrates (IRS). In insulin sensitivity, a number of complex signalling cascades are induced when insulin binds to its receptor( Reference Hotamisligil 87 ). Tyrosine phosphorylation of IRS-1 leads to activation of (1) the phosphatidylinositol 3-kinase–protein kinase B pathway, which is responsible for insulin induced glucose uptake and gluconeogenesis suppression; (2) the mitogen-activated protein kinase pathway, which regulates gene expression( Reference Gual, Le Marchand-Brustel and Tanti 95 ). In the hypertrophic obesity state, pro-inflammatory cytokines activate several serine kinases, including IκB kinase, cJun NH2-terminal kinase, mammalian target of rapamycin and protein kinase C-θ( Reference Gual, Le Marchand-Brustel and Tanti 95 ). These kinases inhibit insulin action by causing phosphorylation of serine residues on IRS-1. Serine phosphorylation of IRS-1 disrupts insulin-receptor signalling thereby impairing downstream propagation of insulin signalling( Reference Schenk, Saberi and Olefsky 96 ). Serine kinases also exert powerful effects on gene expression, including promoting further inflammatory gene expression through activation of activator protein-1 and NF-κB( Reference Schenk, Saberi and Olefsky 96 ).
Hepatic lipid deposition
Lipid deposition in the liver has been proposed as the most critical marker of IR and glucose dysregulation in obese youth; prevalence in this cohort can range from 10 to 77 %( Reference Cali, De Oliveira and Kim 97 , Reference D'Adamo, Cali and Weiss 98 ). Hepatic steatosis in obese children and adolescents is accompanied by inflammation and dyslipidaemia; specifically high levels of large VLDL and small dense LDL as well as decreased large HDL and low adiponectin concentrations( Reference Santoro, Feldstein and Enoksson 99 ). The amount of lipid in hepatocytes is determined by a combination of events: (1) hepatic fatty acid uptake derived from AT lipolysis and hydrolysis of circulating TAG; (2) de novo fatty acid synthesis; (3) fatty acid oxidation; (4) fatty acid export from VLDL particles( Reference D'Adamo, Marcovecchio and Giorgis 100 ). Evidence indicates that insulin is fundamental to the regulation of transcription factors such as SREBP-1c, which are abundantly expressed in the liver. SREBP-1c is a key regulator of hepatic lipogenesis and is increased in response to hyperinsulinaemia in the liver of ob/ob mice( Reference Shimomura, Matsuda and Hammer 101 ). Additionally, inflammatory cytokines released by VAT or by the hepatic Kupffer cells may contribute to altered hepatic lipid metabolism; inflammation and increased oxidative stress factors are implicated in the pathogenesis of hepatic steatosis( Reference Odegaard, Ricardo-Gonzalez and Red Eagle 102 ). Although it is well established that IR and hepatic steatosis are closely associated, it is not known whether hepatic steatosis is a consequence or a cause of impaired insulin sensitivity( Reference Fabbrini, Sullivan and Klein 103 ). Nevertheless, the presence of steatosis is an important marker of multi-organ IR, glucose intolerance and dyslipidaemia in obese children and adolescents( Reference Burgert, Taksali and Dziura 104 ).
Raised intramyocellular lipid content in skeletal muscle
Obese insulin resistant children have also been shown to have higher levels of intramyocellular lipid when compared with obese insulin sensitive children( Reference Sinha, Dufour and Petersen 105 ). Furthermore, intramyocellular lipid content in these youths is inversely correlated with non-oxidative glucose disposal( Reference Weiss and Caprio 106 ). The effects of intramyocellular lipid deposition on insulin sensitivity are induced by fatty acid derivatives such as diacylglycerol and ceramides, which have also been demonstrated to alter the insulin signalling transduction pathway, leading to reduced glucose uptake and subsequent glycogen synthesis( Reference Sabin, Stewart and Crowne 107 ).
Pancreatic β-cell dysfunction
Pancreatic β-cell dysfunction has been proposed as the ultimate determinant of IGT/T2D onset in obese youth, and is the result of either a progressive decline in β-cell mass, or a functional defect of the β-cell that inhibits sufficient insulin secretion to offset systemic glucose load( Reference Giannini and Caprio 108 ). Obese adolescents with IGT and T2D have demonstrated significant decreases in first phase insulin secretion, that is the initial brief spike in insulin, when compared with NGT adolescents with a similar BMI( Reference Weiss, Caprio and Trombetta 109 ). In contrast, second-phase insulin secretion was preserved in NGT and IGT but not in T2D youths( Reference Weiss, Caprio and Trombetta 109 ). It has been suggested that increased β-cell apoptosis leads to the progressive loss of β-cells( Reference Meier and Bonadonna 110 ). Apoptosis is likely to be induced by a number of local factors, including 1L-1β production, reactive oxygen species, endoplasmic reticulum stress and glucose toxicity within β-cells( Reference Meier and Bonadonna 110 – Reference Donath and Shoelson 112 ).
Critical periods of adipose tissue development: potential dietary approaches to improve metabolic outcome
Maintenance of a healthy weight through balanced energy intake and expenditure is considered the first-line strategy for the prevention and treatment of metabolic complications in childhood and adolescent obesity( 113 ). However, it is clear from the aforementioned evidence that BMI is not the sole predictor of metabolic status in young people. Additionally, a meta-analysis of lifestyle interventions highlighted that weight loss is difficult to achieve in this age group( Reference McGovern, Johnson and Paulo 20 ). To this end, manipulation of dietary fat quality in the absence of energy restriction is a tempting alternative approach. Evidence indicates that the effect of fatty acids on AT function varies according to the degree of fatty acid saturation( Reference Bradley, Fisher and Maratos-Flier 114 ). While SFA has been identified as a potent stimulator of AT macrophage infiltration as well as pro-inflammatory, insulin de-sensitising cascades( Reference Reynolds, McGillicuddy and Harford 115 ), PUFA has demonstrated the potential to partially attenuate the metabolic stress conferred by chronic nutrient overload( Reference Kalupahana, Claycombe and Newman 116 ).
Perreault et al. illustrated a more favourable plasma fatty acid profile in individuals with MHO, compared with MUO controls( Reference Perreault, Zulyniak and Badoud 23 ). Specifically, phospholipid (PL) and TAG fatty acid composition comprised lower SFA and higher PUFA in MHO subjects. In fact, fatty acid composition of the plasma PL and TAG fractions explained 58 % of the variability in metabolic status across groups( Reference Perreault, Zulyniak and Badoud 23 ). It has been proposed that the protective effect of PUFA may be partially mediated via lipidome remodelling in the PL membrane of AT, given that increased PL PUFA incorporation is known to improve membrane fluidity( Reference Pietiläinen, Róg and Seppänen-Laakso 24 ). Indeed, the examination of SAT PL membranes in monozygotic weight-discordant twins revealed that adipocyte expansion in the obese co-twins was accompanied by a proportional increase in PUFA-containing ether lipids and a concurrent reduction in saturated and shorter-chain ester-bound lipids( Reference Pietiläinen, Róg and Seppänen-Laakso 24 ). Moreover, there is evidence to suggest that n-3 and n-6 PUFA differentially modulate AT function upon incorporation into the PL membrane. In vitro and animal studies suggest that n-6 PUFA promotes hypertrophy, while n-3 PUFA is associated with the more benign hyperplastic obesity( Reference Oosting, Kegler and Beek 30 , Reference Muhlhausler, Cook-Johnson and James 117 ). Interestingly, inhibition of lipogenesis by n-3 PUFA appears to be site-specific, at least in animal models. Studies that utilised rat WAT have demonstrated that n-3 PUFA limits hypertrophy in the intra-abdominal depots only( Reference Belzung, Raclot and Groscolas 33 , Reference Okuno, Kajiwara and Imai 34 , Reference Raclot, Groscolas and Langin 118 ) and this translates to an improved phenotype( Reference Okuno, Kajiwara and Imai 34 ). Okuno et al. reported that reduced VAT hypertrophy was accompanied by suppression of key regulators of late phase adipocyte differentiation; CCAAT/enhancer-binding protein α, adipsin, adipocyte protein 2 and PPARα in response to n-3 PUFA feeding( Reference Okuno, Kajiwara and Imai 34 ). Additionally, 3 weeks long-chain (LC) n-3 PUFA DHA administration in mice up-regulated PPARγ in SAT but concurrently down-regulated PPARγ expression in liver( Reference Sun, Wei and Li 36 ). Site-specific effects suggest that the promoter regions of adipogenic and lipogenic genes may differ between tissues( Reference Azain 119 ). In contrast to n-3 PUFA, in vitro and animal studies have demonstrated that an HFD rich in n-6 PUFA promotes activation of cyclic AMP-dependent signalling pathways in preadipocytes, a process which is known to favour adipocyte hypertrophy( Reference Massiera, Saint-Marc and Seydoux 37 ). Conversely, mice fed a mixture of n-3 and n-6 fats, thus lowering the n-6:n-3 ratio may favour hyperplasia to accommodate excess energy( Reference Massiera, Saint-Marc and Seydoux 37 ). It has been proposed that the shorter chain n-3 PUFA α-linolenic acid and its metabolites suppress Δ6 desaturase activity, thus reducing generation of the n-6 PUFA arachidonic acid and subsequent cyclic AMP production( Reference Raz, Kamin-Belsky and Przedecki 120 ).
There is growing evidence that gestation, infancy, age of adiposity rebound (AR) and adolescence represent critical periods in the course of AT development during which nutritional and environmental exposures determine future metabolic risk( Reference Cameron and Demerath 121 ). Thus, manipulation of (i) energy balance or (ii) dietary fat quality intake during these unique windows of opportunity may improve metabolic outcome.
Gestation
In the growing fetus, AT formation occurs between 5 and 29 weeks gestation( Reference Tarantal and Berglund 122 ). Early in this process, mesenchymal precursor cells differentiate into preadipocytes( Reference Poissonnet, Burdi and Garn 123 ) after which intense preadipocyte proliferation continues until approximately 23 weeks gestation( Reference Tarantal and Berglund 122 ). By week 28, WAT is present in the principal fat depots throughout the body( Reference Poissonnet, Burdi and Garn 123 ), while brown adipose tissue (BAT) can be identified earlier in development( Reference Billon and Dani 124 ). At full term, AT accounts for approximately 20 % of body mass in infants born an appropriate weight for gestational age (AGA); 80–90 % of which is stored subcutaneously( Reference Baker 125 – Reference Verkauskiene, Beltrand and Claris 128 ).
Energy balance
Expansion of fetal AT is largely determined by maternal substrate availability( Reference Wu, Bazer and Cudd 129 ). Not surprisingly, maternal obesity as well as under- and overnutrition in utero have shown potential to instil long-lasting metabolic consequences, possibly via epigenetic modifications( Reference Masuyama and Hiramatsu 130 , Reference Sarr, Yang and Regnault 131 ). AT growth is significantly impaired during fetal growth restriction( Reference Verkauskiene, Beltrand and Claris 128 , Reference Lapillonne, Braillon and Pg 132 ).The relatively high-energy cost of AT accretion means that during periods of suboptimal fetal energy supply, AT expansion is sacrificed in favour of other essential organs( Reference Godfrey and Barker 133 ). This raises the possibility of reduced capacity to expand SAT in the postnatal environment owing to reduced preadipocyte generation( Reference Shepherd, Crowther and Desai 134 – Reference De Zegher, Lopez-Bermejo and Ibáñez 136 ). In parallel, it has been proposed that in utero overnutrition may increase the subcutaneous adipogenic and lipogenic capacity( Reference De Zegher, Lopez-Bermejo and Ibáñez 136 ). In keeping with this hypothesis Bouhours-Nouet et al. showed that despite similar percentages of body fat mass, obese children and adolescents born after accelerated fetal growth, but in the absence of gestational diabetes, exhibited lower central and higher peripheral fat distribution than those born with an AGA( Reference Bouhours-Nouet, Dufresne and Boux De Casson 137 ). Whole-body and hepatic insulin sensitivities as well as adiponectin concentrations were significantly higher in high birth-weight subjects( Reference Bouhours-Nouet, Dufresne and Boux De Casson 137 ). However, not all studies have associated MHO with prenatal overnutrition. In fact, several( Reference Harder, Rodekamp and Schellong 138 ) although not all( Reference Whincup, Kaye and Owen 139 ) observational studies have suggested an association between high birth-weight and T2D risk in adulthood, highlighting that the possible protection associated with accelerated early growth may be somewhat transient. Even within the context of higher adipogenic and lipogenic potential in SAT, buffering capacity can be exceeded by chronic overnutrition, resulting in MUO development( Reference Lee, Mottillo and Granneman 140 ).
Intervention studies that have attempted to optimise the in utero nutritional environment and subsequent offspring outcome have shown mixed success. Examination of cardiometabolic risk factors in 2–24-year-old offspring who were conceived after maternal gastrointestinal bypass surgery compared with their siblings born prior to surgery showed that improved maternal pre-pregnancy BMI reduced offspring waist circumference( Reference Guénard, Deshaies and Cianflone 141 , Reference Smith, Cianflone and Biron 142 ), body fat percentage( Reference Guénard, Deshaies and Cianflone 141 ), fasting insulin( Reference Guénard, Deshaies and Cianflone 141 , Reference Smith, Cianflone and Biron 142 ), homeostasis model assessment (HOMA)-IR( Reference Guénard, Deshaies and Cianflone 141 , Reference Smith, Cianflone and Biron 142 ), blood pressure( Reference Guénard, Deshaies and Cianflone 141 ) and LDL-cholesterol( Reference Smith, Cianflone and Biron 142 ). Guénard et al. proposed that these improvements were somewhat mediated via epigenetic mechanisms, demonstrating almost 6000 differentially methylated genes between siblings; significantly affected genes primarily related to glucose homeostasis, inflammation and vascular disease( Reference Guénard, Deshaies and Cianflone 141 ). Conversely, a meta-analysis of 537 mother–neonate pairs revealed that although dietary interventions successfully reduced gestational weight gain by 6·5 kg in obese pregnant women, newborn birth-weight was unaffected( Reference Quinlivan, Julania and Lam 143 ). These results indicate that maternal obesity, irrespective of gestational weight gain confers independent risk on fetal growth. The long-term effects of reduced gestational weight gain on metabolic outcome in the offspring of obese mothers have not yet been described in human studies. However, in animals it has been demonstrated that when HFD-induced obese mice were switched to a low-fat diet during pregnancy their female offspring maintained normal insulin sensitivity even when challenged with an HFD for 20 weeks( Reference Gallou-Kabani, Vigé and Gross 144 ).
Dietary fat manipulation
Epidemiological examination of the relationship between maternal fatty acid profile in pregnancy and offspring AT function yields mixed results. A recent systematic review revealed that equal numbers of studies have illustrated direct, inverse and no associations between maternal n-3 PUFA intake during pregnancy and offspring adiposity( Reference Rodríguez, Iglesia and Bel-Serrat 145 ). Equally, little is currently known about the long-term metabolic implications of fatty acid intake or status during pregnancy. Somewhat counterintuitively given the in vitro and animal data discussed previously, a study of over 250 children revealed an inverse relationship between the umbilical cord concentration of n-6 PUFA γ-linolenic acid and insulin, leptin and HOMA-IR at age 7 years but no associations were detected with umbilical cord n-3 PUFA( Reference Rump, Popp-Snijders and Heine 27 ). Likewise, a second study examined the association between n-3 PUFA intake during the second trimester of pregnancy and cardiometabolic risk in 20-year-old offspring, and found no significant relationships( Reference Rytter, Bech and Halldorsson 41 ).
RCT of dietary fat manipulation in pregnancy are sparse and those conducted to date do not provide evidence of long-term benefits to AT or metabolic function in 1-year( Reference Much, Brunner and Vollhardt 146 ) or 19-year-old( Reference Rytter, Bech and Christensen 42 , Reference Rytter, Schmidt and Bech 43 , Reference Rytter, Christensen and Bech 147 ) offspring (Table 1). However, in the shorter term, a meta-analysis of 921 women illustrated that risk of pre-term birth, a known risk factor for future visceral adiposity and metabolic dysfunction, was successfully reduced by n-3 PUFA supplementation( Reference Salvig and Lamont 148 ), although the mechanisms are not yet established. Data emerging from RCT are somewhat in conflict with animal studies. In pregnant rats, consumption of a diet rich in n-3 PUFA results in reduced AT mass( Reference Korotkova 28 ), smaller adipocyte size( Reference Korotkova 28 ), lower serum leptin levels( Reference Korotkova 28 ), improved glucose homeostasis( Reference Siemelink, Verhoef and Dormans 29 ) and increased pancreatic islet numbers( Reference Siemelink, Verhoef and Dormans 29 ) in offspring. Inconsistency in results may be due to lower fatty acid dose in human studies, genetic background, duration of intervention( Reference Calder, Ahluwalia and Brouns 149 ), as well as the stage of gestation during which the intervention commences( Reference Hauner, Brunner and Amann-gassner 150 ). Additionally, it should be noted that the effect of dietary fat manipulation within the context of maternal obesity or in utero overnutrition is yet to be described in human studies. The lipid content of AT in large for gestational age (LGA) infants weighs 250–500 g more than AGA infants( Reference Kuipers, Luxwolda and Offringa 151 ). Importantly, increased maternal-to-fetal transport of LC PUFA is required to facilitate cell membrane demand during SAT hypertrophy and hyperplasia( Reference Kuipers, Luxwolda and Offringa 151 ).
Randomised controlled trials which investigated the effect of dietary fat manipulation on adipose tissue distribution and metabolic phenotype during critical periods of adipose tissue development

↔, no effect; ↓, decrease; ↑, increase; LC n-3 PUFA, long chain n-3 PUFA; WC, waist circumference; HbA1c, glycated haemoglobin; HOMA-IR, homeostasis model assessment–insulin resistance; MetS, metabolic syndrome; IDF, International Diabetes Foundation; IGF-1, insulin-like growth factor 1; hs-CRP, high-sensitivity C-reactive protein; IVGTT, intravenous glucose tolerance test; ISI, insulin sensitivity index; SBP, systolic blood pressure; DBP, diastolic blood pressure.
Postnatal and infant (<2 years) growth
With the exception of the first 5–12 d after birth, the rate of AT expansion rises rapidly in response to increased nutrient availability in the postnatal environment( Reference Cristancho and Lazar 152 ). During this period, precursor cells undergo morphological and functional transformation into mature lipid-laden adipocytes( Reference Cristancho and Lazar 152 ). Adipocyte numbers continue to rise throughout infancy and childhood, eventually reaching a maximum in late adolescence( Reference Knittle, Timmers and Ginsberg-fellner 153 , Reference Spalding, Arner and Westermark 154 ). After this time, adipocyte number remains relatively constant( Reference Arner, Westermark and Spalding 52 ) and is therefore determined from early life( Reference Spalding, Arner and Westermark 154 ).
Energy balance
Using data from over 8000 subjects, Druet et al. demonstrated that each +1 unit increase in weight sd score between 0 and 1 year doubles risk of childhood obesity (OR = 1·97), and increases risk of adult obesity by 23 % (OR = 1·23)( Reference Druet, Stettler and Sharp 155 ). Furthermore, cardiometabolic risk at age 17 was predicted by weight gain from 0 to 6 months( Reference Ekelund, Ong and Linné 156 ). However, birth-weight amongst other factors, may modulate the metabolic response to early weight gain. Intrauterine growth restriction predisposes individuals to visceral adiposity and IR in later life( Reference Morrison, Duffield and Muhlhausler 157 ). In a rodent model of intrauterine growth restriction, nutritionally induced catch-up growth led to AT hypertrophy as well as significant reductions in AT protein expression of IRS-1, phosphatidylinositol 3-kinase, protein kinase B-2 and phosphorylated protein kinase B( Reference Berends, Fernandez-Twinn and Martin-Gronert 158 ). Of note, many of the signalling impairments were apparent at 3 weeks in the absence of altered glucose and insulin concentrations, indicating that metabolic adaptations may occur early in the postnatal period( Reference Berends, Fernandez-Twinn and Martin-Gronert 158 ). Human studies indicate that in infants born small for gestational age, early infant weight gain (0–3 months) is positively correlated with fasting insulin concentration, HOMA-IR, lipid profile and systolic blood pressure in adolescence( Reference Fabricius-Bjerre, Jensen and Færch 159 ). Conversely, no adverse relationships were detected between early weight gain and later metabolic risk in AGA infants( Reference Fabricius-Bjerre, Jensen and Færch 159 ). Similarly, accelerated postnatal growth may not be detrimental to LGA infants, at least in the short term( Reference Bouhours-Nouet, Dufresne and Boux De Casson 137 ). As discussed previously, LGA infants who later become obese demonstrated protection against metabolic dysfunction compared with their AGA counterparts( Reference Bouhours-Nouet, Dufresne and Boux De Casson 137 ). When postnatal growth velocity was examined within this obese cohort, higher gains in BMI up to age 2 years conferred additional protection( Reference Bouhours-Nouet, Dufresne and Boux De Casson 137 ). Thus, the children who were born LGA and demonstrated the greatest weight gain up to 2 years, were the most insulin sensitive at 10 years( Reference Bouhours-Nouet, Dufresne and Boux De Casson 137 ). Interestingly, in a study of lean men and women, those who developed metabolic syndrome as adults despite healthy weight, exhibited slower gains in BMI during the first 2 years of life( Reference Salonen, Kajantie and Osmond 10 ). Together, these findings highlight a specific window encompassing early postnatal life during which fat accumulation may programme AT function and insulin homeostasis in later life. Additionally, accelerated early weight gain may have opposing effects on short-term cardiometabolic risk depending on birth-weight.
Data from the EU childhood obesity programme revealed that an increased weight gain velocity during the first months of life is induced by high protein intake( Reference Escribano, Luque and Ferre 160 ). In a controlled trial of small for gestational age infants, de Zegher et al. demonstrated that feeding practices differentially affected weight partitioning and metabolism during the first year of life( Reference De Zegher, Sebastiani and Diaz 161 , Reference De Zegher, Sebastiani and Diaz 162 ). For a minimum of 5 months, small for gestational age infants were fed exclusively on either breast milk or an iso-energetic, higher protein infant formula. By 12 months, breast milk infants had normalised lean mass and bone mass but low fat mass persisted( Reference De Zegher, Sebastiani and Diaz 161 , Reference De Zegher, Sebastiani and Diaz 162 ). This hypo-adipose state was associated with increased insulin sensitivity as well as normal insulin-like growth factor-1 and high-molecular-weight adiponectin concentrations( Reference De Zegher, Sebastiani and Diaz 161 , Reference De Zegher, Sebastiani and Diaz 162 ). In contrast, iso-energetic, higher protein infant formula infants managed to normalise fat mass by 12 months, but interestingly this was associated with high insulin-like growth factor-1 and low high-molecular-weight adiponectin concentrations( Reference De Zegher, Sebastiani and Diaz 161 , Reference De Zegher, Sebastiani and Diaz 162 ). The authors concluded that in fact neither of the nutrition options was able to normalise both body composition and metabolic status, possibly due to an irreversible reduction in prenatal adipogenesis( Reference De Zegher, Sebastiani and Diaz 161 , Reference De Zegher, Sebastiani and Diaz 162 ). This further suggests that children and adolescents born small for gestational age may experience metabolic dysfunction at a lower BMI and fat mass compared with their AGA and LGA peers.
Dietary fat manipulation
Animal studies have demonstrated that postnatal fatty acid exposure influences later body composition and metabolic regulation. Oosting et al. illustrated that mice fed a diet rich in n-3 PUFA from postnatal day 2 who were later challenged with high SFA/Western Style diet were protected against metabolic aberrations( Reference Oosting, Kegler and Beek 30 ). Results showed that mice fed a diet rich in n-3 PUFA exhibited 30 % less AT gain and maintained better glucose homeostasis compared with control mice( Reference Oosting, Kegler and Beek 30 ). Additionally, examination of AT cellularity revealed significantly less AT hypertrophy and a larger number of small adipocytes in the mice fed the n-3 PUFA-enriched diet( Reference Oosting, Kegler and Beek 30 ). Monounsaturated fat has also shown potential to modulate postnatal growth( Reference Priego, Sánchez and García 31 ). Offspring of rats supplemented with MUFA-rich olive oil from gestational day 14 and throughout lactation showed lower postnatal body weight gain( Reference Priego, Sánchez and García 31 ). Additionally, these rats expressed higher levels of uncoupling protein 1 (UCP-1) in BAT, demonstrating increased thermogenic capacity induced by maternal MUFA-rich diet( Reference Priego, Sánchez and García 31 ).
From a translational perspective, feeding an LC n-3 PUFA enriched formula to preterm infants until 1 year gestation-corrected age resulted in lower trunk fat and reduced fasting insulin concentrations compared with those fed a matching unsupplemented formula( Reference Pittaluga, Vernal and Llanos 44 ), as detailed in Table 1. Despite the favourable impact of n-3 PUFA supplementation in the relatively short term, when Kennedy et al. examined 10-year-old children who had received LC PUFA supplemented formula after pre-term birth, they found no long-lasting effect on body composition or blood pressure( Reference Kennedy, Ross and Isaacs 45 ). However, no circulating markers of metabolic health were assessed. There is a clear need for further RCT to determine the long-term implications of these findings at birth. It is also interesting to note that in a rodent model, Gorski et al. demonstrated that postnatal nutrition can override prenatal programming of offspring obesity and IR( Reference Gorski, Dunn-Meynell and Hartman 163 ).
Adiposity rebound
BMI reflects both body mass and length/height( Reference Nash, Secker and Corey 164 ). During the first year of life, BMI rises rapidly reaching a peak at approximately age 1 year( Reference Cameron and Demerath 121 ). After this time, BMI undergoes a gradual decline until it reaches a nadir at about age 6 years( Reference Plachta-Danielzik, Bosy-Westphal and Kehden 165 ). AR is defined as the second rise in BMI that usually occurs between age 5 and 7 years( Reference Rolland-Cachera, Deheeger and Bellisle 166 ). Using dual-X-ray absorptiometry, Taylor et al. confirmed that the increase in BMI during the AR period is driven specifically by changes in fat mass rather than in fat-free mass( Reference Taylor, Williams and Carter 167 ).
Energy balance
Longitudinal studies have demonstrated that timing of AR has the potential to modulate future metabolic risk( Reference Wadsworth, Butterworth and Marmot 168 , Reference Eriksson 169 ). Findings from the Helsinki Birth Cohort Study suggest that earlier AR (<5 years) was associated with a pronounced increased risk of T2D in later life( Reference Eriksson 169 ). Although some argue that age of AR bears no functional role and simply highlights children who are upward BMI centile crossing/gaining weight rapidly( Reference Cole 170 ), others disagree( Reference Ohlsson, Lorentzon and Norjavaara 171 ). Furthermore, it has been suggested that early AR-induced metabolic aberrations may manifest rather quickly; early AR was related to higher waist circumference, glucose, HOMA-IR, TAG, apol B, blood pressure and lower HDL-C levels in 7–12-year-old children( Reference González, Corvalán and Pereira 172 , Reference Koyama, Ichikawa and Kojima 173 ). These results suggest that AR timing may modulate AT growth and function. However, up to now no dietary intervention studies to examine the impact of energy/protein manipulation on timing of AR have been conducted.
Dietary fat manipulation
A prospective study of 222 children demonstrated that the n-3 PUFA DHA content of breast milk was positively associated with age of AR in girls( Reference Pedersen, Lauritzen and Brasholt 174 ). Importantly, these results have been replicated in an RCT. Bergmann et al. studied the effect of 200 mg/d DHA supplementation from mid-pregnancy until 3 months postpartum and illustrated that age of AR was delayed in offspring of DHA supplemented mothers( Reference Bergmann, Bergmann and Haschke-Becher 175 ). Further long-term follow-up studies are required in order to confirm the long-term metabolic implications of DHA-induced AR delay.
Adolescence
Adolescence is characterised by a multitude of body composition changes, including increases in annual height velocity, body weight, lean body mass and bone mineral content( Reference Rodríguez, Moreno and Blay 176 ). Girls undergo a significant fat mass gain, while adolescent boys decrease body fat and experience increased height velocity( Reference Rodríguez, Moreno and Blay 176 ). Interestingly, recent evidence points to a higher prevalence of metabolically active BAT in adolescent boys and girls. While 1 in 5 positron emission tomography–computerised tomography examinations in pre-pubertal children display metabolically active BAT, greater than 75 % of scans in pubertal teenagers confirm the presence of this tissue( Reference Gilsanz, Smith and Goodarzian 177 ). It has been proposed that BAT activity may be stimulated by sex steroids and growth hormone( Reference Gilsanz, Hu and Kajimura 178 – Reference Hioki, Yoshida and Kogure 180 ).
Energy balance
For overweight individuals, the adolescent years represent a high-risk period for the development of IR and T2D( Reference Goran and Gower 181 ). Pubertal increases in growth hormone, sex steroids and insulin-like growth factor-1 in boys and girls as well as increased fat mass in girls leads to a natural reduction in insulin sensitivity( Reference Goran and Gower 181 ). Puberty-related IR manifests early in adolescence, peaking mid-puberty, and is generally compensated by increased insulin secretion( Reference Bloch, Clemons and Sperling 182 ). In healthy weight adolescents, this transient state of IR commonly resolves by the end of pubertal growth( Reference Goran and Gower 181 ). However, resolution does not always occur in obese adolescents indicating possible β-cell deterioration during this critical period of development( Reference Kelly, Lane and Weigensberg 183 ). These findings suggest that the metabolic risk of overweight adolescents is further exacerbated by a ‘pubertal trigger‘( Reference Kelly, Lane and Weigensberg 183 ). Despite convincing evidence that factors other than absolute AT excess determine metabolic phenotype in obese adolescents( Reference Weiss, Dufour and Taksali 58 , Reference Taksali, Caprio and Dziura 59 ), successful weight management is accompanied by improved phenotype in this cohort. The most recent meta-analysis of lifestyle interventions (RCT) in paediatric obesity demonstrated reductions in fasting insulin and lipid profile in response to improved BMI in over 300 subjects( Reference Ho, Garnett and Baur 19 ). This suggests that weight management in this age-group may optimise metabolic control, even within the context of a metabolically healthy phenotype, as has been demonstrated in MHO adults( Reference Janiszewski and Ross 184 , Reference Liu, Wharton and Sharma 185 ).
Dietary fat manipulation
Cross-sectional studies in overweight adolescents have shown that plasma SFA concentrations correlate positively with IL-6( Reference Klein-Platat, Drai and Oujaa 25 ) and C-reactive protein( Reference Aeberli, Molinari and Spinas 26 ). Although no intervention studies have chronically increased SFA intake in overweight adolescents, healthy men showed higher concentrations of C-reactive protein, fibrinogen and IL-6 after 5 weeks consuming a diet enriched with the SFA stearic acid or a mix of SFA lauric, myristic and palmitic acid, when compared with a MUFA-rich high oleic acid control diet( Reference Baer, Judd and Clevidence 186 ). Additionally, much like in adults( Reference Perreault, Zulyniak and Badoud 23 ), overweight adolescents with the metabolic syndrome had a lower plasma PUFA:SFA ratio than overweight adolescents without metabolic syndrome( Reference Klein-Platat, Drai and Oujaa 25 ). The pro-inflammatory effects of SFA are thought to be largely mediated by their ability to serve as ligands for toll-like receptor-2 and 4. Binding of SFA to toll-like receptor-2 and/or toll-like receptor-4 in macrophages and adipocytes leads to activation of NF-κB, cJun NH2-terminal kinase, and p38 mitogen-activated protein kinase inflammatory signalling cascades( Reference Reynolds, McGillicuddy and Harford 115 , Reference Nguyen, Favelyukis and Nguyen 187 ).
The effects of dietary fat manipulation on the metabolic phenotype of overweight adolescents show inconsistent results when examined by RCT, as presented in Table 1. Although some studies demonstrated improvements( Reference Nobili, Bedogni and Alisi 38 , Reference López-Alarcón, Martínez-Coronado and Velarde-Castro 46 , Reference Velázquez-López, Santiago-Díaz and Nava-Hernández 48 ), others show no effect on fasting markers of metabolic function( Reference Dangardt, Osika and Chen 39 , Reference Pedersen, Mølgaard and Hellgren 47 ). Remarkably, Dangardt et al. did not detect an intervention effect in the fasted state( Reference Dangardt, Osika and Chen 39 ); however, when subjects underwent a metabolic challenge significant improvements in glucose and insulin homeostasis were revealed( Reference Dangardt, Chen and Gronowitz 40 ), highlighting the potential limitations of assessing metabolic plasticity during fasting. It is also worth noting the differences between RCT with respect to the baseline phenotype of participants. Interestingly, the studies in which subjects were recruited based on a phenotype more indicative of MUO detected significant metabolic improvements post-intervention( Reference Nobili, Bedogni and Alisi 38 , Reference López-Alarcón, Martínez-Coronado and Velarde-Castro 46 , Reference Velázquez-López, Santiago-Díaz and Nava-Hernández 48 ), whereas in the absence of marked metabolic dysfunction no significant changes occurred in fasting biomarkers( Reference Dangardt, Osika and Chen 39 , Reference Pedersen, Mølgaard and Hellgren 47 ). This observation suggests that baseline phenotype may partially determine responsiveness to dietary fat manipulation.
Renewed interest in BAT as a possible therapeutic target in obesity has arisen from recent identification of this thermogenic tissue beyond infancy( Reference Cypess and Kahn 188 , Reference Nedergaard, Bengtsson and Cannon 189 ). Interestingly, puberty has emerged as a potentially critical period with respect to BAT development( Reference Gilsanz, Smith and Goodarzian 177 ), which raises the possibility of its involvement in the MHO phenotype. In contrast to lipid-rich white AT, BAT stores little fat and its primary function is to induce non-shivering thermogenesis; dissipating energy via the uncoupling of oxidative respiration from ATP production( Reference Saito, Okamatsu-ogura and Matsushita 190 , Reference Zingaretti, Crosta and Vitali 191 ). This process is regulated by UCP-1, a protein located in the inner mitochondrial membrane of BAT( Reference Saito, Okamatsu-ogura and Matsushita 190 , Reference Zingaretti, Crosta and Vitali 191 ). Lack of BAT or UCP-1 in mice induces obesity, IR and dyslipidaemia( Reference Hamann, Flier and Lowell 192 , Reference Feldmann, Golozoubova and Cannon 193 ). Interestingly, evidence from human studies indicates that the molecular pathways of BAT development are amenable to reactivation; preadipocytes isolated from supraclavicular fat in adults differentiated into brown adipocytes in vitro ( Reference Lee, Swarbrick and Zhao 194 ). Importantly, there were no morphological differences in fully differentiated cells from subjects with or without metabolically active BAT( Reference Lee, Swarbrick and Zhao 194 ). Furthermore, exposure of WAT to chronic cold or PPARγ agonists can induce a distinct form of BAT termed ‘brown-in-white’ AT, which also expresses UCP-1( Reference Gilsanz, Hu and Kajimura 178 ). In this regard, rodent studies have illustrated the potential for dietary fat manipulation to modulate BAT activity. n-3 PUFA( Reference Oudart, Groscolas and Calgari 195 ), MUFA-rich extra virgin olive oil( Reference Oi-Kano, Kawada and Watanabe 196 ) and oleuropein, a phenolic compound in olive oil( Reference Oi-Kano, Kawada and Watanabe 197 ) have all demonstrated increased UCP-1 content and/or activity in rodent BAT. However, it should be acknowledged that the role of BAT in murine models differs very much to man. Furthermore, the potential of unsaturated fats to up-regulate UCP-1 mediated thermogenesis in man has yet to be investigated.
Personalised nutrition: potential to optimise efficacy of dietary fat manipulation?
It is clear that the effects of dietary fat manipulation on AT function and metabolic phenotype are heterogeneous and inconsistent. So too are the phenotypes associated with obesity in childhood and adolescence. Using personalised nutrition approaches to target interventions towards specific populations sharing a common set of characteristics may ultimately improve efficacy( Reference Bouwman, Vogels and Wopereis 198 ). Therefore, categorisation of obese youth based on their metabolic phenotype may be important in determining their level of responsiveness, a concept that was elegantly demonstrated by Gilardini et al. ( Reference Gilardini, Pasqualinotto and Croci 199 ). The present study examined the impact of a 3-month lifestyle intervention on insulin sensitivity in 202 obese children( Reference Gilardini, Pasqualinotto and Croci 199 ). At the end of the intervention, two very distinct groups emerged from the data; responders (55 %) and non-responders (45 %)( Reference Gilardini, Pasqualinotto and Croci 199 ). Interestingly, the two groups were comparable in BMI, waist circumference and body composition; however, responders were characterised by higher fasting insulin, HOMA-IR, fasting glucose and 2 h glucose and had a lower matsuda index( Reference Gilardini, Pasqualinotto and Croci 199 ). Remarkably, while responders exhibited improvements in glucose and TAG post-intervention, paradoxically insulin-sensitive non-responders demonstrated increases in insulin, leucocytes and TAG concentrations( Reference Gilardini, Pasqualinotto and Croci 199 ). Furthermore, a second study of overweight and obese adolescents identified and validated significantly differentially methylated genes related to lipid metabolism and inflammation between individuals who had a high and low response to a multidisciplinary lifestyle intervention( Reference Moleres, Campión and Milagro 200 ). This further suggests that intervention responsiveness tends to vary according to baseline participant characteristics. Importantly, childhood and adolescence may present as a unique window during which MUO individuals exhibit a heightened level of responsiveness. A recent study of more than 2000 subjects indicated that MUO adults are no longer dietary responsive( Reference Phillips, Dillon and Harrington 201 ). The authors suggested that the metabolic burden caused by the simultaneous dysfunction of the pathways involved in insulin signalling, inflammation, and glucose and lipid metabolism render MUO but not MHO unresponsive to intervention( Reference Phillips, Dillon and Harrington 201 ). Although there is a vital need to replicate these findings in further RCT, emerging data thus far suggest that large inter-individual responses to dietary interventions may be somewhat accounted for by baseline phenotype. It is important to note that the human evidence in relation to dietary fat manipulation during critical periods of AT development has largely emerged from studies within the context of a healthy phenotype. For example, in the two large follow-up studies of LC PUFA supplementation during pregnancy( Reference Rytter, Bech and Halldorsson 41 ) and in the postnatal period( Reference Kennedy, Ross and Isaacs 45 ), offspring exhibited a mean follow-up BMI within the healthy range. Given that healthy subjects have an extraordinary capacity to maintain homeostasis( Reference Van Ommen, Keijer and Kleemann 202 ), it is worth considering that the metabolic benefits of supplementation may go undetected without the challenge of chronic nutrient overload and subsequent obesity. Future studies should focus on targeted interventions to characterise the effect of dietary fat manipulation on the phenotype of children and adolescents with MUO or at risk of MUO later in youth.
Conclusion
Overall, data suggest that the short- and long-term metabolic consequences of obesity in childhood and adolescence are varied and may be modulated by a number of factors, including the in utero environment, postnatal growth and inherited risk. Although the majority of obese youth demonstrate maintenance of metabolic homeostasis, those individuals with established metabolic dysfunction may be characterised by increased central and decreased peripheral adiposity, perhaps triggered by decreased SAT expansion capacity. There is convincing evidence from in vitro and animal studies that AT function and subsequent metabolic outcome can be manipulated by dietary fat quality during critical periods of AT growth. However, translation of these results in human studies has shown mixed success in the short-term and little success in the long-term. Given the wide inter-individual variability that accompanies obesity in children and adolescents, it is not surprising that the varying characteristics may modulate responsiveness to dietary intervention. A limited number of studies have suggested that MUO youth may respond more favourably to intervention than their MHO counterparts. Thus, targeting dietary interventions towards established MUO or individuals at risk of MUO may optimise efficacy of dietary fat manipulation. Particularly high-risk populations may include obese pregnant women, offspring exposed to in utero under- or overnutrition, infants demonstrating slow or accelerated postnatal weight gain, children with early AR and adolescents with established metabolic dysfunction. Future long-term, well-designed RCT are required to determine whether dietary fat manipulation may be therapeutically beneficial for the treatment and prevention of MUO in children and adolescents.
Financial Support
The present work was supported by funding from the National Children's Research Centre, Dublin, Ireland. H. M. R. is supported by the Science Foundation Ireland Principal Investigator Programme (11/PI/1119).
Conflicts of Interest
None.
Authorship
A. M. M. and R. M. C. completed the review. H. M. R. advised in relation to review content. H. M. R. and F. E. L. critically evaluated the manuscript. All authors approved the final review.


