


Non-technical Summary
The history of life is known from the fossils preserved in the geological record. The common-cause hypothesis suggests that processes like mountain building and sea-level change can affect both the structure of the geological record and species diversity. Using the snails of Bermuda as an example, this paper develops a computational model to show that sea-level cycles could affect morphological evolution within species, not just species diversity. As sea level rose on Bermuda, the available snail habitat would have become smaller and more fragmented, which would be expected to drive rapid bursts of genetic drift (the random component of evolutionary change). When sea level fell, the snails’ habitat would have expanded and coalesced, resulting in slower rates of evolution, because the total population size would increase. This process would produce an uneven cycle of rapid and slow evolution similar to what paleontologist Stephen Jay Gould observed in the fossil snails of Bermuda that led him to propose the theory of punctuated equilibria. While these simulations are focused specifically on an island system, the principles are applicable to other situations, suggesting that geological and evolutionary processes may be linked in more ways than previously understood.
Introduction
The nonrandom influences of sedimentary and stratigraphic processes on the fossil record are well known. Sedimentation rates, facies distributions, and erosion patterns are functions of sea level, accommodation space, and sediment influx (e.g., Catuneanu Reference Catuneanu2006). Ultimately, these nonrandom patterns in the stratigraphic record are driven by tectonic, eustatic, and climatic processes, and the fossils preserved in the sediments inherit the imprint of the same stratigraphic controls (McKinney Reference McKinney1985; Kidwell Reference Kidwell1986; Holland Reference Holland2000; Smith et al. Reference Smith, Gale and Monks2001; Bush et al. Reference Bush, Powell, Arnold, Bert and Daley2002; Kidwell and Holland Reference Kidwell and Holland2002; Hannisdal Reference Hannisdal2006; Patzkowsky and Holland Reference Patzkowsky and Holland2012). Paleontologists must account for this nonrandom effect to accurately interpret evolutionary and biodiversity patterns in the fossil record.
In this paper, I will show that Earth system processes can also influence microevolution evolution processes themselves. I will use computational modeling to show how sea-level cycles can simultaneously regulate rates of genetic drift (the stochastic component of evolutionary change) and the accumulation of stratigraphic sequences. My model is based on the rock and fossil records of Bermuda. That island’s sediment-starved and tectonically stable setting creates unusually clear links between sedimentary deposition and sea-level cycles depending on whether the island platform is flooded or not. The model will show that genetic drift is very slow during lowstands when the entire platform is subaerially exposed. Punctuated bursts of random change occur during highstands, when small populations differentiate on isolated islets, and the early falling stage, when “genetic surfing” amplifies those differences by nonrandom sampling along the edges of their now-expanding geographic ranges (Excoffier and Ray Reference Excoffier and Ray2008). The literal rises and falls of sea level force the rearrangement of the geographic ranges of island species in such a way that their rate of genetic drift is altered by the same processes that change the rate of sediment accumulation in which fossils are preserved. Another reason for focusing on Bermuda is that its endemic land snails (genus Poecilozonites) make up the clade that inspired Gould’s contribution to the theory of punctuated equilibria. While the punctuated equilibria model was based on principles of speciation by peripheral isolation (Eldredge and Gould Reference Eldredge, Gould and Schopf1972; Gould and Eldredge Reference Gould and Eldredge1977), this paper will show that similar punctuated evolutionary patterns can, in principle, arise randomly from eustatically driven changes in a species’ geographic range without speciation or true stasis.
This paper focuses on the genetic drift component of evolution. Evolution is the net change in the mean values of a population’s (or species’) traits. Selection is the nonrandom component that arises from fitness differences in the traits, whereas genetic drift is the random component that arises from stochastic sampling of each generation from its progenitor (Wright Reference Wright1931). Drift is a type of Brownian motion (BM) and is strongest when populations are small and sampling error is large. Drift is always a component of evolutionary change, whereas selection may be strong or weak, directional or stabilizing, or even absent depending on the context (Wright Reference Wright1931; Lande Reference Lande1976). Some authors have argued that true genetic drift is the dominant form of evolution (Kimura Reference Kimura1983), and others have found that BM patterns of trait evolution are fairly common in the fossil record (Hunt Reference Hunt2007), although one should note that BM can be produced by randomly fluctuating selection and that many authors have argued that stabilizing selection is the most common mode of phenotypic evolution (Polly Reference Polly2004; Estes and Arnold Reference Estes and Arnold2007; Hunt Reference Hunt2007). Regardless of its historical role in shaping the evolutionary history of life, genetic drift is the focus of this paper because its magnitude depends on net effective population size, which is related to the size and continuity of a species’ geographic range, which in turn can be governed by the same factors that control sedimentary processes.
Why would sea level affect the rate of drift? The expected rate of genetic drift is determined by the amount of genetic variance in the trait (G) relative to population size (N). If the genetic variance equals 1 unit (e.g., mm) and population size is 1000, then the rate of drift in the trait mean is 0.001 units per generation, but if population size drops to 10, then the rate of drift rises to 0.1. Drift is therefore faster in small populations, which makes it an important factor of evolution at times when populations sizes are small, in which case it can exceed the rate of evolution due to selection, or when selection is weak or absent (Lande Reference Lande1976). Despite drift’s statistical simplicity, its real-world behavior can be complex and counterintuitive, because spatial processes can isolate or intermingle the local populations that make up a species and thus change the net population size, or can drive range expansions that result in nonrandom sampling of a single progenitor population so as to clone its traits across a large part of the species’ distribution (Ibrahim et al. Reference Ibrahim, Nichols and Hewitt1996; Excoffier and Ray Reference Excoffier and Ray2008; Polly Reference Polly2019b). On islands, as this paper will show, sea-level cycles can drive cyclic patterns of fragmentation into small, isolated populations followed by range expansions into large panmictic ones. These processes can produce punctuated changes in rates of drift that mimic the patterns expected from the classic punctuated equilibria model of speciation. My goal is not to argue that Bermudian snails evolved solely by drift, but to demonstrate that complex, punctuated patterns of evolution can arise as a stochastic by-product of the same factors that shape the stratigraphic record.
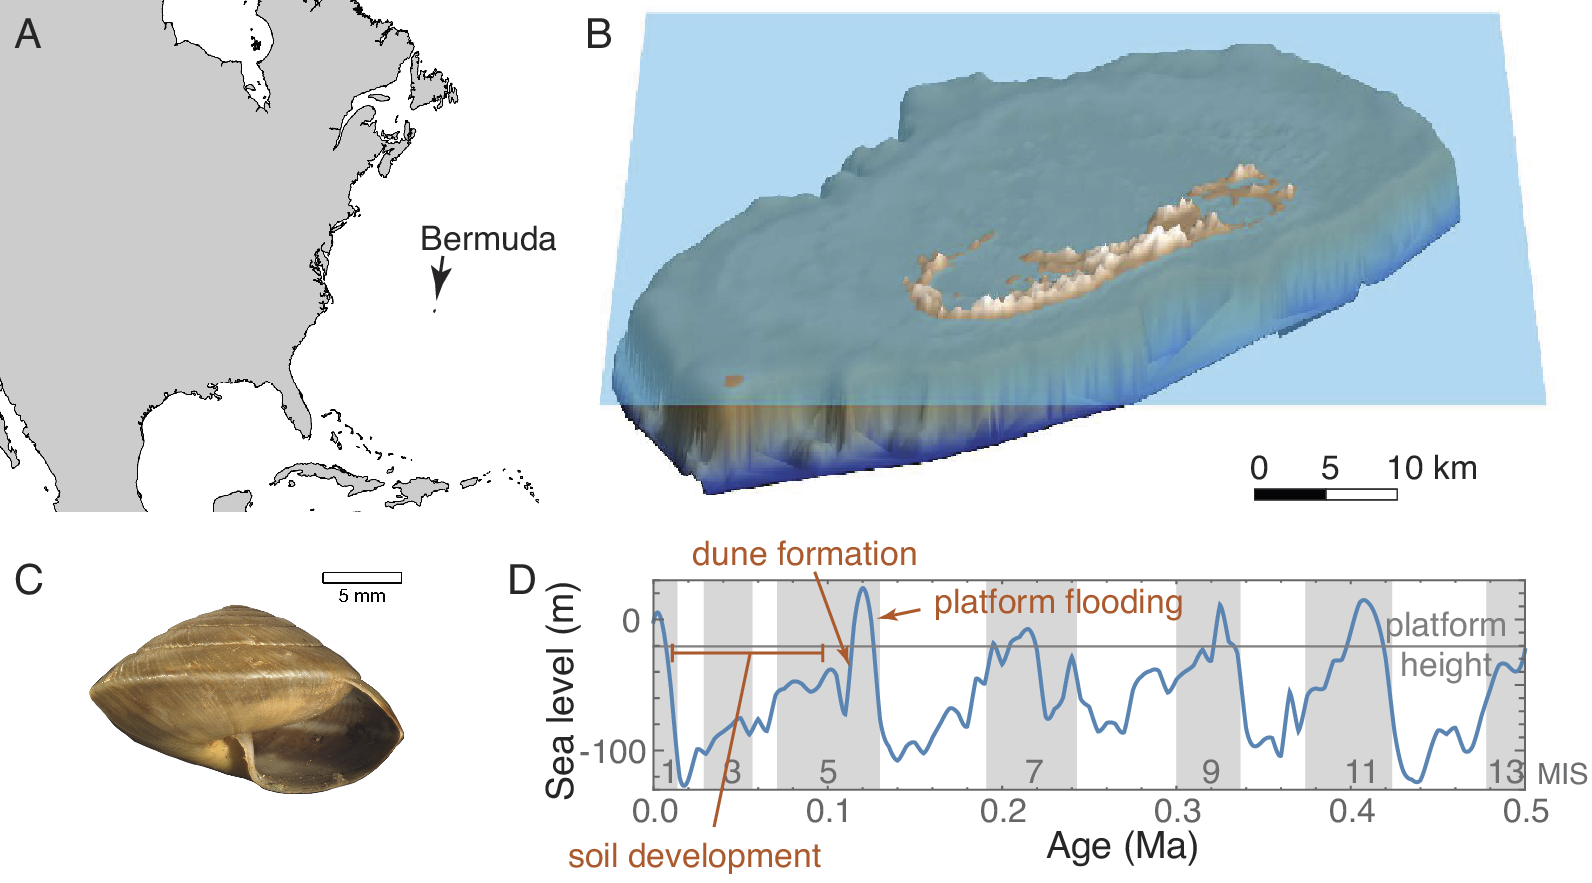
Why did sea-level change produce cyclic changes in sedimentation rate on Bermuda? Bermuda is a carbonate-topped seamount in the mid–North Atlantic (Fig. 1A). It originated as a seafloor volcano along the North Atlantic ridge that was last active around the end of the Eocene (Reynolds and Aumento Reference Reynolds and Aumento1974). In its history, the seamount grew to as much as 3500 m above sea level before subsiding to become capped by a carbonate platform. The surface carbonates in Bermuda extend back to at least 880 ka and the subsurface units probably extend back to at least the Pliocene (Hearty et al. Reference Hearty, Vacher and Mitterer1992; Vacher et al. Reference Vacher, Hearty and Row1995). Thus, for at least 2 Myr, the only source of new sediment was carbonate precipitation, and its surface stratigraphic sequence comprises thick, cemented eolian carbonate dunes interbedded by thin paleosols (Vacher Reference Vacher and Coates1973; Hearty Reference Hearty2002). These two depositional modes are directly linked to phases of the Quaternary sea-level cycle (Sayles Reference Sayles1931; Harmon et al. Reference Harmon, Schwarcz and Ford1978). As ice sheets melted five different times over the last half million years, sea levels rose, and Bermuda’s seamount was flooded to create a dominantly marine system of shallow lagoons interspersed with small islands like the one we see today (Fig. 1B). During those highstand phases, carbonate muds accumulated in the lagoons from precipitation by algae, foraminifera, bivalves, and corals (Neumann Reference Neumann1965; Stanley and Swift Reference Stanley and Swift1968). At those times, the areal extent of terrestrial snail habitats was minimal and subdivided into small islands formed by the taller cemented dunes. As seas fell at the onset of each new glacial phase, the unconsolidated carbonates were exposed, blown into dunes, and quickly cemented into massive eolianites (Vacher Reference Vacher and Coates1973; Fig. 1D). When sea level dropped below −25 m, the entire Bermuda seamount top was exposed, forming a single large island without the shallow lagoons that characterize it today (Supplementary Fig. S1B). The carbonate muds having already been dispersed or cemented, transportable sediment was unavailable during these glacial lowstands, and the primary deposition was in the form of terra rosa soils a few centimeters thick in most places and no more than 4 m thick in sinkholes or other karst depressions (Sayles Reference Sayles1931; Ruhe et al. Reference Ruhe, Cady and Gomez1961). At these times, the areal extent of terrestrial snail habitats was as much as an order of magnitude greater than at highstands. Each of these glacial lowstand phases lasted about 100,000 years, about an order of magnitude longer than the phase in which water covered the seamount. Bermuda’s stratigraphic sequence thus consists of thick eolianites representing only hundreds or thousands of years of accumulation during the early falling stage of each sea-level cycle, interspersed with thin paleosols, each of which may have taken as much as 100,000 years to form during the later falling stage, lowstand, and early rising stage of each cycle (Fig. 1D).
Overview. Map showing location of Bermuda (A). Rendering of Bermuda digital elevation model (DEM; Sutherland et al. Reference Sutherland, McLean, Love, Carignan and Eakins2013) with sea level set at approximately current height (B). Exemplar of a Poecilozonites snail shell (YPM IZ 104396, extant P. bermudensis) (C). Sea level for the last 50 kyr from Miller et al. (Reference Miller, Kominz, Browning, Wright, Mountain, Katz, Sugarman, Cramer, Christie-Blick and Pekar2005) showing the approximate height of the edge of the Bermuda platform (D).

To show how these evolutionary and stratigraphic processes might interact, I simulated a virtual metapopulation of Poecilozonites as it might have evolved by genetic drift through five glacial–interglacial sea-level cycles. Poecilozonites is assumed to have reached Bermuda during a single colonization event about 1 Ma (Pilsbry Reference Pilsbry1924; Hearty and Olson Reference Hearty and Olson2010). Three species groups, each of which was represented by one historically extant species and collectively comprised as many as 31 named fossil subspecies, diversified from the founder: P. bermudensis (Fig. 1C), P. circumfirmatus, and P. reinianus (Gould Reference Gould1969). Today, Poecilozonites is critically endangered. Poecilozonites reinianus disappeared by the 1950s and the remaining two species are nearly extinct in the wild (Bieler and Slapcinsky Reference Bieler and Slapcinsky2000; Outerbridge Reference Outerbridge, Pienkowski and Wensink2015). Based on its rich fossil record, Gould hypothesized that Poecilozonites had undergone many rapid speciation events as small peripheral populations were isolated. Bursts of morphological differentiation occurred in each founder due to drift and selection, after which the new species became established and underwent little morphological change. This model was the basis for his contribution to the punctuated equilibria theory of evolution (Gould Reference Gould1969; Eldredge and Gould Reference Eldredge, Gould and Schopf1972). Some subsequent researchers have reinterpreted the fossil record of Poecilozonites as a single, anagenetic species that evolved by intense natural selection that arose from changing environments and turnovers in the types of predators that visited Bermuda (Hearty and Olson Reference Hearty and Olson2010). The present paper does not attempt to resolve how Poecilozonites evolved, rather it aims to use Bermuda and its snails to illustrate how sedimentary and microevolutionary processes can be controlled by the same causal factors, and how the correlation might make it difficult to disentangle rates of evolution and sedimentation. However, as discussed later in the paper, the outcome of this experiment offers a new perspective for interpreting punctuated patterns of evolution.
Using computational models, I show (1) how the rise and fall of sea level across the platform’s edge restructures the spatial structure of populations on the islands through geographic range expansion, contraction, fragmentation, and coalescence; (2) how those spatial changes affect the outcomes of genetic drift via gene flow, founder effects, and genetic surfing; (3) how those metapopulation dynamics affect the morphological disparity of local populations and the rate and mode of evolution of the species as a whole; and (4) how the temporal and spatial processes of evolution correlate with an idealized sequence of sedimentary deposition. Computational modeling allows evolutionary parameters to be controlled that would be unknowable from the fossil record and allows the random evolutionary processes of interest to be separated from the confounding factors like selection and intraspecific competition that would be present in real evolving clades. Even though this model is based on the comparatively simple sedimentary and geographic history of Bermuda, I will argue that the results are generalizable to other situations, time periods, and drivers. I will also make the point that currently available statistical models of evolution are based on assumptions that do not explicitly account for the spatial processes that are the focus of this paper.
Materials and Methods
Computational Model
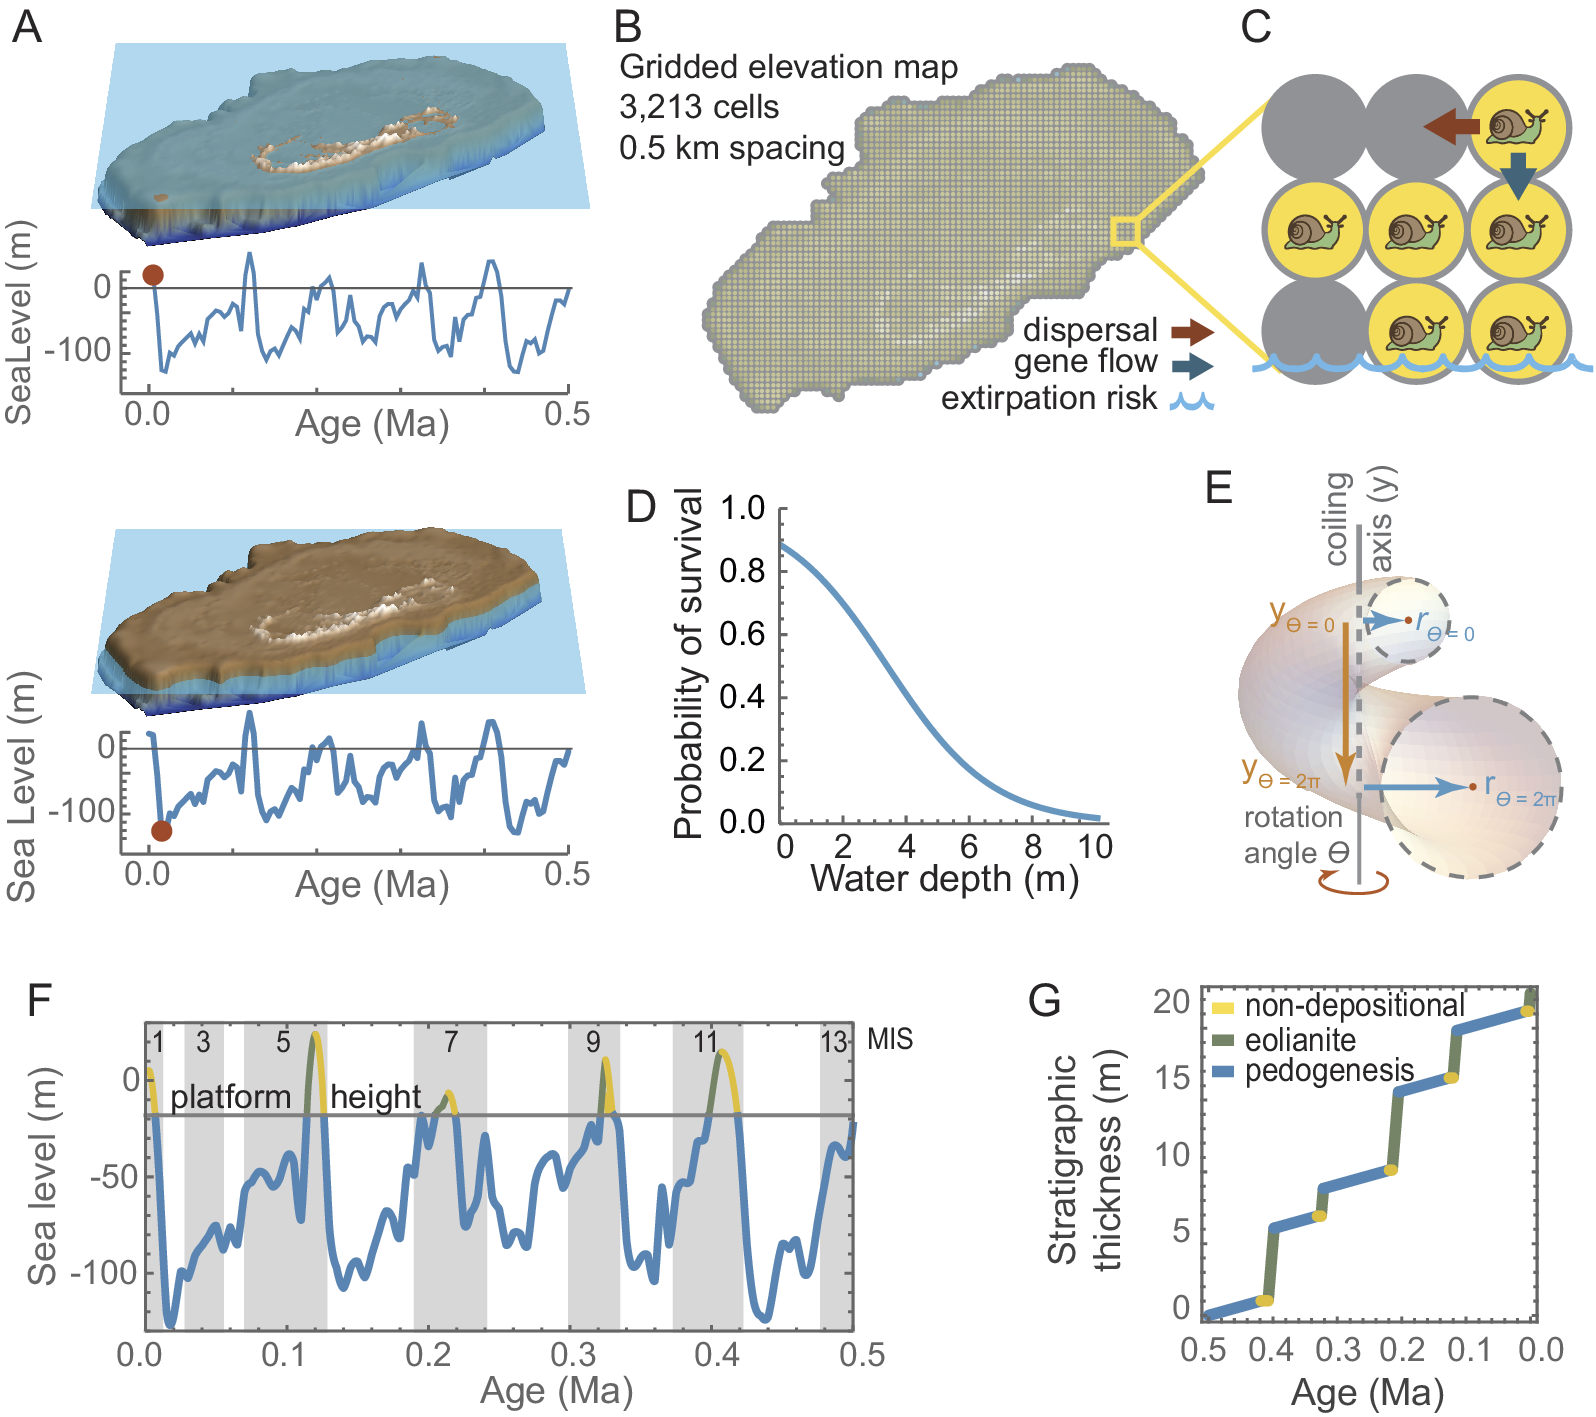
The computational model simulates the behavior of local populations of a single interbreeding species of snail in response to sea-level changes. The local populations can disperse, evolve (by genetic drift), interbreed with neighboring populations, and become locally extirpated. Each model runs from 0.5 Ma to the present in 5000 steps, each representing 100 years. During this interval, there were five interglacials, including the present, when sea level flooded the Bermuda platform. When sea level is low, snail populations can expand across the entire seamount, but they are extirpated from flooded grid cells during late rising sea-level phases (Fig. 2A). At each step of the model, every local population undergoes genetic drift, has a chance for offspring to disperse into an adjacent grid cell, interbreed with snails that disperse into its own cell, and experiences the possibility of extirpation, the probability of which increases if the cell is flooded (Fig. 2B,C).
Computational model overview. The model simulates the rise and fall of sea level (A), the horizontal line approximating the height at which the seamount floods. The digital elevation model (DEM) is gridded into cells (B) that can be occupied by snail populations during dispersal events, they share morphologies through gene flow, and they become extirpated when a cell floods (C). Survival probability for a local population is 0.9 in fully terrestrial and declines to near 0.0 as water depth increases to 10 m (D). Snail morphology is modeled with Raup’s coiling equations (E). Time is classified into nondepositional (yellow), eolianite (green), and pedogenic (blue) phases based on the dominant sedimentary mode associated with phases in the sea-level cycle (F). A sediment accumulation model was mapped onto time based on rates estimated from the thickness of Bermuda’s stratigraphic units (G).

A virtual landscape was created by gridding a digital elevation model (DEM) of the modern Bermuda seamount (Sutherland et al. Reference Sutherland, McLean, Love, Carignan and Eakins2013) into a 100 × 69 cells, which are approximately 0.5 km per side or 0.25 km2 in area (Supplement 1, Supplementary Fig. S1). This spacing is intentionally larger than an individual snail’s home range, but small enough that colonization of adjacent cells would easily occur within the century represented by each model step (cf. Baur and Baur Reference Baur and Baur1993). Snails occupying each cell are treated as a single local population.
Sea-level change was modeled from the eustatic curve of Miller et al. (Reference Miller, Kominz, Browning, Wright, Mountain, Katz, Sugarman, Cramer, Christie-Blick and Pekar2005). Those authors estimated sea level for the last 7 Ma at intervals of 5000 years. I interpolated their data with a third-order polynomial to model sea level at any point in time. The function was used to estimate water depth in each grid cell for each step of the model run. Marine Isotope Stage (MIS) boundaries follow Lisiecki and Raymo (Reference Lisiecki and Raymo2005). At today’s comparatively high sea level there are 165 terrestrial grid cells on the DEM model and only 44 at the even higher MIS 5e highstand (+44 m, 120 ka), whereas there are as many as 3212 at the level of the MIS 12 lowstand (−122 m, 435 ka). Anytime sea level is lower than −25 m in the model, more than 3100 cells are available for snail populations.
Survival of local populations depends on whether their grid cell is flooded. When water depth in a cell is 0, probability of survivorship is 1.0. When water floods a cell, survivorship is scaled between 0.0 and 0.9 based on depth using the function tanh(−0.3d + 1)(2 + 0.5)−1, where d is water depth in meters and tanh is the hyperbolic tangent function (Fig. 2D). The probability represents the possibility of unflooded points within the cell that might continue to support a snail population: survivorship is 75% or higher if water depth in the cell is less than 1.5 m (because the landscape is likely to still have many protruding islets), but nearly 0% when water is 10 m deep (because few cells would have subaerial habitat at that depth). Snails can only persist on the highest topographic areas of the platform during highstands; water retreats from cells allowing snail populations to become established across the entire platform during lowstands.
Shell morphology was modeled using five continuous-trait shell coiling parameters (W, D, T, S 1, and S 2), the meanings of which are described in detail later. At each step of the computation model, each of these traits evolved by drift in each local population. As described earlier, the rate of drift is GN −1, where G can be rewritten as h 2σ2 (heritability × phenotypic variance, noting that σ2 used here for phenotypic variance is a different parameter than the σ2 rate of evolution discussed later). At each computational model step, each trait in each local population consequently evolved by a random amount drawn from a normal distribution with mean of zero and variance of h 2σ2N −1. For all local populations, N was assumed to be 1000 and h 2 was 0.5, both of which are biologically realistic values (Cheverud and Buikstra Reference Cheverud and Buikstra1982; Polly et al. Reference Polly, Eronen, Lawing and Schnitzler2016). Values for σ2 were chosen to allow the full range of known Poecilozonites morphologies to emerge over the course of a model run. As explained later, the step size was set to 100 years, and the rate parameter scaled accordingly. To simplify the computations, GN −1 was arbitrarily set to 1.0, and the variance of realized traits from each model were rescaled post hoc to the variance observed among the living and fossil Bermuda snails (see Table 1, Supplement 1). The resulting rates are equivalent to having using phenotypic variances σ2 of W = 0.05, T = 0.05, D = 0.002, S 1 = 0.0004, S 2 = 0.0002 in combination with N = 1000 and h 2 = 0.5.
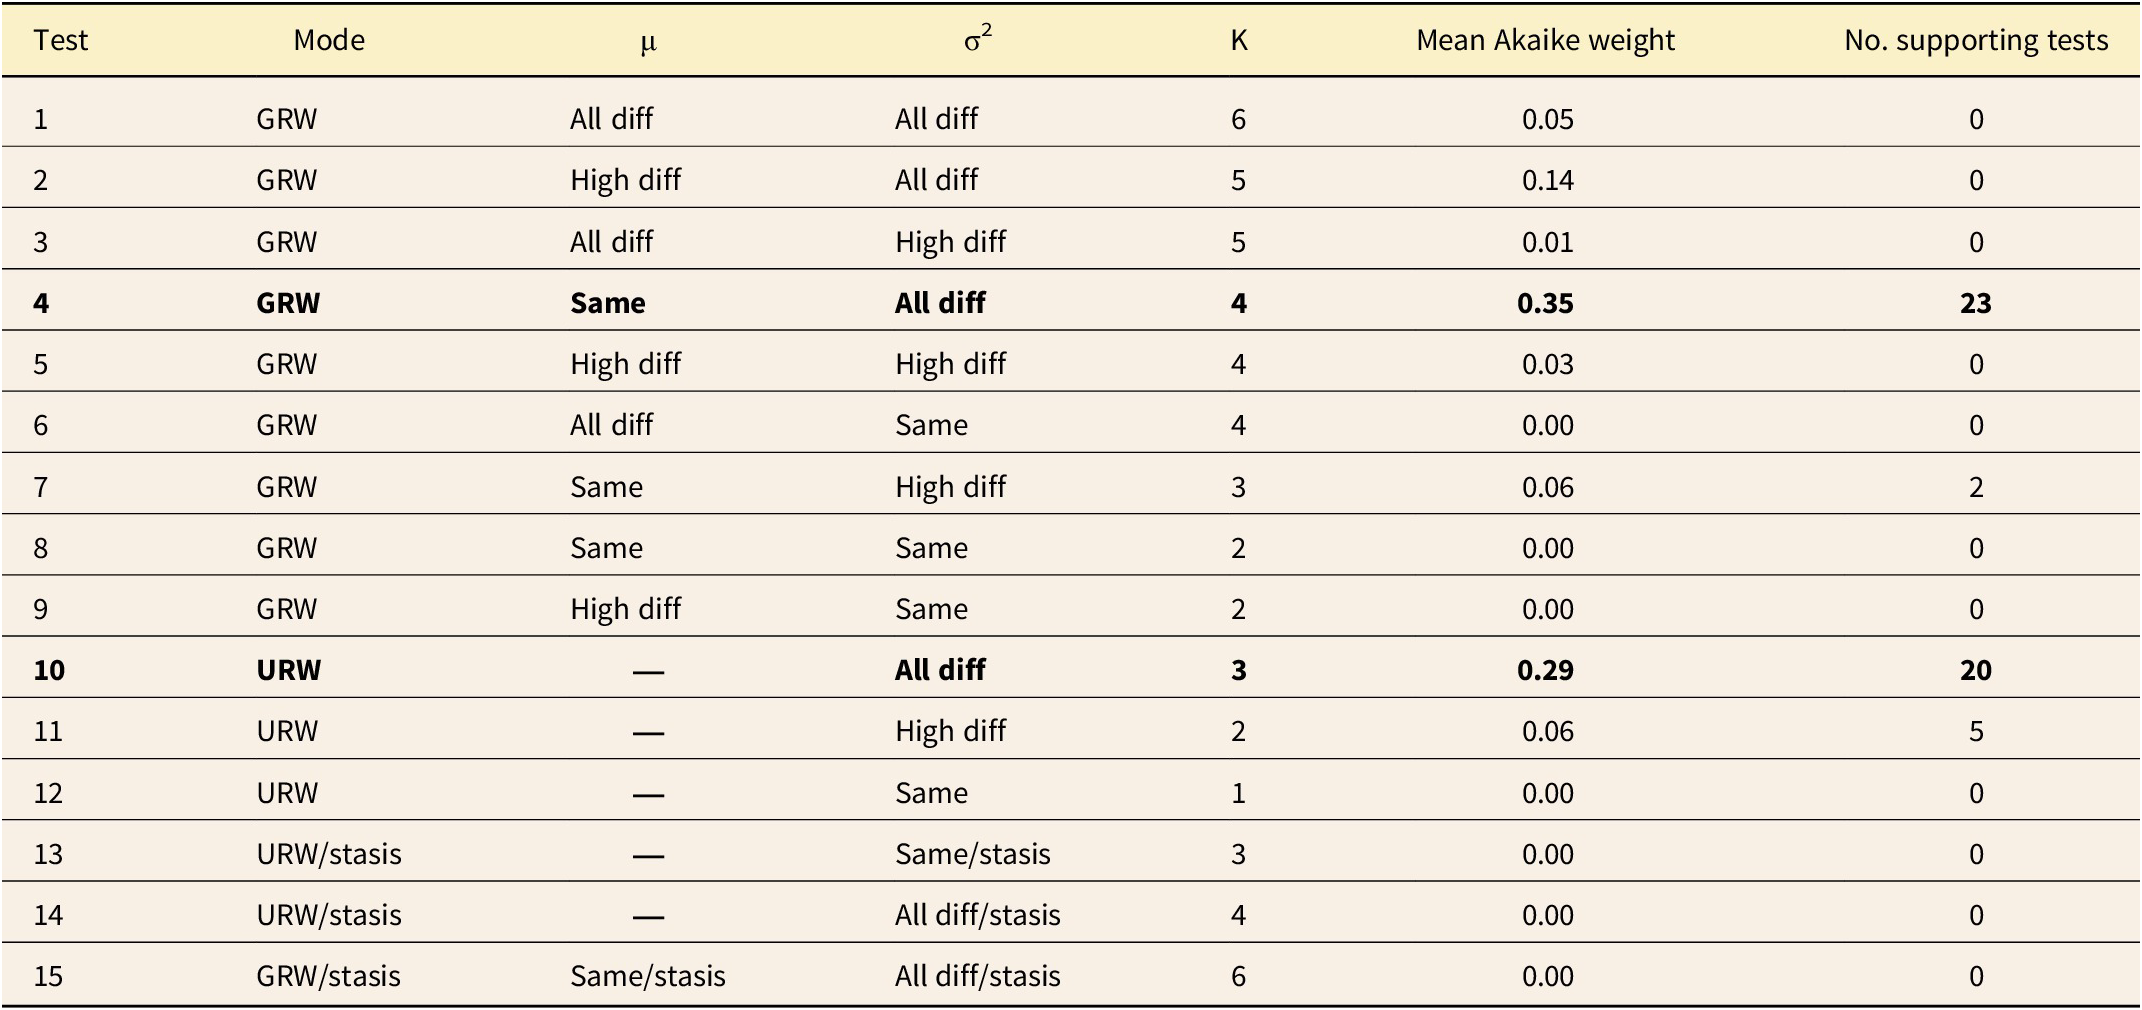
Summary of evolutionary model fitting. Mean sample-adjusted Akaike information criterion (AICC) weight for each of the 12 evolutionary models across all 5 traits and all 10 simulations is reported. σ2, rate of evolution; μ, directional parameter; K, number of parameters in the model; GRW, generalized random walk (i.e., a directional process); URW, unbiased random walk (i.e., Brownian motion) “same,” the parameter was identical in the nondepositional, eolianite, and pedogenic phases; “all diff,” the parameter was different in each of those phases; and “high diff,” the parameter was the same in the nondepositional and eolianite phases, but different in the pedogenic phase. Models are sorted in order of their average support across all the simulations and traits and the two that best explain most of the runs are highlighted in bold.

Each local population disperses offspring into adjacent cells with a probability of 0.5 per cell per model step. Offspring carry the parent population’s parameters with them into empty cells but then evolve independently in subsequent model steps. If an offspring population enters an already occupied cell, it interbreeds with the established population, and their trait values are averaged in the hybrid population to simulate gene flow. Each hybrid population is also assumed to have N = 1000.
Each model run began at 0.5 Ma (MIS 11), when sea level was below the platform (cf. Fig. 2A), thus allowing snails to become established across the island before the rising sea level flooded their habitats. At the beginning of each run, a single founder population was placed in a random grid cell with elevation of 5 m or higher with its trait values set to W = 1.7, T = 1.2, D = 0.05, S 1 = 0, and S 2 = 0 (the latter being the average aperture shape for Poecilozonites). The run progressed through 5000 steps to the present, making the model step length one century long.
The modeling strategy follows Polly et al. (Reference Polly, Eronen, Lawing and Schnitzler2016) and Polly (Reference Polly2019b). Code was written in Mathematica (Wolfram Research, Inc. 2019) and is provided in both executable Mathematica notebook format and in readable PDF and text formats in Supplement 2. Simulations were run on Indiana University’s Karst high-performance computing system with 1 CPU. Typical runs required 2.5 hours of computation, with additional time for output processing. Model runs were each assigned a unique name at runtime that begins with “Paleobiology” followed by the date and time and ending with a unique five-letter random hash. Individual model runs are referred to by just the hash for brevity (e.g., SCRNT). The complete output of the models is available in Supplement 3.
Snail Shell Modeling
The five traits are parameters for Raup’s (Reference Raup1966, Reference Raup1967) shell coiling equations: W is whorl expansion, D is distance between coiling axis and aperture, T is the rate of translation along the coiling axis, and S 1, and S 2 are geometric morphometric shape variables that describe the shape of the aperture (Fig. 2E). Cylindrical coordinates (r and y) for the shell at rotation angle are:
 $$ {r}_{\unicode{x03B8}}={r}_{\mathrm{o}}{W}^{\unicode{x03B8} /2\unicode{x03C0}} $$
 $$ {y}_{\unicode{x03B8}}={y}_{\mathrm{o}}{W}^{\unicode{x03B8} /2\unicode{x03C0}}+{r}_{\mathrm{C}}T\left({W}^{\frac{\unicode{x03B8}}{2\unicode{x03C0}}}-1\right) $$
where r o is the distance of an aperture point from the coiling axis before rotation and r θ is its distance after a rotation to θ; y o is the original position of the aperture points along the coiling axis and y θ is their position after rotation; and r c is the distance of the geometric center of the unrotated aperture from the coiling axis. The D and S terms are used to generate the x,y coordinates of the aperture, so they do not appear explicitly in the equations.
Raup used coordinates of a circle for S, but any aperture shape can be used. I used the mean aperture shape for Poecilozonites. As described in Supplement 1, I digitized the apertures of 35 living and fossil forms of Poecilozonites that collectively sample its full range of shape variation. Using geometric morphometrics, I derived two shape variables, S 1 and S 2, from the first two principal components of the aperture morphospace (Bookstein Reference Bookstein1991; Dryden and Mardia Reference Dryden and Mardia1998). The mean shape is at the origin of any geometric morphometric morphospace, so the initial aperture shape was set at S 1 = S 2 = 0 for all model runs. Shape analysis was performed with Morphometrics for Mathematica v. 12.5 (Polly Reference Polly2024).
Snail shells generated by the computational model were rendered by modeling the aperture from the S 1 and S 2 parameters by multiplying them by the respective eigenvector and adding the consensus shape (see Polly and Motz Reference Polly, Motz, Tapanila and Rahman2017), converting to cylindrical coordinates, and offsetting by D. The aperture points were then plugged into equations (1) and (2) with the simulated W and T parameters. Renderings were generated with the Snails for Mathematica v. 1.0 package (Polly Reference Polly2022).
This simulation treated the shell coiling parameters as independent traits (e.g., as if they represent separate developmental genetic controls on shell morphogenesis), which means that they are fully independent of each other in the model output. In real snails, however, these particular parameters are not expected to be independent; they produce correlated effects on shell morphology that are difficult to disentangle if one were to back estimate the same parameters from shells, and even in this simulation, one would have to adjust for correlated traits if the phenotypic outcomes were assessed from the geometry of the simulated shells rather than from the parameter output itself. To conceptually translate the patterns produced by these simulations to the real world, one would either need to choose traits that are known to be independent or use a phylogenetic comparative method that accounts for trait correlations (e.g., Revell and Harmon Reference Revell and Harmon2008).
Output Processing
Raw model output was processed into three types of summary output. Animated maps were produced for each trait to show the distribution and trait values of local populations at each model step. Summary tables for each run contain the model time (age in millions of years), the number of extant local populations, a timestamp, and the mean, min, max, and variance of each trait across all the extant local populations. When there were fewer than five extant populations, the trait variances were truncated to 0.0. Finally, a series of graphs show the trait means and total morphological disparity through time. The results for all 10 simulations are packaged together in Supplement 3.
Geographic Variation through Time: Standing Disparity
Standing morphological disparity among local populations was used as an index for geographic differentiation at each model step. Following Foote (Reference Foote1997), disparity was calculated as the summed variances of the populations across the five traits. Note that disparity of the shells in the mathematical space defined by the coiling parameters is not identical to the disparity of the rendered shells in a geometric morphometric space, because the scaling between them is logarithmic and the coiling parameters have interactive effects on the shell shape (see examples in Polly and Motz Reference Polly, Motz, Tapanila and Rahman2017; Polly Reference Polly2017, Reference Polly2023a). Regardless of how disparity is measured, however, its peaks and troughs would coincide despite a nonlinear scaling in magnitude.
Evolutionary Rates and Model Fitting
Rates and modes of evolution for the species as a whole were estimated using a modified version of the statistical evolutionary model-fitting approach proposed by Hunt (Reference Hunt2006, Reference Hunt2007). Hunt’s model-fitting approach was applied to the data generated by the computational model to illustrate how the outcome might be interpreted if we encountered it in the fossil record. To apply Hunt’s or most other phylogenetic comparative methods, geographic and local variation in traits at any given time slice must be summarized as a mean and variance. The resulting time series of trait means represents an idealized pattern of the evolutionary behavior of the species over time, but ignores the spatial processes that produce the punctuated pattern of change. This tension will be discussed later in the paper.
The goal of the statistical model fitting was to determine whether the overall pattern of evolution fits a BM process (which one might expect given that the computational model uses a pure BM process to simulate genetic drift), directional evolution, or stasis, and whether it can be characterized as a single-rate process (which one might expect as the rate parameters for drift are held constant) or multi-rate process. Hunt’s approach accomplishes this goal by comparing the fit of three alternative evolutionary models to trait data sampled from an unbranching lineage: an unbiased random walk (URW) that is pure BM, a general random walk (GRW) that has a directional component, and a stasis model (stasis). URW is a typical BM model with one rate parameter (σ2). GRW is a directional model with two parameters, rate (σ2) and direction (μ). The stasis model is a type of adaptive peak or Ornstein-Uhlenbeck (OU) model with three parameters, rate (σ2), location (θ), and strength (ω). Note that Hunt’s ω is analogous to the α of many OU authors (e.g., Butler and King Reference Butler and King2004), but Hunt’s model assumes that the lineage has already reached the adaptive peak, and his ω parameter therefore represents only the stationary variance around the peak that emerges as a function of σ2 and α in OU implementations like Butler and King’s. Here I refer to BM, directional evolution, and stasis as evolutionary “modes.” Likelihood is used to find the parameters for each model that best fit the trait data. The best model for each trait was selected using the sample-adjusted Akaike information criterion (AICC) and standardizing it into Akaike weights (Hunt Reference Hunt2006). Akaike weights sum to 1.0 and can be interpreted as the proportional support for each model.
I modified Hunt’s approach to test for differences in evolutionary rate and mode between the phases of the snail populations in which they are being extirpated from most of the platform during the late rising phase of sea level, when they are isolated in and then expand from highstand refugia during sea-level highstand and early falling phase, and then when they cover the entire island during late falling phase, lowstand, and early rising phase (Fig. 2F). Different rates and modes of trait evolution are expected during different eustatic phases because of the changing balance between local drift, gene flow, population isolation, and founder effects. Lowstand phases were defined as the interval when sea level was below the edge of the seamount platform (−18 m). Bermuda was one large island during lowstands (this is the phase of pedogenesis in the sedimentary cycle). Flooding phases were defined as the interval between when sea level surpasses −18m and the next highstand. During flooding phases, snail populations become extirpated from low-lying areas and persist isolated on the 10 to 15 small islands that remain above the highstand sea level (this is also the phase of nondeposition in the sedimentary cycle). Regressive phases were the interval between highstand and when sea level falls below the platform edge. During the highstands, there are fewer local populations, and the species is subdivided into isolated groups, potentially changing the population dynamic, compared with the lowstands when snails expand across the island with gene flow across a very large number of local populations. During the regressive phases, snail populations expand outward from highstand refugia until they fill the entire platform with a single panmictic metapopulation (this is the eolianite phase of the sedimentary cycle).
For each model step, the mean value of each of the five traits was calculated across all populations extant at that time, yielding a 5000-step time series that traces the species’ overall evolutionary trajectory. Each trait lineage was binned into pedogenic (= late falling phase, lowstand, and early rising phase), nondepositional (= late rising phase), and eolianite phases (= highstand and early falling phase). A series of “complex models” (Hunt et al. Reference Hunt, Hopkins and Lidgard2015) were then fit to each trait to determine whether the rates or modes of evolution differed between eustatic phases. A total of 15 combinations of rate and mode were considered: (1) GRW (directional evolution) in which σ2 and μ were different in each of the three phases; (2) GRW in which σ2 was different in each phase and μ was different in high phases (nondepositional and eolianite); (3) GRW in which μ was different in each phase and σ2 was different only in nondepositional and eolianite phases; (4) GRW in which μ was the same in all phases and σ2 was different in each phase; (5) GRW in which μ and σ2 were different only in nondepositional and eolianite phases; (6) GRW in which μ was different in each phase and σ2 was the same in all phases; (7) GRW in which μ was the same in all phases and σ2 was different only in nondepositional and eolianite phases; (8) GRW in which μ was the same in all phases and σ2 was different only in the nondepositional and eolianite phases; (9) GRW in which μ and σ2 were the same in all phases; (10) URW (BM) in which σ2 was different in each phase; (11) URW in which σ2 was different in nondepositional and eolianite phases; (12) URW in which σ2 was the same in all phases; (13) URW with different σ2 in nondepositional and eolianite stages and stasis in the pedogenic phase; (14) URW with the same σ2 in nondepositional and eolianite stages and stasis in the pedogenic phase; and (15) GRW with the same μ but different σ2 in nondepositional and eolianite stages and stasis in the pedogenic phase (see also Table 1).
Evolutionary model fitting was carried out in Mathematica using functions available in Phylogenetics for Mathematica v. 6.8 (Polly Reference Polly2023b). In its distributed form, the ThreeModelTest function does not fit complex models, so analyses were customized using its subfunctions. The complete code can be found in Supplement 2.
As will be discussed later in the paper, there is a tension between the spatial processes used in my computational model and the assumptions that underpin evolutionary statistical models, including the one used here and most if not all standard phylogenetic comparative statistical models. The statistical models implicitly assume that each lineage in a dataset or on a phylogenetic tree behaves like a single population at each time step, and the evolutionary rate estimated from fitting the model to real data is based on that assumption. My computational model involves many local populations, each with a constant rate of evolution, that interact at each step. As discussed later, the rates of evolution for the species as a whole as estimated by fitting Hunt’s statistical evolutionary model will be different from the rate in the local populations.
Comparison of Species-Level Evolution to an Idealized Stratigraphic Column
Sedimentation was not included in the computational model, but the results of the model were compared with an idealized stratigraphic column constructed from the modes of sedimentation that dominantly occur on Bermuda during each phase of the sea-level cycle: highstand = carbonate production; early falling phase = eolian dune formation; late falling phase, lowstand, and early rising phase = soil formation; late rising phase = no sedimentation. Just like the average trait values that were used for evolutionary model fitting, this idealized column represents what we might expect the local stratigraphic thicknesses to be at a hypothetical location where fossils might be sampled. Bermuda’s stratigraphy is spatially complex because it is dominated by eolianites of heterogenous thicknesses that have not only vertical but lateral superpositional relationships and soils that discontinuously blanket low-lying areas, the topography of which is also affected by karstification (Vacher et al. Reference Vacher, Hearty and Row1995; Hearty Reference Hearty2002). In real situations, sedimentary accumulation will vary locally in ways that will complicate the relationship between sedimentary and evolutionary rates.
The intention of this paper, however, is simply to demonstrate in a theoretical sense how a single physical factor like sea level can exert a correlated effect on both microevolutionary processes and mode of sedimentary deposition. To do this, I correlated the computational model’s absolute ages to the generalized stratigraphic column so that evolutionary changes could be plotted as they might be inferred by a paleontologist using a stratigraphic meter-level system (Fig. 2G). I created the idealized stratigraphic column by setting its total thickness to 20 m (approximately the median total thickness of Bermuda’s surface units) and subdivided it into eolian, pedogenesis, and nondepositional phases whose temporal lengths were derived from the sea-level curve (Fig. 2G). The rates in each phase were based loosely on the observed stratigraphic thicknesses of Bermudian units and the lengths of time over which they accumulated (Vacher et al. Reference Vacher, Hearty and Row1995; Hearty Reference Hearty2002). The eolian phase occurs during early falling sea-level phase when rapid accumulation of windblown carbonate sands and muds were cemented into thick eolianites, the rate of which was based on the Southampton Formation that accumulated as much as 10 m thickness in less than 10,000 years during MIS 5a and was thus modeled at 0.001 m yr−1. Lowstand pedogenesis was modeled at 0.0005 m yr−1 based on the estimated 0.5 m thickness of the St. George’s geosol, which accumulated over approximately the 100,000 years of MIS 2–4. The nondepositional phase that occurred in the late rising phase of sea level and rapidly flooded the platform, reworking some units into beach conglomerates but otherwise producing no accumulation, was modeled with a sedimentation rate of 0.0 m yr−1. Pure carbonate deposition in the highstand lagoonal areas was not included in the idealized stratigraphic column because it only appears in the stratigraphic record in transported form as eolianite.
The mean trait values from the evolutionary model-fitting exercise were rescaled from their original time units to expected stratigraphic thickness based on these idealized rates of sedimentation. While the approach is simplistic, the interpretations I draw from it only hinge on the observation that the snail fossils found preserved in the thick eolianites of Bermuda accumulated rapidly in the short regressive phases, and the fossils in the thin paleosols accumulated slowly over the long glacial lowstands.
Results
Morphological Disparity Increases during Highstands
Two questions about trait evolution are of interest here: does standing morphological variation change as sea-level cycles progress, and how does the average morphology evolve through a series of cycles?
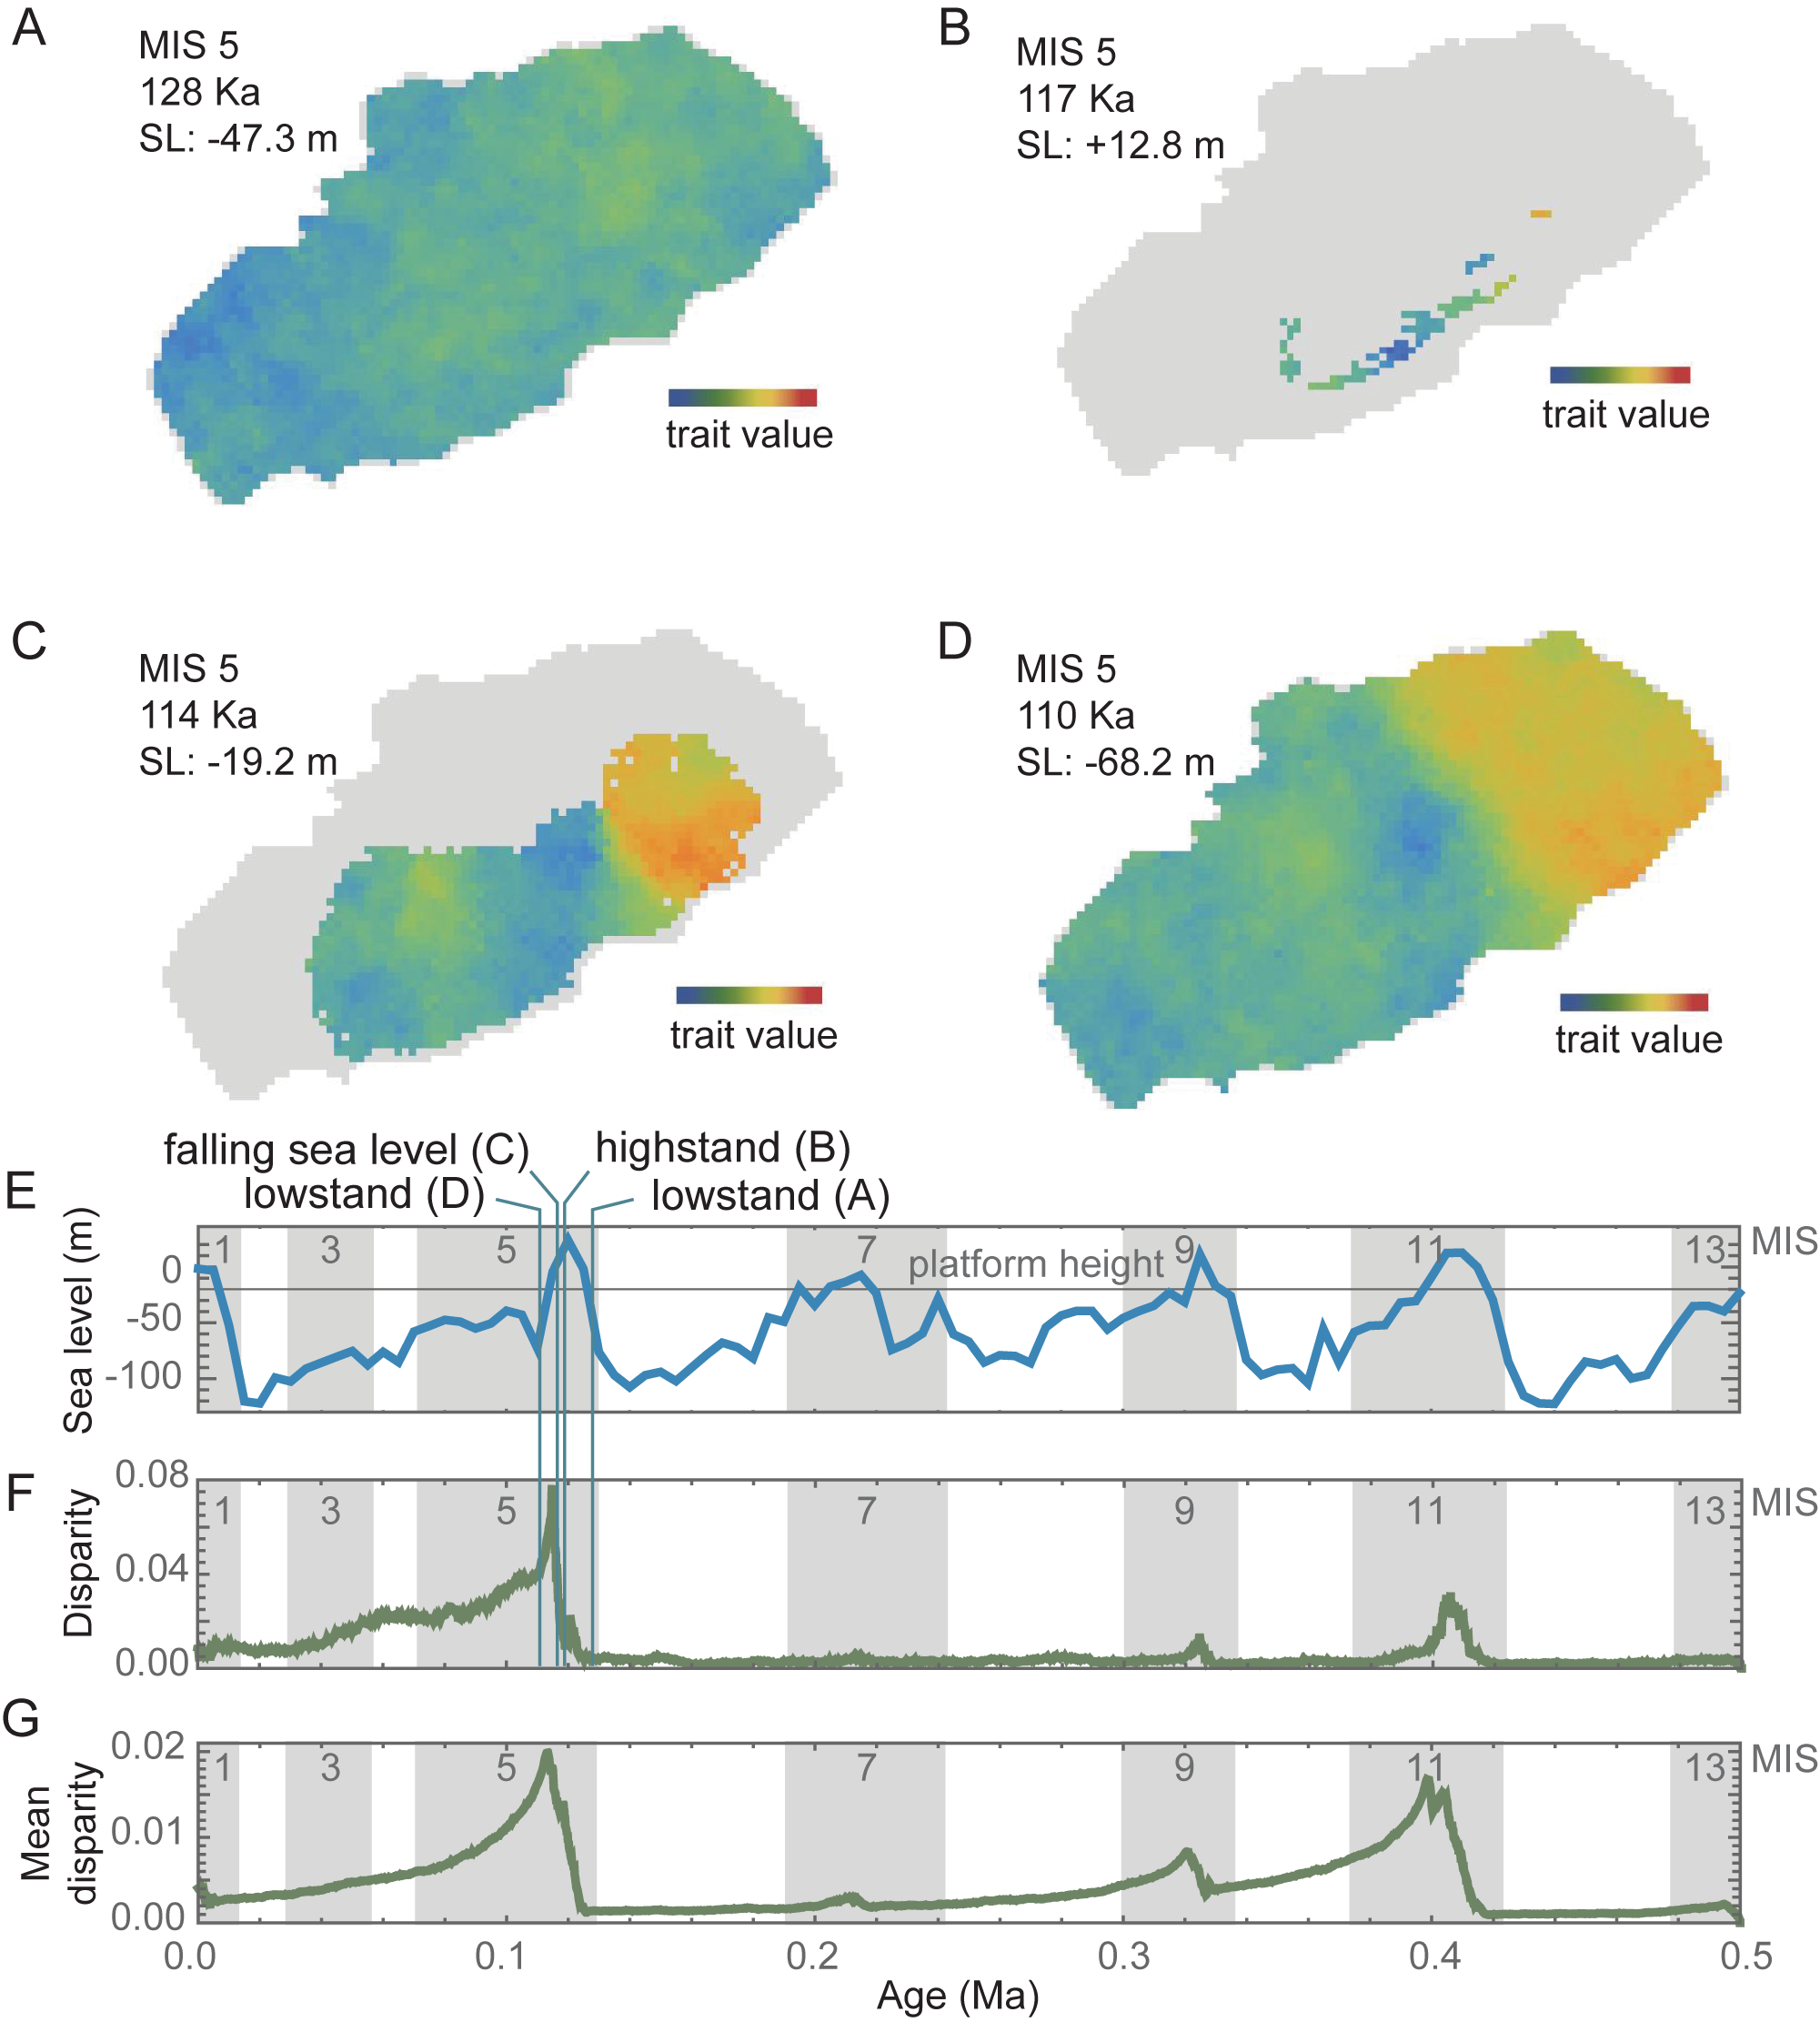
The first of these, morphological variation, manifests itself as geographic variation among local populations and can be measured as disparity. In the model results, geographic disparity is visibly linked with phases of the eustatic cycles, with disparity falling to almost zero during lowstands and increasing during the short highstand and early falling phases (Fig. 3). Disparity here is calculated as the variance in a shell trait across all the local populations extant during each step of a model run. Disparity of one trait (T) during one model is illustrated in Figure 3A–F, and disparity averaged across all traits and all model runs is shown in Figure 3G.
Geographic disparity through time. Snapshots of geographic disparity in a single trait through the phases of the glacial–interglacial eustatic cycle at lowstand (A), highstand (B), population expansion associated with the regression phase (C), and the initial pattern at the beginning of the next lowstand (D). Over the duration of the 0.5 Myr run, geographic disparity (F) rises at highstands (E) and slowly during lowstands. The vertical lines in E and F show the time slices A–D, all of which are illustrated with the trait T from model run DOLTH (this trait and model run were chosen arbitrarily for illustration). All 5 traits and all 10 model runs produced similar disparity patterns as shown by their mean disparity (G).

During lowstands, disparity is low, because as local populations occupy the entire platform, their traits equilibrate through the homogenizing effects of gene flow (Fig. 3A). While disparity is low at those times (Fig. 3E–G), it never reaches zero (complete homogeneity) with the parameters used in the computational model, because genetic drift in local populations adds white noise faster than gene flow can average it out (Fig. 3A). The minimum level of disparity during lowstands is thus controlled by the balance of genetic drift, which causes each local population to become randomly different from its neighbors, and gene flow, which causes local populations to become more like their neighbors, something that found not only in this computational model but also in real populations (Levins Reference Levins1968; Endler Reference Endler1977; Polly and Wójcik Reference Polly, Wójcik, Searle, Zima and Polly2019).
Disparity rises along with sea level (Fig. 3E–G). As seas flood the island at the end of each glacial period, small numbers of local populations are isolated on island refugia where their traits quickly diverge due to drift in the absence of gene flow (Fig. 3B). A short lag is observed between rising sea level and rising disparity, because disparity starts increasing once islands become isolated and is then augmented through the edge effect of genetic surfing as populations expand from island refugia as sea level drops (Fig. 3C). Morphological clines that were seeded by “surfing” from the differentiated refugial populations maintain some morphological disparity that is steadily lost as gene flow re-homogenizes the populations, slowly returning the system to the same non-disparate state that preceded the interglacial phase (Fig. 3D).
Disparity at highstands and its rate of homogenization depend on the rates of drift and gene flow. I purposefully selected parameters that maximized the difference in disparity between high- and lowstands to illustrate the process. The same relationship would emerge no matter what parameter values were chosen, but note that these parameters interact with cycle length in a complex way, as discussed later in this paper.
Trait Values Shift during Highstands
Trait means shift abruptly during highstands, in seeming contradiction to the BM nature of genetic drift and the constant rate of drift at the population level. The trait mean captures the central tendency of evolution around which geographic variation fluctuates, and it is the parameter from which evolutionary rates and modes are normally inferred (cf. Simpson Reference Simpson1944; Lande Reference Lande1976; Felsenstein Reference Felsenstein1988; Gingerich Reference Gingerich2001; Polly Reference Polly2004; Hannisdal Reference Hannisdal2006; Hunt Reference Hunt2006; Walsh and Lynch Reference Walsh and Lynch2018).
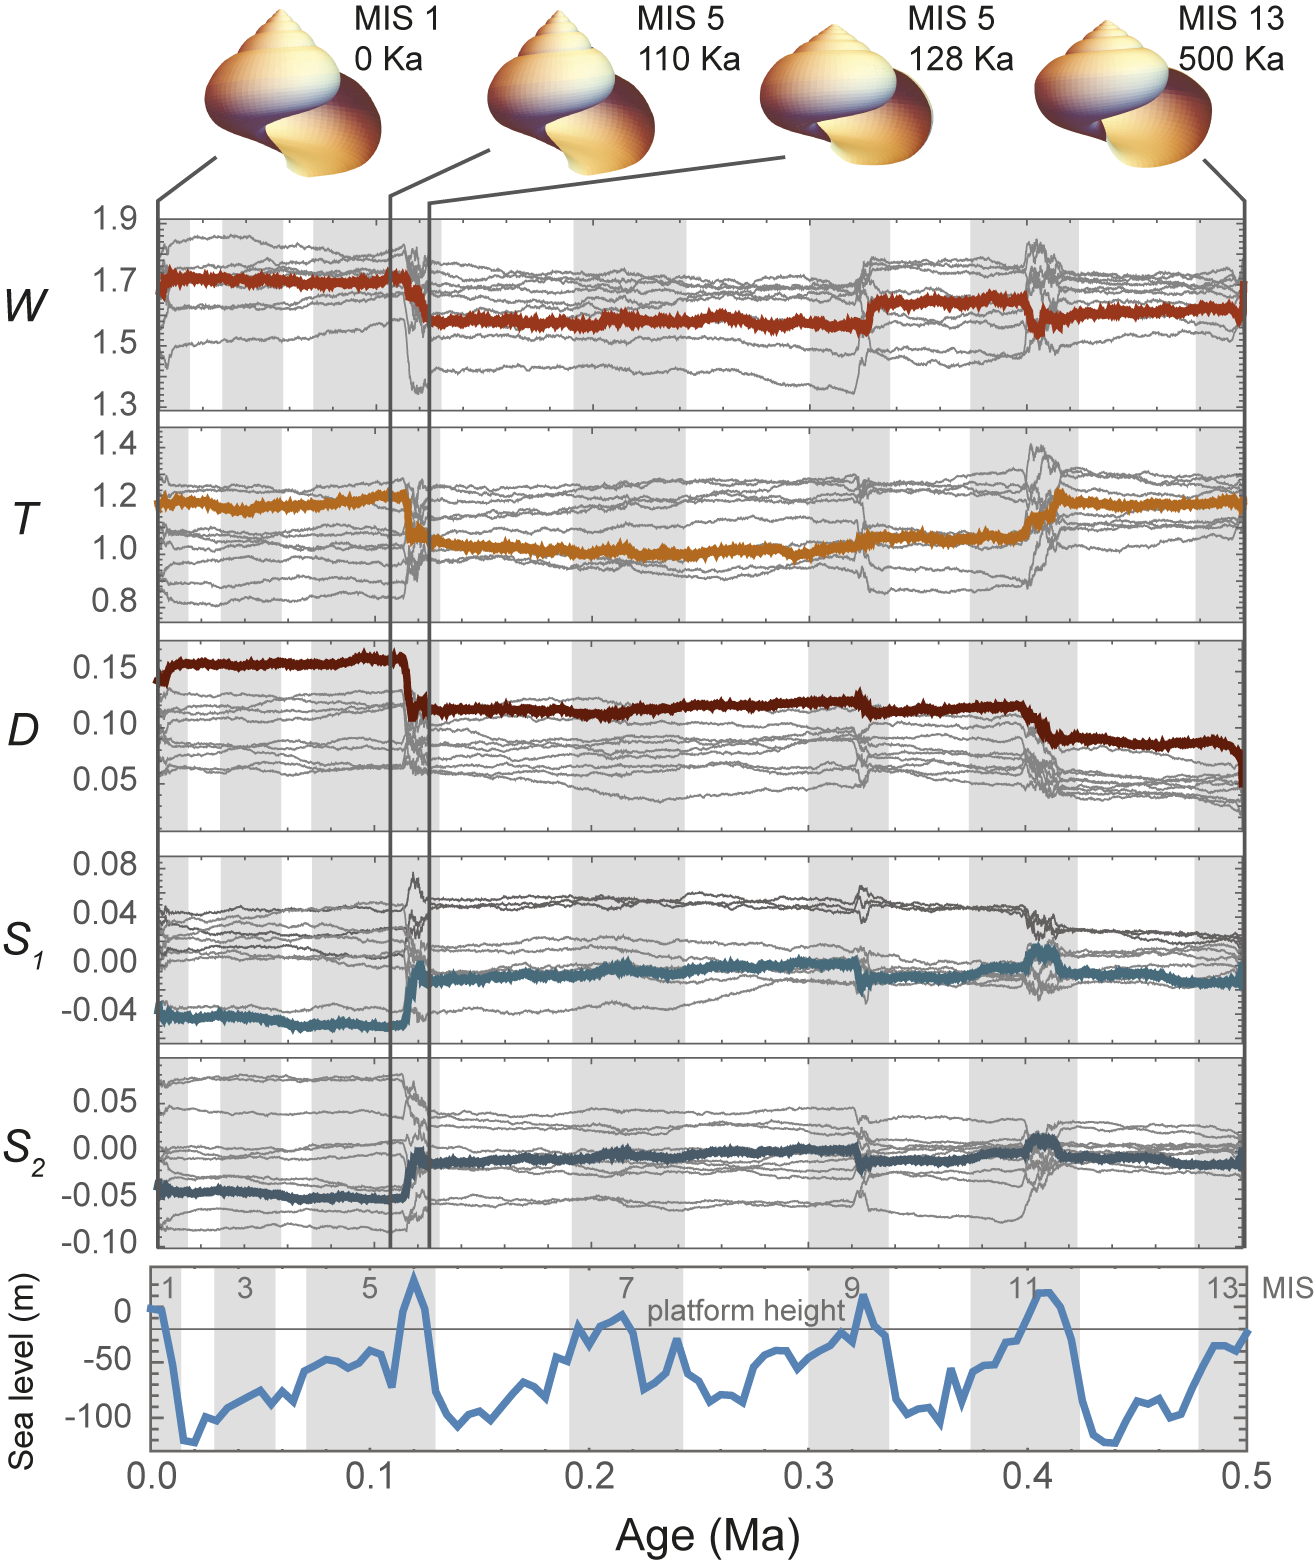
The pattern of trait evolution in these models (Fig. 4) is much like that expected from punctuated equilibria: long periods with little trait change punctuated by rapid bursts of change (cf. Eldredge and Gould Reference Eldredge, Gould and Schopf1972; Gould and Eldredge Reference Gould and Eldredge1977). The difference is that speciation is absent in this computational model but integral to Eldredge and Gould’s model. As for trait disparity, the punctuated pattern of trait change in the computational model is linked to sea level. During lowstands, traits evolve slowly in the large, panmictic metapopulation that covers the seamount, punctuated by rapid bursts of change in the small, isolated populations that survive during highstands. The bursts are most apparent at the MIS 11 and 5 highstands, and to a lesser extent at MIS 9. The rapid phases of trait evolution arise from new morphologies that appear on the isolated island refugia and are swept to dominance by genetic surfing by population expansion during the eustatic regression phases (Fig. 3C,D). Gene flow then homogenizes the species around a new trait mean during the lowstands (Fig. 4).
Trait change. Mean values of the five traits through time from model run DOLTH (thick colored lines) superimposed on mean values of the other nine runs with sea level for context. Each line represents the mean trait value across all extant populations at each model step. Four shape models are shown with vertical lines indicating their location in time (note that the third and second models correspond in time to Fig. 3A and D, respectively).

Punctuated Patterns Are Produced by Rate Shifts, not Changes in Mode
Punctuated patterns of trait evolution occur at highstands at approximately the same time as the peaks in morphological disparity (Fig. 4). The “punctuation” events are produced by increases in evolutionary rate, not by episodes of relaxed stasis, as shown by evolutionary model selection. The models that best fit the trait data were ones in which the evolutionary rate (σ2) differed between nondepositional, eolianite, and pedogenic phases (tests 4 and 10), which together accounted for 43 out of 50 of the traits simulated in this study (Table 1). In the remaining seven cases, the evolutionary models that were supported were ones in which the nondepositional and eolianite phases (“highstand”) shared a common rate of evolution that differed from the lowstand phase (tests 7 and 11).
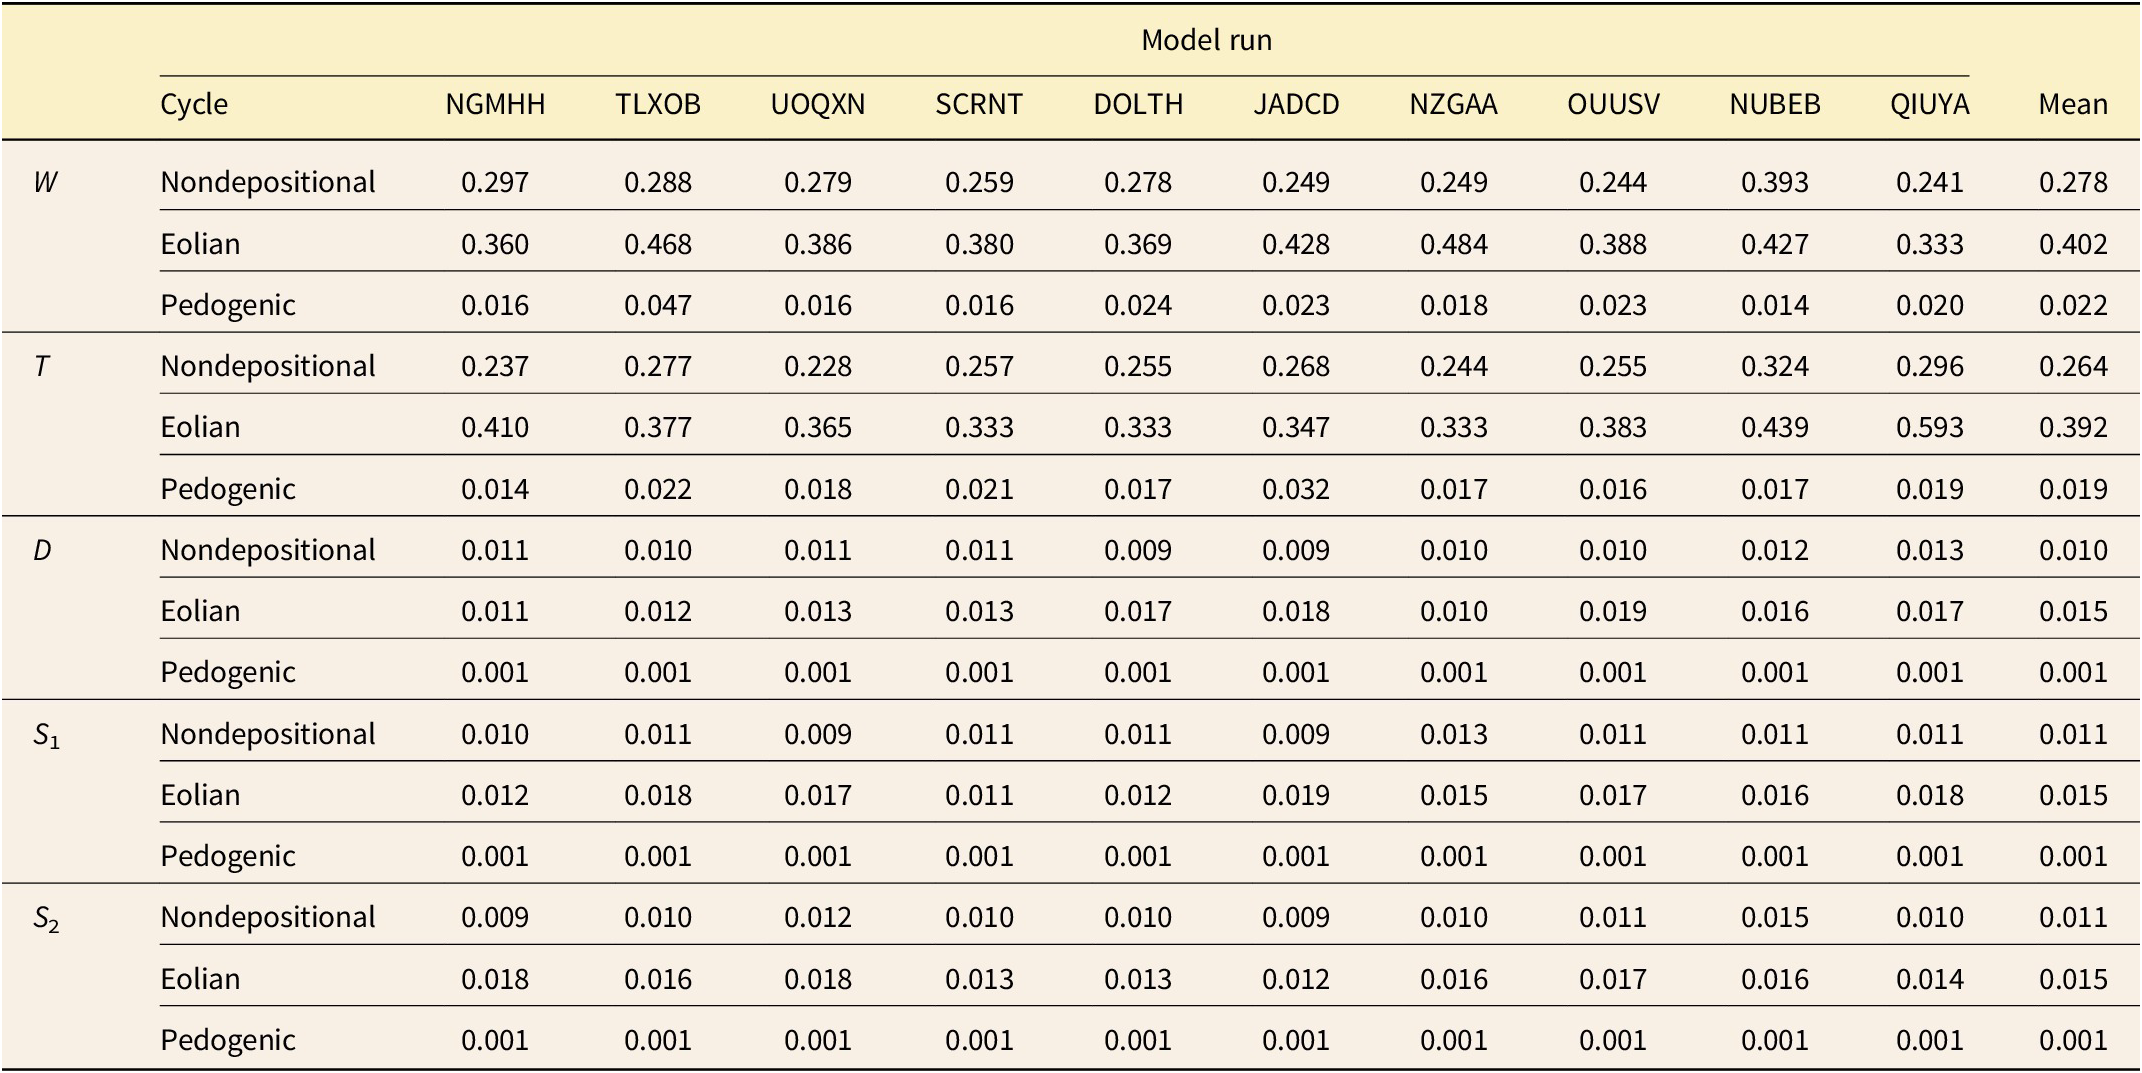
A summary of evolutionary rates (σ2) broken down by sea-level phase is found in Table 2 (see also histogram summary in Supplement 1, Supplementary Fig. S4). The two highstand evolutionary rates were always at least one order of magnitude faster than the lowstand rates, and the regressive phase was usually about 1.5 times faster than the nondepositional phase. Note that by design the rates of the D and W traits were higher than T, S 1, and S 2 traits to explore the full range of observed values for Bermudian snails in each run.
Evolutionary rate (σ2) results. For each of the five traits, the mean evolutionary rate and the rate for each model run are reported for each phase of the sedimentary cycle. The rate of trait change is at least one order of magnitude slower during pedogenic phases (when sea level is below platform height) than during either nondepositional or eolian phases. W, whorl expansion; D, distance between coiling axis and aperture; T, rate of translation along the coiling axis; and S 1, and S 2, geometric morphometric shape variables that describe the shape of the aperture.

Discussion
How Does a Multiple-Rate Pattern Emerge from a Single-Rate Process?
Single-rate BM models (test 12) were never supported (Table 1), even though the underlying genetic drift process coded into the computational model is inherently a single-rate BM process in which all the local populations drift randomly at the same rate. Instead, the rate of evolution that emerged from the computational models was always different between lowstands and highstands (50 out of 50 times), and usually different between nondepositional, eolianite, and pedogenic phases (43 out of 50 times). In fact, evolution was almost always an order of magnitude faster during nondepositional and eolianite phases than in pedogenic phases.
The reason is that the rate of evolution of the species as a whole (i.e., the trait mean) is a function of the total number of interbreeding local populations and their geographic contiguity, both of which are affected by sea level. When there many populations, the overall or effective population size of the species as a whole (N e) increases, which lowers the rate of drift (Whitlock and Barton Reference Whitlock and Barton1997). The overall rate of trait change is slowed, because the random changes in local populations are averaged out by gene flow from neighboring cells, which is a function of the number of occupied cells and the rate of dispersal (Nm). When only a small number of isolated local populations exist at highstands, they rapidly diverge, because the rate of drift on each islet increases inversely to the number of local populations and because gene flow ceases between populations isolated on different islets (Fig. 3B). The newly acquired variety of trait values are swept into the species as a whole through surfing events as the islet populations expand over the seamount during regressive phases (Fig. 3C,D). Lowered N e increases the rate of drift within each isolated local population cluster, the breakdown in gene flow allows disparity to increase, and surfing carries the highstand differentiation into the enlarged metapopulation at the beginning of each lowstand. Radically different rates of evolution thus characterize each eustatic phase.
The multi-rate behavior of evolution in this system is the result of what are fundamentally “Wrightian” spatial dynamics of a metapopulation (Polly Reference Polly2019b). The standard evolutionary models like BM, OU, and directional selection, including those applied here (e.g., Paradis et al. Reference Paradis, Claude and Strimmer2004; Hunt Reference Hunt2007; Beaulieu et al. Reference Beaulieu, Jhwueng, Boettiger and O’Meara2012; Clavel et al. Reference Clavel, Escarguel and Merceron2015), are based on the statistical expectations of a single evolving population, the fundamentals of which are derived from Lande’s (Reference Lande1976) formulation for evolution of quantitative traits in response to selection. In its standard form, this “Fisherian” model describes the behavior of a single, unstructured panmictic population using the principles outlined in the classical quantitative derivations of Fisher (Reference Fisher1930). Structured populations consisting of local populations, each with its own trait mean, that interact through dispersal and interbreeding, and whose number varies because of local extinction and colonization were considered by Wright (Reference Wright1931, Reference Wright1940) to explain evolution in the natural world, concepts that later were elaborated into the field of metapopulation ecology (e.g., Levins Reference Levins1968; Hanski Reference Hanski1999). While metapopulation processes are all “microevolutionary” in nature, the interaction of a metapopulation with changing environments over geological timescales can produce “macroevolutionary” patterns like the punctuated events driven by fragmentation of a species’ geographic range in these computational models. It seems likely that such spatial interactions with Earth system processes have been the norm in the history of life, which may mean that the current Fisherian evolutionary models do not adequately describe the patterns of trait evolution found in the fossil record (Polly Reference Polly2019b, Reference Polly2020). That the traits of local populations had to be averaged across the entire island to apply Hunt’s model-fitting method and that it supported a multi-rate model of evolution in which rate changes are tied to expansions and contractions of the geographic range of the metapopulation rather than true changes in rate parameter used in the computation model, which was constant through time and across populations, illustrates this tension. Evolutionary model fitting is still useful, as is demonstrated by the application of Hunt’s method to the computational model data, but users might well consider a broad range of scenarios when interpreting results like the ones modeled here, in which there is a constant microevolutionary rate at the local population level and an emergent shift in rate at the species level driven by change in geographic range size rather than change in selection intensity or mutation rate.
Why Is Slow Trait Change at Lowstands not “Stasis”?
The patterns of overall trait evolution produced by the computational model visually look like stasis, with long periods in which little or no change is punctuated by rapid bursts of change during highstands (Fig. 4). Eldredge and Gould (Reference Eldredge, Gould and Schopf1972) did not originally define stasis, except as a history of very little change within a species relative to the degree of difference between that species and its ancestor at the time of speciation. In that general sense, the pattern emerging from this spatially explicit model of evolution is ostensibly one of stasis punctuated by rapid bursts of change.
Later, stasis and directional evolution were statistically defined as accumulating either less or more differentiation than expected under a BM model (Lande Reference Lande1986; Bookstein Reference Bookstein1988; Gingerich Reference Gingerich1993), the statis definition similar to the now-familiar adaptive peak (OU) evolutionary models. Hunt’s model selection algorithm shows that the slow lowstand phases are in fact BM but at a slow rate, with true stasis models never being supported out of 50 different trait runs (Table 1). The reason is that even with large numbers of populations that average their phenotypes by gene flow, the net effect of local drift processes produces BM in the species’ mean (Whitlock and Barton Reference Whitlock and Barton1997). This appearance of stasis is an illusion of scale between the lowstand and highstand rates, which differ by more than an order of magnitude (Table 2).
Why Do “Directional” Evolutionary Models Sometimes Fit the Computational Model Outcomes?
Directionality is completely lacking in the computational model, yet it sometimes emerges as a best-fitting evolutionary model (GRW, tests 4 and 7). Directionality in these results is due to change in which the large evolutionary burst in MIS 5 creates an overall “directional” trend (e.g., Fig. 4). This interpretation is supported by the fact that only single-μ parameter GRW models fit the data (tests 4 and 7), never multiple-μ models. The BM component is almost always about an order of magnitude more important than the directional component. To see this, compare typical values of μ and σ2 in Supplement 1, Supplementary Figure S5 (note μ must be squared to make its units comparable to σ2). The directionality parameter μ is almost always near zero, with its variance in the range of plus and minus 0.1 (squared = 0.01), whereas the evolutionary rates σ2 in the highstand phases are always greater than 0.2.
Extending the Common-Cause Hypothesis
The common-cause hypothesis posits that the same tectonically and climatically driven sea-level changes that control the structure of the rock record also control biodiversity patterns (e.g., Newell Reference Newell1952; Sloss Reference Sloss1963; Hallam and Wignall Reference Hallam and Wignall1999; Peters and Foote Reference Peters and Foote2002; Peters and Heim Reference Peters and Heim2011). One common cause factor is the degree of continental flooding. When a continental shelf floods at highstands, accommodation space for the deposition of new sediments increases along with the availability of shallow shelf habitats and opportunities for speciation, but when the shelf is exposed at lowstands, deposition ceases over a wide area and shallow-marine habitats are lost, resulting in widespread extirpations and extinctions. The volume of the rock record is therefore correlated with standing diversity in this example. This type of common cause is hypothesized to be one of the primary drivers of macroevolutionary processes that operate above the species level, driving the rise and fall of entire clades, causing selective mass extinctions, and sorting taxa by shared functional traits (e.g., Jablonski Reference Jablonski2000, Reference Jablonski2017).
This paper presents an extension of the common-cause hypothesis, that the same geological controls that affect biodiversity by altering macroevolutionary rates of speciation and extinction may also affect processes of microevolution at population levels by altering the rate of evolution within species. The mechanism is similar—the impact of expanding and contracting habitats—but here the tempo (and perhaps mode) of evolution within evolving species lineages are hypothesized to be controlled by their effects on population size and thus the importance of drift and the rate at which it changes the phenotype of the species as a whole.
While natural selection has not been discussed in this paper, it is more effective in large populations, because the drift component of evolution decreases and because the amount of genetic variation increases (e.g., Wood et al. Reference Wood, Yates and Fraser2016). Large populations are also subject to “selective sweeps” that spread neutral or deleterious alleles along with beneficial ones, thus rapidly changing the genetic nature of a species in unexpected ways (e.g., Stephan Reference Stephan2019). The concept presented in this paper thus probably applies to nonneutral microevolution as well as to evolution by pure drift, although in more complex and less predictable ways.
How Might Evolutionary and Stratigraphic Processes Be Conflated in the Fossil Record?
The primary message of this paper is that the same processes that control deposition in the sedimentary record may also control microevolutionary processes like the rate of evolution. In the Bermudian system, the expected rate of drift peaks during regressive phases, which is also precisely when the eolian phase of dune accumulation occurs, and conversely, the rate of drift slows at the same time as sedimentation turns to pedogenesis during the lowstands.
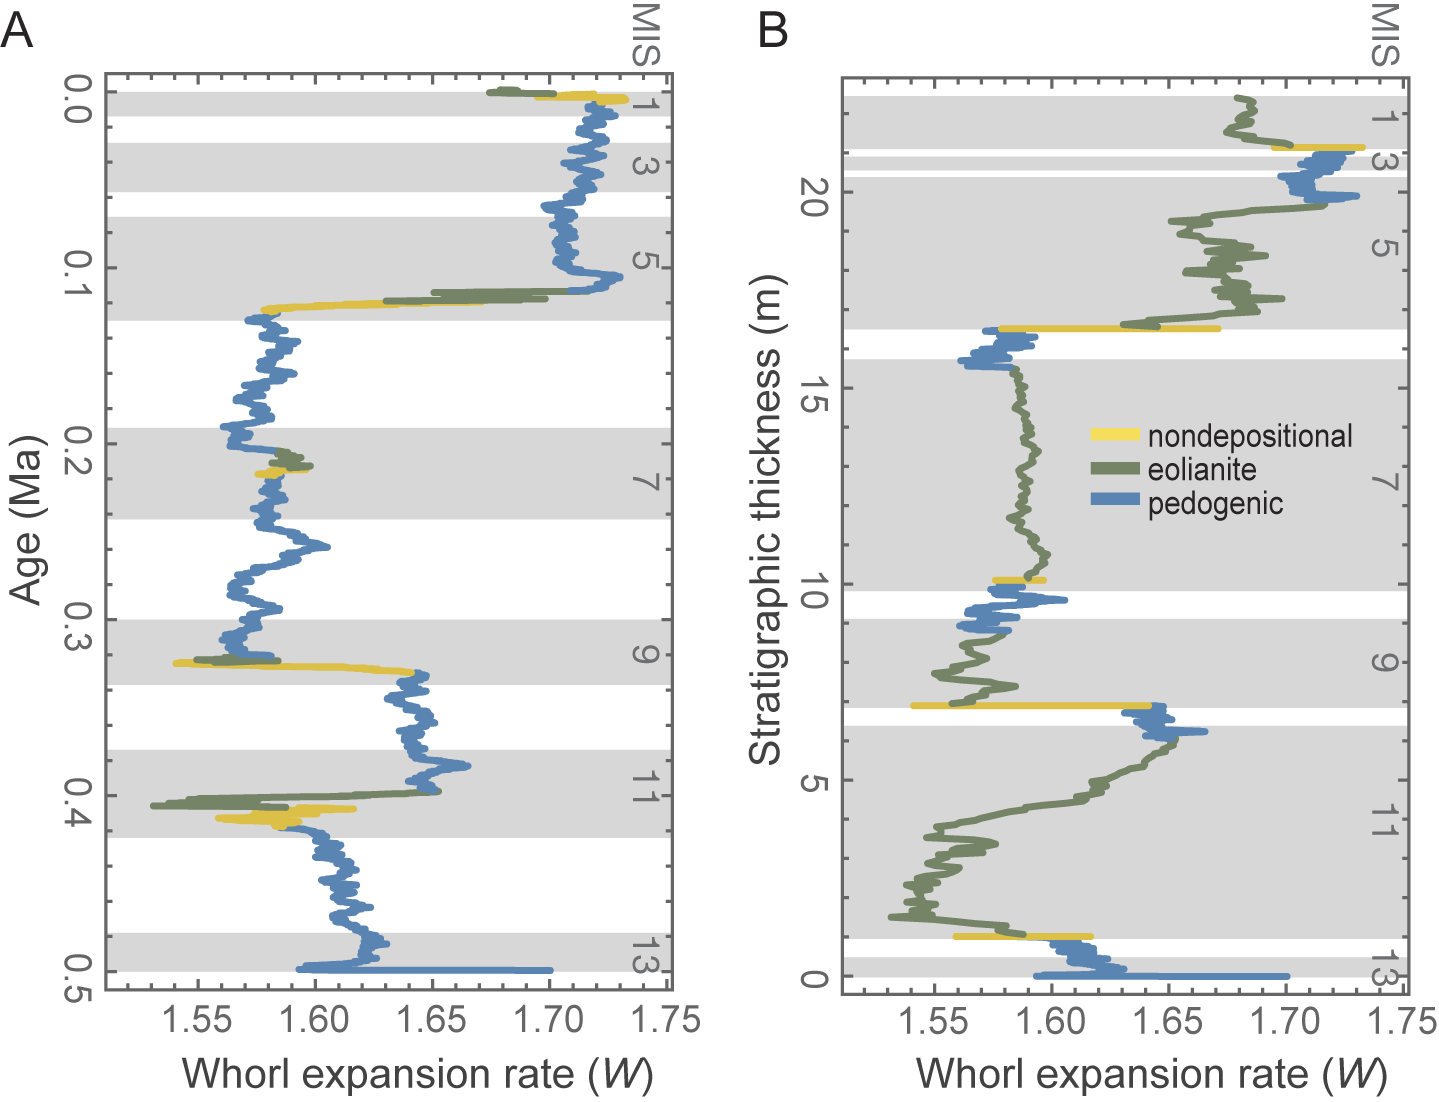
If trait change were to be read straight from the sedimentary record, how would the pattern be distorted by the interaction? Figure 5 shows a side-by-side comparison of change in the mean value of the T parameter scaled by time and by sediment thickness in the idealized stratigraphic column. Overall, the punctuated pattern of trait change is smoothed into a more gradual trend when read by meter level, because the rapid regression bursts are stretched over thick rock units (green lines) and the long lowstand stretches of slow change are compressed into thin soils (blue lines). Punctuation is accentuated during late rising phase and highstand (yellow lines), when rates of evolution are high, but sediment accumulation is theoretically at its minimum. This system would therefore bias paleontological interpretations toward a gradual evolutionary pattern with some punctuated events but little evidence of stasis-like periods of little change. Gould (Reference Gould1969) was mindful of variable sedimentary rates, but if the sea level really did influence both evolutionary rate along with sedimentary deposition in the Bermudian record, it would have made the evolutionary pattern appear more like gradualism rather than punctuation and stasis, and thus his interpretation of punctuated equilibria is, in principle, robust relative to the potential conflation illustrated here.
Temporal and stratigraphic scaling of trait change. Trait change scaled to real model time (trait T from model run DOLTH, as in Fig. 3) shows strong punctuated rate changes at nondepositional (yellow) and pedogenic (green) stages (A), but the pattern is distorted into a seemingly more “random” model when scaled by an idealized stratigraphic thickness (B).

Paleontologists have, of course, been conscious that small population sizes may produce both higher rates of evolution and lower rates of preservation in the fossil record. Not only did that scenario feature strongly in Eldredge and Gould’s (Reference Eldredge, Gould and Schopf1972) formulation of punctuated equilibrium, but so too in Simpson’s “quantum evolution” scenario: “In small populations undergoing pronounced shifts in environment and ecology, much higher rates of evolution are possible…. From their very structure, such groups do not leave good or continuous fossil records” (Simpson Reference Simpson1944: p. 119). Less attention has been paid to whether the processes that might produce small populations or rapidly changing environments are causally linked to the processes that control sedimentation rates or preservation potential. Hunt (Reference Hunt2008) pointed out that the density of sampling in the stratigraphic record can determine whether a rapid burst of evolution appears instantaneous (“unsampled punctuation”) or directional (“sampled punctuation”). The rapid bursts of trait change shown during rising sea-level phases in Figure 5A are good examples of what would be an unsampled punctuation in the fossil record, as these rapid bursts of change take place during what would likely be a period of nondeposition in the Bermudian system. The rapid bursts of trait change during falling phases, however, would be examples of “oversampled punctuation,” because what would have been a rapid event is drawn out across what would be the most productive depositional phases in the Bermudian sequence, the thick eolianites. The lowstand pattern in which long periods of slower evolution are stratigraphically compressed into thin soil units could be termed “static compression.” The overall effect of translating the temporal pattern of changes in Figure 5A into expected stratigraphic thicknesses in Figure 5B is to dampen the strong punctuated pattern in the former into what appears to be a more of a “gradualist” random walk in the latter.
Sedimentologists and paleontologists have been conscious that sedimentation rates vary widely and sometimes undetectably through a section (e.g., Kraus and Gwinn Reference Kraus and Gwinn1997; Goddard and Carrapa Reference Goddard and Carrapa2018; Valenza et al. Reference Valenza, Edmonds and Weissmann2022). Hunt (Reference Hunt2004) discussed its implications for measuring evolutionary rates in the fossil record. Recognizing that fossils must be binned at some level, Hunt showed that the time averaging imposed by analytical stratigraphic binning has the effect of increasing the appearance of within-bin variance and decreasing between-bin evolutionary change when the bin represents longer periods of time, as seen with the lowstand phases of this simulation. Here, however, the lengthy “bins” of the thin paleosol units is offset by their slower evolution.
What Would the Disparity Pattern Look Like with Speciation?
This exercise does not directly test Gould’s (Reference Gould1969) hypothesis that Bermudian snails evolved under a punctuated equilibria model. While the modeling exercise suggests that the null expectation of random evolution on Bermuda might be long periods of very slow change punctuated by bursts of rapid evolution, punctuated equilibria is a hypothesis that evolution is rapid at speciation, and speciation was intentionally omitted from my computational model in order to focus on how Earth system processes might impact “anagenetic” evolution within a single species lineage.
How would the model change if it involved speciation? The probability of speciation would also increase during highstands, because populations diverge on small, isolated islets and thus are more likely to develop the barriers required for reproductive isolation. In the model, no such barriers are included, so gene flow begins to erase the differentiation that accrued in isolation once the populations re-expand to cover the seamount at lowstand. A peak in disparity is thus observed at highstands that decays over the course of the next lowstand (Fig. 3F,G). If true speciation occurred during the highstands, we would expect disparity to grow just like in the model, but it would not be lost during the next lowstand, because the now disparate species would not coalesce through gene flow. The increased disparity would thus be retained until the next highstand, when isolation would once again occur, increasing disparity even further, and would once again be maintained during the lowstand. The expected disparity pattern with speciation would therefore be a stair-step pattern in which disparity jumps up at each highstand (extinction and incomplete speciation would, of course, add complexity to the pattern).
Gould (Reference Gould1969) argued that a pattern like this is found in the Bermudian fossil record. In contrast, Hearty and Olson (Reference Hearty and Olson2010) later argued based on new geochronological work that the disparate fossil forms of Poecilozonites were actually sequential in time rather than contemporaneous and that they represent a single anagenetic lineage similar to the ones in my computational models. While the empirical data in Bermuda’s fossil record could be used to test the punctuated equilibrium hypothesis using the two models of disparity with and without speciation, more work is required. The author notes, however, that two or more forms of snail sometimes occur cemented together in the same sinkhole breccia, suggesting that they were both contemporaneous and coexisted in the same habitat, strongly implying speciation.
Conclusions
What null model should we assume for trait evolution? Hypothesis testing in evolutionary morphology usually pits a hypothesis implying some causal process, like directed change or stasis, against a null model of “no process.” Since the ground-breaking work of Felsenstein (Reference Felsenstein1988), Bookstein (Reference Bookstein1988), and Gingerich (Reference Gingerich1993), the null model for trait evolution has been a single-rate BM process, not because it is believed to be the dominant way in which evolution proceeds, but because it invokes no particular process and implies no directionality, no correlation, and a rate that varies stochastically around a single mean. This paper suggests that a variable-rate BM null model might be more appropriate. As discussed at length elsewhere, the typical single-rate BM model, when applied at phylogenetic timescales, is inherently a Fisherian model that assumes that species behave as single, panmictic populations with a uniform phenotypic mean and variance and a stochastically constant population size (Polly Reference Polly2019b, Reference Polly2020). Real-world evolution is likely to be Wrightian, in which species are metapopulations whose means vary spatially, whose ranges expand and contract, and whose population parameters—and therefore rates of evolution—change in response to changing environments. It should be realized, however, that the Wrightian model presented in this paper makes its own process-based assumptions, namely that true genetic drift is the dominant process in evolution. A fluctuating-selection null model (Kimura Reference Kimura1954; Felsenstein Reference Felsenstein1988), for example, might behave more like the classic single-rate BM model embedded in most current phylogenetic comparative methods.
The hypothesis put forward in this paper is that the same causal processes that control sedimentary regimes, habitat availability, and climate configurations—whether those be Milankovitch cycles, tectonics, or patterns of oceanic and atmospheric circulation—not only exert control on standing biodiversity through their effects on rates of speciation and extinction, but that they may also affect rates and modes of trait evolution. If so, then the common-cause hypothesis may extend into the realm of microevolution (population-level processes) as well as macroevolution (species- and clade-sorting and ecosystem-level processes).
The mechanism by which Milankovitch-driven sea-level cycles would affect trait evolution in a terrestrial species like Poecilozonites and drive sedimentation patterns is an obvious and perhaps an extreme example. Might the same phenomenon occur in other situations and, if so, under what conditions? For such processes to affect trait evolution they would have to change the parameters like population size, genetic variance, selection intensity, or founder effects. Drift processes dominate when population sizes are small, and those processes produce random BM-style trait evolution; selection, including selective sweeps that affect many genes, dominates when population sizes are large (e.g., Wright Reference Wright1931; Lande Reference Lande1976; Wood et al. Reference Wood, Yates and Fraser2016). Compressing or expanding the geographic range of a species, fragmenting it or allowing fragments to coalesce, or applying widespread selection to cope with an altered environment would be the logical mechanisms for an Earth system process to impact trait evolution. To affect the sedimentary record, that same process would have to alter weathering, transport, accommodation space, or erosion. Climatic, tectonic, and sea-level processes have obvious links to weathering, transport, rates of burial, and accommodation, although so too might any process that controls vegetation cover, karstification, or subsidence (e.g., Valentine Reference Valentine1973; Chakrapani Reference Chakrapani2005; Katz Reference Katz2005; Catuneanu Reference Catuneanu2006; Jeffrey et al. Reference Jeffery, Yanites, Poulsen and Ehlers2014).
Genetic surfing was recognized from molecular phylogeographic analysis of postglacial expansion of species geographic ranges in North America and Eurasia (e.g., Hewitt Reference Hewitt1996; Excoffier and Ray Reference Excoffier and Ray2008) and was later shown to affect trait evolution as well (e.g., Ledevin et al. Reference Ledevin, Michaux, Deffontaine, Henttonen and Renaud2010; Polly Reference Polly, Searle, Zima and Polly2019a). The terrestrial vertebrate species in those studies have geographic ranges that are far larger than the patchy sediment traps in which their fossil remains are found, yet there is no question that the same glacial–interglacial climatic processes that cyclically altered their geographic ranges also drove cyclic changes in karstification, weathering and transport, water table levels, and therefore the cave and river terrace deposition that is the source of the paleontological record for most small Quaternary vertebrates (e.g., Schreve and Bridgland Reference Schreve and Bridgland2002; Bartolomé et al. Reference Bartolomé, Sancho, Benito, Medialdea, Calle, Moreno and Leunda2021). Quaternary sea level may have had parallel effects on continental shelf environments (e.g., Valentine and Jablonski Reference Valentine and Jablonski1991). Vrba’s “turnover-pulse” theory of climatic–environmental–evolutionary links in which the driver is interaction between tectonics and Quaternary climate in east Africa (e.g., Vrba Reference Vrba1993) is also an example where Earth systems may simultaneously affect trait evolution and sedimentary deposition, as are the tectonic uplift examples that drive basin formation, habitat fragmentation, and climatic change (e.g., Badgley et al. Reference Badgley, Smiley, Terry, Davis, DeSantis, Fox and Hopkins2017; Loughney et al. Reference Loughney, Badgley, Bahadori, Holt and Rasbury2021; Weaver et al. Reference Weaver, Kelson, Holder, Niemi and Badgley2024). Ancient changes in sea level driven by tectonics are known to have radically reorganized the biogeography of species, sometimes cyclically, creating additional opportunities for an extended common-cause impact on microevolution of morphological traits (e.g., Stigall Reference Stigall2019).
The common-cause hypothesis suggested that the geosphere and biosphere may have coevolved through macroevolutionary processes. The extended common cause suggests that the links may extend to microevolutionary trait evolutionary processes, especially ones that govern rates of evolution. The multi-rate, multimode patterns of evolution that are produced by these Wrightian processes and the potential correlation between rate shifts and fossil preservation potential both suggest that fresh scrutiny be given to the methods we use and the assumptions we bring to the study of evolution in the fossil record.
Acknowledgments
This paper is dedicated to Jim Valentine, who passed while it was being written. When I was a student, he expanded my thinking through the classes I took from him and taught with him, and he continues to teach me through his books and papers. A. Bush, D. Fox, S. Holland, G. Hunt, G. Motz, and P. Novack-Gottshall shared thoughts that helped me formulate my thinking. J. Utrup, E. Lazo-Wasem, S. Butts, J. Cundiff, L. Rojas, L. Berniker, and M. Siddall did the same, and helped with specimens. M. Hill (American Museum of Natural History) and B. Bagley (University of Minnesota) oversaw CT scanning of snails, and M. Allen (Indiana University) and M. Maga (Seattle Children’s Hospital) provided computational advice. The Yale Institute for Biospheric Studies, an Earth-Life Transitions grant from the U.S. National Science Foundation (EAR-1338298), and the Robert R. Shrock Professorship at Indiana University funded my work. The Indiana University Pervasive Technology Institute and the Lilly Endowment, Inc., provided supercomputing resources to run the computational models. Finally, thank you to L. Ivany and D. Prothero for inviting me to participate in this volume (as well as for editorial contributions) and to S. Holland and two anonymous reviewers for suggestions that considerably improved the paper.
Competing Interests
The author declares competing interests.
Data Availability Statement
All supplementary files are available at Zenodo at https://doi.org/10.5281/zenodo.11636279. Model output and geometric morphometric data are available at Dryad at https://doi.org/10.5061/dryad.jh9w0vtf4. Supplement 1: Extended methods, data, and figures. Supplement 2: Mathematica code. Supplement 3: Zip file of model outputs, including animated maps of trait evolution. Supplement 4: TPS file of Poecilozonites aperture semilandmarks.
Code Availability Statement
All supplementary code used in this paper is available at Zenodo at https://doi.org/10.5281/zenodo.11636279.

 Open access