


Introduction
Protoporphyrinogen oxidase-(PPO) and acetolactate synthase-(ALS) inhibiting herbicides historically have successfully controlled Amaranthus spp. (Harris et al. Reference Harris, Gossett, Murphy and Toler1991; Mavo et al. Reference Mavo, Horak, Peterson and Boyer1995). Herbicides that inhibit PPO and ALS have been effective PRE (flumioxazin, sulfentrazone, chlorimuron, cloransulam) and POST as control options (fomesafen, acifluorfen, lactofen, imazethapyr) for many troublesome weeds in soybean (Harris et al. Reference Harris, Gossett, Murphy and Toler1991; Mavo et al. Reference Mavo, Horak, Peterson and Boyer1995; Niekamp et al. Reference Niekamp, Johnson and Smeda1999). Five years after the introduction of ALS herbicides to the United States, ALS-resistant biotypes of prickly lettuce (Lactuca serriola L.) and kochia [Kochia scoparia (L.) Roth] were documented (Mallory-Smith et al. Reference Mallory-Smith, Thill and Dial1990; Saari et al. Reference Saari, Cotterman and Primiani1990). To date, at least 165 species of weeds, including Palmer amaranth [Amaranthus palmeri (S.) Wats.] have evolved resistance to ALS herbicides (Heap Reference Heap2019).
PPO-inhibiting herbicides were widely used to control Amaranthus species before the release of glyphosate-resistant crops (Norsworthy et al. Reference Norsworthy, Ward, Shaw, Llewellyn, Nichols, Webster, Bradley, Frisvold, Powles, Burgos, Witt and Barrett2012). PPO-inhibiting herbicide use increased substantially following widespread resistance of Amaranthus species to ALS and glyphosate (Norsworthy et al. Reference Norsworthy, Griffith, Scott, Smith and Oliver2008). The first documented PPO-resistant Amaranthus species was common waterhemp [Amaranthus tuberculatus (Moq.) Sauer] in Kansas in 2000 (Heap Reference Heap2019). The resistant waterhemp biotype was then found in Missouri, Illinois, Iowa, Indiana, Nebraska, Minnesota, and Wisconsin (Heap Reference Heap2019). Palmer amaranth resistant to PPO-inhibiting herbicides was subsequently documented in Arkansas in 2015 (Salas et al. Reference Salas, Burgos, Tranel, Singh, Glasglow, Scott and Nichols2016). Herbicides that inhibit PPO and ALS are less effective today because of the evolution and spread of PPO- and ALS-resistant Palmer amaranth and common waterhemp (Salas et al. Reference Salas, Burgos, Tranel, Singh, Glasglow, Scott and Nichols2016; Varanasi et al. Reference Varanasi, Brabham, Norsworthy, Nie, Young, Houston, Barber and Scott2018).
Besides potential resistance evolution, the continued use of these herbicides in soybean may be questionable because injury to the crop often follows their use (Whitaker et al. Reference Whitaker, York, Jordan and Culpepper2010). Prior to PPO- and ALS-resistant Palmer amaranth, injury to soybean was considered tolerable because of the high level of weed control achieved by the application (Harris et al. Reference Harris, Gossett, Murphy and Toler1991). However, it has been shown that soybean injury following herbicide application can result in delayed canopy formation, leading to a possible increase in weed germination (Nelson and Renner Reference Nelson and Renner2001). With a reduction in efficacy for Palmer amaranth, the most troublesome weed of soybean (Schwartz-Lazaro et al. Reference Schwartz-Lazaro, Norsworthy, Steckel, Stephenson, Bish, Bradley and Bond2018), the continued use of these herbicides may not be justified due to the detrimental effects on soybean canopy formation.
The promotion of crop canopy formation is a vital tool used by growers to reduce late-season weed emergence and limit the need for additional POST herbicides. Canopy closure reduces the emergence rate of weed seeds by shading the soil surface (Burnside and Moomaw Reference Burnside and Moomaw1977; Chandler et al. Reference Chandler, Shrestha and Swanton2001; Dally et al. Reference Dally, Kells and Renner2004; Harder et al. Reference Harder, Sprague and Renner2007; Nelson and Renner Reference Nelson and Renner1997; Nice et al. Reference Nice, Buehring and Shaw2001; Young et al. Reference Young, Young, Gonzini, Hart, Wax and Kapusta2001). Canopy formation is a complex process because many factors influence its rate of development, including row spacing, seeding rate, plant phenology, maturity group, fertilization, and environmental conditions, among others. Growers can better utilize canopy closure by decreasing row spacing and/or increasing seeding rate, which promotes early canopy closure by increasing leaf area index Bertram and Pederson Reference Bertram and Pedersen2004; Burnside and Colville Reference Burnside and Colville1964; Harder et al. Reference Harder, Sprague and Renner2007; Yelverton and Coble Reference Yelverton and Coble1991). In midsouthern U.S. production systems, soybean is primarily grown on rows spaced 97 cm apart, resulting in soybean taking 50 to 80 d after planting to reach full canopy formation under irrigated conditions (Bell et al. Reference Bell, Norsworthy, Scott and Popp2015).
Rate of canopy formation in soybean influences light interception and alters light quality, both of which have been shown to impact weed emergence (Huang Reference Huang1993; Jha and Norsworthy Reference Jha and Norsworthy2009). Full canopy formation is achieved when 95% of available light is intercepted by the crop (Gardner et al. Reference Gardner, Pearce and Mitchell1985; Harder et al. Reference Harder, Sprague and Renner2007; Shibles and Weber Reference Shibles and Weber1965). This level of light interception is needed to maximize soybean yield and strongly suppress weed emergence (Edwards and Purcell Reference Edwards and Purcell2005; Jha and Norsworthy Reference Jha and Norsworthy2009). The interception of solar radiation by the crop canopy impacts light quality reaching the soil surface and weed seeds lying on or near the soil surface. The phytochrome conversion of Pr (red) and Pfr (far red) has been shown to be of importance for germination of troublesome weed species such as redroot pigweed (Amaranthus retroflexus L.; Gallagher and Cardina Reference Gallagher and Cardina1998). Soybean is able to reduce the germination of shallow-seeded weed species by altering the incidence of the Pr and Pfr ratio underneath the crop canopy. Jha and Norsworthy (Reference Jha and Norsworthy2009) observed a reduced soil temperature due to crop canopy formation contributed a larger role than light quality in reducing Palmer amaranth emergence.
The benefits of promoting early-season crop canopy formation has been thoroughly established. As soybean population increases or spatial distribution of soybean becomes more uniform, there is an increase in leaf area index and promotion of early canopy closure (Bertram and Pederson Reference Bertram and Pedersen2004; Harder et al. Reference Harder, Sprague and Renner2007). Early season canopy formation can be promoted by reducing soybean row spacing, in turn reducing crop weed emergence (Bertram and Pederson Reference Bertram and Pedersen2004; Harder et al. Reference Harder, Sprague and Renner2007). By reducing weed emergence through an assortment of cultural practices, so too is the selection for resistance to foliar active and residual herbicides lessened (Norsworthy et al. Reference Norsworthy, Ward, Shaw, Llewellyn, Nichols, Webster, Bradley, Frisvold, Powles, Burgos, Witt and Barrett2012).
Crop and weed interactions are complex. Anything producers can do to maximize the competitive nature of the crop will likely benefit weed management. With this being true, the objective of this research was to determine the effect of POST-applied herbicides on soybean injury, rate of crop canopy formation, and yield.
Materials and Methods
Field experiments were conducted near Crawfordsville, Arkansas, in 2017 and 2018, and at the Lon Mann Cotton Research Station near Marianna, Arkansas, in 2018. The soil series in the field near Crawfordsville was a Dundee silt loam (fine-silty, mixed, active, thermic Typic Endoaqualfs) with 11% sand, 77% silt, 12% clay, 1.95% organic matter (OM), and a pH of 5.5 and 5.8, in 2017 and 2018, respectively. Near Crawfordsville, soybean was planted with a twin-row planter (Great Plains, Salina, KS) with a spacing of 18 cm between the twin rows on 97-cm-spaced rows. The trials established in Crawfordsville were nonirrigated. The trial at Marianna was conducted on a Convent silt loam (coarse-silty, mixed, superactive, thermic Fluvaquentic Endoaquepts) with 9% sand, 80% silt, 11% clay, 1.8% OM, and a pH of 6.8. The soybean near Marianna was planted with a four-row planter on 97-cm-wide rows. The trial near Marianna was furrow irrigated. Soil at both locations was prepared with a disk, hipper, and a field cultivator to smooth beds before planting. All experiments were planted to a non-sulfonylurea-tolerant, glufosinate-resistant soybean variety (CDZ 5150LL) at a rate of 346,000 seed ha−1. At both locations, a weather station was present to record rainfall data.
Experiments conducted at both locations were established as a two-factor randomized complete block design with four replications. The two factors were a labeled rate of the herbicides (fomesafen, acifluorfen, S-metolachlor + fomesafen, S-metolachlor + fomesafen + chlorimuron) applied with or without glufosinate (Table 1). Additionally, nontreated plots were included for comparison. Plot size was 7.6 m long and 3.8 m wide. Treatments were applied 28 d after planting (DAP). To accurately assess the impact of treatments on soybean development, plots were maintained weed-free by applying flumioxazin (Valor, Valent U.S.A, Mahomet, IL) at 71 g ai ha−1 3 to 4 DAP to all treatments with additional applications of glufosinate at 595 g ai ha−1 + S-metolachlor at 1,066 g ai ha−1 at 14 DAP (to keep the trial weed-free). Herbicide treatments were applied with a CO2-pressurized backpack sprayer calibrated to deliver 140 L ha−1 at 4.8 km h−1 using AIXR flat-fan 110015 nozzles (Teejet Technologies, Springfield, IL).
Herbicides and formulations evaluated, with manufacturer name and address.

Data collected included crop injury ratings, soybean plant volume, percent groundcover, and yield. To evaluate crop injury, soybean was assessed for visible phytotoxicity, necrosis, and stunting and compared with nontreated plants. Ratings were based on a 0% to 100% scale, with 0% being no crop injury and 100% being crop death (Frans and Talbert Reference Frans and Talbert1977). Visual estimates of crop injury were rated 7, 14, 21, and 28 d after application. Soybean volume was calculated by measuring height and width of five soybean plants within the center two rows inside the plot and then calculating the volume using the following formula: $\left( {\pi \times plant\;height} \right) {\left( {plant\;width \div 2} \right)^2}$
(Norsworthy Reference Norsworthy2004). Soybean volume was assessed weekly until canopy closure for all plots was achieved or until soybean maturity. Aerial photos were taken weekly after planting using an unmanned aerial vehicle (DJI Phantom 4 Pro equipped with a 1080p gimbal mounted camera, Shenzhen, China). These photos were achieved by taking an ortho-mosaic of the area and were stitched into a complete image (ortho-mosaic) using Field Agent software (Sentera, Minneapolis, MN). The ortho-mosaic was subjected to analysis in Field Analyzer (https://www.turfanalyzer.com/#field_analyzer). Field analyzer produced the proportion of green pixels in the selected area in each plot, giving an assessment of groundcover. Soybean grain was harvested from the two center rows of each plot at maturity using a small-plot combine, and yields were adjusted to 13% moisture.
$\left( {\pi \times plant\;height} \right) {\left( {plant\;width \div 2} \right)^2}$
(Norsworthy Reference Norsworthy2004). Soybean volume was assessed weekly until canopy closure for all plots was achieved or until soybean maturity. Aerial photos were taken weekly after planting using an unmanned aerial vehicle (DJI Phantom 4 Pro equipped with a 1080p gimbal mounted camera, Shenzhen, China). These photos were achieved by taking an ortho-mosaic of the area and were stitched into a complete image (ortho-mosaic) using Field Agent software (Sentera, Minneapolis, MN). The ortho-mosaic was subjected to analysis in Field Analyzer (https://www.turfanalyzer.com/#field_analyzer). Field analyzer produced the proportion of green pixels in the selected area in each plot, giving an assessment of groundcover. Soybean grain was harvested from the two center rows of each plot at maturity using a small-plot combine, and yields were adjusted to 13% moisture.
Data Analysis
All data were analyzed in JMP Pro 14.1 (SAS Institute Inc., Cary, NC). Soybean canopy volume data were regressed using a mechanistic growth curve {y = a [1 – b * EXP (–c*days)]}, where a = asymptote, b = scale, and c = growth rate to predict canopy development over time in the Fit Curve platform of JMP, as described previously (Gillespie et al. Reference Gillespie, Allen and Vose1994). Inverse predictions of the number of days for soybean to reach 15,000 cm3 were recorded along with 95% confidence intervals. Percent groundcover data were also regressed using a mechanistic growth curve in the Fit Curve platform of JMP as shown in Figures 1 through 4. From the mechanistic growth curve, inverse predictions were made for the number of days required after application for soybean to achieve 60% and 80% groundcover. Confidence intervals of the means were also produced for the groundcover estimates. Soybean volume and percent groundcover data were regressed over site years to increase the number of observations and give a stronger prediction estimate. Regressing over site years gave an average soybean response over three environments. Percent injury and yield data were subjected to ANOVA. When analyzing injury and soybean yield, site year and replication nested within site year were random effects of the model. Means were separated using Fisher’s protected LSD at P = 0.05.
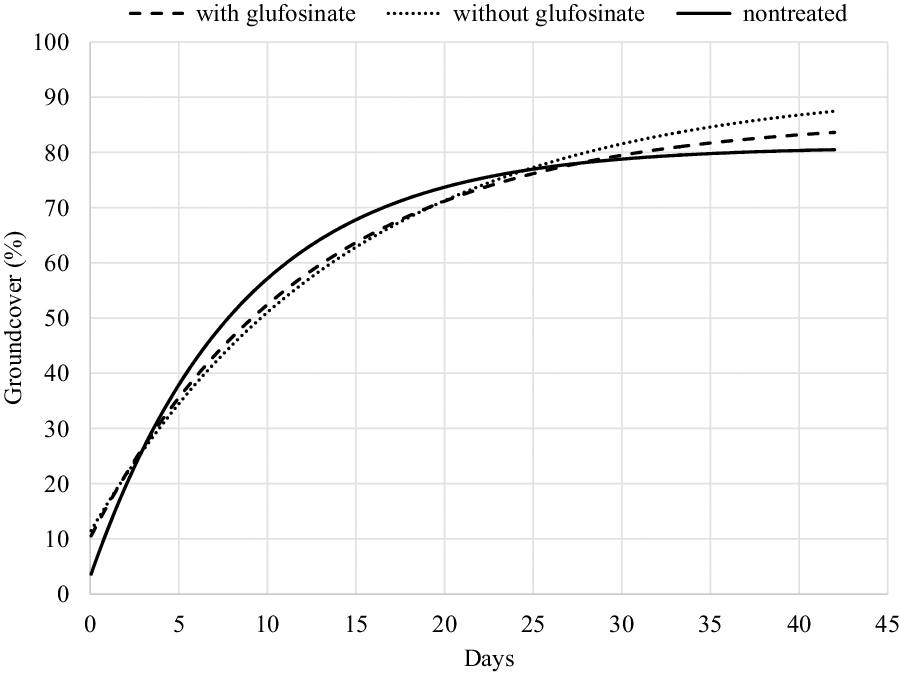
Mechanistic growth curve {y = a [1 – b * EXP (–c*days)]}, where a = asymptote, b = scale, and c = growth, to estimate percentage soybean groundcover following fomesafen applied to V2 soybean with and without glufosinate relative to nontreated soybean as a function of days after application over three site years. Parameter estimates for each line are found in Table 3.

Mechanistic growth curve {y = a [1 – b * EXP (−c*days)]}, where a = asymptote, b = scale, and c = growth, to estimate percentage soybean groundcover following fomesafen + S-metolachlor applied to V2 soybean with and without glufosinate relative to nontreated soybean as a function of days after application over three site years. Parameter estimates for each line are found in Table 3.

Mechanistic growth curve {y = a [1 – b * EXP (–c*days)]}, where a = asymptote, b = scale, and c = growth, to estimate percentage soybean groundcover following fomesafen + S-metolachlor + chlorimuron applied to V2 soybean with and without glufosinate relative to nontreated soybean as a function of days after application over three site years. Parameter estimates for each line are found in Table 3.
Mechanistic growth curve {y = a [1 – b * EXP (–c*days)]}, where a = asymptote, b = scale, and c = growth, to estimate percentage soybean groundcover following acifluorfen applied to V2 soybean with and without glufosinate relative to nontreated soybean as a function of days after application over three site years. Parameter estimates for each line are found in Table 3.

Results and Discussion
Soybean Injury
Herbicide treatments consisting of the PPO- and ALS-inhibiting herbicides used in this experiment were chosen because of their tendency to injure soybean, even when applied at labeled rates (Whitaker et al. Reference Whitaker, York, Jordan and Culpepper2010). With the widespread occurrence of ALS-resistant Palmer amaranth and the increasing occurrence of PPO-resistant Palmer amaranth (Varanasi et al. Reference Varanasi, Brabham, Norsworthy, Nie, Young, Houston, Barber and Scott2018), the continued use of these herbicides has been questioned, especially if there is sufficient injury to delay crop canopy formation, which would result in an opportunity for additional weed emergence. Hence, the goal of the experiment was not to validate or confirm that certain PPO- and ALS-inhibiting herbicides cause injury to soybean, but rather to determine whether crop injury translates into a delay in soybean canopy formation. Therefore, comparing injury levels among treatments was not the primary focus of the experiment.
Based on ANOVA, soybean injury was impacted by an interaction between PPO/ALS herbicide and the addition of glufosinate (P = 0.0086). Across the three site years, glufosinate + acifluorfen caused 25% injury, which was the highest level observed (Table 2). Fomesafen, S-metolachlor + fomesafen, S-metolachlor + fomesafen + chlorimuron alone and in combination with glufosinate resulted in 9% to 15% soybean injury (Table 2). Similarly, Beyers et al. (Reference Beyers, Smeda and Johnson2002) found that PPO- and ALS-inhibiting herbicides mixed with glufosinate resulted in up to 21% injury to glufosinate-resistant soybean; those findings are comparable to injury levels observed in experiments that we conducted.
Percentage injury to soybean 2 wk after application as influenced by the interaction of herbicide selection with and without the addition of glufosinate averaged across site years.

a Means not represented with like letters inside the same column are statistically different based on Fisher’s protected LSD (α = 0.05).
Soybean Volume
Parameters of the mechanistic growth curves are shown in Table 3. Any difference in soybean volume between treated and nontreated plants was difficult to determine due to the additional variability added to the analysis by subsampling five plants from each plot at different timings. Percent groundcover analysis considered the whole plot and was a better representation of soybean canopy formation over time than was soybean volume. However, general numeric delays in soybean volume caused by herbicide injury to soybean are evident in data presented in Table 4. Fomesafen, acifluorfen, S-metolachlor + fomesafen, and S-metolachlor + fomesafen + chlorimuron numerically delayed soybean from reaching a volume of 15,000 cm3 by 2 d. Glufosinate + fomesafen, glufosinate + acifluorfen, glufosinate + S-metolachlor + fomesafen, and glufosinate + S-metolachlor + fomesafen + chlorimuron delayed soybean from reaching a volume of 15,000 cm3 by 2, 3, 2, and 2 d, respectively.
Mechanistic growth curve {y = a [1 – b * EXP (–c*days)]}, where a = asymptote, b = scale, and c = growth rate, fit to data from all site years; R 2 values indicate the percentage of variability explained by the fit of the line.

Number of days required after herbicide application for soybean to reach volume of 15,000 cm3 based on inverse predictions using the mechanistic growth curve fit to soybean volume data.

a Number of days after a V2 herbicide application for soybean to reach 15,000 cm3
b 95% confidence interval of the mean number of days for soybean to reach 15,000 cm3.
Percent Groundcover
The application of fomesafen, acifluorfen, and glufosinate + S-metolachlor + fomesafen delayed soybean from reaching 60% groundcover by 3 d compared to nontreated soybean plants (Table 5). S-metolachlor + fomesafen and S-metolachlor + fomesafen + chlorimuron delayed formation of 60% soybean groundcover by 4 d. Application of glufosinate + acifluorfen, which was also the most injurious herbicide treatment applied, delayed 60% soybean groundcover by 5 d. Soybean that received an application of either glufosinate + fomesafen or glufosinate + S-metolachlor + fomesafen were not significantly different from nontreated plants; however, a numerical delay to 60% groundcover of 2 to 3 d was observed.
Number of days required after herbicide application for soybean to reach 60% and 80% groundcover based on inverse predictions using the mechanistic growth curve fit to percent groundcover data.

a Number of days after a V2 application for soybean to reach 60% groundcover.
b 95% confidence interval of the mean number of days for soybean to reach 60% groundcover.
c Number of days after a V2 application for soybean to reach 80% groundcover
d 95% confidence interval of the mean number of days for soybean to reach 80%. Groundcover.
* Indicates significant difference from the nontreated.
Soybean has a high propensity to recover from early season injury from some herbicides, with seldom an impact on grain yield (Kapusta et al. Reference Kapusta, Jackson and Mason1986); however, the ability of soybean to recover from injury that delays canopy formation would likely be contingent upon planting date, soybean phenology, maturity group, growth habit, and soil moisture availability. For determinate soybean variety, canopy growth generally declines at flowering (R1) with grain yield linked to the amount of canopy present when the crop begins reproductive development (Edwards and Purcell Reference Edwards and Purcell2005). Data collected from all three site-years show no significant delay in the number of days required to achieve 80% groundcover, but injured plants generally exhibited slower canopy formation based on other levels of groundcover.
As soybean shifts from primarily vegetative growth to reproductive growth, canopy formation is slowed; therefore, placement of 80% groundcover on the mechanistic growth curve is indicated by a low slope and reduces the power of the prediction estimate (larger confidence interval). Injury caused by herbicides has season-long effects on soybean growth and development. The belief that soybean can fully recover from herbicide injury may be exaggerated; a delay in soybean canopy formation should be expected relative to the amount of herbicide-induced injury.
Digital analysis of groundcover proved more powerful at predicting the impact of herbicide-induced injury on soybean canopy formation over manual measurements of soybean height and width. The 95% confidence limits of the 60% groundcover analysis averaged a 3.2-d span compared with an averaged 8.4-d span of the confidence limits of the prediction of soybean volume (Tables 4 and 5), which illustrates the higher accuracy of percent groundcover prediction estimates. The collection of percent groundcover data using an unmanned aerial vehicle also reduced the time needed to gather accurate assessments of soybean canopy formation.
Soybean Yield
Soybean yield loss from early season injury caused by herbicides was not found in this research. Lack of an impact on soybean yield was expected as crop injury from herbicides when applied according to the label should not cause yield loss (Kapusta et al. Reference Kapusta, Jackson and Mason1986).
Conclusions and Practical Implications
Soybean injury caused by PPO-inhibiting and ALS-inhibiting herbicides alone and in combination with glufosinate can result in a delay in soybean canopy formation. The herbicides fomesafen, acifluorfen, S-metolachlor + fomesafen, and S-metolachlor + fomesafen + chlorimuron delayed soybean from reaching 80% groundcover by at least 4 d. The addition of glufosinate to the herbicide applications often resulted in longer delays in canopy formation. Glufosinate + S-metolachlor + fomesafen + chlorimuron delayed soybean from reaching 80% groundcover by 9 d, which would likely increase the need for a subsequent POST herbicide application, especially in fields where PPO- and ALS-resistant Palmer amaranth are present. In fields heavily infested with PPO- and ALS-resistant Palmer amaranth, an option that may be less injurious to soybean is use of S-metolachlor or other chloroacetamide herbicides with glufosinate, albeit these combinations were not evaluated in this research.
Although the herbicide treatments tested displayed no impacts on yield, other economic factors were influenced. Palmer amaranth, one of the most troublesome weeds in the United States, has the ability to emerge throughout the growing season, requiring sequential herbicide applications for season-long control in southern U.S. soybean production (Norsworthy et al. Reference Norsworthy, Ward, Shaw, Llewellyn, Nichols, Webster, Bradley, Frisvold, Powles, Burgos, Witt and Barrett2012). Soybean canopy formation reduces Palmer amaranth emergence (Jha and Norsworthy Reference Jha and Norsworthy2009). Therefore, when herbicides cause soybean injury and delay canopy formation, a larger proportion of weeds have the ability to emerge over the course of a growing season. As weed emergence increases, there is greater selection on foliar active and residual herbicides, possibly increasing the number of applications needed for season-long control. A delay in soybean canopy formation increases selection for herbicide resistance with the succeeding application. Additionally, soybean injury sustained by prior herbicide applications may increase cost of herbicide programs because of increases in the critical weed-free period (Nelson and Renner Reference Nelson and Renner2001).
Acknowledgments
Funding for this research was provided by the Arkansas Soybean Promotion Board. No conflicts of interest have been declared.


 Open access