


Before refrigeration, preserving food over long periods of time was challenging. Salting, or brining, meat was a common means of food preservation, and evidence for salt mining, production, or use extends to at least the Late Neolithic or Chalcolithic in Eurasia (Harding Reference Harding2013). Salted meat was particularly important for provisioning long sea voyages and military campaigns (Adelberg Reference Adelberg2013; Bowman Reference Bowman1969; Parker Reference Parker1970; Simmons Reference Simmons2011; Tokar Reference Tokar1999). Unfortunately, identifying salted meat in the archaeological record is challenging. However, the relative frequencies of animal body parts identified in an archaeofaunal assemblage may help identify this practice in the past, which is the idea evaluated here. Those producing barrels of salted meat must decide which portions of the animal to include and how to pack these into barrels. As a result, they selectively alter the frequencies of body parts within barrels, possibly producing archaeologically detectable signatures in relative body-part frequencies. Although the placement, orientation, and type of cut marks may also reflect butchery decisions, cooking and consumption can mask these signatures (Tourigny Reference Tourigny2017).
English (Reference English1990), Barrett (Reference Barrett1997), and Tourigny (Reference Tourigny2017) proposed that deviations in the frequencies of body parts may be used to identify salted cod, beef, and pork, although Reitz (Reference Reitz1986) and West (Reference West1995) suggest that most bones would have been removed from salted beef and pork prior to the development of techniques for forcing brine into the meat. Welker and Quintana Morales (Reference Welker and Quintana Morales2022) have demonstrated that most or all skeletal elements were removed from at least some salted cod, rendering it largely undetectable at trade destinations. However, bones recovered from barrels of salted meat from the sixteenth-century Mary Rose (Coy et al. Reference Coy, Jennie, Hamilton-Dyer, Oxley, Gardiner and Allen2005), the eighteenth-century William Salthouse (English Reference English1990), and the nineteenth-century Heroine (Brophy and Crisman Reference Brophy and Crisman2013) demonstrate that salted beef and pork commonly contained bones and may therefore be detectable in the archaeological record.
Using body-part frequency data drawn from military forts, fur trade posts, and shipwrecks in the Americas and abroad, we evaluate the visibility of salted meat in the archaeological record. European armies operating in the Americas faced several challenges when seeking to reliably provision their soldiers. First, conflict frequently took place along frontiers far from developed farmland and sources of domestic livestock. Second, in many cases armies operated in regions lacking reliable road systems. Third, the materials needed to produce and transport commonly used provisions, including barrel staves, salt, livestock, and carts, were often not available in sufficient quantities (Adelberg Reference Adelberg2013; Bowman Reference Bowman1969). Although significant efforts were made to encourage self-sufficiency, with efforts to establish and maintain herds at forts in Spanish presidios in California and the Southwest being the most successful (Welker and Mathwich Reference Welker and Mathwich2023), salted meat reportedly remained a significant component of military and civilian diets in the Americas (Adelberg Reference Adelberg2013; Betts Reference Betts2000; Bowman Reference Bowman1969; Parker Reference Parker1970; Tokar Reference Tokar1999; Tourigny Reference Tourigny2017).
Background
Although it is not clear when salt was first used as a preservative, many societies developed methods such as salting, pickling, fermenting, smoking, or drying to accumulate, store, and distribute foods that had short shelf-lives in the absence of canning and refrigeration (Saberi Reference Saberi2011; Tsai et al. Reference Tsai, Anderson, Kotzur, Davila, McQuitty and Nelson2022). Salting was an effective means of preserving meat that was preferred by European militaries because it accomplished several objectives, including (1) the accumulation of relatively large quantities of meat, (2) the retention and selective transport of higher-utility carcass portions by armies, (3) the extended shelf-life of meat stores, and (4) size, weight, and shape standardization of transported meat.
Cattle and pigs were staples for European militaries because these livestock could be reliably accumulated in large quantities (Anderson Reference Anderson2007; Crowdy Reference Crowdy2012; Elting Reference Elting2009; Kennett Reference Kennett1967; Knox Reference Knox1769; Sullivan Reference Sullivan and Boyle1997; Williamson Reference Williamson1795). Both fresh and salted beef and pork were acquired and delivered by either army officers or private contractors for this purpose (Parker Reference Parker1970; Tokar Reference Tokar1999). The British Navy’s method for producing salt beef or pork is well documented and involved butchering animal carcasses into 4 lb beef and 2 lb pork pieces. These were covered in dry salt for a day to absorb some of the moisture. Pieces were then layered into barrels with dry salt between each layer, and barrels were topped up with brine to fill air pockets (Tsai et al. Reference Tsai, Anderson, Kotzur, Davila, McQuitty and Nelson2022). Salting pork or beef required as much as one pound of salt per pound of meat (Heidenreich and Heidenreich Reference Heidenreich and Heidenreich2002). Bay salt produced by evaporating salt water from salt marshes in the Bay of Bourgneuf, France, was preferred until the late 1500s, even though cheaper English sources existed. Even after this, the British Navy’s victualling yard continued mixing bay salt alongside white salt produced in England (Bridbury Reference Bridbury1955). The British Navy’s Victualling Board, which managed the production of salt beef and pork for the navy, purchased between 2.3 and 3.5 million pounds of white and bay salt and brine a year between 1757 and 1762 (Buchet Reference Buchet2013). Private contractors provided salt beef and pork for the British Army in several grades based on the quality of meat and the cuts contained in barrels (Parker Reference Parker1970; Tokar Reference Tokar1999). The highest-quality barrels of meat contained shoulders and sides, whereas middle grades could contain shoulders, sides, shanks, and heads (Dawson Reference Dawson1911:360; DeBow Reference DeBow1854; Mescher Reference Mescher2005; Skaggs Reference Skaggs1986; Wilson and Southwood Reference Wilson and Southwood1976). The lowest-grade barrels were packed with low-quality pigs, and descriptions suggest they could include any sellable cuts of pork (DeBow Reference DeBow1854:1:377; Hilliard Reference Hilliard1972:58; Mescher Reference Mescher2005; Skaggs Reference Skaggs1986:40; Wilson and Southwood Reference Wilson and Southwood1976). Military contracts generally called for mid-quality meat. Descriptions of British naval procedures for barreling indicate that every hundredweight of beef was cut into 26 four-pound pieces, and every hundredweight of pork was to be cut into 52 two-pound pieces. Furthermore, no barrel was to contain any “shins of oxen, cheeks of hogs, or ox hearts” (Yagi Reference Yagi2011).
Although body-part frequency may vary from barrel to barrel and by barrel quality (see Brophy and Crisman Reference Brophy and Crisman2013; Coy et al. Reference Coy, Jennie, Hamilton-Dyer, Oxley, Gardiner and Allen2005; Hattori and Kosta Reference Hattori, Kosta, Pastron and Hattori1990; Tourigny Reference Tourigny2017), historical descriptions of butchery for barreled meat production reveal some patterns. When producing barrels, contractors selectively removed bones associated with low quantities of meat. This process corresponds relatively well with expectations from Binford’s (Reference Binford1978) general utility index, subsequent work by Metcalfe and Jones (Reference Metcalfe and Jones1988), and utility indices adapted to cattle and pigs in historical contexts (Trusler Reference Trusler2017a, Reference Trusler2017b). This pattern also aligns with O’Connell and colleagues’ (Reference O’Connell, Hawkes and Jones1988) and Yellen’s (Reference Yellen1977) observations of Hadza hunters stripping meat from marrow bones when making transport decisions. Furthermore, Hadza transport decisions varied depending on the weight of the animal in question, with relatively more body parts being transported from smaller, lighter animals than heavier ones.
From this perspective, several expectations may be made. Because pigs are smaller and lighter, they may require less intensive processing for barreling. Although pig snouts including the premaxillae and teeth were reportedly often removed (Tourigny Reference Tourigny2017), pork barrels from the Heroine and Mary Rose reveal different profiles in body-part frequency. Intact barrels of salt pork recovered from the steamship Heroine, which sank while delivering military provisions, contain heads, sides, shoulders, and some shank (elbow-wrist or knee-ankle) elements (Brophy and Crisman Reference Brophy and Crisman2013). Barrels recovered from the Mary Rose do not contain shank or cranial bones and appear to be from higher-grade barrels of pork than were typical for provisioning purposes (Coy et al. Reference Coy, Jennie, Hamilton-Dyer, Oxley, Gardiner and Allen2005). Bones associated with mid-quality pork barrel lids from the Hoff Store in California also appear to bear out the expectation that phalanges, carpals, and tarsals occur in barrels of low- to mid-quality pork (Hattori and Kosta Reference Hattori, Kosta, Pastron and Hattori1990).
Because cattle are larger and heavier than pigs, more intensive processing and more standardization in meat storage might be expected. Faunal material from shipwrecks including the William Salthouse (English Reference English1990) and the Sydney Cove wreck (Jon Addison, personal communication 2023) and from whaling stations (Lawrence and Tucker Reference Lawrence and Tucker2002; van Wijngaarden-Bakker Reference van Wijngaarden-Bakker, Grigson and Clutton-Brock1984) in the South Pacific included no cranial or foot bones or are entirely devoid of long bones. Similarly, Klippel (Reference Klippel2001) reports that 90% of cattle remains from Brimstone Hill, St. Kitts, are high-utility bones from the axial skeleton and meaty portions of the fore and hind limb. Further, isotopic analysis of Brimstone Hill cattle suggests that at least some were raised in northern latitudes far from the Caribbean and were imported, possibly as barreled meat (Klippel Reference Klippel2001).
Military Provisioning in the Americas
European armies traditionally lived off the land in the agricultural environments of Europe. This was impractical in North America where many military units were forced to operate along sparsely settled frontiers with reduced access to traditional supplies (Bannerman Reference Bannerman2015; Johnston Reference Johnston2001; Parker Reference Parker1970; Tokar Reference Tokar1999; Welker and Mathwich Reference Welker and Mathwich2023; Welker et al. Reference Welker, Billings, Burns and McClure2018). Although historical records support the use of cattle and pigs as the primary protein sources for soldiers in European militaries, they describe soldiers’ diets in optimal circumstances. Field conditions were rarely optimal, however, and garrisons regularly reported shortfalls (Bannerman Reference Bannerman2015; Johnston Reference Johnston2001; Parker Reference Parker1970; Tokar Reference Tokar1999). Compounding the lack of developed infrastructure, widespread dependence on Caribbean salt until the late 1700s resulted in shortages (Adelberg Reference Adelberg2013; Bowman Reference Bowman1969). Localized shortages of cattle and pigs, salt and barrels for meat preservation, and carts for transport, as well as a lack of navigable roads and rivers along which supplies could be transported, presented challenges for military officers charged with distributing supplies to soldiers (Breitburg Reference Breitburg1983; Wainwright Reference Wainwright1959).
In response to North American conditions, many Euro-American garrisons sought to develop infrastructure or local sources for supplies. Some maintained gardens and brewed spruce beer to prevent scurvy and malnutrition (Coe Reference Coe2006; Kopperman Reference Kopperman and Geoffrey2007), although these measures were not always successful (Fonzo et al. Reference Fonzo, Scott and Duffy2019; Scott et al. Reference Scott, Danforth, MacInnes, Hughes, Fonzo, Tracy and Sharon2019). Despite the potential benefits of salted barreled meat as a storable surplus, historical sources suggest that attempts to establish herds of cattle at or near forts were relatively common in the Americas. The Spanish quickly established herds of cattle, sheep, and goats on the open grasslands of the American Southwest and southern Plains (Mathwich Reference Mathwich2022; Welker and Mathwich Reference Welker and Mathwich2023). The urban fortress of Louisbourg, which served as the capital of France’s Île Royale province and the base for France’s cod fishing fleet after the loss of Newfoundland to the English in the early 1700s (Crowley Reference Crowley1990), hosted one of North America’s largest standing garrisons. Even though provisions, including cattle, were imported to Louisbourg (Kennedy Reference Kennedy2014) and were paid for through income generated from the cod trade (Kennedy Reference Kennedy2014; Moore Reference Moore1977, Reference Moore1979; Welker and Quintana Morales Reference Welker and Quintana Morales2022), cattle and pigs were also raised at Louisbourg (Donovan Reference Donovan2006). During the French and Indian War, the British general John Forbes used pack horses in place of wagons to transport food stuffs across Pennsylvania and relied on cattle herded to sites for on-site slaughter and smoking to overcome the lack of suitable roads and the shortages in salt, barrels, and wagons (Forbes Reference Forbes and James1938a [1758], Reference Forbes and James1938b [1758], Reference Forbes and James1938c [1758]).
These sources reveal several aspects of military provisioning. Fresh meat was preferred in many cases. This pattern is particularly well documented for cattle, which could be herded to sites and slaughtered. The predominance of cattle at North American fortifications on road systems and waterways, but away from cities (Welker and Mathwich Reference Welker and Mathwich2023; Welker et al. Reference Welker, Billings, Burns and McClure2018), suggests that the ability to herd cattle was a key feature of cattle as a meat source. This conclusion may be supported by Simmons (Reference Simmons2011), who identifies a shift from barreled meat to live cattle when the British Army left forts for field campaigns in New Zealand. Less is known about the use of pigs, although they were reportedly kept at Fort Stanwix until shortages forced the garrison to slaughter its livestock (Peter Gansevoort, Letter to Mag. Gen. Horatio Gates, December 1777, Military papers, Manuscripts and Archives Division, New York Public Library, MssCol 23873). In North American fortifications, pig remains are most common in assemblages from forts in urban settings (Welker and Hughes Reference Welker and Hughes2025; Welker and Mathwich Reference Welker and Mathwich2023; Welker et al. Reference Welker, Hughes and McClure2022). Pigs were commonly raised by households in colonial cities (Donovan Reference Donovan2006; Reitz and Zierden Reference Reitz and Zierden2023), which could have provided sources of fresh pork for urban garrisons. At Fort Loudoun, Tennessee, pigs were purchased from the Cherokee and comprised the second-most abundant species in the faunal assemblage (Parmalee Reference Parmalee1960).
Materials and Methods
To investigate whether barreled meat can be identified in archaeological assemblages, body-part frequency data for cattle, pigs, and ovicaprids were obtained from 21 of the forts studied by Welker and Mathwich (Reference Welker and Mathwich2023) to explore military provisioning practices. Additional data were drawn from Brimstone Hill (Bennett Reference Bennett2015), Fort Mims (Waselkov et al. Reference Waselkov, Gums and Parker2006), Valley Forge (Campana and Crabtree Reference Campana, Crabtree and Maltby2006), and Fort Ruby (Hall Reference Hall2014). We also included data from Fort Victoria, a fur trade post. The Fort Victoria skeletal profiles more likely reflect local butchery than provisioning, but in the absence of confident evidence supporting the local butchery of cattle and pigs, we treat these data as arising from an unknown method of butchery. Data from six shipwrecks were compiled to provide examples of body-part frequency in known or suspected, barrels. The Mary Rose was excluded from this model because body-part representation suggests a significant dissimilarity in butchery tradition or the quality of its barrels relative to other shipwrecks. Finally, data on moose, bison, and beaver from fur trade sites, deer from forts (both military and fur trade), and sheep/goat from military forts were drawn on as examples of likely on-site/local butchery. The final dataset includes data from 42 archaeological components: 26 components from 26 military forts, eight from seven fur trade posts, and eight from six shipwrecks (Table 1; Figure 1; Supplementary Material 1). Three of these military forts—Wellington, Montgomery, and Brimstone Hill—each have multiple contexts with separate archaeofaunal assemblages. We assumed that these separate assemblages were generated from a shared butchery context at each site (i.e., all assemblages within each site resulted either from salted meat or local butchery) and so aggregated the data for these assemblages within each site.
Locations of sites included in the study. Numbers reference site names detailed in Supplementary Material 1. Site types include military forts (red), ships (blue), and fur trade sites (yellow). (Color online)

MNE by Taxa for Each Site Used in This Analysis.

We then organized body-part frequency data into element groupings: head (crania and mandibles, excluding loose teeth), axial (vertebrae, ribs, and pelvis), forequarter (scapula, humerus, radius, and ulna), hindquarter (femur, tibia, and fibula), and foot (carpals/tarsals, metapodials, and phalanges). For each archaeological component, the groupings in our dataset consist of the sum of the minimum number of elements (MNE; sensu Lyman Reference Lyman1994:102) values for those elements within the grouping. Moose and bison were selected as examples of wild artiodactyls that were likely locally butchered and have similar body size and anatomy to cattle. Deer and sheep/goat were used as examples of likely local butchery of ungulates with body sizes more comparable to pigs. Similarly, beaver, widely reported from fur trade sites, are one of the few non-ungulates for which body-part data were available and have foot arrangements that are somewhat more consistent with pigs. For analysis, we retained only those assemblages with at least 10 total body parts summed across all five groupings. This includes cases where one to four groupings contain zero parts, but the remaining groups contain at least 10 total parts.
A key challenge in evaluating whether cattle and pig body-part profiles from forts more closely resemble those from either barreling or local butchery is establishing what body-part profiles should be expected from these practices. Here, we use profiles from ships and suspected cases of local butchery at forts to model the average profile and the distribution of profiles across archaeological components expected for each practice. Cattle and pig remains from many ships included in this analysis were recovered from barrels, whereas other shipwreck contexts are assumed to represent barreling. Moose, bison, deer, sheep/goat, and beaver assemblages from forts are assumed to reflect local butchery.
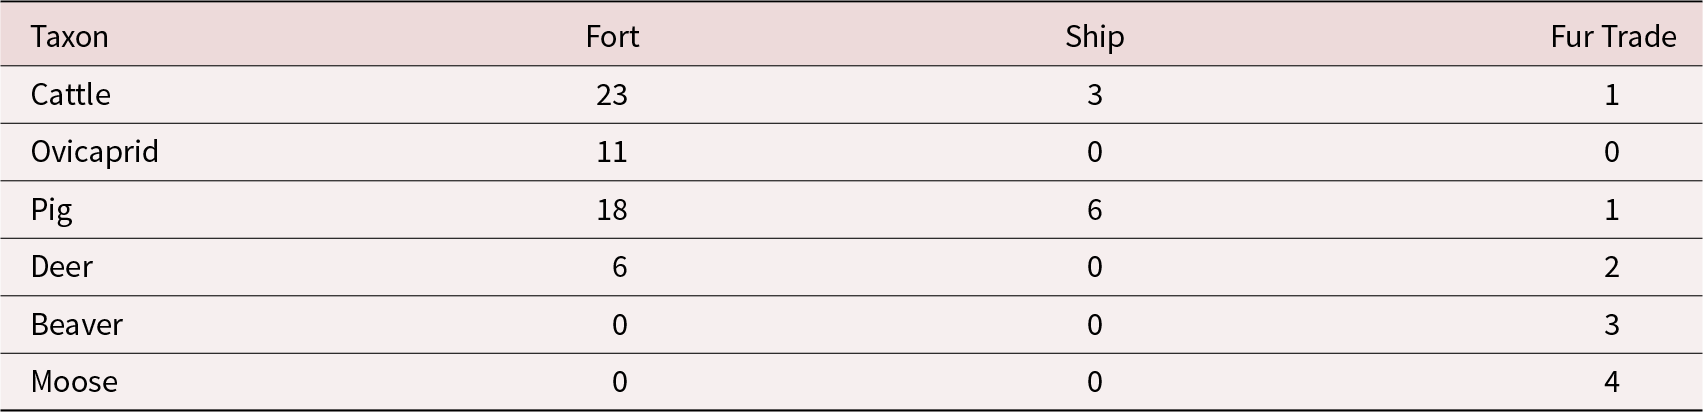
In our statistical analysis, we treat the archaeological samples as having been drawn from underlying body-part profiles specific to each taxon within each archaeological component. For assemblages assumed to reflect either barreling or local butchery, these profiles were modeled using hierarchical multinomial regression (Cressie et al. Reference Cressie, Calder, Clark, Ver Hoef and Wikle2009; Raudenbush and Bryk Reference Raudenbush and Bryk1986), a detailed treatment of which is presented in Supplementary Material 2. This regression provides estimates of both the global average body-part profile and component-scale variability around that average for a given pairing of taxon and site type, thereby inferring a distribution of body-part profiles. We fit the hierarchical model separately to the sample profiles for cattle from ships (barreled meat), combined moose and bison from fur trade forts (local butchery), pigs from ships (barreled meat), sheep/goat from military forts (local butchery), deer from military and fur trade forts (local butchery), and beaver from fur trade forts (local butchery). Sample sizes vary from three to 11 components between taxon-site type pairings (Table 2). The uncertainty surrounding statistical estimates of each body part profile distribution is therefore expected to vary widely between these pairings.
Sample Size by Taxon for Each Site Type Used in This Analysis.

Data organization and plotting were completed in R 4.3.1 (R Core Team 2023). Models were fitted using Bayesian inference with informative prior distributions using Hamiltonian Monte Carlo simulation in the Stan language (Stan Development Team 2024a). Standard model convergence diagnostics were checked to ensure reliable model fits, including R-hat values, effective sample sizes, and visual inspection of trace plots. Data analysis used the R packages RStan (Stan Development Team 2024b), HDInterval (Meredith and Kruschke Reference Meredith and Kruschke2022), MASS (Venables and Ripley Reference Venables and Ripley2002), and parallel (R Core Team 2023). Plotting relied on the R packages ggplot2 (Wickham Reference Wickham2016), patchwork (Pedersen Reference Pedersen2022), and bde (Santafe et al. Reference Santafe, Calvo, Perez and Lozano2022). The R and Stan codes used for analysis and plotting are included as Supplementary Materials 3 and 4.
The final step was to assess butchery practices for the cattle and pig sample fort profiles using the fitted models. To do so, we first calculated log-likelihoods for each sample cow fort profile using the cattle ship and moose/bison fur trade models (Supplementary Material 5). Next, we calculated log-likelihoods for the sample pig fort profiles using the pig ship model, sheep/goat military fort model, deer fort model, and beaver fur trade site model. Log-likelihood ratios (LLRs) were used to assess which model better predicts each sample profile (further detailed in Supplementary Materials 2 and 3).
Results
Modeled Barreling Profiles
Barreling body-part profiles for cattle display a distinct pattern, visible as dominance of the axial skeleton and few heads and feet (Figure 2). The axial skeleton has a proportional representation of 0.799 for the global average cattle ship profile, although this value is characterized by high uncertainty (95% highest posterior density interval [HPDI]: 0.440–0.967). The remaining body parts are present in proportions below 0.100; however, statistical uncertainty allows for the possibility that either forequarters or hindquarters are present in proportions exceeding 0.260 in the global average profile. More likely, however, these body parts comprise only 0.079–0.087 of the global average profile. Relative to the proportions expected in a complete animal, only the axial skeleton appears overrepresented, although the 95% HPDI interval still overlaps with the expected proportional representation. Feet in the global average profile are underrepresented. Although forequarters and hindquarters may be overrepresented, statistical uncertainty allows for the possibility that they are represented in proportions that mirror those of a complete animal on average. The average profile may not closely resemble individual cases of barreling, however. Despite dominance of the axial skeleton in the average profile, the 95% prediction interval for individual components spans a wide range of proportions (0.141–0.995), although most predicted profiles have proportions exceeding 0.5. Heads and feet are the most proportionally constrained body parts between individual component profiles, with 95% prediction intervals of 0.002–0.069 and <0.001–0.145, respectively.
Hierarchical model posterior inferences for cattle profiles from ships. Black dots and segments show posterior means and 95% HPDI ranges for the global average profile. Gray densities display predictive distributions for proportions across individual components. Vertical gray segments show an idealized profile in which skeletal elements in each body part group are present in proportion to their representation in a complete animal. Black numeric text shows posterior means (and 95% HPDI ranges) for each body part. FQ = forequarters and HQ = hindquarters. The cattle silhouette was obtained through the rphylopic R package (Gearty and Jones Reference Gearty and Jones2023; contributed by Steven Traver).

Unlike cattle, the global average barreling profile for pigs is more evenly distributed across body parts (Figure 3). In the average profile, only feet are clearly underrepresented relative to the proportions expected in a complete animal (mean 0.220, 95% HPDI: 0.050–0.418), whereas the head (mean 0.248, 95% HPDI: 0.146–0.344), forequarters (mean 0.123, 95% HPDI: 0.055–0.194), and hindquarters (mean 0.155, 95% HPDI: 0.047–0.275) are overrepresented. When considering intercomponent variability, only feet are expected to occasionally dominate skeletal profiles (95% prediction interval: <0.001–0.755). However, any body part may be present in very low proportions, with lower bounds for 95% prediction intervals spanning <0.001–0.013. The predicted occasional high representation of feet is driven by the inclusion of the Queen Anne’s Revenge assemblage in this dataset. Forequarters are characterized by the most constrained intercomponent variability, with a 95% prediction interval of <0.001–0.243.
Hierarchical model posterior inferences for pig profiles from ships. Black dots and segments show posterior means and 95% HPDI ranges for the global average profile. Gray densities display predictive distributions for proportions across individual components. Vertical gray segments show an idealized profile in which skeletal elements in each body part group are present in proportion to their representation in a complete animal. Black numeric text shows posterior means (and 95% HPDI ranges) for each body part. FQ = forequarter and HQ = hindquarter. The pig silhouette was obtained through the rphylopic R package (Gearty and Jones Reference Gearty and Jones2023; contributed by Steven Traver).

These modeled populations of body-part profiles suggest that cattle and pigs display divergent patterns in barreled meat contexts. Pig profiles are especially variable between sites, which means that matching a pig profile from a site with an unknown mode of butchery and transport to either barreling or local procurement could be challenging. In contrast, cattle from barreled meat contexts show a more regular body-part profile, especially in the representation of the axial skeleton relative to heads and feet. Inferred intercomponent variability in skeletal part profiles for both taxa is heavily influenced by statistical uncertainty, especially cattle, for which there are only three ship components with sample data. If additional components with sample data were added, the prediction intervals could shrink and reveal a more typical pattern shared between individual components. However, without more shipwrecks containing cattle remains, it is not possible to rule out high intercomponent variability in cattle barreling profiles.
Modeled Local Butchery Profiles
Local butchery body-part patterns are modeled based on moose and bison data from fur trade sites, sheep/goat data from military forts, deer data from combined fur trade and military forts, and beaver data from fur trade sites. The moose/bison global average profile differs in several ways from the cattle ship average profile. First, statistical uncertainty in the body-part proportions of the average profile for moose/bison overlaps between all body parts; this uncertainty also overlaps with the expected proportions of body parts in a complete animal for the axial skeleton and feet (Supplementary Material 6 [S2]). Heads (mean 0.069, 95% HPDI: 0.029–0.113), forequarters (mean 0.231, 95% HPDI: 0.072–0.391), and hindquarters (mean 0.213, 95% HPDI: 0.086–0.326) in the average profile are all overrepresented compared to their representation in a complete animal. Although the axial skeleton appears to be to have the highest proportion (mean 0.283, 95% HPDI: 0.069–0.529), like the cattle ship average profile, the remaining postcranial body parts have only slightly smaller modeled proportions. Although heads appear to be present at the lowest proportion in the average profile—a feature shared with the cow ship average profile—the uncertainty in this estimate still overlaps with the remaining parts. In terms of intercomponent variability, heads have a relatively narrow 95% prediction interval of <0.001–0.145. In contrast, the 95% prediction interval for the axial skeleton varies widely between <0.001–0.747. The remaining three body parts may be present in proportions at or below 0.001 or as high as 0.412–0.642. In all, there is high intercomponent variability for all body parts, except for heads in the case of moose/bison from fur trade sites.
The sheep/goat global average profile has a generally even distribution of body parts (Supplementary Material 6 [S3]). Heads (mean 0.208, 85% HPDI: 0.146–0.270), forequarters (mean 0.216, 95% HPDI: 0.168–0.347), and hindquarters (mean 0.177, 95% HPDI: 0.122–0.229) are more common than what would be expected from a complete animal. Feet (mean 0.226, 95% HPDI: 0.142–0.304) and the axial skeleton (mean 0.127, 95% HPDI 0.024–0.277) are less common. Like the previously discussed models, there is high intercomponent variability in body-part proportions. This is most pronounced for the axial skeleton, which has a 95% prediction interval of <0.001–0.800. Hindquarters have the narrowest intercomponent 95% prediction interval: 0.001–0.285.
The global average profile for deer from forts is also relatively evenly distributed across body parts (Supplementary Material 6 [S4]). Though heads are present at the lowest proportion (mean 0.145, 95% HPDI: 0.080–0.217), uncertainty in the posterior distribution comfortably overlaps uncertainties in the proportions for the remaining four body parts. Heads, forequarters (mean 0.280, 95% HPDI: 0.190–0.377), and hindquarters (mean 0.231, 95% HPDI: 0.125–0.335) are all present in proportions exceeding those in a complete animal for the average profile. Only feet (mean 0.180, 95% HPDI: 0.062–0.317) and the axial skeleton (mean 0.164, 95% HPDI: 0.041–0.308) are present at modeled proportions falling below what is expected in a complete animal for the average profile. Intercomponent variability is high for all body parts, with the lowest variation for heads (95% prediction interval: 0.005–0.324) and the highest for the axial skeleton (95% prediction interval: <0.001–0.642). This is very similar to intercomponent variability for sheep/goats from military forts, although the disparity between heads and the axial skeleton is greater for the 95% prediction intervals of the sheep/goat body part profile model.
The global average profile for beavers from fur trade sites is distinct from the average profile for either sheep/goat or deer (Supplementary Material 6 [S5]). Heads (mean 0.181, 95% HPDI: 0.117–0.228), forequarters (mean 0.252, 95% HPDI: 0.141–0.333), and hindquarters (mean 0.234, 95% HPDI 0.079–0.372) are proportionally overrepresented relative to a complete animal, whereas the axial skeleton (mean 0.077, 95% HPDI: 0.004–0.260) and feet (mean 0.256, 95% HPDI: 0.137–0.367) are underrepresented. There is statistical overlap between all five modeled body-part proportions in the global average profile. Feet, forequarters, and hindquarters all have strikingly similar proportional representation in the average profile. Heads have the lowest intercomponent variability (95% prediction interval: 0.045–0.257), whereas the axial skeleton has the highest variability (95% prediction interval: <0.001–0.561). This disparity in intercomponent variability between heads and the axial skeleton is similar to that modeled for sheep/goat and deer.
Assessing Cattle and Pig Butchery at Forts Using the Models
Sample profiles of cattle and pigs from forts with unknown butchery practices vary in a similar fashion to the high intercomponent variability of profiles for these taxa from ships (Figures 4 and 5). This high intercomponent variability also characterizes the taxa recovered from local butchery practices (Supplementary Material 6 [S6–S9]), as were modeled in the preceding section. This high variability creates overlap in component-scale profiles arising from different butchery practices, making it unlikely that an average barreling or local butchery profile will serve as a reliable reference against which to assess unknown butchery practices at forts. Rather, the likelihood of the unknown sample data from each fort arising from a given butchery practice must be assessed in light of the full distribution of modeled profile variability.
Cattle sample profile proportions for components from ships and forts (black “X” symbols). Blue dots and segments show posterior means and 95% HPDI ranges for each body part as estimated through the hierarchical model for ship data. Vertical gray segments show an idealized profile in which skeletal elements in each body part group are present in proportion to their representation in a complete animal. FQ = forequarter and HQ = hindquarter. The cattle silhouette was obtained through the rphylopic R package (Gearty and Jones Reference Gearty and Jones2023; contributed by Steven Traver). (Color online)

Pig sample profile proportions for components from ships and forts (black “X” symbols). Blue dots and segments show posterior means and 95% HPDI ranges for each body part as estimated through the hierarchical model for ship data. Vertical gray segments show an idealized profile in which skeletal elements in each body part group are present in proportion to their representation in a complete animal. FQ = forequarter and HQ = hindquarter. The pig silhouette was obtained through the rphylopic R package (Gearty and Jones Reference Gearty and Jones2023; contributed by Steven Traver). (Color online)

We calculate likelihoods for cattle and pig profiles from each fort, given the distribution of profiles inferred from each modeled butchery practice. We then use log-likelihood ratios (LLRs) to assess which butchery model is most likely to produce each sample dataset. The log ratios are unbounded, with positive values corresponding to a higher likelihood for the numerator model than the denominator model. A negative value corresponds to a higher likelihood for the denominator model. Given posterior uncertainty in the fitted models’ parameters, LLR values also contain uncertainty that spans positive and negative values. Here, we consider this uncertainty with respect to the proportion of the posterior LLR distribution that falls above or below zero. For example, if an LLR has a value of 5 and 0.98 of the posterior LLR distribution falls above zero, we treat this as a “support” value of 0.98 for a positive sign, indicating that the numerator model better predicts the data than the denominator model. If an LLR value of –36 has a posterior LLR distribution of which 0.76 falls below zero, then there is a support value of 0.76 for a negative sign, corresponding to the denominator model better predicting the data. A support value of 0.5 indicates equal likelihoods between each compared model, rendering ambiguous which performs better. Because LLR posterior distributions are unbounded, it is theoretically impossible for a support value to reach exactly 1.0, although values approaching 1.0 indicate larger likelihood differences between two models for a given dataset.
For cattle sample data from forts, the moose/bison model is universally associated with higher likelihoods than the cattle ship model (Figure 6). This is especially true for the single fur trade site, Fort Victoria, where the LLR value has a support value of 0.899 favoring the moose/bison model. For the military forts, LLR values for the moose/bison model have support values spanning 0.834–0.870.
Log-likelihood ratios (LLR) comparing the relative predictive power of the cattle ship (CS) and moose/bison fur trade (MBFT) models for the cattle sample profiles from forts. Values are means for each LLR posterior distribution. LLR values take the model in a given row as the numerator and the column model as the denominator, with positive values in green cells and negative values in purple cells. Support for a given LLR sign is expressed by cell color transparency. (Color online)

Results for pig sample data from forts are more variable between models (Figure 7). This variability is most apparent when comparing Fort Victoria to military forts. All three local butchery models (sheep/goat, deer, and beaver) better predict the Fort Victoria pig sample profile than does the pig ship model. Support for these local butchery models is strong, ranging from 0.934 for the deer model to 0.952 for the sheep/goat model. None of the local butchery models clearly outperforms the others for the Fort Victoria pigs, with LLR support values spanning 0.516–0.558.
Log-likelihood ratios (LLR) comparing the relative predictive power of the pig ship (PS), ovicaprid military fort (SGMF), deer military fort and fur trade (DMFFT), and beaver fur trade (BFT) models for the pig sample profiles from forts. Values are means for each LLR posterior distribution. LLR values take the model in a given row as the numerator and the column model as the denominator, with positive values in green cells and negative values in purple cells. Support for a given LLR sign is expressed by cell color transparency. (Color online)

For pig sample data from military forts, the sheep/goat and deer models performed best, though support for local butchery is not as clear as clear as it is for Fort Victoria. The beaver model underperformed all other models for the military fort sample pig data, with LLR support values of 0.881–0.916 favoring the deer model and of 0.878–0.932 favoring the sheep/goat model across components. Even the pig ship model outperformed the beaver model, with LLR support values of 0.788–0.834 favoring the pig ship model over the beaver model across components. However, the other two local butchery models performed better than the pig ship model, with LLR support values of 0.605–0.661 favoring the deer model and 0.623–0.693 favoring the sheep/goat model. Despite these models performing better than the pig ship model across all components, these support values are much lower than those that compared barreled meat to local butchery for cattle. The sheep/goat and deer models performed nearly identically for the sample pig profiles from military forts. The sheep/goat model performed marginally better than the deer model for 16 of 18 components, with LLR support values of only 0.507–0.551. The two components where the deer model outperformed the sheep/goat model have support values of only 0.507 and 0.510.
Discussion
Datasets drawn from multiple sites have great potential for identifying and testing patterns in zooarchaeological data, including those reflecting status and urbanization (Reitz Reference Reitz1986, Reference Reitz and Suzanne1987; Reitz and Zierden Reference Reitz and Zierden2023), accessibility and nationality (Welker and Mathwich Reference Welker and Mathwich2023; Welker et al. Reference Welker, Billings, Burns and McClure2018), and trade (Barrett Reference Barrett1997; Welker and Quintana Morales Reference Welker and Quintana Morales2022). Salted and barreled beef and pork accomplished four related objectives for military units: extending the shelf-life of meat; increasing the proportion of edible meat to inedible bone, enabling militaries to transport higher-quality meat products; and standardizing the size, shape, and weight of the units being transported. Barreling involves extensive carcass processing, resulting in substantial numbers of cut and chop marks on the skeleton; unfortunately, these marks may be obscured by subsequent processing associated with cooking and consumption (Tourigny Reference Tourigny2017) and taphonomic processes relating to deposition and recovery. Therefore, archaeologists seeking to analyze barreled meat have focused instead on body-part frequency data. In this study, we approached this question using faunal data from 26 military forts, six shipwrecks, and seven fur trade posts supported by historical descriptions of salt beef and pork and ethnographic observations of carcass transport. Inferences from our models largely confirm preceding research on carcass transport and on the identifiability of salted beef and pork: barreled beef is typically devoid of heads and feet, whereas pork is harder to identify.
Despite the observable differences between modeled butchery behaviors, overlapping intercomponent variability between each butchery practice renders it challenging to assess behavior in an unknown context. Undoubtedly, an unknown number of military forts in our sample must have been provisioned with some salted meat, although the cattle ship model was consistently outperformed by the moose/bison model. In part, this is simply because local butchery profiles vary far more between components, producing profiles that often fall within the narrower range of variability that characterizes barreled meat, with extreme overrepresentation of the axial skeleton and extreme underrepresentation of heads and feet. If a given fort’s beef consumption consisted primarily of barreled meat but it was also supplemented by a small amount of locally raised livestock, this minor contribution could be sufficient to render the barreled meat skeletal profile indistinguishable from a local butchery signal.
At first glance, sample cattle data from several components appear as though they should reflect barreled salted meat rather than local butchery, as at Forts Frederick and Ruby. Both assemblages have samples with high representation of the axial skeleton, which are seemingly consistent with barreled meat. However, close inspection reveals that even this high representation of the axial skeleton falls below that of the typical barreled meat context, and both sites also have higher representation of heads and feet than most barreled meat contexts. Given that local butchery can also lead to overrepresentation of the axial skeleton (as well as better representation of heads and feet), even these “best candidates” for barreled meat end up being better accommodated by the local butchery model. It may be that, although meat provisioning was often important, it was rarely the sole source of beef, with even minor local contributions rendering the provisioning profile unrecognizable.
It is interesting that even though local butchery best explains sample pig profiles from military forts, it is the fur trade fort, Fort Victoria, that has a profile that is best explained by all three local butchery models. This appears to lend strong support to the earlier stated argument that this fur trade post likely received no provisioned meat. In contrast, the military forts display a recurring pattern of weak support for local butchery from two models, whereas the third, based on beaver data, does a poor job predicting the sample profiles for these components. There may be a similar phenomenon to the one suggested earlier for cattle, where provisioning played a role at some sites but the signal is swamped by some local butchery.
Zooarchaeologists’ understanding of carcass transport variability has generally been more heavily informed by modern foragers than historical European and Euro-American records. Foragers who have to butcher and transport animal carcasses to villages apply selective decision-making processes influenced by the loads they are capable of transporting, the distance to be covered, the size of the animal to be transported, and the relative value of skeletal elements as a function of their associated meat, marrow, or both (O’Connell et al. Reference O’Connell, Hawkes and Jones1988, Reference O’Connell, Hawkes and Jones1990). Historical descriptions of barreling describe some similarities. Cattle, which are large and potentially more challenging to barrel, are consistently processed by removing crania and feet, which have low meat value. Because marrow preserved poorly in salt, beef marrow bones or portions of them were also often removed (Simmons Reference Simmons2011). Pigs, which are smaller, appear to have been less consistently processed, producing more variability in barrel contents, although some of this variability may also be explained by the different grades of pork produced for sale.
Relying solely on body-part frequencies when exploring whether meat could have been barreled introduces certain challenges, which are apparent when we assessed the fort sample data with the models. Variability may be introduced through butchery but may also emerge from taphonomic processes and during analysis. For example, teeth may separate from the mandible and maxilla or survive where bone does not, thereby reducing apparent head representation. Ribs and vertebrae occur in elevated frequencies in barreled meats but are highly susceptible to fragmentation and are morphologically similar between species. Zooarchaeological identifications are based on analysts’ experience and access to comparative collections or reference manuals, and they are subject to little or no quality control (Wolverton Reference Wolverton2013). These issues are particularly significant for analyses relying on body-part frequencies that, by necessity, assume datasets are comparable. In addition, other processes may deposit elements; for example, at least some of the remains at Fort George, which exhibits a body-part frequency pattern similar to that of shipwrecks, were reportedly delivered to the site by nearby butchers rather than in barrels (Betts Reference Betts2000). Despite these challenges, the low number of cranial and foot elements in barreled beef from shipwrecks and the near exclusion of cranial and appendicular elements from sites near Australia (e.g., Jon Addison, personal communication 2024; Lawrence and Tucker Reference Lawrence and Tucker2002; van Wijngaarden-Bakker Reference van Wijngaarden-Bakker, Grigson and Clutton-Brock1984) suggest that body-part frequency can be useful in identifying cases where salted beef may have been used.
Given the challenges in identifying salted and barreled meat, context is key to identifying archaeological examples (Simmons Reference Simmons2011). One of the primary benefits of salted meat is its extended shelf-life, which enabled large quantities of protein to be accumulated, stored, and dispensed. Although this feature is clearly a benefit in some situations, the time and resources needed to produce and transport salted meat may mean it is unsuitable for armies on the move, for soldiers operating in areas without reliable roads or navigable waterways, or for those without access to wagons, salt, or barrels. Simmons (Reference Simmons2011) asserts that the British Army operating in New Zealand relied heavily on salted beef and pork while at established military posts but made the transition to live cattle once it began operating in the field. General Forbes’s (Reference Forbes and James1938a [1758], Reference Forbes and James1938b [1758], Reference Forbes and James1938c [1758]) correspondence from his campaign to capture Fort Duquesne near present-day Pittsburgh in the 1750s documents a shift to live cattle because of poor road conditions and insufficient wagons, barrels, and salt. Thus, salted meat may be more likely in situations where soldiers are stationary and a storable surplus could be held in reserve.
Self-sufficiency was encouraged at fortifications in the Americas because of the challenges posed by delivering supplies. The Spanish presidios in the American Southwest and California were the most successful, as demonstrated by the fact that the abundance of domestic livestock in assemblages at these sites correlates positively with the length of site occupation (Welker and Mathwich Reference Welker and Mathwich2023). Fort gardens, spruce beer, and livestock herds seem to have been less successfully used at forts in the eastern United States and Canada. Cattle were driven to Fort Loudoun, Tennessee, to establish a herd at the site; however, pigs purchased from the local Cherokee remained a significant contributor to the soldiers’ diet. When relations with the local Cherokee deteriorated and they attempted to steal the cattle, the soldiers slaughtered and salted the cattle herd before ultimately abandoning the site (Parmalee Reference Parmalee1960).
Notably, taphonomy and context may also be important for interpreting faunal data from shipwrecks. Cattle body-part profiles in assemblages from ships appear to present the clearest patterns for barreling (Figure 2). This likely reflects the constraints of shipboard life. Although live animals are known to have been transported on ships, sometimes in great numbers, maintaining livestock on ships required transporting fodder and water for them as well. Livestock transported over long distances in ships also often had high mortality rates (Tokar Reference Tokar1999). The body-part profile from the HMS Boscawen, a British Navy sloop constructed on Lake Champlain in the fall of 1759 during the French and Indian War, diverges significantly from the pattern identified for barreled beef (Kochan and Crisman Reference Kochan and Crisman1987). Several factors could explain this difference. First, the HMS Boscawen was constrained to Lake Champlain and undertook relatively short voyages that provided frequent opportunities for replenishing stores. As a result, it may not have carried large quantities of provisions, and those that it did carry may not have been barreled. Second, the British drove the French from Lake Champlain soon after the Boscawen was constructed, and it was repurposed to ferry soldiers’ supplies and equipment north from Fort Ticonderoga and as officers’ quarters during the winter of 1759. These officers may have been provisioned with fresh rather than barreled meat. Finally, after the war ended in 1763 the HMS Boscawen was abandoned and had sunk by 1770 (Kochan and Crisman Reference Kochan and Crisman1987). This may mean that the faunal remains recovered from the Boscawen do not reflect active use as a naval vessel. It is for these reasons that we elected not to include its data in our cattle ship model.
Conclusion
Decisions affecting the selection of prey, butchery, transport, and storage of meat and animal remains have significant impacts on the development of the archaeological record. Archaeologists frequently seek to explain patterning in archaeological assemblages using ethnographic (O’Connell et al. Reference O’Connell, Hawkes and Jones1988, Reference O’Connell, Hawkes and Jones1990) and historical observations (Tourigny Reference Tourigny2017). Salting and barreling meat was a strategy that lies at the nexus of these four processes. Salt was used to extend the shelf-life of meat, and placing meat in barrels reduced cattle and pig carcasses to predictable, and easily transported, units that could be used to sustain individuals engaged in tasks other than producing their own food.
Historical records indicate that salted and barreled meat was frequently used to provision military garrisons operating in North America. In this analysis, we evaluated whether body-part frequency in cattle and pigs at military forts could be used to ascertain whether barreled meat was used in their provisioning. To accomplish this, we relied on faunal data from ships and on species that were typically butchered locally to develop expectations for body-part profiles. This analysis suggests that cattle may be more easily attributed to barreling or at least to off-site butchery than pigs. This finding likely reflects their larger size and the lower value of cattle heads and feet. Notably, pig body-part profiles were much more similar across butchery practices, and pig heads and feet were found in closed barrels recovered from shipwrecks, suggesting that body-part frequency may be less reliable as an indicator of salting and barreling for pig remains.
Further clarity on this issue may be achieved through the combination of body-part frequency and isotopic methods. Guiry and colleagues (Reference Guiry, Noël, Tourigny and Grimes2012, Reference Guiry, Noël and Fowler2021) used nitrogen isotopic values to differentiate local from nonlocal cattle and pigs from sites in Maritime Canada. Their approach may provide a useful investigative method for supporting or refuting body-part profiles from sites in this area. Furthermore, Dalle and coworkers (Reference Dalle, Snoeck, Sengeløv, Salesse, Hlad, Annaert and Boonants, et al2022) revealed that the marine salt used in preserving meat in Roman Gaul significantly affected strontium values in humans who subsisted on this meat. Application of this method to human remains or the analysis of the absorption of marine strontium by bones preserved in brine could provide alternative means of identifying salted meat at archaeological sites.
Acknowledgments
We would like to acknowledge Philip Armitage, Susan DeFrance, Chris Sabick, John Crock, Philip Migaud, Susan Lawrence, Jon Addison, and Eréndira Quintana Morales who shared either data or thoughts on butchery and barreling with us. Three anonymous reviewers gave thoughtful feedback that improved the article.
Funding Statement
No funding was received for conducting this study.
Data Availability Statement
All data used in this study are available in the Supplementary Material and may also be accessed through the University of Arizona Data Repository. The R and Stan code for this analysis are provided as supplementary files.
Competing Interests
The authors declare none.
Supplementary Material
The supplementary material for this article can be found at https://doi.org/10.1017/aaq.2024.86.
Supplementary Material 1. Skeletal part profile data for all sites in the study (table).
Supplementary Material 2. Detailed description of statistical methods and supplemental results figures (text).
Supplementary Material 3. R code for fitting the model and plotting results. The code requires and directly reads Supplementary Material 1, Supplementary Material 4, and Supplementary Material 5 (text).
Supplementary Material 4. Stan code for the skeletal part profile model (text).
Supplementary Material 5. Stan code to calculate log-likelihoods (text).


 Open access