


1. Introduction
When an elastic or elastically mounted bluff body is subjected to a fluid flow, it may react to the vortex shedding and experience a phenomenon typical of fluid–structure interaction: vortex-induced vibration (VIV). One of the most profound characteristics of VIV is synchronisation (or ‘lock-in’), where both the vortex shedding frequency and the body vibration frequency are locked and close to the natural frequency of the fluid–structure system (Williamson & Govardhan Reference Williamson and Govardhan2004; Païdoussis, Price & De Langre Reference Païdoussis, Price and De Langre2010). Generally, for cross-flow VIV of a circular cylinder with low mass and damping, the lock-in phenomenon occurs over a discrete finite range of reduced velocity. The lock-in starts from the beginning of an upper branch, when the vortex-shedding frequency locks onto the body vibration frequency of the system in quiescent fluid, and extends through a lower branch, where the body vibration as well as the locked frequencies remain consistent. For a cylinder with a mass ratio above some value, desynchronisation may eventually occur at higher reduced velocity (e.g. Khalak & Williamson Reference Khalak and Williamson1996; Williamson & Govardhan Reference Williamson and Govardhan2004). The reduced velocity is defined by  $U_r = U/({\,f_{nw}} D)$, where $U$ is the free-stream velocity, $D$ is the cylinder diameter and ${f_{nw}}$ is the natural frequency of the system in quiescent fluid. It has been well established that the mass ratio (denoted by $m^{*}$, as the ratio of the total oscillating mass to the mass displaced by fluid) is an important parameter affecting the lock-in region as well as the body vibration amplitude response (Williamson & Govardhan Reference Williamson and Govardhan2004; Han & de Langre Reference Han and de Langre2022). In a sequence of experiments, Govardhan & Williamson (Reference Govardhan and Williamson2000) predicted and confirmed the existence of a critical mass ratio $m^{*}_{c} = 0.54$, below which resonant large-amplitude oscillations occurred at an infinite $U_r$ for the Reynolds number range $4000 < Re < 22\,000$, where $Re = U D/\nu$, with $\nu$ being the kinematic viscosity of the fluid. This situation is referred to as ‘VIV resonance forever’ or briefly ‘VIV forever’. It should especially be noted that, in the experiments of Govardhan & Williamson (Reference Govardhan and Williamson2002), infinite reduced velocity ( $U^{\infty }_r$) is achieved by removing the physical restoring springs to realise $f_{nw} = 0$ and thus $U_r = \infty$. In the present study, we follow this concept first introduced by Govardhan & Williamson (Reference Govardhan and Williamson2002) to perform VIV experiments at infinite reduced velocity.
Moreover, it has been demonstrated by both experimental and numerical studies that the critical mass ratio for VIV forever is dependent on the Reynolds number. For example, a critical mass ratio of  $m^{*}_{c} = 0.25$ was found in a numerical study at $Re = 100$ of Shiels, Leonard & Roshko (Reference Shiels, Leonard and Roshko2001). Later, Ryan, Thompson & Hourigan (Reference Ryan, Thompson and Hourigan2005) showed the existence of $m^{*}_{c}$ in two low- $Re$ regions in numerical simulations: the value of $m^{*}_{c}$ decreased from approximately $0.5$ to $0.1$ for $40\leq Re \leq 95$, and it remained approximately at $0.1$ for $180\leq Re \leq 200$, while no critical mass ratio was observed for the $Re$ range in between these two regions. In their experimental study, Morse & Williamson (Reference Morse and Williamson2009) reported that $m^{*}_{c}$ increased with $Re$ in the range from $4000$ to $16\ 000$, and then remained almost constant at $m^{*}_{c}=0.54$ for $16\ 000 < Re < 30\, 000$. Recently, Navrose & Mittal (Reference Navrose and Mittal2017) investigated the effect of Reynolds number on the value of critical mass ratio. They confirmed the decreasing trend of $m^{*}_{c}$ with $Re$ increasing from $40$ to $95$ as reported by Ryan et al. (Reference Ryan, Thompson and Hourigan2005), and also showed that $m^{*}_{c}$ increased from approximately $0.1$ to $0.3$ as $Re$ was increased from $1000$ to $4000$, in line with the trend seen in the high- $Re$ regime in the experiments of Morse & Williamson (Reference Morse and Williamson2009).
On the other hand, the structural damping ratio is another parameter as important as the mass ratio and Reynolds number that can affect the characteristics of VIV such as the body vibration amplitude response and lock-in region. Generally, increasing the damping will reduce and even suppress the body vibration and the VIV lock-in region, as demonstrated by Blevins & Coughran (Reference Blevins and Coughran2009), Soti et al. (Reference Soti, Zhao, Thompson, Sheridan and Bhardwaj2018) and Zhao, Thompson & Hourigan (Reference Zhao, Thompson and Hourigan2022a). Research on the effect of structural damping on VIV is of great interest due to its implied influence on energy harvesting from VIV (see Soti et al. Reference Soti, Zhao, Thompson, Sheridan and Bhardwaj2018; Zhao et al. Reference Zhao, Thompson and Hourigan2022a).
Therefore, the following important open questions remain: (i) Will VIV be suppressed by high structural damping for a cylinder with a mass ratio below the critical value? (ii) Will the phenomenon of VIV forever disappear at high damping ratio? And, importantly, (iii) what is the mechanism underlying the phenomenon of VIV forever? Thus, in this study, by combining experiments and reduced-order modelling (ROM) in both nonlinear and linear forms, we aim to provide answers to the above questions. Indeed, VIV forever does persist even with high structural damping.
2. Methodologies
2.1. Experimental details
The fluid–structure system was modelled based on a low-friction air-bearing rig in conjunction with a free-surface recirculating water channel of the Fluids Laboratory for Aeronautical and Industrial Research (FLAIR) at Monash University. Figure 1 shows a schematic of VIV of a circular cylinder and a photograph of the experimental set-up.
(a) A schematic of the problem studied, with the key parameters illustrated: free-stream velocity  $U$, structural damping factor $c_s$, spring constant $k$ and wake oscillator variable $q(t)$. (b) A photograph of the experimental set-up.

The test cylinder used was made from a lightweight and rigid carbon fibre tube, and it was precision manufactured using a grinding machine to have an outer diameter of  $D = 71.34 \pm 0.01$ mm. The immersed length of the cylinder was $L=614$ mm. The total oscillating mass was $m_s = 1003.8$ g, and the displaced fluid mass by the cylinder was $m_{d} = 2450.3$ g, giving a mass ratio of $m^{*} = m_s/m_{d} = 0.41$. In addition, for a better understanding of VIV below the critical mass ratio ( $m^*_c \approx 0.54$), additional three mass ratios, $m^*=0.50$ (close to the critical value), $6.07$ and $25$ (well above the critical value), were also included for comparison. An eddy-current-based damping mechanism was employed to control the structural damping by adjusting the gap between a magnetic element and a copper plate via a micro-drive stage with a resolution of $0.01$ mm (see figure 1b). More details of this damper device can be found in the article of Soti et al. (Reference Soti, Zhao, Thompson, Sheridan and Bhardwaj2018). The structural damping ratio used in the present work is given by $\zeta = c_s/(2\sqrt {k (m_s + m_a )}) = \zeta _a f_{nw}/f_{na}$, where $m_a$ is the (potential-flow) added mass given by $m_a = (\,f_{na}^2/f_{nw}^2 - 1) m_s$, $\zeta _a \cong c_s/(2 \sqrt {k m_s})$ is the damping ratio measured from free-decay tests in air and $f_{na} = 0.377 \pm 0.01$ Hz and $f_{nw}=0.197\pm 0.01$ Hz are the natural frequencies measured in quiescent air and water, respectively. Accordingly, an added mass coefficient was given by $C_{M} = m^*(\,f_{na}^2/f_{nw}^2-1) \approx 1.05$ from the free-decay tests. The topic of added mass has been discussed by Lighthill (Reference Lighthill1986), Govardhan & Williamson (Reference Govardhan and Williamson2000), Limacher (Reference Limacher2021) and Zhao, Thompson & Hourigan (Reference Zhao, Thompson and Hourigan2022b).
In the present cases of  $m^* = 0.41$ with extension springs used, the VIV response was examined over a reduced velocity range of $3.0 \leq U_{r} \leq 15$; beyond this, an infinite $U_r$ was tested in the absence of springs. The turbulence level of the free stream was less than $1\,\%$. The corresponding Reynolds number range was $2870 \leq Re \leq 14\ 330$, with an uncertainty of $\pm 10$. The cylinder displacement was measured using a non-contact digital optical linear encoder (model RGH24; Renishaw, UK) that had a resolution of $1\ \mathrm {\mu }$m. For each reduced velocity, the measurement data were acquired at a sampling rate of 100 Hz for 300 s. More details of the experimental facility used can be found in the studies of Soti et al. (Reference Soti, Zhao, Thompson, Sheridan and Bhardwaj2018), Zhao, Hourigan & Thompson (Reference Zhao, Hourigan and Thompson2018) and Zhao et al. (Reference Zhao, Thompson and Hourigan2022a).
2.2. Reduced-order modelling
2.2.1. Model description
Along with the experiments, a numerical reduced-order model proposed by Facchinetti, de Langre & Biolley (Reference Facchinetti, de Langre and Biolley2004) was also adopted to investigate the VIV problem. As shown in figure 1(a), the dynamics of a circular cylinder undergoing cross-flow VIV is considered simply as that of a linear oscillator governed by
 \begin{equation} m\ddot{Y} + (c_s+c_{f})\dot{Y} + kY = F_{v}, \quad m = m_s + m_a,\end{equation}
where  $Y$ is the cylinder displacement, with the overdots representing time derivatives; and $m_{a}$, $c_{s}$ and $k$ represent the added mass, structural damping and stiffness, respectively. The added mass $m_{a}$ is given by $m_{a} = C_{M}\rho D^{2}{\rm \pi} /4$, where $\rho$ is the fluid density and $C_{M} = 1.05$ is obtained for the present experiments. It should be noted that the measurement of $C_A$ is $5\,\%$ above the theoretical value $C_A = 1$ (in potential flow), which has a negligible effect on both the experimental and ROM results. (The previous study of Zhao et al. (Reference Zhao, Thompson and Hourigan2022b) also showed that a $C_A$ value with $8\,\%$ above the theoretical value had a negligible effect on the fluid force decomposition for inline VIV of a circular cylinder.)
In the second term of (2.1),  $c_{f}$ represents the fluid-added damping, and it is given by $c_{f}=C_{D}/(2\rho U D)$ to describe the fluid loading, where $C_{D}$ represents the ‘amplified drag coefficient’ (Facchinetti et al. Reference Facchinetti, de Langre and Biolley2004), noting that, herein, $C_D$ is not the traditional drag coefficient (e.g. for flow past a fixed cylinder). The effect of fluid damping has been demonstrated in the recent study of Konstantinidis et al. (Reference Konstantinidis, Zhao, Leontini, Lo Jacono and Sheridan2020) showing that the drag acting in the direction opposite to the instantaneous relative velocity between the free-stream flow and the moving cylinder can induce a pure damping force (one that is $180^{\circ }$ out of phase with respect to the cylinder movement velocity). In fact, the amplified drag coefficient $C_D$ is a (nonlinear) function of the vibration characteristics and the traditional drag coefficient of flow over a fixed cylinder $C_{D0}$. However, for the sake of simplicity, it is often assumed to be constant (Facchinetti et al. Reference Facchinetti, de Langre and Biolley2004), typically $C_D \approx 2.0$ (e.g. Facchinetti et al. Reference Facchinetti, de Langre and Biolley2004; Violette, de Langre & Szydlowski Reference Violette, de Langre and Szydlowski2007; Grouthier et al. Reference Grouthier, Michelin, Modarres-Sadeghi and de Langre2013). In the present study, $C_D$ was set to be constant at 1.9. The forcing term in (2.1), namely the transverse lift due to the unsteady vortex shedding $F_{v}$, can be obtained by
 \begin{equation} F_{v}=\rho U^2D C_{L}^{v}/2 = \rho U^2Dq C_{L0}/4,\end{equation}
where  $C_{L}^{v}$ represents the unsteady vortex-induced lift coefficient of a vibrating cylinder, while $C_{L0}$ represents the magnitude of lift coefficient of the fixed cylinder and the parameter $q/2$, as the ratio of $C_{L}^{v}$ to $C_{L0}$, can be interpreted as a reduced vortex (or ‘fluctuating’) lift coefficient. A van der Pol nonlinear wake oscillator equation is introduced here to model the dimensionless wake variable $q$, coupled to the displacement $Y$
$Y$
 \begin{equation} \ddot{q}+\varepsilon\omega_f(q^2-1) \dot{q}+\omega_f^2q=(A/D)\ddot{Y},\end{equation}
where  $\omega _{f}$ is the vortex-shedding angular frequency defined as $\omega _{f}=2{\rm \pi} St U/D$, with $St$ being the Strouhal number for flow over a stationary cylinder. In (2.3), $\varepsilon =0.3$ and $A=12$ are constant coefficients derived from experimental correlations (see Facchinetti et al. Reference Facchinetti, de Langre and Biolley2004; de Langre Reference de Langre2006). We now introduce the dimensionless drag-related parameter $\gamma$, time $t$, amplitude $y$, mass ratio $m^*$, structural angular frequency $\omega _s$ and damping ratio $\zeta$, as follows:
 \begin{gather}
\gamma =\frac{C_{D}}{4{\rm \pi} St}, \quad t=T\omega_s, \quad
y=Y/D, \quad m^*=\frac{4m_s}{{\rm \pi}\rho D^2}, \quad
\omega_s=\sqrt{k/m},\notag\\ \zeta =\frac{c_s}{2 \sqrt{k
m}}=\frac{c_s}{2m\omega_s}.\end{gather}
\begin{gather}
\gamma =\frac{C_{D}}{4{\rm \pi} St}, \quad t=T\omega_s, \quad
y=Y/D, \quad m^*=\frac{4m_s}{{\rm \pi}\rho D^2}, \quad
\omega_s=\sqrt{k/m},\notag\\ \zeta =\frac{c_s}{2 \sqrt{k
m}}=\frac{c_s}{2m\omega_s}.\end{gather}
Substituting the dimensionless parameters into (2.1)–(2.3) yields coupled equations governing the displacement  $y(t)$ and the wake variable $q(t)$
 $$\begin{gather} \ddot{y} + \left(2\zeta+\frac{4\gamma U_{r}St}{{\rm \pi} m^{*}+{\rm \pi} C_{M}} \right) \dot{y} + y = \frac{U_{r}^{2}C_{L0}}{4{\rm \pi}^{3}(m^{*}+C_{M})} q, \end{gather}$$
 $$\begin{gather}\ddot{q}+\varepsilon U_{r}St (q^2-1)\dot{q}+ (U_{r}St)^{2}q = A\ddot{y}. \end{gather}$$
2.2.2. Validation
Numerically solving (2.5) and (2.6) with a second-order finite difference scheme in time subject to an initial perturbation to the cylinder displacement results in a limit cycle of  $y(t)$ and $q(t)$. The simplicity of this set of equations allows modelling of the dynamics for an extremely low computational cost, yet well reproducing the effect of varying parameter values on the system response (see Facchinetti et al. Reference Facchinetti, de Langre and Biolley2004; de Langre Reference de Langre2006; Grouthier et al. Reference Grouthier, Michelin, Modarres-Sadeghi and de Langre2013; Han & de Langre Reference Han and de Langre2022). An additional validation is presented here as the ROM is applied to VIV for mass ratios below and well above the critical value. Figure 2 shows the dimensionless amplitude response, $y_{10}$, for different mass ratios obtained from the present experiments and the ROM. Note that $y_{10}$ represents the mean of the top 10 % of the highest vibration amplitudes at each $U_r$. The model parameters for the ROM were set the same as for the experiments, except values for $St\approx 0.2$ and $C_{L0}\approx \sqrt {2}/2$ for flow over a fixed cylinder taken from Norberg (Reference Norberg2003) in the same $Re$ range as the present experiments. As can be seen in figure 2, the ROM results agree qualitatively and semi-quantitatively with the experiments, even though the mass ratio $m^*=0.41$ is well below the critical value ( $m^*_c \approx 0.54$). Additional comparisons with $m^{*}=0.50$, $6.07$ and $25$ are also included in figure 2, showing that the ROM can capture the approximate VIV magnitude and the extent of the resonant region for cases from close to $m^*_c$ to well above $m^*_c$.
A comparison of the dimensionless amplitude response  $y_{10}$ as a function of reduced velocity $U_r$ between the present experiments and ROM, with four mass ratios: $m^*=0.41$ (well below $m^*_c$), $0.50$ (close to $m^*_c$), as well as $6.07$ and $25$ (well above $m^*_c$). Note that the shaded areas represent the standard deviations of the experimental measurements of $y_{10}$.

Moreover, at an infinite reduced velocity  $U^{\infty }_r$ (i.e. by removing the restoring springs in experiments or by setting zero spring stiffness in the ROM), both experiments and ROM show substantially large vibration amplitudes for $m^*=0.41$ in figure 2, confirming that the occurrence of VIV forever in the present study, and that the ROM is an effective tool to investigate the problem of VIV forever.
We acknowledge that there are some discrepancies between the ROM predictions and experimental results, particularly in its failure to predict the lower branch for cases well above the critical mass ratio. This is mainly because the form of the proposed ROM, which is coupled only with the body acceleration  $\ddot {y}$ (see the right-hand term in (2.6)), cannot capture the classical upper–lower-branch transition in VIV (Facchinetti et al. Reference Facchinetti, de Langre and Biolley2004). Possibly, introducing an out-of-phase term (i.e. the velocity $\dot {y}$) coupled together with the acceleration (Han et al. Reference Han, Hémon, Pan and de Langre2021), or adding a frequency-dependent term (e.g. Ogink & Metrikine Reference Ogink and Metrikine2010) may improve the accuracy of ROM; however, this would make the ROM implementation become more complicated, noting that the focus of this study is modelling of the effect of structural damping on VIV forever. The discrepancies between the ROM and experimental results may also be improved by optimising the input coefficients used in our ROM. For instance, the lift coefficient $C_{L0}$ and the Strouhal number $St$ of flow over a stationary cylinder in (2.5) and (2.6) have been found to scatter over certain Reynolds number ranges, depending on the authors (see Moeller Reference Moeller1982; Szepessy & Bearman Reference Szepessy and Bearman1992; Norberg Reference Norberg2003). A sensitive analysis of the parameters $C_{L0}$ and $St$ on ROM has been reported recently by Han & de Langre (Reference Han and de Langre2022). However, note that a different set of input coefficients for ROM will not change the mechanisms for the VIV phenomenon. In summary, through comparisons with the present experiments, the low-cost simplified ROM can qualitatively and to some extent quantitatively predict VIV and importantly the VIV forever phenomenon, despite its failure to capture the VIV upper–lower-branch transition.
2.3. Linear stability analysis of the reduced-order model
On the basis of a nonlinear ROM, de Langre (Reference de Langre2006) developed a simplified linear stability analysis (LSA), which was successfully applied to predict the phenomenon of VIV forever for an undamped system (i.e. with zero damping). Inspired by this, we performed a similar LSA of the ROM (ROM-LSA) but including the structural damping to address the questions raised in § 1. In this ROM-LSA, eliminating all nonlinear terms in (2.5) and (2.6) gives
 $$\begin{gather} \ddot{y}+\left(2\zeta+\frac{4\gamma U_{r}St}{{\rm \pi} m^{*} +{\rm \pi} C_{M}} \right)\dot{y}+ y = \frac{U_{r}^{2}C_{L0}}{4{\rm \pi}^{3}(m^{*} + C_{M})} q, \end{gather}$$
 $$\begin{gather}\ddot{q}-\varepsilon U_{r}St \dot{q}+ (U_{r}St)^{2}q = A\ddot{y}. \end{gather}$$
Further, assuming exponential time dependence  $(y, q)=(y_{0}\, {\rm e}^{\lambda t}, q_{0}\, {\rm e}^{\lambda t})$ yields the frequency equation for the roots $\lambda$
 \begin{align} D(\lambda;R) &= \lambda^{4} + (R - \varepsilon U_{r}St) \lambda^{3} + ( U_{r}^2 St^{2} - AHU_{r}St - \varepsilon U_{r}St R + 1 )\lambda^{2}\nonumber\\ &\quad + ( U_{r}^2 St^{2}R - \varepsilon U_{r}St) \lambda+U_{r}^2 St^{2}, \end{align}
 \begin{align} R&=2\zeta + \frac{4\gamma U_{r}St}{{\rm \pi} m^{*}+{\rm \pi} C_{M}}, \quad H=\frac{C_{L0}}{4{\rm \pi}^{3}St^{2}(m^{*}+C_{M})}. \end{align}
Expanding the root  $\lambda$ about its undamped value to include the influence of damping represented by $R$, we can obtain $\lambda = \lambda _0 + R\lambda _R$. Here, $\lambda _0$ satisfies the frequency equation without the damping parameter $R$, i.e. $D(\lambda _0;0)=0$. Similarly, expanding (2.9) gives
 \begin{equation} D(\lambda_0+R\lambda_R;R)=D(\lambda_0;0)+R\lambda_R\left.\frac{\partial D}{\partial \lambda}\right|_{(\lambda_0;0)}+R\left.\frac{\partial D}{\partial R}\right|_{(\lambda_0;0)}=0. \end{equation}
After some elementary algebra, the effect of structural damping ratio  $\zeta$ on the root $\lambda$ can be obtained resulting in the following expression:
 \begin{align} \lambda = \lambda_0 - R\frac{\partial D/\partial R}{\partial D/\partial \lambda}=\lambda_0- \left(2\zeta+\frac{4\gamma U_{r}St}{{\rm \pi} m^{*}+{\rm \pi} C_{M}} \right) \frac{\lambda_0^4-\varepsilon U_rSt \lambda_0^3+(U_rSt)^2 \lambda_0^2}{2\lambda_0^4-3\varepsilon U_r St \lambda_0^3 - 2 (U_rSt)^2 - \varepsilon U_rSt\lambda_0}. \end{align}
Solving the above equations gives the solution for  $\lambda$, noting that its imaginary part, denoted by $\lambda _{i}$, is the angular frequency, while the ratio of its real part to its imaginary part yields the normalised growth rate, namely $G=\lambda _{r}/\lambda _{i}$. It should also be noted that there are two pairs of conjugate solutions, of which only the root with a positive imaginary part is of interest.
Following Han & de Langre (Reference Han and de Langre2022), for a given root, the ratio of the structural vibration amplitude  $y_{0}$ to the magnitude of the wake variable $q_{0}$ can be obtained from (2.7) and (2.8)
 \begin{align} \frac{y_{0}}{q_{0}} = \frac{\lambda^{2}-\lambda\varepsilon U_r St+U_r^2 St^2}{\lambda^{2} A} = \frac{U_{r}^{2}C_{L0}}{4{\rm \pi}^3(m^*+C_M)\left( \lambda^{2} + \lambda\left[2\zeta+\dfrac{4\gamma U_{r}St}{{\rm \pi} (m^{*} + C_{M})} \right]+1\right)}.\end{align}
By setting the numerator equal to zero, i.e.  $q_0 \gg y_0$, we can derive the root for the case where the cylinder is fixed ( $y \equiv 0$), corresponding to a pure wake mode (PW)
 \begin{equation} \lambda_{PW} = \dfrac{\varepsilon \pm \sqrt{\varepsilon^2-4}}{2} U_{r}St, \quad G_{PW} = \frac{\varepsilon}{\sqrt{4-\varepsilon^2}}. \end{equation}
The pure wake mode growth,  $G_{PW}$, will be used to identify the mode in the roots obtained from (2.9) and (2.12), where the dynamics is mainly in the wake variable $q$. Conversely, the pure solid mode is defined by setting the denominator in (2.13) equal to zero. More specifically, via (2.12), when the solved growth rate $G$ is close to the $G_{PW}$, it will be considered as a wake mode; on the other hand, if the mode shape is dominant in $y$, we label it as a solid mode (de Langre Reference de Langre2006; Violette, de Langre & Szydlowski Reference Violette, de Langre and Szydlowski2010; Grouthier et al. Reference Grouthier, Michelin, Modarres-Sadeghi and de Langre2013; Han & de Langre Reference Han and de Langre2022). The ROM-LSA will give two modes – each can be stable or unstable with two degrees of freedom. For the wake mode, we define that it is unstable when the mode growth rate is higher than $G_{PW}$, while for the solid mode it is unstable when the mode growth rate is positive, following Han & de Langre (Reference Han and de Langre2022).
3. Results and discussion
3.1. Effect of structural damping on VIV forever
In the present study, the phenomenon of VIV forever indeed persists across a wide range of structural damping ratios. This can clearly be seen from the normalised amplitude  $y_{10}$ at $m^*=0.41$ in figure 3. As shown in figure 3(a), the damping ratio range tested covers a wide range from $3.7\times 10^{-3}$ to $2.3\times 10^{-1}$, with the highest value more than 62 times of the lowest. Even with the highest damping ratio $\zeta = 2.3\times 10^{-1}$, at which VIV suppression could result for a cylinder with a mass ratio above the critical value (e.g. Soti et al. (Reference Soti, Zhao, Thompson, Sheridan and Bhardwaj2018), $m^* = 3.0$), the cylinder can still oscillate with large amplitudes of $\sim {O}(1D)$ at high reduced or even infinite reduced velocities. Here, we define the ‘large-amplitude’ region as the region where, for a given damping ratio, $y_{10}$ is higher than the half of the maximum value observed in the present study. It should be noted that for a cylinder with $m^*$ above its critical value, e.g. $m^{*} = 3.0$ in Soti et al. (Reference Soti, Zhao, Thompson, Sheridan and Bhardwaj2018), and $m^{*} = 21.8$ in Blevins & Coughran (Reference Blevins and Coughran2009), VIV forever does not exist and the large-amplitude region tends to shrink with increasing $\zeta$. It even leads to VIV suppression at a certain high damping ratio. Interestingly, the present result indicates that the effect of structural damping on VIV with a mass ratio under the critical value is distinctly different from the effect in those cases above the critical mass ratio.
(a) The normalised amplitude response ( $y_{10}$) as a function of reduced velocity ( $U_r$) for various damping ratios at $m^*=0.41$ in the present experiments. (b) The $y_{10}$ response as a function of $\zeta ^{\infty }$ at an infinite reduced velocity $U^{\infty }_r$ of the present experiments in comparison with the present ROM and the experiments of Govardhan & Williamson (Reference Govardhan and Williamson2002).

To further confirm the above finding, we experimentally and numerically tested the vibration response at an infinite reduced velocity, by removing the restoring springs but keeping the same structural damping factor ( $c_s$) settings as in figure 3(a). It should be noted that the structural damping ratio $\zeta$ is defined based on the natural frequency $\omega _s$ in (2.4); however, $\zeta$ will become infinite, when $\omega _s$ becomes zero in the absence of spring stiffness. To describe the damping effect in the absence of $\omega _s$, we refer to the parameter $\zeta ^{\infty } = c_s/(2m \omega _{f})$, which is based on the angular vortex-shedding frequency ( $\omega _{f}$) of a stationary cylinder (see Govardhan & Williamson Reference Govardhan and Williamson2002). For the infinite reduced velocity tested at $Re=13\ 500$ in the study, the resultant damping ratio range is $\zeta ^{\infty } = 1.2 \times 10^{-3}$– $8.0 \times 10^{-2}$ corresponding to its finite counterpart $\zeta = 3.7 \times 10^{-3}$– $2.3\times 10^{-1}$. For a VIV system in the absence of a ‘natural’ frequency (i.e. without restoring springs), one may consider using another dimensionless form of damping ratio that is based on the advective time scale: $c^* = c_s D/(m U)$ (see Leontini et al. Reference Leontini, Griffith, Lo Jacono and Sheridan2018). In figure 3(b), the corresponding range of $c^*$ is from $0.003$ to $0.210$.
As shown in figure 3(b), the phenomenon of VIV forever is confirmed by both the experimental and ROM results for  $m^* = 0.41$, which are in excellent agreement, evidenced by the consistent amplitude responses of $y_{10} \simeq 0.8$ through the $\zeta ^{\infty }$ range tested. The present results are also in excellent agreement with the experiments with $m^* = 0.45$ and $\zeta \approx 0$ by Govardhan & Williamson (Reference Govardhan and Williamson2002). Additional cases are also included to compare with the experimental and ROM cases at $m^* = 6.07$ and 25 well above $m^*_c$, where negligible vibration is observed. Nevertheless, these results clearly show that VIV forever persists for an underdamped cylinder (i.e. $\zeta < 1$) despite high damping ratio values.
To gain a better understanding of the damping effect on the VIV response of a cylinder at  $m^* = 0.4$ and $25$, a full nonlinear ROM based on (2.5) and (2.6) is adopted to evaluate the $y_{10}$ response for different damping ratios, while a ROM-LSA based on (2.9), (2.12) and (2.14a,b) is used to assess the normalised instability growth rate $G$. As shown in figure 4(a,c), the amplitude response for the case of $m^* = 25$ is consistent with previous studies, confirming that increasing $\zeta$ reduces the VIV response. As expected, at $U_r \approx 1/St \approx 5$, where VIV resonance generally occurs, the $G$ values of the wake mode clearly depart from the horizontal line of $G_{pw}$ that represents the pure wake mode for a fixed cylinder (see (2.14a,b)). This means that the wake mode becomes much more unstable than the pure wake $G_{pw}$. Note that the departure range of the wake mode growth rate from $G_{PW}$ is found to be $4 \lesssim U_r \lesssim 9.5$, which is consistent with the ROM in figure 4(a) and experiments in figure 2, where significant vibration occurs. Moreover, the growth rate of the solid mode is always negative, indicating that the cylinder vibration is induced only by the wake mode (see Han & de Langre Reference Han and de Langre2022). On the other hand, for the case of $m^* = 0.4$, the growth rate is always much greater than that of the pure wake after $U_r \gtrsim 1$, and tends to increase with increasing reduced velocity. This means that obvious structural vibration starts at a low $U_r$ value and it will persist in the tested $U_r$ range, due to the consistent unstable wake mode. Again, the above ROM-LSA results are consistent with the ROM results in figure 4(b) and the experiments at $m^*=0.41$ in figure 2. Thus, it can be concluded that the primary cause for VIV forever is the highly unstable wake mode. Note that $G$ increases linearly with a positive slope $K_W$ for $U_r > 1/St$, and this slope is found to be almost independent of $\zeta$. This is distinctly different from the case of $m^* = 25$, where the unstable wake mode occurs over a limited resonance region around $U_r \approx 1/St$. Since the ROM-LSA is a linear approximation, the slope $K_W$ may be used as a simple tool to assess the occurrence of VIV forever. However, it should be noted that the LSA itself cannot predict the limit cycle but, as has been shown, it can to some extent predict where and why limit cycles of oscillations occur.
Effect of  $\zeta$ on the $y_{10}$ amplitude response for (a) $m^* = 25$ and (b) $m^* = 0.4$ obtained by ROM, together with the variations of growth rate $G$ of the modes obtained by ROM-LSA, as a function of $U_r$. Note that in (c) and (d) the solid lines denote the results for low damping ratios, while the open circles denote the results for high damping ratios.

The effect of damping ratio on VIV forever can be further explained by deriving a relation of the vibration amplitude at  $U_{r}^{\infty }$ from the nonlinear ROM. We assume that the fluid–structure system is governed by (2.5) and (2.6) and that the cylinder vibration and the wake variable are $y(t)=y_0\cos (\omega t)$ and $q(t)=q_0\cos (\omega t + \phi )$, respectively, where $y_0$ is the cylinder vibration amplitude, $q_0$ is the magnitude of the wake variable, $\omega$ is the dimensionless angular vibration frequency and $\phi$ is the relative phase angle between the driving fluid force and the body displacement. Substituting them into (2.5) (i.e. the structural oscillator) yields
 $$\begin{gather} y_0 - y_0\omega^2 - \frac{U_r^2 C_{L0}}{4{\rm \pi}^3(m^*+C_{M})} q_0\cos\phi =0, \end{gather}$$
 $$\begin{gather}\frac{U_r^2 C_{L0}}{4{\rm \pi}^3(m^*+C_{M})} q_0\sin\phi - 2\omega y_0\zeta - \frac{4\gamma \omega U_rSt}{{\rm \pi} (m^*+ C_M)}y_0 = 0. \end{gather}$$
Hereby, we can obtain a relationship between  $y(t)$ and $q(t)$
 \begin{equation} y_0 = \frac{ U_r^2C_{L0}/ [4{\rm \pi}^3(m^*+C_{M}) ]}{ \left( (\omega^2-1)^2 + \left[ 2\zeta + \dfrac{4\gamma U_rSt}{{\rm \pi} (m^* + C_M)} \right]^2 \omega^2 \right)^{0.5}} q_0. \end{equation}
Similarly, by substituting  $y(t)=y_0\cos (\omega t)$ and $q(t)=q_0\cos (\omega t + \phi )$ into (2.6) (i.e. the wake oscillator), and considering only the main harmonic contribution in the nonlinear dynamics, we can obtain the following set of equations:
 $$\begin{gather} U_r^2St^2q_0 - \omega^2q_0 + A\omega^2y_0\cos\phi = 0, \end{gather}$$
 $$\begin{gather}\varepsilon U_r St\omega q_0 (1-\tfrac{1}{4}q_0^2) + A\omega^2y_0\sin\phi = 0. \end{gather}$$
Now, the magnitude of the wake variable can be computed by
 \begin{equation} q_0 = 2\left(1 + A\omega^2 \frac{\dfrac{U_r^2C_{L0}}{4{\rm \pi}^3(m^*+C_{M})} \left[2\zeta + \dfrac{4\gamma U_rSt}{{\rm \pi} (m^*+ C_{M})}\right]}{\varepsilon U_r St \left( (\omega^2-1)^2+ \left[2\zeta + \dfrac{4\gamma U_rSt}{{\rm \pi} (m^*+ C_{M})} \right]^2\omega^2\right)}\right)^{0.5}. \end{equation}
In addition, the angular vibration frequency  $\omega$ and reduced velocity $U_r$ should satisfy
 \begin{equation} U_r^2St^2 + A\omega^2\frac{\dfrac{(1-\omega^2)U_r^2C_{L0}}{4 {\rm \pi}^3(m^*+C_M)}}{(\omega^2-1)^2 + \left[2\zeta + \dfrac{4\gamma U_r St}{{\rm \pi} (m^*+ C_M)}\right]^2\omega^2} - \omega^2 = 0. \end{equation}
Combining equations (3.3) and (3.6), after some elementary algebra, we can finally describe the vibration amplitude  $y_0$ with the previously defined dimensionless parameters.
From an order-of-magnitude analysis on (3.7), we can find that  $\omega$ goes to infinity at $U_{r}^{\infty }$. Then, importantly, considering the structural damping ratio $\zeta$ is a finite value (particularly $0 \leq \zeta < 1$ for an underdamped system), the damping-related terms in (3.3) and (3.6) can therefore be simplified as follows:
 \begin{equation} \left[2\zeta + \frac{4\gamma U_{r}^{\infty} St}{{\rm \pi} (m^*+ C_M)}\right] \approx \frac{4\gamma U_{r}^{\infty} St}{{\rm \pi} (m^*+ C_M)} = \frac{C_{D} U_{r}^{\infty} }{{\rm \pi}^2 (m^*+ C_M)}. \end{equation}
The above expression indicates that the structural damping ratio (underdamped) has a negligible effect on the body vibration amplitude at an infinity reduced velocity. This is in agreement with the experimental results in figure 3, where the vibration amplitudes appear to be almost constant at an infinite reduced velocity for the damping ratio range tested. The damping effects can also be examined by solving (3.3) and (3.6). For instance, by using the same parameters as in figure 4(a,b) and setting the reduced velocity to infinity, we obtain  $y_{0}\approx 0.66$ and $0.01$ for $m^{*}=0.4$ and $25$, respectively, in the tested range of $0 \leq \zeta \leq 0.5$. These estimates of $y_0$ at $U^{\infty }_r$ are consistent with the findings from experiments and the nonlinear ROM in figure 3(b), where $y_{10}$ values appear to be independent of damping ( $\zeta ^{\infty }$) for $m^*$ cases below or above $m^*_c$. Note that the presence of significant vibration at $U_{r}^{\infty }$ is the criterion for determining the occurrence of VIV forever. In other words, (3.3) and (3.6) clearly indicate that for an underdamped system, the structural damping will have a negligible effect on the vibration amplitude in VIV forever, which is consistent with the results from both the present ROM-LSA and experiments.
By neglecting all damping terms in his ROM-LSA, de Langre (Reference de Langre2006) derived the upper limit of lock-in for VIV of a circular cylinder
 \begin{equation} U_r^{max}=\left[St-\sqrt{\dfrac{AC_{L0}}{4{\rm \pi}^3 (m^{*}+C_M)}}\right]^{-1}.\end{equation}
By letting  $U_r^{max}$ go to infinity, de Langre (Reference de Langre2006) further derived the critical mass ratio that allows infinite resonance
 \begin{equation} m^{*}_{c}=AC_{L0}/(4{\rm \pi}^3St^2)-C_M .\end{equation}
The above (3.10) indicates that the parameters  $C_{L0}$, $St$, and $C_M$ can affect $m^*_c$. Recently, in their numerical study of FIV of an elliptical section (of $1.5$ in the cross-sectional aspect ratio) with $m^* = 1$ at $Re = 200$, Leontini et al. (Reference Leontini, Griffith, Lo Jacono and Sheridan2018) have shown that the critical mass is the mass which results in an inertial force that can be balanced by the magnitude of the lift force – in other words, $m^*_c$ is set by the magnitude of the lift force. They have also demonstrated that the bluffer geometry of an ellipse (compared with a circular section) could potentially generate a larger magnitude of lift force, and thus should have a higher $m^*_c$ value than the circular counterpart – they observed that the ellipse at a $90^{\circ }$ angle of attack exhibited an infinite resonance at $m^* = 1$, a much higher value than the critical mass ratio expected for the circular cylinder in that $Re$ regime. The above results from Leontini et al. (Reference Leontini, Griffith, Lo Jacono and Sheridan2018) could potentially be extended to account for the damping resistance force in the sense that the effect of damping (ratio) would reduce the magnitude of lift force (as reflected by reduced body vibration), thus resulting in a lower $m^*_c$ value; in other words, an increase in the structural damping would require a decrease in the cylinder mass (i.e. a lighter cylinder) to exhibit VIV forever. Thus, we hypothesise that the structural damping is another factor that can potentially affect the critical mass ratio. However, to test this hypothesis would require accurate measurements of the critical mass ratio values under various damping ratios (i.e. via a parametric study with fine increments in both mass and damping ratios), which is beyond the focus of the present study.
3.2. Frequency analysis
To provide insight into the dynamics of cylinder vibration in VIV forever, this subsection presents a frequency analysis of the cylinder vibration and fluid forcing in experiments.
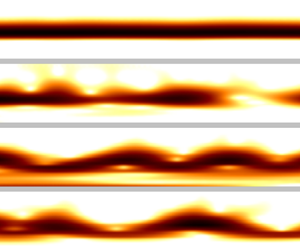
Figure 5 shows the normalised logarithmic-scale power spectrum density (PSD) contours of the cylinder vibration frequency response for  $m^* = 0.41$ with various damping ratios ( $\zeta = 3.7\times 10^{-3}$– $2.3\times 10^{-1}$) from the present experiments and ROM. The construction method for this figure can be found in the previous studies of Leontini, Lo Jacono & Thompson (Reference Leontini, Lo Jacono and Thompson2011, Reference Leontini, Lo Jacono and Thompson2013) and Zhao et al. (Reference Zhao, Leontini, Lo Jacono and Sheridan2014, Reference Zhao, Hourigan and Thompson2018). As can be seen, the dominant frequencies (denoted by open circles) are in good agreement with the results of Govardhan & Williamson (Reference Govardhan and Williamson2002) (denoted by solid diamonds); however, considerable broadband frequency components appear in the upper branch region (i.e. $U_r > 4$), which are distinctly different from those of the conventional upper branch with $m^*$ well above critical value, where the cylinder vibration clearly displays a single frequency (e.g. Zhao et al. Reference Zhao, Hourigan and Thompson2018). Overall, the body vibration frequency increases linearly with $U_r$ after $y_{10}$ becomes relatively stable (e.g. $U_r > 6$). The slope of the linear frequency variation is observed to increase slightly from $a = 0.148$ to $0.154$ across a damping ratio increase of the order of $2$ from $\zeta = 3.7\times 10^{-3}$ to $2.3\times 10^{-1}$. It can also be seen that in the upper-branch region, in all cases the body vibration frequency departs significantly from the Strouhal number trend (i.e. $St \simeq 0.215$ measured for the fixed cylinder), which is similar to the conventional upper-branch response with $m^*$ of the order of $O(1)$ above $m^*_c$. On the other hand, the present ROM also quantitatively captures linear frequency-response variations with their slope values increasing from $0.114$ to $0.128$ across the damping ratios tested. Nevertheless, the above results imply that the large-amplitude vibration seen for sub-critical mass ratio (i.e. $m^* < m^*_{c}$) is strongly associated with a synchronisation between the cylinder vibration frequency and the vortex-shedding frequency, rather than the natural frequency (i.e. $f_{nw}$) of the system. Due to the coupled fluid–structure interaction, the vortex-shedding frequency from a vibrating body in synchronisation appears to be significantly lower than that of the fixed body counterpart, and the vortex-shedding frequency tends to increase as the body vibration is reduced by the damping effect; however, the fluid–structure (frequency) synchronisation remains strong for a sub-critical mass ratio within the underdamped damping ratio range (i.e. $\zeta < 1$).
Logarithmic-scale power spectrum density contours of normalised frequency response as a function of reduced velocity for the present experiments of  $m^* = 0.41$ with various damping ratios in (b) – $(\,f)$. Note that (a) revisits their normalised amplitude responses. The cylinder vibration frequency is normalised by the natural frequency, namely $f^*_y = f_y/f_{nw}$. The open circles represent the local dominant frequency component in the present experiments, while the solid diamonds in (b) represent the measurements with $m^* = 0.52$ ( $\zeta$ unknown) by Govardhan & Williamson (Reference Govardhan and Williamson2002). The dashed-dotted lines represent the Strouhal number frequency ( $St \simeq 0.215$), the dashed lines (green) represent the trend slope of the dominant frequency for $U_r \geq 6$, where $y_{10}$ appears to be relatively stable with increasing $U_r$, and the solid lines (blue) represent the normalised frequency response obtained from the corresponding ROM.

To provide a further insight into frequency synchronisation, figure 6 shows a time–frequency analysis based on continuous wavelet transform (CWT) for the cylinder vibration and fluid forcing. Details of the CWT used can be found in Zhao et al. (Reference Zhao, Thompson and Hourigan2022b). For the upper branch ( $U_r = 5.6$) of $m^* = 25$ shown in figure 6(a), the normalised vibration frequency ( $\,f^*_y$) clearly locks onto the natural frequency of the system ( $\,f_{nw}$), and remains stationary (not varying) over time, while the fluid forcing frequency ( $\,f^*_{C_L}$) also locks onto $f_{nw}$ but exhibits noticeable discontinuities in power over time. On the other hand, for the case at $U_r = 5.6$ of $m^* = 0 .41$, $f^*_y$ is clearly synchronised with $f^*_{C_L}$, and interestingly they become non-stationary, varying around a value slightly above $f_{nw}$ over time. Moreover, the non-stationary frequency synchronisation can also be seen in VIV forever at two different Reynolds numbers ( $Re = 10\, 000$ and $13\, 500$) in figure 6(c,d). However, it should be noted that, without restoring springs, the equilibrium position of the cylinder vibration in VIV forever appears to the unstable. Perhaps this is unsurprising, since the magnitude of lift force generated by the vortex shedding is naturally unstable. Nevertheless, the irregular non-stationary behaviour of both $f^*_y$ and $f^*_{C_L}$ for the $m^* = 0.41$ case may suggest a frequency synchronisation of chaos, where the cylinder vibration frequency is synchronised with the fluid forcing frequency but the dynamics appears to be chaotic.
Continuous-wavelet-transform-based time–frequency analysis for the cylinder vibration and transverse lift force: the case of  $m^* = 25$ and $\zeta = 8.55\times 10^{-4}$ at $U_r = 5.6$ in (a); and the case of $m^* = 0.41$ and $\zeta = 3.70 \times 10^{-3}$ at $U_r = 5.6$ in (b), $U^{\infty }_r$ and $Re = 10\ 000$ in (c) and $U^{\infty }_r$ and $Re = 13\ 500$ in (d). Note that the frequency PSD contours are logarithmic scaled; in (c) and (d) the frequency components in the absence of springs are normalised by $f_{vs}$.

4. Conclusions
Vortex-induced vibration of a circular cylinder with a low mass ratio below the critical value has been investigated over a wide range of structural damping in water-channel experiments and also using a reduced-order model in both nonlinear and linear forms.
Both the experimental and ROM results confirmed that the phenomenon of VIV forever persists even with very high structural damping for an underdamped cylinder (i.e.  $\zeta < 1$). Of interest, a simplified linear stability analysis of the ROM (or ROM-LSA) showed that the wake mode in VIV forever was unstable with a constant positive growth rate with increasing reduced velocity. This was distinctly different from the conventional VIV response of a cylinder with a mass ratio well above the critical value, where the growth rate of the wake mode was negative, leading to vibration amplitude reduction beyond the upper branch.
A further ROM-based analysis of the effect of damping ratio showed that, for an underdamped cylinder (i.e.  $\zeta < 1$), the damping ratio has a negligible effect on the vibration amplitude in VIV forever, which is consistent with the experimental results.
On the other hand, both the experimental and ROM results showed that for a sub-critical mass ratio (i.e.  $m^* < m^*_c$), the body vibration frequency in the fluid–structure synchronisation region (i.e. the upper branch for $m^* < m^*_c$) tends to increase with damping ratio. Of note, a wavelet-transform-based time–frequency analysis showed that for a cylinder under the critical mass ratio, the vibration frequency is synchronised with the fluid forcing frequency; however, both frequencies appear to be non-stationary over time, suggesting that the frequency synchronisation in VIV forever is associated with chaotic dynamics.
The effect of structural damping on the precise value of the critical mass ratio is to be investigated in future work. It would be of further interest to investigate the nonlinear dynamics (i.e. irregular behaviour with non-stationary frequency components, and chaos) in VIV forever. As implied by the large-amplitude vibration at high structural damping at present, investigation into the energy-harvesting performance from large-amplitude vibration in VIV forever is also warranted.
Funding
This work was supported by the Australian Research Council (J.Z., Discovery Early Career Researcher Award DE200101650; M.C.T., Discovery Project DP190103388; K.H. and M.C.T., Discovery Project DP200100704; and K.H. and J.Z., Discovery Project DP210100990).
Declaration of interests
The authors declare no conflict of interest.


 Open access