


1. Introduction
A fluid system with a free surface, when heated from below and subjected to vertical periodic oscillations, can give rise to flow due to either thermal convective instabilities from the imposed temperature gradients or resonant instability from the external periodic forcing. Thermal convective instabilities are either buoyancy-driven, occurring in thick layers, or surface tension gradient-driven, occurring in thin layers (thinner than the capillary length) or in microgravity (Sarma Reference Sarma1987). In this work, we limit ourselves to surface tension gradient-driven instability, also known as Marangoni instability, assuming that there are no density variations, gravity is absent (Grodzka & Bannister Reference Grodzka and Bannister1972; Kamotani, Ostrach & Pline Reference Kamotani, Ostrach and Pline1995) and that there is no phase change at the interface.
The Marangoni instability is driven by a perturbation in surface temperature when a liquid film with a free surface is heated from the liquid side. The resulting surface tension variation, assuming that surface tension decreases with increasing temperature, drives flow against the stabilizing effects of viscosity and thermal diffusivity (Pearson Reference Pearson1958; Koschmieder Reference Koschmieder1993). The threshold of the Marangoni instability, expressed via the critical temperature difference as a function of the wavenumber, exhibits two minima in the absence of gravity (Scriven & Sternling Reference Scriven and Sternling1964). These minima are associated with long-wave and short-wave instability modes. The short-wave instability mode, which is characterized by a weak interface deformation, emerges when the container width is of the order of the fluid depth. Conversely, the long-wave mode, which is associated with a strong interface deformation, emerges when the depth is small compared with the container width (Scriven & Sternling Reference Scriven and Sternling1964; Davis Reference Davis1987). In that case, the instability is subcritical, leading to an unbounded growth of the surface deformation, and eventually, film rupture and dry spot formation. This was demonstrated in the experiments of Vanhook et al. (Reference Vanhook, Schatz, Swift, McCormick and Swinney1997), who used very thin liquid layers of thickness  $\sim 0.1$ mm, as well as nonlinear computations based on low-dimensional long-wave models (Oron, Davis & Bankoff Reference Oron, Davis and Bankoff1997; Vanhook et al. Reference Vanhook, Schatz, Swift, McCormick and Swinney1997). Avoiding dry spot formation is important for several thin film applications where surface defects need to be prevented, such as coating processes (Yiantsios & Higgins Reference Yiantsios and Higgins2006), additive manufacturing under microgravity conditions (Lee & Farson Reference Lee and Farson2016) and in thin film microgravity heat pipes (Alexeev, Gambaryan-Roisman & Stephan Reference Alexeev, Gambaryan-Roisman and Stephan2005; Ajaev Reference Ajaev2013), where both evaporative and Marangoni effects play a role.
It is known that external forcing can be used to stabilize a dynamical system, as seen in the simple example of an inverted pendulum with an oscillating anchor point (Stephenson Reference Stephenson1908). Several works have applied this idea to different instabilities arising in hydrodynamical systems, e.g. Rayleigh–Bénard (Gresho & Sani Reference Gresho and Sani1970; Shukla & Narayanan Reference Shukla and Narayanan2002), Taylor–Couette (Murray, McFadden & & Coriell Reference Murray, McFadden and & Coriell1990), Rayleigh–Taylor (Sterman-Cohen, Bestehorn & Oron Reference Sterman-Cohen, Bestehorn and Oron2017), Plateau–Rayleigh (Halpern & Grotberg Reference Halpern and Grotberg2003; Haimovich & Oron Reference Haimovich and Oron2010) and Kapitza (Gottlieb & Oron Reference Gottlieb and Oron2004) instabilities. At the same time, external forcing applied to a liquid layer can lead to resonance-driven instability, known as Faraday instability (Faraday Reference Faraday1831). For the configuration considered here, i.e. a thin liquid film subject to the Marangoni instability, this poses an optimization challenge, which we aim to resolve: to tune the external forcing such as to quench the Marangoni instability, without triggering the Faraday instability. In particular, we aim to identify the critical parameter range and the mechanisms through which periodic forcing can stave off dry spot formation. We commence by placing our work in the context of past studies on this subject, all of which have considered laterally unconfined layers.
Briskman (Reference Briskman1996) and Skarda (Reference Skarda2001) studied the effect of g-jitter on the Marangoni instability by applying periodic forcing to a liquid layer with a non-deformable interface and temperature-dependent density. These authors concluded that the critical Marangoni number increases with the so-called vibrational Rayleigh number, which accounts for the acceleration induced by periodic forcing. This may be contrasted with the classical result for Bénard instability in a steady gravitational field, where the critical Marangoni number decreases with increasing Rayleigh number (Nield Reference Nield1964). In the same paper, experiments were performed by Briskman (Reference Briskman1996), where high frequency vibrations were used to stave off the formation of dry spots.
Nepomnyashchy & Simanovskii (Reference Nepomnyashchy and Simanovskii2010, Reference Nepomnyashchy and Simanovskii2013) and Fayzrakhmanova & Nepomnyashchy (Reference Fayzrakhmanova and Nepomnyashchy2018) used long-wave models based on the lubrication approximation, i.e. where inertia is ignored, to study the influence of mechanical oscillations on a trilayer system consisting of two liquids superposed by a passive gas layer unstable on account of the Marangoni effect. They found two stability bounds for the Marangoni number as a function of the perturbation wavenumber, using linear stability analysis. The onset of Marangoni instability was given by the first stability bound while the system reverted to its stable state when heated beyond the second critical threshold. The region of instability between these two critical Marangoni numbers was found to diminish with the application of periodic forcing, i.e. the system was stabilized. Nonlinear computations based on this model demonstrated the formation of two-dimensional and three-dimensional oscillatory surface patterns at large forcing amplitudes.
The works of Thiele, Vega & Knobloch (Reference Thiele, Vega and Knobloch2006) and Shklyaev, Alabuzhev & Khenner (Reference Shklyaev, Alabuzhev and Khenner2015) are particularly relevant to our current study, notwithstanding that gravity was taken into account in these works. In both studies, the authors employed a long-wave model based on the lubrication approximation to investigate the linear and nonlinear effects of Faraday forcing on the Marangoni instability. Thiele et al. (Reference Thiele, Vega and Knobloch2006) showed that the neutral stability bound of the Marangoni instability can be raised via periodic forcing when the forcing frequency is large. The resulting region of stability, which is bounded at large amplitudes by the Faraday instability threshold, increases in width as the forcing frequency is increased. The study went on to consider the nonlinear dynamics of the liquid film for parameters chosen such that the film is unstable in the absence of forcing. In that limit, which corresponds to the pure Marangoni instability, the authors obtained steady solutions in the shape of drops separated by dry zones, and showed that these could be forced to revert back to a flat-film state upon applying mechanical vibrations, thereby preventing the formation of dry spots.
Shklyaev et al. (Reference Shklyaev, Alabuzhev and Khenner2015) focused on lower frequencies compared with Thiele et al. (Reference Thiele, Vega and Knobloch2006) and showed that the critical Marangoni number increases with increasing vibrational amplitude also in this range. For the forcing amplitudes investigated, the authors further showed that the nature of the bifurcation underlying the long-wave Marangoni instability mode remains subcritical in the presence of periodic forcing.
The current work distinguishes itself from those of Thiele et al. (Reference Thiele, Vega and Knobloch2006) and Shklyaev et al. (Reference Shklyaev, Alabuzhev and Khenner2015) in several important ways. First, our linear and nonlinear models account for inertia in the momentum and energy equations, which is known to play an important role in systems involving resonant forcing. Second, we include the effects of finite container width, thereby restricting ourselves to experimentally allowable disturbance wavenumbers. Third, linear stability calculations are based on the full governing equations without invoking a long-wave approximation. As a result of these distinctions, we have made several new observations. In particular, we find that the amplitude range of the stable region, where periodic forcing can suppress the Marangoni instability without triggering the Faraday instability, decreases with increasing forcing frequency, which is opposite to the trend predicted by Thiele et al. (Reference Thiele, Vega and Knobloch2006). Moreover, beyond a critical forcing frequency, the neutral bound of the Faraday instability moves below that of the Marangoni instability, thus making it impossible to suppress flow via a linear mechanism. Nonetheless, we identify a nonlinear saturation mechanism in that frequency range, which prevents the formation of dry spots. By contrast, we find that the effect of parametric forcing on the short-wave mode of the Marangoni instability is very weak. Finally, the reduced-order model used for our nonlinear calculations extends the state of the art by accounting for both the Marangoni and Faraday instabilities.
The manuscript is arranged as follows. In § 2, we introduce the mathematical model governing the fluid system considered (figure 1). In § 3, we discuss the effect of parametric forcing on the long- and short-wave modes of the Marangoni instability, via linear stability calculations. In § 4, we develop a reduced-order long-wave model using the weighted residual integral boundary layer (WRIBL) technique (Ruyer-Quil & Manneville Reference Ruyer-Quil and Manneville2000) and employ it to perform transient computations of the nonlinear evolution of the liquid film in different stability regimes. As a result, we arrive at two mechanisms by which the formation of Marangoni-induced dry spots can be suppressed via periodic forcing.
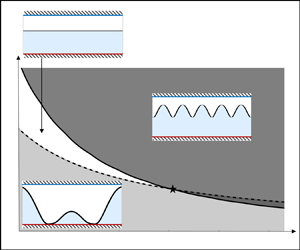
Schematic of the studied configuration. A liquid layer is subject to the Marangoni instability and a mechanical oscillation in the  $z$-direction, in the absence of gravity. The liquid is heated via a bottom wall at fixed temperature $T^*_H$ and cooled via the ambient (hydrodynamically passive) gas at a temperature $T^*_{a} < T^*_H$. Arrows at the interface indicate the flow direction due to temperature-driven surface tension gradients.

2. Mathematical model
Our physical system is sketched in figure 1, where all dimensioned variables are denoted with an asterisk. We consider a Newtonian liquid layer of unperturbed height,  $d^*$, heated by a lower wall of fixed temperature, $T^*_H$, and subjected to a mechanical oscillation of angular frequency, $\omega ^*$, and amplitude, $A^*$, in the $z$-direction in the absence of gravity. The gas above the free surface of the liquid layer is taken to be hydrodynamically passive and cooled by an upper wall. The gas layer is maintained at a temperature $T^*_{a} < T^*_H$, so that the liquid is cooled via the free surface according to Newton's law of cooling. The effect of a hydrodynamically active air layer is discussed in Appendix B.
The density,  $\rho$, viscosity, $\mu$, thermal conductivity, $\lambda$, and heat capacity , $C_p$, of the liquid are assumed constant, whereas its surface tension, $\gamma$, varies linearly with temperature at the free surface as
 \begin{equation} \gamma=\gamma_0-\gamma_T(T^*-T^*_{0}), \end{equation}
where the subscript  $0$ refers to the unperturbed base state and $\gamma _0$ denotes the surface tension at the corresponding free surface temperature, $T^*_{0}|_{z=0}$. Further, we assume $\gamma _T > 0$.
2.1. Nonlinear equations
The fluid motion is governed by the continuity and Navier–Stokes equations while the temperature field of the system is governed by the energy equation, i.e.
 $$\begin{gather} \boldsymbol{\nabla^*} \boldsymbol{\cdot} \boldsymbol{v^*} =0, \end{gather}$$
 $$\begin{gather}\rho \left(\frac{\partial \boldsymbol{v^*}}{\partial t^*}+\boldsymbol{v^*}\boldsymbol{\cdot} \boldsymbol{\nabla^*} \boldsymbol{v^* }\right) =-\boldsymbol{\nabla^*} {p^*} + \mu \nabla^{*2} \boldsymbol{v^*} - \rho ( A^*\omega{^*}^2 \cos(\omega^* t^*))\boldsymbol{e_z} \end{gather}$$
and
 \begin{equation} \rho C_p \left(\frac{\partial T^*}{\partial t^*}+\boldsymbol{v^*}\boldsymbol{\cdot}\boldsymbol{\nabla^*} {T^*} \right) = \lambda\nabla^{*2} T^*. \end{equation}
In (2.2)–(2.4),  $\boldsymbol {e_z}$ is the unit vector along the $z$ direction. Here, $A^*$ and $\omega ^*$ are the amplitude and the angular frequency of the parametric forcing.
At the bottom wall,  $z^* = -d^*$, we impose no-slip and no-penetration conditions for velocity and a Dirichlet condition for temperature i.e.
 \begin{equation} \boldsymbol{v^*}=\boldsymbol{0}\quad \textrm{and}\quad T^*=T^*_H. \end{equation}
 At the impenetrable interface,  $z^*=h^*({x^*},t^*)$, the jump mass balance yields
 \begin{equation} (\boldsymbol{v^*}- \boldsymbol{u^*})\boldsymbol{\cdot} \boldsymbol{n^*}=0, \end{equation}
for which the interface velocity vector,  $\boldsymbol {u^*}$, the unit normal, $\boldsymbol {n^*}$, and unit tangent vectors, $\boldsymbol {t^*}$, are given by
 \begin{align} \boldsymbol{u^*}\boldsymbol{\cdot} \boldsymbol{n^*}=\dfrac{\dfrac{\partial h^*}{\partial t^*}}{\left(1+\left(\dfrac{\partial h^*}{\partial x^*}\right)^{2} \right)^{1/2}},\quad \boldsymbol{n^*}= \dfrac{-\dfrac{\partial h^*}{\partial x^*} \boldsymbol{e_{x}} +\boldsymbol{e_z}}{\left(1+\left(\dfrac{\partial h^*}{\partial x^*}\right)^2 \right)^{1/2}}, \quad \boldsymbol{t^*}= \dfrac{\boldsymbol{e_x}+\dfrac{\partial h^*}{\partial x^* } \boldsymbol{e_{z}} }{\left(1+\left(\dfrac{\partial h^*}{\partial x^*}\right)^2 \right)^{1/2}}. \end{align}
The fluid loses heat from the free surface through a purely conducting gas layer via Newton's law of cooling, i.e.
 \begin{equation} \mathcal{H}(T^*-T^*_{a})=-\lambda \boldsymbol{\nabla^*} T^*\boldsymbol{\cdot}\boldsymbol{n^*}, \end{equation}
where the heat transfer coefficient is defined via  $\mathcal {H}={\lambda _a}/{d^*_a}$, with $\lambda _a$ and $d^*_a$ being the thermal conductivity and height of the gas layer. The force balance at the interface is
 \begin{equation} \boldsymbol{n^*}\boldsymbol{\cdot}\boldsymbol{\mathcal{T}}^*+\gamma \boldsymbol{n^*}\boldsymbol{\nabla^*}\boldsymbol{\cdot}\boldsymbol{n^*}-\boldsymbol{\nabla^*_s}\boldsymbol{\gamma}=0, \end{equation}
where, the stress tensor  $\boldsymbol{\mathcal{T}}^*$ is given by $\boldsymbol{\mathcal{T}}^*= -p^*\boldsymbol {I}+\mu ({\boldsymbol{\nabla^*} \boldsymbol {v^*}+\boldsymbol{\nabla^{*}} \boldsymbol{v^{*}}}^T)$. Here $\boldsymbol{\nabla^*_s}$ is the surface gradient operator and is given by $\boldsymbol{\nabla ^*}-\boldsymbol {n^*}(\boldsymbol {n^*}\boldsymbol {\cdot }\boldsymbol{\nabla ^*})$. We now turn our focus to obtaining the non-dimensional governing equations.
2.2. Non-dimensional equations
The following characteristic scales are used to obtain non-dimensionalized variables:
 \begin{equation} \left.\begin{array}{c} \displaystyle x=\dfrac{x^*}{W^*},\quad z=\dfrac{z^*}{d^*}, \quad u=\dfrac{u^*}{U}, \quad w=\epsilon\dfrac{w^*}{U}, \quad t= \dfrac{t^*}{\left(\dfrac{d^*}{\epsilon U}\right)}, \\ \displaystyle \omega=\omega^* \left(\dfrac{d^*}{\epsilon U}\right)\!, \quad p= \dfrac{p^*}{\left(\dfrac{\mu U}{d^*}\right)} \quad \mbox{and}\quad T= \dfrac{T^*-T^*_{i0}}{\Delta T^*}, \end{array}\right\} \end{equation}
where  $U={\kappa }/{d^*}$ is a characteristic horizontal velocity based on the time scale for thermal diffusion, $\kappa ={\lambda }/{\rho C_p}$ is the thermal diffusivity and $\Delta T^*=T^*_{H}-T^*_{i0}$ is the temperature difference across the unperturbed fluid layer.
Observe that we render  $x$ and $z$ dimensionless using $W^*$ and $d^*$, respectively. This leads to a length scale separation parameter, $\epsilon$, given by $\epsilon =d^*/W^*$, which will play a role when we consider the long-wave limit of the problem in § 4. Upon non-dimensionalizing equations (2.2)–(2.9) we get
 $$\begin{gather} \frac{\partial u}{\partial x}+\frac{\partial w}{\partial z}=0, \end{gather}$$
 $$\begin{gather}\epsilon Re \left(\frac{\partial u}{\partial t}+ u\frac{\partial u}{\partial x} +w\frac{\partial u}{\partial z}\right) =-\epsilon \frac{\partial p}{\partial x} + \epsilon^2\frac{\partial^2 u}{\partial x^2} +\frac{\partial^2 u}{\partial z^2}, \end{gather}$$
 $$\begin{gather}\epsilon^3 Re \left(\frac{\partial w}{\partial t}+ u\frac{\partial w}{\partial x} +w\frac{\partial w}{\partial z}\right) =-\epsilon \frac{\partial p}{\partial z} + \epsilon^4\frac{\partial^2 w}{\partial x^2} +\epsilon^2\frac{\partial^2 w}{\partial z^2} - \epsilon \mathcal{A} \cos(\omega t) \end{gather}$$
and
 \begin{equation} \epsilon \left(\frac{\partial T}{\partial t}+ u\frac{\partial T}{\partial x} +w\frac{\partial T}{\partial z}\right) = \epsilon^2\frac{\partial^2 T}{\partial x^2} +\frac{\partial^2 T}{\partial z^2}, \end{equation}
where  $Re={\rho U d^*}/{\mu }$ is the Reynolds number and $\mathcal {A}={\rho A^* \omega {^*}^{2} d{^*}^{2}}/{\mu U}$. The scaled boundary conditions at the bottom wall, $z=-1$, are
 \begin{equation} u=0,\quad w=0 \quad \mbox{and}\quad T=1. \end{equation}
The non-dimensional form of the mass balance at the impenetrable interface,  $z=h(x,t)$, along with the tangential and normal force balance conditions are
 $$\begin{gather} \epsilon w-\epsilon u \frac{\partial h}{\partial x} = \epsilon \frac{\partial h}{\partial t}, \end{gather}$$
 $$\begin{gather}\left(\frac{\partial u}{\partial z}+\epsilon^2 \frac{\partial w}{\partial x}\right)\left(1-\epsilon^2 \left(\frac{\partial h}{\partial x}\right)^2\right)+ 4 \epsilon^2 \frac{\partial w}{\partial z}\frac{\partial h}{\partial x}\notag\\ =-\epsilon Ma \left(\frac{\partial T}{\partial x}+\frac{\partial T}{\partial z}\frac{\partial h}{\partial x}\right)\left[1+\epsilon^2\left(\frac{\partial h}{\partial x}\right)^2\right]^{1/2} \end{gather}$$
and
 \begin{align} &-\!\epsilon p +2 \epsilon^2\left[ \frac{\partial w}{\partial z}\left(1-\epsilon^2 \left(\frac{\partial h}{\partial x}\right)^2\right)-\left(\frac{\partial u}{\partial z}+\epsilon^2\frac{\partial w}{\partial x}\right)\left(\frac{\partial h}{\partial x}\right)\right]\left[ 1+\epsilon^2\left(\frac{\partial h}{\partial x}\right)^{2}\right]^{-1}\nonumber\\ &\quad =\epsilon^3 \left(\frac{1}{Ca}-Ma T\right)\frac{\partial^2 h}{\partial x^2}\left[ 1+\epsilon^2\left(\frac{\partial h}{\partial x}\right)^2\right]^{-{3}/{2}}, \end{align}
where  $Ca={\mu U}/{\gamma }$ and $Ma={\gamma _T \Delta T^*}/{\mu U}$ are the capillary and Marangoni numbers, respectively. Newton's law of cooling at the free surface becomes
 \begin{equation} Bi ( T-T_a) + \left(\dfrac{\partial T}{\partial z}-\epsilon^2\dfrac{\partial T}{\partial x}\dfrac{\partial h}{\partial x}\right)\left[ 1+\epsilon^2\left(\dfrac{\partial h}{\partial x}\right)^2\right]^{-{1}/{2}}=0, \end{equation}
where  $T_a=({T^*_a-T^*_{io}})/({T^*_H-T^*_{io}})$ and where $Bi={\mathcal {H} d^*}/{\lambda }$ is the Biot number.
In what follows we shall consider the nonlinear (2.11)–(2.19) in different limits. In § 3, we discuss the stability analysis for arbitrary wavenumbers by choosing  $d^*$ to be the common length scale for the horizontal and vertical directions. This amounts to setting $\epsilon =1$ without any loss of generality. By contrast, in § 4, we will retain the original scaling and consider the limit $\epsilon \ll 1$.
3. Linear stability analysis of the finite wave model
The scaled governing equations (2.11)–(2.19) are linearized around the quiescent and purely conductive base state (subscript 0) given by
 \begin{equation} u_0=w_0=h_0=0, \quad\frac{{\rm d}p_0}{{\rm d}z} =-\mathcal{A} \cos(\omega t)\quad \textrm{and} \quad \frac{{\rm d}T_0}{{\rm d}z}=-1, \end{equation}
by introducing Floquet expansions (Nayfeh Reference Nayfeh1981). Thus, we have
 $$\begin{gather} h(x,t)=h_{0}+h'(x,t)=h_{0}+{\rm e}^{{\rm i}kx+\sigma t}\sum_{n=-N}^{N}\hat{h}_n\ {\rm e}^{({{\rm i}n\omega}/{2})t}, \end{gather}$$
 $$\begin{gather}\textrm{and}\quad \varPsi(x,z,t)=\varPsi_{0}(z)+\varPsi'(x,z,t)=\varPsi_{0}(z)+ {\rm e}^{{\rm i} kx+\sigma t}\sum_{n=-N}^{N}\hat{\varPsi}_n(z)\,{\rm e}^{({{\rm i}n\omega}/{2})t}, \end{gather}$$
where  $\varPsi = u$, $v$,
$v$,  $p$ and $T$, where primes denote infinitesimal perturbations, and where hats denote perturbation amplitudes. Here, $k\in \mathbb {R}$, $\sigma \in \mathbb {C}$ and $\omega \in \mathbb {R}$ denote the wavenumber, complex linear frequency and parametric frequency, respectively. For a fixed container width, $W$, and periodic conditions, the wavenumber is limited to discrete values $k = m2{\rm \pi} /W$, with $m\in \mathbb {N}$. The summations in (3.2) are Floquet series that ensure compatibility with the harmonic forcing term in the $z$-momentum equation (2.13). Here, $N$ sets the number of oscillatory modes considered.
Upon substitution of the forms given by (3.1a–c) and (3.2), the linearized equations (dropping the subscript,  $n$, in the (3.3)–(3.9), and (3.11)) (2.11)–(2.19), become
 $$\begin{gather} {\rm i} k \hat{u}+\frac{\partial \hat{w}}{\partial z}=0, \end{gather}$$
 $$\begin{gather}Re \hat{u} \left(\sigma+\frac{ {\rm i} n\omega}{2}\right) =-{\rm i} k \hat{p} - k^2\hat{u} +\frac{\partial^2 \hat{u}}{\partial z^2}, \end{gather}$$
 $$\begin{gather}Re \hat{w} \left(\sigma +\frac{ {\rm i} n\omega}{2}\right) =-\frac{\partial \hat{p}}{\partial z} - k^2 \hat{w} +\frac{\partial^2 \hat{w}}{\partial z^2} \end{gather}$$
and
 \begin{equation} \hat{T} \left(\sigma+\frac{{\rm i} n\omega}{2}\right) -\hat{w}=-k^2{\hat{T}} +\frac{\partial^2 \hat{T}}{\partial z^2}. \end{equation}
The linearized boundary conditions at the bottom wall,  $z=-1$, are
 \begin{equation} \hat{u}=0,\quad \hat{w}=0 \quad \mbox{and}\quad \hat{T}=0. \end{equation}
The linearized boundary conditions at the interface,  $z=0$, are
 $$\begin{gather} \hat{w} = \left(\sigma +\frac{ {\rm i} n \omega}{2}\right) \hat{h}, \end{gather}$$
 $$\begin{gather}\frac{\partial \hat{u}}{\partial z} +{\rm i} k \hat{w}=- {\rm i} k Ma (\hat{T}-\hat{h}), \end{gather}$$
 $$\begin{gather}\sum_{n=-N}^{n=N} \,{\rm e}^{({{\rm i}n\omega}/{2})t}\left\{-\hat{p}_n + \mathcal{A} \hat{h}_n\frac{\left( {\rm e}^{{\rm i} \omega t}+{\rm e}^{-{\rm i}\omega t}\right)}{2}+ 2\frac{\partial \hat{w}_n}{\partial z}=-k^2\frac{1}{Ca}\hat{h}_n\right\} \end{gather}$$
and
 \begin{equation} Bi(\hat{T}-\hat{h}) + \dfrac{\partial \hat{T}}{\partial z}=0. \end{equation}
 We now express  $\hat {\varPsi }_n(z)$ via polynomials of order $N_z$ and evaluate the domain equations at the corresponding Chebyshev Gauss–Lobatto collocation points (Guo, Labrosse & Narayanan Reference Guo, Labrosse and Narayanan2013). This is done for all $n\in [-N,N]$, yielding an $(N_z+1) (2N+1)\times (N_z+1) (2N+1)$ generalized eigenvalue problem of the form
 \begin{equation} \boldsymbol{Ax}=\sigma\boldsymbol{Bx}, \end{equation}
with eigenvalue  $\sigma = \sigma _{r}+\textrm {i}\sigma _{i}$ and the eigenvector $\boldsymbol {x}$. Here, $\sigma _{r}$ is the temporal growth rate and $\sigma _{i}$ is the corresponding linear frequency shift with respect to the forcing frequency, $\omega$. The system (3.12) is solved numerically for $\sigma$ at given values of $\omega$, $k$,
$k$,  $\mathcal {A}$ and $Ma$, using the Eigenvalues routine in Mathematica. The neutral stability bounds, i.e. $\sigma _{r}=0$, are obtained by finding a set of input parameters, say, $\mathcal {A}$ and $Ma$, for assigned values of $\omega$ and $k$. For example, to determine the critical Marangoni number, we fix the values of $\omega$, $k$ and $\mathcal {A}$ and increment the Marangoni number until it reaches a critical value, where $\sigma _{r}$ becomes zero. Likewise, the threshold for the forcing amplitude, is determined by changing the forcing amplitude until $\sigma _{r}$ becomes zero for fixed values of $\omega$, $k$ and $Ma$. Numerical calculations performed in this study show that at these critical values, one of the eigenvalues, $(\sigma _r,\sigma _i)=(0,0)$, implying exchange of stability at the neutral point.
The nature of the temporal response of the interface associated with a given eigenvalue,  $\sigma$, is determined by examining the perturbation amplitudes, $\hat {h}_n$, in the Floquet summation. Note that the response of the interface deformation is harmonic if the odd coefficients in the Floquet summation are zero, the even coefficients are non-zero and the coefficient corresponding to $n=\pm 2$ has the dominant magnitude amongst all even coefficients. On the other hand, if the coefficient corresponding to $n=\pm 4$ is dominant then the response is twice harmonic. Likewise the response of the interface deformation is subharmonic if the even coefficients are zero and the odd coefficients are non-zero with the coefficients corresponding to $n=\pm 1$ having a dominating magnitude etc. If the dominant coefficient corresponds to $n=0$ then we consider the response to be principally steady. The temporal behaviour of the interface deflections will be useful in understanding the stability diagrams in our calculations. To distinguish the two types of temporal responses in the case of instability ( $\sigma _r > 0$), we will call the mode ‘monotonic’ when $n=0$ is dominant and ‘oscillatory’ when $n \neq 0$ is dominant.
In the following subsections, we present results of linear stability calculations for a set of representative parameters, given in table 1, where the fluid properties correspond to a definite fluid system of film thickness,  $d^*$, and container width, $W^*$, based on practical considerations. The stability results are arranged as follows. We first review the results from the pure Marangoni problem, then those from the pure Faraday problem followed by the combined problem. Here we shall focus on the role of the finiteness of the container width, a feature that will be important in the interpretation of the key results in this study. We then conclude the section by considering the problem from the perspective of parametric forcing on an erstwhile unstable layer due to the Marangoni effect.
Physical properties used in the calculations. Fluid properties correspond to silicone oil (XIAMETER™ PMX-200).

3.1. Pure Marangoni instability
The linear stability calculation for the pure Marangoni problem, done for the parameters given in tables 1 and 2, is depicted in figures 2(a) and 2(b) as plots of critical Marangoni number versus the wavenumber. The initial rise and fall in the curves are due to the competition between the stabilizing effect of surface tension and the destabilizing effect of surface tension gradients. This is followed by a final rise due to stabilization afforded by viscosity and thermal diffusion. Due to the finiteness of the horizontal extent of the container, the allowable wavenumbers,  $k$, are given by $k=2m{\rm \pi} /W$, where $m\in \mathbb {N}$ and $W$ is the dimensionless width, i.e. $W^*/d^{*}$. For example, when $1/W=0.075$, the allowable wavenumbers are depicted by the vertical lines drawn in figure 2(a) i.e. at $k=2{\rm \pi} /W$, $4 {\rm \pi}/W$, $6 {\rm \pi}/W$, etc. Clearly, the minimum critical Marangoni number, denoted $Ma_c$, occurs at the wavenumber, $k=8 {\rm \pi}/W$, i.e. corresponding to four full waves within the container and denoted by the star in figure 2(a). However, if $1/W =0.003$ we arrive at figure 2(b) where now the minimum critical Marangoni number occurs at $k=2 {\rm \pi}/W$, i.e. corresponding to one full wave, and is lower than the short-wave critical Marangoni number depicted in figure 2(b), denoted by an asterisk.
Values of dimensionless groups used in the calculations.

Critical  $Ma$ versus $k$ curves, marking allowable wavenumbers $k=2m{\rm \pi} /W$ with vertical lines. The numbers between parentheses correspond to $m$. Here (a) ${1}/{W} =0.075$ and (b) ${1}/{W} =0.003$. The inset in (b) is a magnification of the low wavenumber range.

3.2. Pure Faraday instability
We now turn to the second of the two primary calculations, where the critical amplitude of shaking,  $\mathcal {A}$, for the onset of Faraday instability is obtained in the absence of Marangoni instability. The Faraday instability principally arises when the parametric forcing frequency is commensurate with the system's natural frequency. The natural frequency, however, depends on $Ca$,
$Ca$,  $Re$ and on the wavenumber of the disturbance, $k$. It is determined by calculating $Im(\sigma )$ i.e. $\sigma _i$ via (3.3)–(3.5) and (3.7a–c)–(3.10) modified here by taking $Ma=0$, $\omega =0$ and $\mathcal {A}=0$. Now, depending on the frequency range of oscillation, the instability can give rise to different waveforms which are marked in the figures 3(a) and 3(b). The calculation is done by setting the frequency and then determining the minimum critical amplitude, denoted $A^*_c$, as we sweep through the allowable waveforms, say, $k=2{\rm \pi} /W$, $k=4 {\rm \pi}/W$, $k=6{\rm \pi} /W$, etc. The lowest of the minimum amplitudes and the corresponding waveforms constitute the critical diagram, figure 3, displayed in terms of dimensioned quantities to emphasize the practical attainability of the results. This figure, drawn again for the two cases, i.e. $1/W=0.075$ and $1/W=0.003$, shows the effect of sidewall proximity. From figure 3(a) we see that there are minimum points in the frequency range where resonance is strongest for each interfacial mode. These minimum points in each of these frequency ranges are near, but not precisely at, the natural frequency associated with the waveforms. The critical curve is concatenated from the individual waveforms. However, this feature becomes less discernible as the dimensionless width becomes very large. We see this behaviour in figures 3(a) and 3(b), with figure 3(b) being drawn for a very large value of the dimensionless width compared with figure 3(a).
Critical forcing amplitude  $(A^*_c)$ versus frequency $(\,f^*)$ for the pure Faraday instability. The numbers between parentheses correspond to $m$. The vertical line corresponds to $f^{*}={1}$ Hz. Here (a) ${1}/{W} =0.075$ and (b) ${1}/{W} =0.003$.

Unlike the Marangoni instability, the Faraday instability is strongly dependent on the fluid's inertia i.e. the Reynolds number,  $Re$. The inertial motion acts on the deflecting interface and just as gravity acts to stabilize the long-wave Marangoni instability (Vanhook et al. Reference Vanhook, Schatz, Swift, McCormick and Swinney1997) we might expect that inertial action on the fluid interface can stave off the Marangoni instability with parametric forcing. To see if this is so we turn to the next stability calculation which shows the effect of resonance on the Marangoni instability.
3.3. The effect of Faraday forcing on the long-wave Marangoni instability
We now consider the effect of parametric forcing on the Marangoni instability focusing first on the long-wave regime. In this setting, there are two leading instability modes. The first mode, with critical Marangoni number  $Ma_s$, gives rise to predominantly monotonic temporal growth beyond criticality and produces a steady response at criticality, i.e. the dominant term in the Floquet expansion is $n=0$. The second mode, with threshold $Ma_o$, is predominantly oscillatory as a result of resonance. It is subharmonic in nature, i.e. the dominant term in the Floquet expansion is $n=1$.
We first focus on mode  $s$, which connects to the classical Marangoni instability mode in the absence of forcing ( $\mathcal {A}=0$). We perform stability calculations for different forcing amplitudes, $\mathcal {A}$, at fixed frequency $f^*={1}$ Hz and $1/W=0.003$. Figure 4 represents the results of these calculations. The solid curve corresponds to the pure Marangoni instability ( $\mathcal {A}=0$) while the dashed line corresponds to $\mathcal {A}=0.5\mathcal {A}_{c}$ and the dot–dashed line corresponds to $\mathcal {A}=0.9\mathcal {A}_{c}$. Observe that the critical Marangoni number, $Ma_s$, increases with amplitude of shaking over a considerable range of wavenumbers that includes the maximum of the $Ma$ versus $k$ curve. The stabilization in the low wavenumber region is illustrated in figure 4(b), where the wavenumber $k=2{\rm \pi} /W$, corresponding to a single wave within the container width, is demarcated by a vertical solid line. Thus, the long-wave monotonic Marangoni instability mode can be strongly stabilized by parametric forcing.
Critical  $Ma$ versus $k$ showing the stabilizing effect of Faraday forcing for a fixed frequency of ${1}$ Hz. Here the amplitude of shaking is increased from $\mathcal {A}=0$ (solid curve) to $\mathcal {A}=0.5\mathcal {A}_{c}$ (dashed curve) and $\mathcal {A}=0.9\mathcal {A}_{c}$ (dot–dashed curve). The corresponding critical amplitude is $A^*_c = {16.4}$ mm and is marked by the vertical line in figure 3(b) ( $1/W=0.003$). Here $\boldsymbol {S}$ represents the stable region and $\boldsymbol {U}$ represents the unstable region.

To understand what happens when  $\mathcal {A}>\mathcal {A}_c$ we turn to figure 5, which represents the corresponding stability diagram. While the $Ma_s$ are obtained for $k=2{\rm \pi} /W$, the most unstable possible wavenumber for the container width chosen, the $Ma_o$ are obtained for $k=40{\rm \pi} /W$, the lowest wavenumber at which oscillatory modes first appear, as seen from figure 3(b). The dark and light grey regions indicate stable and unstable regimes which are identified based on the real part of $\sigma$, for the two leading eigenvalues. Observe that as $\mathcal {A}$ increases, $Ma_{s}$ (shown by the solid dots in figure 5a) increases, which is in accordance with figure 4. The second instability mode, $Ma_o$, represented by the open circles in the magnified view shown in figure 5(b), appears in the proximity of $\mathcal {A}_c$. For $\mathcal {A}<\mathcal {A}_c$, $Ma_o$ rapidly approaches negative infinity as $\mathcal {A}$ is reduced. When $\mathcal {A}=\mathcal {A}_{c}$, $Ma_o$ reaches zero while $Ma_s$ continues to increase, but at a slower rate. As a result, when $\mathcal {A}>\mathcal {A}_c$, $Ma_o$ can overtake $Ma_s$. It is clear from figures 5(a) and 5(b) that when $Ma < Ma_o$ the flow is oscillatory but if $Ma > Ma_s$ the flow is monotonic. Clearly, if $Ma_o < Ma_s$, then the system is stable for $Ma_o < Ma < Ma_s$ and if $Ma_o > Ma_s$, then the system is always unstable.
Stability diagrams depicting the emergence of a second instability mode for a fixed frequency,  $f^*={1}$ Hz. Critical Marangoni numbers versus forcing amplitude, $\mathcal {A}$, are shown along with the sign of the real part of $\sigma$, $\mathcal {R}(\sigma$), for the long-wave regime. The symbol $\bullet$ represents $Ma_{s}$ and the symbol $\circ$ represents $Ma_{o}$. Panel (b) is the magnification of (a) in the vicinity of $\mathcal {A}_c$. The dark region represents $\mathcal {R}(\sigma )<0$ and the light region represents $\mathcal {R}(\sigma )>0$.

We now turn to the task of analysing the effect of Faraday forcing on the short-wave regime.
3.4. Effect of Faraday forcing on the short-wave Marangoni instability
To access the short-wave Marangoni instability we consider, as an example,  $1/W=0.075$ and refer to figure 2(a), where the star locates the onset of short-wave instability and corresponds to $k = 8{\rm \pi} /W$. Figure 4(a), although drawn for a wider container, suggests that the effect of forcing on the short-wave Marangoni instability is negligible. Let us verify whether this holds for the current container width, where the short-wave instability is dominant. As in the discussion of the long-wave case, figure 6 represents the corresponding stability diagram. To make a consistent comparison with the long-wave case, illustrations are shown for the same frequency, i.e. $f^* = {1}$ Hz. Unlike the long-wave case, the $Ma_s$ are obtained for $k = 8{\rm \pi} /W$ (marked by a star in figure 2a) and the $Ma_o$ are obtained for $k = 2{\rm \pi} /W$ (marked by the vertical line in figure 3a), i.e. the most unstable mode for each instability type.
Illustration of  $Ma$ versus $\mathcal {A}$ depicting the sign of the real part of $\sigma$, $\mathcal {R}(\sigma )$ for the short-wave regime. The symbol $\bullet$ represents $Ma_{s}$ and the symbol $\circ$ represents $Ma_{o}$. The dark region represents $\mathcal {R}(\sigma )<0$ and the light region represents $\mathcal {R}(\sigma )>0$.

Observe from figures 6(a) and 6(b) that  $Ma_s$ is not affected by parametric forcing, unlike the long-wave case, while $Ma_o$ displays the same behaviour as seen in figure 5. We thus focus on the effect of parametric forcing on the long-wave instability mode in the remainder of the manuscript.
3.5. A practical perspective: the effect of increasing forcing amplitude at fixed Marangoni number where  $Ma>Ma_c$

In § 3.3, we saw that raising the forcing amplitude,  $\mathcal {A}$, increases the threshold Marangoni number, $Ma_{s}$, in the long-wave region. This implies that an increase in $\mathcal {A}$ at fixed Marangoni number, $Ma>Ma_c$, can render the flow stable. In the current subsection, we investigate whether this holds over a wide frequency range. To this end, we consider a system with physically realizable properties given by table 1, now setting the width to $1/W=0.003$. The Marangoni number is set to $Ma = 1.4 Ma_{c}$, where $Ma_{c}$ corresponds to a waveform with $k = 2{\rm \pi} /W$. This number, $Ma\sim 25$, can be read off the inset of figure 4(b). It may be seen from the inset of figure 2(b) that for $Ma=25$, only the waveform corresponding to one wave, i.e. $m=1$ is unstable, all other allowable waveforms being stable.
Having assigned  $Ma$, we now seek the stability of the flow as we increase the dimensioned forcing amplitude, $A^*$, until $\sigma _{r}=0$, while incrementing the input frequency, $f^*$. Results are displayed in figure 7, where we once again use dimensioned quantities to emphasize the practical feasibility of the calculations. In this figure, the dashed curve corresponds to the threshold amplitude, $A^*_s$, required for the stabilization of the monotonic, long-wave Marangoni mode. On this curve, the assigned $Ma$ equals $Ma_s$. A connection between figures 4 and 7 can be made by considering a frequency of ${1}$ Hz, where the critical amplitude is approximately ${15}$ mm according to figure 7. This corresponds to $\mathcal {A} \sim 0.9 \mathcal {A}_c$, i.e. to the intersection of the horizontal and vertical lines in figure 4.
Frequency dependence of the stability bounds for the monotonic ( $s$) and oscillatory ( $o$) instability modes: $1/W=0.003$. The $A^*$ versus $f^*$ curves at fixed $Ma=1.4 Ma_c\vert _{m=1}$ (marked by circle in figure 2b). Integers between parentheses, ( $m$), identify the most unstable wavenumber $k=2 m{\rm \pi} /W$. The upward arrow marks the cutoff frequency, where $A^*_o$ becomes equal to $A^*_s$.

Returning to figure 7, the solid curve represents a second threshold,  $A^*_o$, where the interface deformation is predominantly subharmonic in nature and reflective of resonance. It is here that the assigned $Ma=1.4 Ma_c$ equals $Ma_o$, as denoted earlier by open circles in figure 5. The integer, $m$, between parentheses in figure 7 characterizes the most-unstable wavenumber, $k = m 2{\rm \pi} /W$, for a given frequency.
The plot, thus obtained, demarcates three regions of instability/stability, which are separated by the dashed and solid curves. Region  $\mathrm {I}$ is unstable to a monotonic mode related to the Marangoni instability, region $\mathrm {II}$ is fully stable and region $\mathrm {III}$ is unstable to a subharmonic oscillatory mode related to Faraday instability.
It should be observed that figure 7 is similar to figure 3(b) even though now  $Ma\neq 0$. In fact, the numerical values of the critical amplitude, $A^*_o$, given by the solid lines in the two figures are almost indistinguishable from one another. This implies that the Marangoni number has little influence on the onset of resonance, even though the parametric forcing has a strong influence in quenching the Marangoni instability.
Region II exists only in a certain frequency range, until the solid and dashed curves intersect. We designate the frequency,  $f^{*}$, at the intersection point of the three regions, indicated by the vertical arrow in figure 7, as the cutoff frequency. Beyond this frequency, we move from an unstable Marangoni regime (region $\mathrm {I}$) directly to an unstable resonant regime (region $\mathrm {III}$) eluding any stable transition. Within the thin region between the solid and dashed curves, both the monotonic and oscillatory instability modes grow, but the oscillatory one is dominant. For example, at a forcing frequency of ${1.56}$ Hz, the oscillatory mode with $m=24$ ought to be observed in an experiment. This means that to the right of the cutoff frequency an increase in amplitude will elicit a drastic change in the modal response from one wave to more than $21$ waves. This sudden transition is interpreted from the perspective of $A^{*}$ versus $k$ curves, in Appendix A.
Let us now consider how the cutoff frequency changes when increasing the assigned Marangoni number. A higher Marangoni number will enhance surface tension gradient flows and to suppress these flows, a higher amplitude of oscillation is required at a given frequency. Hence, the dashed line, which represents the threshold amplitude to quench Marangoni instability, will shift upwards, increasing region  $\mathrm {I}$, where the Marangoni instability is dominant and decreasing region $\mathrm {II}$, where the fluid system is stable. This will cause a shift in the cutoff frequency as shown by the graph in figure 8.
The  $Ma/Ma_c$ versus cutoff frequency.

The above observations are important as it is known that the pure Marangoni problem in the long-wave region leads to dry spots when the Marangoni number exceeds its critical value (Vanhook et al. Reference Vanhook, Schatz, Swift, McCormick and Swinney1997). To stave off such dry spots with Faraday forcing our calculations would have us hypothesize that we may either force at low frequency leading to a stable flat surface or force at high frequency at the risk of producing large amplitude interfacial oscillatory waves. To check this hypothesis, we proceed to a nonlinear model that allows us to track the interface evolution. This is an involved task but we can gain much insight by appealing to a reduced-order model that uses separation of length scales in the case of thin films, where  $\epsilon = 1/W$ is much less than unity. This is done in the next section.
4. Nonlinear computations based on a long-wave model
At large forcing frequencies, linear suppression of the Marangoni instability via parametric forcing, i.e. beyond the dashed curve in figure 7, comes at the price of triggering Faraday waves. In this case, dry spot formation is prevented, which is the minimum requirement for a coating process, but large interface deflections may still occur, thus limiting the surface smoothness of a final coating. In the current section, we investigate whether the nonlinear deflection of the liquid film surface can be minimized nonetheless via a nonlinear interaction between the Marangoni instability and parametric forcing, i.e. below the dashed curve in figure 7.
4.1. Long-wave approximation
As we are concerned with the long-wave Marangoni instability mode, we invoke the long-wave approximation,  $\epsilon \ll 1$, where $\epsilon = d^*/W^*$ denotes the ratio of normal to transverse length scales (cf. figure 1), in order to derive a low-dimensional WRIBL model, allowing efficient, high-fidelity nonlinear computations (Kalliadasis et al. Reference Kalliadasis, Ruyer-Quil, Scheid and Velarde2011).
We start with the non-dimensional governing equations (2.11)–(2.19), which we truncate at  $O(\epsilon ^2)$. Thus, both inertia, which plays an important role in parametric instabilities enters at $O(\epsilon )$, and transverse viscous and thermal diffusion, which enter at $O(\epsilon ^2)$, are accounted for. We thus obtain the truncated continuity equation
 \begin{equation} \frac{\partial u}{\partial x}+\frac{\partial w}{\partial z} = 0, \end{equation}
the momentum equations
 $$\begin{gather} \epsilon Re \left(\frac{\partial u}{\partial t}+ u\frac{\partial u}{\partial x} +w\frac{\partial u}{\partial z}\right) =-\epsilon \frac{\partial p}{\partial x} + \epsilon^2\frac{\partial^2 u}{\partial x^2} +\frac{\partial^2 u}{\partial z^2}, \end{gather}$$
 $$\begin{gather}- \epsilon \frac{\partial p}{\partial z}+\epsilon^2\frac{\partial^2 w}{\partial z^2}-\epsilon \mathcal{A} \cos(\omega t)=0 \end{gather}$$
and the energy equation
 \begin{equation} \epsilon \left(\frac{\partial T}{\partial t}+ u\frac{\partial T}{\partial x} +w\frac{\partial T}{\partial z}\right) = \epsilon^2\frac{\partial^2 T}{\partial x^2} +\frac{\partial^2 T}{\partial z^2}, \end{equation}
where we have assumed  $Re$ and $\mathcal {A}$ to be of at least $O(\epsilon )$. Further, at $z=h(x,t)$, the interphase coupling conditions are
 $$\begin{gather} \epsilon\frac{\partial h}{\partial t}=-\epsilon u\frac{\partial h}{\partial x}+\epsilon w, \end{gather}$$
 $$\begin{gather}\frac{\partial u}{\partial z}\left(1-\epsilon^2 \left(\frac{\partial h}{\partial x}\right)^2\right)+\epsilon^2 \frac{\partial w}{\partial x}+ 4 \epsilon^2 \frac{\partial w}{\partial z}\frac{\partial h}{\partial x} =-\epsilon Ma \left(\frac{\partial T}{\partial x}+\frac{\partial T}{\partial z}\frac{\partial h}{\partial x}\right)\!, \end{gather}$$
 $$\begin{gather}-\epsilon p+2 \epsilon^2 \left(\frac{\partial w}{\partial z}-\frac{\partial u}{\partial z}\frac{\partial h}{\partial x}\right)=\frac{\epsilon^{3}}{Ca}\frac{\partial^{2} h}{\partial x^{2}} \end{gather}$$
and
 $$\begin{gather}Bi (T-T_a)\left[ 1+\frac{\epsilon^2}{2}\left(\dfrac{\partial h}{\partial x}\right)^2\right] + \frac{\partial T}{\partial z}-\epsilon^2\dfrac{\partial T}{\partial x}\dfrac{\partial h}{\partial x}=0, \end{gather}$$
where we have assumed the capillary number,  $Ca$, to be at most of $O(\epsilon )$, and the Marangoni number, $Ma$, to be at least of $O(\epsilon )$. We designate the system of truncated equations given by (4.1)–(4.5) as a $1+\epsilon ^2$ model.
Next, we eliminate the pressure,  $p$, from (4.2) via (4.3) and (4.5c). Integration of (4.3) from $z$ to $z = h(x,t)$, and substitution of (4.5c) for ${p}|_{h}$ yields the pressure profile in the liquid film, i.e.
 \begin{equation} \epsilon p\vert_{z}=-\frac{\epsilon^{3}}{Ca}\frac{\partial^{2} h}{\partial x^{2}}+\epsilon \mathcal{A} \cos(\omega t) (h-z)+\epsilon^2 \left[\left(\frac{\partial w}{\partial z}-2 \frac{\partial u}{\partial z}\frac{\partial h}{\partial x}\right)\left\vert_{h}+\frac{\partial w}{\partial z}\right\vert_{z}\right]\!, \end{equation}
which is then substituted into (4.2). As a result, we obtain the so-called boundary layer equation governing momentum transport within the liquid film in the long-wave limit, which replaces (4.2) and (4.3)
 \begin{align} &\epsilon Re \left(\frac{\partial u}{\partial t}+u \frac{\partial u}{\partial x}+w \frac{\partial u}{\partial z}\right) = \frac{\epsilon^{3}}{Ca}\frac{\partial^{3} h}{\partial x^{3}}-\epsilon \mathcal{A} \cos(\omega t)\frac{\partial h}{\partial x}+\frac{\partial^{2} u}{\partial z^{2}}+2\epsilon^2\frac{\partial^{2} u}{\partial x^{2}}\nonumber\\ &\quad +\epsilon^2\frac{\partial}{\partial x} \left(2\frac{\partial u}{\partial z}\frac{\partial h}{\partial x}-\frac{\partial w}{\partial z}\right)\Big\vert_{h}. \end{align}
4.2. The WRIBL model
We reduce the dimension of the system of governing equations (4.1), (4.4), (4.5) and (4.7) by eliminating the  $z$-coordinate from the problem and describing the flow in terms of the local instantaneous film surface deflection $h(x,t)$, flow rate $q(x,t)$ and film surface temperature $\theta (x,t)$. This is achieved by integrating (4.4) and (4.7) in the $z$-direction across the film thickness, i.e. from $z=-1$ to $z=h(x,t)$, following the WRIBL approach (Kalliadasis et al. Reference Kalliadasis, Ruyer-Quil, Scheid and Velarde2011).
First, the dependent variables,  $u$ and $T$, are decomposed into a leading-order contribution (highlighted by a hat) and an $O(\epsilon )$ correction (highlighted by a tilde), i.e.
 \begin{equation} u(x,z,t)=\underbrace{\hat{u}(x,z,t)}_{O(1)}+ \underbrace{\tilde{u}(x,z,t)}_{O(\epsilon)},\end{equation}
and
 \begin{equation} T(x,z,t)=\underbrace{\hat{T}(x,z,t)}_{O(1)}+ \underbrace{\tilde{T}(x,z,t)}_{O(\epsilon)}, \end{equation}
and  $w$ follows from (4.1). For this decomposition to hold, $\hat {u}$ and $\hat {T}$ should remain sufficiently close to the exact solution at all times. This can be achieved by requiring $\hat {u}$ and $\hat {T}$ to satisfy the governing equations (4.1), (4.4), (4.5) and (4.7) truncated at $O(1)$ and by introducing appropriate gauge conditions.
In particular,  $\hat {u}$ is governed by the boundary value problem
 \begin{equation} \frac{\partial^{2}\hat{u}}{\partial z^{2}}=K, \quad \hat{u}\vert_{z=-1}=0, \quad \mbox{and}\quad \left.\frac{\partial \hat{u}}{\partial z}\right\vert_{z=h(x,t)}=-\epsilon Ma \left(\frac{\partial \hat{T}}{\partial x}+\frac{\partial \hat{T}}{\partial z}\frac{\partial h}{\partial x}\right)\!, \end{equation}
where we have further restricted  $Ma$ to be at least of $O(1/\epsilon )$. We have additionally restricted $Ca$ to be at most of $O(\epsilon ^{3})$, in order to retain the inhomogeneity, $K$. Further, we impose the gauge condition,
 \begin{equation} \int_{-1}^{h(x,t)} \hat{u} \,{\rm d} z=q(x,t), \end{equation}
which requires that the base velocity profile yield the local instantaneous flow rate  $q(x,t)$. Solving (4.10a–c) for $\hat {u}$ subject to (4.11), yields
 \begin{equation} \hat{u}=-\frac{3 q (z+1-2 (h+1))(z+1)}{2 (h+1)^3}-\epsilon Ma \frac{\partial\theta}{\partial x} \frac{(z+1) (3(z+1)-2 (h+1))}{4 (h+1)}, \end{equation}
which implies for the velocity correction,  $\tilde {u}$,
 \begin{equation} \int_{-1}^{h(x,t)} \tilde{u} \,{\rm d} z=0,\quad \tilde{u}\vert_{z=-1}=0 \quad\text{and} \quad \left.\frac{\partial \tilde{u}}{\partial z}\right\vert_{z=h}=-\left(\epsilon^2 \frac{\partial \hat{w}}{\partial x}+ 4 \epsilon^2 \frac{\partial \hat{w}}{\partial z}\frac{\partial h}{\partial x}\right)\!. \end{equation}
 Similarly,  $\hat {T}$ is governed by the boundary value problem
 \begin{equation} \frac{\partial^{2} \hat{T}}{\partial z^{2}}=0,\quad \hat{T}\vert_{z=-1}=1 \quad \mbox{and}\quad \hat{T}\vert_{z=h(x,t)}=\theta, \end{equation}
where  $\theta (x,t)$ is the temperature of the film surface. Solving (4.14a–c) for $\hat {T}$, we obtain
 \begin{equation} \hat{T}=\frac{ (\theta-1)}{h+1}(z+1)+1, \end{equation}
which implies for the temperature correction,  $\tilde {T}$,
 \begin{equation} \tilde{T}\vert_{z=-1}=0, \quad \tilde{T}\vert_{z=h}=0 \end{equation}
and
 \begin{equation} \frac{\partial \tilde{T}}{\partial z}\vert_{z=h}=-\frac{h+\theta }{h+1}-Bi \theta+\epsilon ^2 \left[\frac{\partial h}{\partial x} \frac{\partial \theta}{\partial x}-\left(\frac{\partial h}{\partial x}\right)^2\left(\frac{ Bi \theta +1}{2 }+\frac{ \theta -1}{h+1}\right)\right]\!. \end{equation}
 Next, we introduce (4.12) and (4.15) in (4.4) and (4.7), truncate the resulting equations at  $O(\epsilon ^2)$, multiply with the weight functions $F(x,z,t)$ and $\mathcal {W}(x,z,t)$, and integrate across the film height, $1+h(x,t)$. This yields the integral momentum equation
 \begin{align} &\int_{-1}^{h} \epsilon Re \left(\frac{\partial \hat{u}}{\partial t}+\hat{u} \frac{\partial \hat{u}}{\partial x}+\hat{w} \frac{\partial \hat{u}}{\partial z}\right) F\,{\rm d} z= \boxed{ \int_{-1}^{h} \frac{\partial^{2} }{\partial z^{2}}(\hat u+\tilde u) F\,{\rm d} z}+\int_{-1}^{h}2\epsilon^2\frac{\partial^{2} \hat{u}}{\partial x^{2}} F\,{\rm d} z\nonumber\\ &\quad - \left(\epsilon \mathcal{A} \cos(\omega t)\frac{\partial h}{\partial x}-\frac{\epsilon^{3}}{Ca}\frac{\partial^{3} h}{\partial x^{3}} -\epsilon^2\frac{\partial}{\partial x} \left[ (2\frac{\partial \hat{u}}{\partial z}\frac{\partial h}{\partial x}-\frac{\partial \hat{w}}{\partial z})\vert_{h}\right]\right) \int_{-1}^{h} F\,{\rm d} z, \end{align}
and the integral energy equation
 \begin{align} \int_{-1}^{h} \epsilon \left(\frac{\partial \hat{T}}{\partial t}+ \hat{u}\frac{\partial \hat{T}}{\partial x} +\hat{w}\frac{\partial \hat{T}}{\partial z}\right) \mathcal{W} \,{\rm d} z= \boxed{\int_{-1}^{h} \frac{\partial^2 }{\partial z^2}(\hat T+ \tilde T) \mathcal{W} \,{\rm d} z}+\int_{-1}^{h} \epsilon^2\frac{\partial^2 \hat T}{\partial x^2} \mathcal{W} \,{\rm d} z, \end{align}
where the unknown corrections,  $\tilde {u}$ and $\tilde {T}$, only appear in the boxed terms, expressing wall-normal diffusion. At most other places, $\tilde {u}$ and $\tilde {T}$ drop out due to truncation at $O(\epsilon ^2)$. Only for the convective terms have we made additional assumptions by dropping the contributions of the corrections, even though $O(\epsilon \tilde {u}) = O(\epsilon \tilde {T}) = O(\epsilon ^2)$, implying weak (but finite) inertial and heat convection effects.
The weight functions,  $F$ and $\mathcal {W}$, are chosen such as to cancel $\tilde {u}$ and $\tilde {T}$ from the boxed terms in (4.17a) and (4.17b). For $F$, we require
 \begin{equation} \frac{\partial^{2}F}{\partial z^{2}}=1,\quad F\vert_{z=-1}=0,\quad \left.\frac{\partial F}{\partial z}\right\vert_{z=h(x,t)}=0, \end{equation}
yielding
 \begin{equation} F=\tfrac{1}{2} (z+1) (-2 h+z-1), \end{equation}
and for  $\mathcal {W}$, we require
 \begin{equation} \frac{\partial^{2} \mathcal{W}}{\partial z^{2}}=0, \quad \mathcal{W}\vert_{z=-1}=0 \quad \mbox{and} \quad \left. \frac{\partial \mathcal{W}}{\partial z}\right\vert_{z=h(x,t)}=\mathcal{C}, \end{equation}
yielding
 \begin{equation} \mathcal{W}=\mathcal{C}(z+1), \end{equation}
where  $\mathcal {C}$ is an arbitrary constant. Because the weight functions, according to (4.19) and (4.21), correspond to the leading-order profiles $\hat {u}$ (4.12) and $\hat {T}$ (4.15), the weighted integration we have performed corresponds to a Galerkin projection.
As a result of these definitions, the boxed terms in (4.17a) and (4.17b) can be rewritten using integration by parts
 \begin{equation} \int_{-1}^{h} \frac{\partial^{2} }{\partial z^{2}}(\hat u+\tilde u) F\,{\rm d} z=\left[\frac{\partial (\hat u+\tilde u) }{\partial z} F-(\hat u+\tilde u) \frac{\partial F}{\partial z} \right]_{-1}^{h}+\int_{-1}^{h} (\hat{u}+\tilde{u}) \,{\rm d} z, \end{equation}
and
 \begin{equation} \int_{-1}^{h} \frac{\partial^2 }{\partial z^2}(\hat T+ \tilde T) \mathcal{W} \,{\rm d} z= \left[\frac{\partial(\hat T+\tilde T) }{\partial z} \mathcal{W}- (\hat T+\tilde T) \frac{\partial \mathcal{W}}{\partial z} \right]_{-1}^{h}. \end{equation}
Then, substituting (4.12), (4.13a–c), (4.15), (4.16), (4.19) and (4.21) into (4.17a) and (4.17b), we obtain the final integral momentum and energy equations of our WRIBL model
 \begin{align} &\epsilon Re\left\{\frac{18 q^2}{35}\frac{\partial h}{\partial x}-\frac{2\hbar^2}{5} \frac{\partial q}{\partial t} -\frac{34\hbar q}{35} \frac{\partial q}{\partial x}\right\}+\epsilon^2 {Re} Ma\left\{\frac{\hbar^2 q}{56}\left( \frac{3}{2}\hbar\frac{\partial ^2\theta }{\partial x^2} +\frac{\partial h}{\partial x} \frac{\partial \theta }{\partial x} \right)\right.\nonumber\\ &\qquad +\left.\frac{\hbar^3}{120}\left(\hbar \frac{\partial ^2\theta }{\partial x\partial t} +\frac{19}{7}\frac{\partial \theta }{\partial x} \frac{\partial q}{\partial x} \right)\right\} -\epsilon^3{Re}Ma^2\frac{\hbar^4 }{336}\frac{\partial \theta}{\partial x}\left\{\frac{19}{5}\frac{\partial h}{\partial x}\frac{\partial \theta}{\partial x}+\frac{5}{2}\hbar\frac{\partial^2 \theta}{\partial x^2}\right\}\nonumber\\ &\quad =q+\frac{\hbar^3}{3}\left\{\epsilon A \frac{\partial h}{\partial x} \cos (\omega t)-\frac{\epsilon ^3}{Ca}\frac{\partial ^3h}{\partial x^3}\right\}+\epsilon Ma\frac{\hbar^2}{2}\frac{\partial \theta }{\partial x}\nonumber\\ &\qquad +\epsilon ^2\left\{\frac{9 \hbar}{5} \left(\frac{\partial h}{\partial x} \frac{\partial q}{\partial x} - \frac{\partial ^2q}{\partial x^2} \hbar \right)+\frac{4 q}{5}\left(3\hbar \frac{\partial ^2h}{\partial x^2} -2 \left(\frac{\partial h}{\partial x}\right)^2\right)\right\}\nonumber\\ &\qquad +\epsilon^3Ma \hbar^2\left\{\frac{\hbar}{10}(3 \frac{\partial ^2\theta }{\partial x^2} \frac{\partial h}{\partial x} + \frac{\partial ^3\theta }{\partial x^3} \hbar)+\frac{1}{15} \frac{\partial ^2h}{\partial x^2} \frac{\partial \theta }{\partial x} \hbar-\frac{4}{5}\frac{\partial \theta }{\partial x} \left(\frac{\partial h}{\partial x}\right)^2 \right\}, \end{align}
and
 \begin{align} &\epsilon \left\{ \frac{1}{3} \hbar^2 \frac{\partial \theta}{\partial t}+\frac{7}{120} \hbar \frac{\partial q}{\partial x} (\theta-1)+\frac{9}{20} \hbar q \frac{\partial \theta}{\partial x} \right\}\nonumber\\ &\quad +\frac{\epsilon^2 Ma \hbar^2}{40}\left[(1-\theta)\left(\frac{1}{2} \frac{\partial \theta ^2}{\partial x^2} \hbar + \frac{\partial h}{\partial x} \frac{\partial \theta }{\partial x}\right) - \hbar\left(\frac{\partial \theta }{\partial x}\right)^2 \right]=1-\theta -\hbar(Bi \theta +1)\nonumber\\ &\quad -\epsilon^2\hbar\left\{\frac{(Bi \theta+1)}{2} \left(\frac{\partial h}{\partial x}\right)^2-\frac{1}{3} \frac{\partial ^2\theta }{\partial x^2} \hbar + \frac{(\theta-1)}{3}\left(\frac{\partial ^2h}{\partial x^2} +\frac{1}{\hbar}\left(\frac{\partial h}{\partial x}\right)^2\right)-\frac{1}{3} \frac{\partial h}{\partial x} \frac{\partial \theta }{\partial x} \right\}, \end{align}
where we have substituted  $\hbar = 1+h$. These equations are completed by the integral continuity equation
 \begin{equation} \frac{\partial h}{\partial t}+\frac{\partial q}{\partial x}=0, \end{equation}
obtained by integrating (4.1) from  $z=-1$ to $z=h(x,t)$, and invoking the interphase mass balance (4.5a). Thus, our final model (4.24) consists of a nonlinear system of three evolution equations in terms of the three unknowns $h(x,t)$, $q(x,t)$ and $\theta (x,t)$.
Observe that (4.24a) contains a mixed derivative,  $\partial _{xt}\theta$, at one place. The latter appears as a result of the base velocity profile $\hat {u}$ chosen in (4.12), and, in particular, as a result of retaining the leading-order Marangoni stress in the boundary condition (4.10a–c). We find that this choice greatly improves the linear stability predictions of our model. Neither in the linear stability calculations nor in the nonlinear computations (where we use a spectral method for spatial discretization) do the mixed derivative pose any numerical challenge.
4.3. Numerical procedure
Numerically, to solve the system of nonlinear equations, (4.24), we discretize variables in space along the horizontal direction using a Fourier spectral scheme (Hesthaven, Gottlieb & Gottlieb Reference Hesthaven, Gottlieb and Gottlieb2007). This automatically satisfies periodicity in the  $x$-direction, which is the setting considered in the current manuscript. In all our nonlinear computations, the domain length is set to the container width, $W$. Time integration is realized via the NDSolve function in Mathematica (version 12.1). Each of our nonlinear computations is started from an initial perturbation constructed with the eigenfunctions ${h'}|_{t=0}$, ${q'}|_{t=0}$, and ${\theta '}|_{t=0}$, defined according to (3.2), and obtained from a preliminary linear stability calculation for $\mathcal {A}=0$ and $Ma>Ma_{c}$. The initial deflection amplitude was set to be $5\,\%$ of the fluid depth. The grid resolution for our simulations was determined via grid independence tests by a stepwise doubling of the number of collocation points until the change in the minimum interface deflection, $h_{min}(t)$, was less than 1 $\%$.
$\%$.
4.4. Nonlinear suppression of dry spots
To validate our long-wave model (4.24), we start by reproducing the neutral stability bounds from figure 7. For this, we linearly perturb the dependent variables  $h(x,t)$, $q(x,t)$ and $\theta (x,t)$ according to (3.2), and solve the resulting eigenvalue problem to obtain the critical forcing amplitude, $\mathcal {A}$, at fixed $\omega$, $Ma$ and $\epsilon =0.003$, using the parameters in table 1. Results are represented in figure 9, where, as in figure 7, the dashed curve represents the monotonic instability mode ( $\hat {h}_0 \gg \hat {h}_n$ for all $n \neq 0$) and the solid curve represents the oscillatory instability mode ( $\hat {h}_n \gg \hat {h}_0$ for at least one $n \neq 0$). Agreement with the corresponding curves in figure 7 is excellent, due to the smallness of the chosen $\epsilon =0.003$, which warrants the long-wave approximation underlying our model.
Linear effect of parametric forcing on Marangoni instability, as predicted by the long-wave model (4.24). Critical forcing amplitude  $A^*$ versus forcing frequency $f^*$. The same parameters as in figure 7: $d^*=3$ mm; $\epsilon = d^*/W^*=0.003$; $Ma=1.4 Ma_c|_{k=2{\rm \pi} }$. Dashed curve, stability bound of monotonic mode ( $\hat {h}_0\gg \hat {h}_n$ for all $n \neq 0$); solid curve, stability bound for oscillatory modes ( $\hat {h}_n\gg \hat {h}_0$ for at least one $n \neq 0$). Numbers ( $m$) designate wavenumber $k = 2 m{\rm \pi}$ of critical spatial mode. For the chosen parameters, only $m=1$ yields an unstable Marangoni mode at $A^*=0$.

We next perform nonlinear computations based on (4.24) for parameters lying in the three characteristic regions of figure 9. In region I, the liquid film is always unstable to a Marangoni mode with  $m=1$, i.e. $k = 2{\rm \pi}$. Recall that, in this section, the wavenumber, $k$, is scaled by the container width, $W^{*}$, i.e. $k = k^{*} W^{*}$. In region II, the film is rendered linearly stable via parametric forcing. In region III, the film is always unstable to Faraday waves.
Figure 10 represents the time evolution of the film thickness profile,  $\hbar =1+h(x,t)$, in the limit $A^*=0$, where only the Marangoni instability is active. The value of the Marangoni number is $Ma=1.4 Ma_{c}\vert _{k=2{\rm \pi} }=25$. Here $k = 2{\rm \pi}$ is the only possible instability mode (cf. figure 2b), as a result of our choice for the container width, i.e. $\epsilon =0.003$. It is observed that the deflection of the film surface increases as time progresses, until the liquid–gas interface at the trough reaches the lower wall. The film surface buckles, forming two secondary troughs, which drastically slow down further draining of liquid from the trough region. As shown by Boos & Thess (Reference Boos and Thess1999) and Dietze, Picardo & Narayanan (Reference Dietze, Picardo and Narayanan2018), additional buckling events may follow (at higher $Ma$), but, eventually, the liquid film will always rupture due to spinodal dewetting (Bonn et al. Reference Bonn, Eggers, Indekeu, Meunier and Rolley2009). Thus, it is safe to say that the nonlinear evolution in figure 10, will lead to the formation of a dry spot, in accordance with the experimental observations of Vanhook et al. (Reference Vanhook, Schatz, Swift, McCormick and Swinney1997) for very thin liquid films. Supplementary movie 1 shows the evolution towards dry spot formation in action.
Nonlinear computation for parameters according to region I in figure 9:  $A^*=0$; $Ma=25$. Interface profile of dry spot formation at different times $t$. Dashed curve, $t=0$; dashed-dotted curve, $t=7$; solid curve, $t=14$. See also Supplementary movie 1, available at https://doi.org/10.1017/jfm.2024.58.

We now consider how the nonlinear evolution in figure 10 is altered by applying additional parametric forcing with increasing forcing amplitude,  $A^*$. For this, we consider two forcing frequencies, i.e. $f^*={1}$ Hz, which corresponds to the natural frequency at $m = 20$, and $f^*={1.56}$ Hz, which corresponds to the natural frequency at $m = 24$. We start by discussing our computations for $f^*={1}$ Hz which are represented in figure 11. At $A^* = 0.9 A^*_c$ (figure 11a), parameters lie in region II of figure 9, and our nonlinear computation indicates a full attenuation of the initial interface deflection. Thus, parametric forcing indeed allows us to obtain a perfectly flat film surface in this parameter range. Supplementary movie 2 shows the evolution towards flatness in action.
Nonlinear effect of parametric forcing on Marangoni instability. Numerical computations with WRIBL model (4.24), showing transition from regions II to III in figure 9:  $f^*={1}$ Hz; $Ma=1.4 {Ma_c}|_{k=2{\rm \pi} }$. Film surface profiles at different times $t$: dashed curves, $t=0$. (a) Linear suppression of surface deformations: $A^*=0.9 A^*_c$ (region $\mathrm {II}$ in figure 9). Dash–dotted curve, $t=45$; solid curve, $t=90$. (b) Saturated Faraday waves: $A^*=1.1 A^*_{c}$ (region $\mathrm {III}$ of figure 9). Dashed-dotted curve, $t=0.001$; solid curve, $t=0.002$. See also Supplementary movies 2 and 3. Here $A^*_c$ corresponds to solid curve in figure 9.

When the forcing amplitude is increased to  $A^* = 1.1 A^*_c$, which lies in region III of figure 9, Faraday waves appear. Here, the resonant action takes over and the interface develops $m=20$ waves per container width, as shown in figure 11(b). Although dry spot formation is still prevented under these conditions, we see that large interface deflections result from the parametric forcing. Supplementary movie 3 shows the formation of resonant waves in action.
A different picture emerges for the higher forcing frequency,  $f^*=1.56$ Hz, as shown in figure 12. It is known from figure 9 that linear stabilization of the liquid film cannot be achieved under these conditions, as the solid curve for the onset of oscillatory instability lies below the dashed curve demarcating stabilization of the monotonic instability mode. Nonetheless, figure 12(a) shows evidence of a very strong nonlinear saturation of the interface deflection at $A^* = 0.9 A^*_c$, even though this point lies in region I of figure 9. Here, the interface remains almost flat, notwithstanding that it is subject to the long-wave Marangoni instability mode, responsible for forming dry spots in the absence of forcing. Thus, dry spot formation can be prevented and the film can be rendered virtually flat also at higher forcing frequencies, albeit due to a nonlinear mechanism (figure 12a), in contrast to the linear mechanism observed at low frequencies (figure 11a).
Nonlinear effect of parametric forcing on Marangoni instability. Numerical computations with WRIBL model (4.24), showing transition from regions I to III in figure 9:  $f^*={1.56}$ Hz; $Ma=1.4{Ma_c}|_{k=2{\rm \pi} }$. Film surface profiles at different times $t$: dashed curves, $t=0$. (a) Nonlinear attenuation of surface deformations: $A^*=0.9 A^*_c$ (region $\mathrm {I}$ in figure 9). Dash–dotted curve, $t=2$; solid curve, $t=3.5$. (b) Saturated Faraday waves: $A^*=1.1 A^*_{c}$ (region $\mathrm {III}$ in figure 9). Dashed–dotted curve, $t=0.001$; solid curve, $t=0.002$. See also Supplementary movies 4 and 5.

This nonlinear saturation mechanism is associated with small standing waves or ripples forming on the main humps of the interface deformation. These are only slightly visible in figure 12(a), but their oscillatory motion can be distinguished clearly in the Supplementary movie 4. These standing waves or ripples form at the main humps or crests rather than the main troughs on account of the inertial action promoted by the height of fluid below the large deflecting crests. We believe that these standing waves are responsible for arresting further drainage of liquid from the deformation trough, as a result of a cellular flow pattern that develops underneath the deformation hump. This is seen in figure 13, which displays streamlines in the laboratory reference frame for the two cases from figures 10 and 12(a).
Change in flow structure within the liquid film. Streamlines in the laboratory reference frame for parameters corresponding to figure 10 and figure 12(a). (a) Dry spot formation (figure 10):  $A^*=0.1 A^*_c$; $Ma=1.4 Ma_c|_{k=2{\rm \pi} }$; and $f={1.56}$ Hz. (b) Nonlinear saturation due to parametric forcing (figure 12a): $A^*=0.9 A^*_c$; $Ma=1.4 Ma_c|_{k=2{\rm \pi} }$; and $f^*={1.56}$ Hz. Only one half of the domain is represented in each panel, for convenience.

Finally, we turn to figure 12(b), which shows that the nonlinear saturation of the surface deformation is lost, when the forcing amplitude is increased to  $A^* = 1.1 A^*_c$, where large-amplitude short Faraday waves form once again, as a result of oscillatory instability (see also Supplementary movie 5).
From an application point of view, one may ask at what forcing amplitude,  $A^*$, does the nonlinear saturation of the interface deflection set in? We have quantified this for the current parameters in figure 14, which represents time traces of the minimum film thickness, $\hbar _{min}=1+h_{min}$, for different subcritical (figure 14a) and supercritical (figure 14b) forcing amplitudes $A^*$, all other parameters remaining the same as in figure 12. Based on figure 14(a), we may conclude that a significant nonlinear attenuation of the interface deflection is achieved for $A^*/A^*_c \ge 0.7$.
Effect of relative forcing amplitude  $A' = A^*/A^*_c$ on long-time nonlinear evolution of the heated liquid film. Parameters according to figure 9: $f^*={1.56}$ Hz. Time traces of the minimum film thickness $\hbar _{min}=1+h_{min}$. (a) Nonlinear attenuation of surface deformation in region I of figure 9: $A' < 1$. From bottom to top: $A'=0$, 0.5, 0.6, 0.7, 0.8 and 0.9. (b) Saturated Faraday waves: $A' \ge 1$. From bottom to top: $A'=1.1$ and 1.

5. Summary
The interaction of parametric forcing and Marangoni instability is viewed from two perspectives. In the first perspective, we use linear stability analysis to conclude that parametric forcing will stabilize long-wave Marangoni instability but has little effect on short-wave Marangoni-driven waveforms. It is seen that a layer unstable to Marangoni flows may be completely stabilized by parametric forcing at low frequencies but becomes unstable to resonant waves at high amplitudes of forcing. However, at higher parametric frequencies, the fluid system directly transitions from an unstable Marangoni regime to an unstable resonant regime, thus circumventing the transition to a stable state.
In a second perspective, validation of the results of linear stability was done using a reduced-order nonlinear model that tracked the interface evolution in the presence of parametric forcing over a range of frequencies. In addition to recovering the results forecast by linear stability, this model shows that, at frequencies beyond a critical value, the resonant forcing subverts the subcritical nature of the long-wave nonlinear Marangoni instability, constraining the interface to a low-amplitude saturated form. This nonlinear saturation mechanism is due to the formation of vortices underneath the choppy Faraday waves excited by the parametric forcing. The vortices arising from these Faraday waves disrupt the thermocapillary flow that drains liquid from the global trough to the global hump. In some ways, this is similar to the suppression of dry spots by the short-wave Marangoni instability mode (Vanhook et al. Reference Vanhook, Schatz, Swift, McCormick and Swinney1997).
As it is known from experiments that long-wave Marangoni instability will lead to dry spots, we conclude that a major outcome of this study is that the evolution of the interface can be suppressed at both low and high frequencies, preventing dry-out.
Our observations were made for the case where gravity is absent. We conclude by assessing the effect of finite gravity. A finite gravitational acceleration,  $g$, acts on the large interface deflections and thereby stabilizes the long-wave Marangoni instability. Therefore, incrementing the value of $g$ for the calculation in figure 4(a) would shift the threshold of the long-wave Marangoni instability mode upwards, eventually leading it to surpass the minimum threshold of the short-wave mode (itself insensitive to gravity). It is below this limit, that the formation of dry spots is possible; and, in this regime, we find that the long-wave Marangoni instability mode remains highly sensitive to parametric forcing.
Supplementary movies
Supplementary movies are available at https://doi.org/10.1017/jfm.2024.58.
Funding
The authors gratefully acknowledge funding from the National Science Foundation via grant 2025117 and NASA via grants NNX17AL27G and 80NSSC23K0457. I.B.I. acknowledges support from a Chateaubriand fellowship.
Declaration of interests
The authors report no conflict of interest.
Appendix A. Supplement to figure 7: role of the wavenumber
In this appendix, we discuss the origin and implications of the cutoff frequency,  $f^* \sim {1.2}$ Hz, observed in figure 7, where the stability bounds of the monotonic and oscillatory instability modes intersect. To do this, the spatial confinement imposed by the finiteness of the container width, $W$, needs to be considered. We then represent the stability bounds in terms of $A^{*}$ versus $k$ curves for the parameters used in figure 7. These curves, depicted in figure 15, are drawn for two values of the forcing frequency, $f^*$, i.e. $f^*={1}$ Hz (diamonds) and $f^*={1.56}$ Hz (circles), which are situated on either side of the cutoff frequency. Dashed curves correspond to the monotonic and solid curves to the oscillatory instability modes. Figure 15(a) shows both bounds in the same diagram, while a magnified view of the monotonic instability bound, which is confined to a narrow wavenumber range, is provided in figure 15(b). Note that the flow is unstable, when $A^{*} =0$, to all wavenumbers less than $k_c$ denoted on figure 15(b) by an upward arrow. Likewise the system is quiescent for all allowable wavenumbers greater than $k_c$.
Effect of forcing frequency on the most unstable allowable waveforms and associated critical forcing amplitude for the monotonic ( $s$) and oscillatory ( $o$) instability modes. Critical $A^*$ versus $k$ curves for two frequencies from figure 7: $Ma = 1.4 Ma_c|_{k={2{\rm \pi} }/{W}}$; $1/W=0.003$. Diamonds, $f^*={1}$ Hz; circles, $f^*={1.56}$ Hz. Dotted vertical lines mark most-unstable allowable waveforms, identified by $m = W k/2 {\rm \pi}$ (given between parentheses). Panel (b) is a magnified view of the long-wave range in panel (a).

As a result of the fixed container width,  $1/W=0.003$, there is only one allowable unstable wavenumber, $k = 2\ m {\rm \pi}/W$, for the monotonic mode at the considered $Ma = 1.4 Ma_c|_{k={2{\rm \pi} }/{W}}$. This waveform, given by $m=1$, is marked by a vertical line in figure 15(b). At the corresponding wave number, the monotonic Marangoni instability mode can be suppressed by increasing the forcing amplitude, $A^*$, e.g. beyond the filled diamond in figure 15(b) for a forcing frequency of $f^*= {1}$ Hz. Observe that this value of $A^*$, denoted $A^*_s$ is less than $A^*_o$, the lowest amplitude for the allowable wavenumbers on the oscillatory curve. Upon increasing the frequency to $f^*= {1.56}$ Hz, the oscillatory curves shift substantially, while the monotonic curves shift only slightly. This shift in the oscillatory curves with frequency is characteristic of resonant instabilities (cf. Kumar & Tuckerman Reference Kumar and Tuckerman1994; Batson, Zoueshtiagh & Narayanan Reference Batson, Zoueshtiagh and Narayanan2013). The critical amplitude, $A^*_o$, diminishes with increasing forcing frequency (from open diamond to open circle in figure 15a), and does so at a greater rate than the stability bound of the monotonic mode (figure 15b). Consequently, the oscillatory instability bound eventually moves below the monotonic stability bound, implying the existence of a cutoff frequency, as observed in figure 7.
To see the effect of lateral confinement of the container, we observe that the allowable wavenumbers along the monotonic curve shift to the left with increase in container width. Likewise, the allowable wavenumbers in the oscillatory curve shift towards the minimum with increase in container width. This implies that there is a critical width for which  $A^*_s = A^*_o$ for a fixed parametric frequency, $f^*$. Below this width, unstable Marangoni flow can be completely stabilized. Above this width, the Marangoni instability transitions to resonant waves with an increase in forcing amplitude. Consequently, at fixed supercritical $Ma$, stabilization cannot be achieved in the unconfined case, no matter how large the forcing amplitude. A finite container width is thus a prerequisite for the existence of the dashed curve in figure 7.
In summary, there are two prerequisites for the occurrence of a cutoff frequency. First, the coexistence of monotonic and oscillatory instability modes, and, second, a finite lateral confinement. We point out that these prerequisites can be satisfied also by other interfacial instability problems. For example, critical  $A^*$ versus $k$ curves similar to figure 15 are seen in parametric stabilization of Rayleigh–Taylor instability (Sterman-Cohen et al. Reference Sterman-Cohen, Bestehorn and Oron2017). Therefore, one might expect to obtain a regime diagram similar to figure 7 also in that case.
Appendix B. Effect of an active upper air layer
The stability calculations reported in the main body of this manuscript rely on assuming a hydrodynamically passive and purely conducting upper fluid layer. In this appendix, we assess the validity of this assumption by checking how an active upper gas layer, such as air, affects the stability bounds represented in figure 7. That figure contains several of our key findings related to the effect of parametric forcing on the Marangoni instability.
The additional stability calculations are performed based on the full governing equations in the liquid film and upper air layer, following Smith (Reference Smith1966) and Kumar & Tuckerman (Reference Kumar and Tuckerman1994). The standard properties of air (subscript  $a$) at ambient pressure and temperature are used. Further, the air-to-liquid depth ratio is set to $d^*_a/d^*=2$, which follows from the value of $Bi = \mathcal {H}d^*/\lambda = 0.1$ used throughout the study, assuming $\mathcal {H} = \lambda _a/d^*_a$. The results of the calculations are presented in figure 16, where all other parameters correspond to figure 7. The differences between figures 16 and 7 are extremely small, less than 1 %, which warrants the assumption of a hydrodynamically passive and purely conducting upper gas layer.
Neutral stability bounds according to figure 7 for the case of an active upper air layer, as obtained from calculations based on the full governing equations in the liquid and air, following Smith (Reference Smith1966). Air parameters:  $d^*_a/d^*=2$; $\rho _a=1$ kg m $^{-3}$; $\mu _a=1.6 \times 10^{-5}$ Pa s; $\lambda _a={0.026}$ W m $^{-1}$ K $^{-1}$; $C_{pa}={1}$ J kg $^{-1}$ K $^{-1}$. The air-to-liquid depth ratio, $d^*_a/d^*=2$, follows from the value of $Bi = \mathcal {H}d^*/\lambda =(\lambda _a d^*)/(\lambda d^*_a) =0.1$ used in figure 7. All other parameters according to figure 7: $Ma = 1.4Ma_c\vert _{k={2 {\rm \pi}}/{W}}$; $1/W=0.003$.

The weak effect of the upper air layer on our key observations results from the low density and viscosity of air. As a result of this, the upper layer cannot meaningfully affect the inertia-driven Faraday instability and the inertia-driven stabilization of the long-wave Marangoni instability, which dictate the thresholds represented in figures 7 and 16.
Appendix C. Validity of the long-wave approximation underlying the WRIBL model
Figures 12 and 13(b) show evidence of shorter choppy waves and associated vortices within the liquid film. The question may arise as to whether the long-wave approximation underlying our WRIBL model is still valid for these regimes. The horizontal length scale of the said structures is dictated by the wavelength,  $\varLambda ^*$, of the most-amplified Faraday mode, which is quantified via the number between parentheses in figure 9, i.e. the number of waves, $m = W^*/\varLambda ^*$, within the container width $W^*$. Thus, we evaluate the maximal length scale ratio, $\epsilon _{max} = d^*/\varLambda ^* = \epsilon m$, based on the wavelength of the Faraday waves in figure 12, where $m=24$. This yields $\epsilon _{max} \sim 0.1$, which is generally small enough for an $O(\epsilon ^2)$ long-wave WRIBL model, such as ours, to yield accurate predictions.
We demonstrate this for our specific configuration by comparing the linear stability predictions obtained with our WRIBL model with predictions based on the full governing equations. First, we compare the stability bounds in figure 9, which are obtained from our WRIBL model, with those in figure 7, which are obtained from the full governing equations. The stability bounds are in good agreement and only differ by less than 1 %.
Second, we compare the growth rate curves (figure 17) obtained with the two approaches for the parameters in figure 12(b). We again observe very good agreement over the entire relevant range of the wavenumber,  $k$, including and far beyond the most-amplified wavenumber, which prevails in our nonlinear calculations (figure 12b).
Validation of the WRIBL model versus linear stability calculations based on the full governing equations. Growth rate dispersion curves for the parameters in figure 12(b):  $f^*={1.56}$ Hz; $Ma = 1.4{Ma_c}|_{m=1}$, where $m=1$ corresponds to the first allowable wavenumber. Solid curve, full governing equations; dot–dashed curve, WRIBL model.


 Open access