


Breakfast is considered to be an essential meal of the day, providing valuable nutrition to growing children(Reference Affinita, Catalani and Cecchetto1). However, while many studies acknowledge the importance of children eating breakfast(Reference Affinita, Catalani and Cecchetto1–Reference Adolphus, Lawton and Dye3), the breakfast foods that are marketed for consumption by children need further investigation. Ready-to-eat cereals (RTEC) are a convenient breakfast food, with the potential to offer a nutritious breakfast; something that is essential given reports that up to two-thirds of children do not meet the minimum serving requirements for grains and cereals(4). Indeed, recent studies report that RTEC may comprise up to 50 % of all breakfasts consumed by those under 18 years of age(Reference Deshmukh-Taskar, Nicklas and O’Neil5,Reference Fayet-Moore, McConnell and Tuck6) , although up to one-third of children and adolescents do not eat breakfast on a regular basis(Reference Huang, Hu and Fan7,Reference Morgan, Zabik and Stampley8) . In children, regular breakfast consumption is associated with lower levels of overweight and obesity(Reference Veltsista, Laitinen and Sovio9,Reference Szajewska and Ruszczyński10) and improved academic performance in the classroom(Reference Adolphus, Lawton and Dye3).
There has been a rapid increase in recent years in the availability, range and variety of RTEC, with marketing of many of these designed to appeal to children and their caregivers(Reference Kent, Rudnicki and Usher11). One study from Germany that followed 7800 children aged 2–18 years reported that there had been a reduction in bread-based breakfasts and an increase in the consumption of RTEC since 1986(Reference Alexy, Wicher and Kersting12). Other studies have also reported that RTEC comprise a large proportion of all breakfasts consumed by children(Reference Morgan, Zabik and Stampley8,Reference Affenito, Thompson and Dorazio13) , with one US study suggesting that more than 50 % of breakfasts consumed were RTEC(Reference Deshmukh-Taskar, Nicklas and O’Neil5). Importantly, it has been reported that children from different world regions do tend to consume similar combinations of healthy and unhealthy foods, irrespective of the fact that the food culture, ethnicity and level of economic development can differ(Reference Mikkilä, Vepsäläinen and Saloheimo14).
Despite their popularity, the nutritional value of RTEC is frequently questioned, primarily because RTEC are often energy dense, with little fibre(Reference Louie, Dunford and Walker15,Reference Goglia, Spiteri and Menard16) . Of particular concern are those RTEC formulated and targeted specifically at children. Data from New Zealand(Reference Devi, Eyles and Rayner17,Reference Chepulis, Hill and Mearns18) and Australia(Reference Louie, Dunford and Walker15,Reference Tong, Rangan and Gemming19) suggest that children’s RTEC generally exhibit a poorer nutritional profile than other RTEC categories, with significantly high levels of sugar and fat(Reference Louie, Dunford and Walker15,Reference Williams20,Reference Louie, Moshtaghian and Rangan21) . In addition, while smaller than usual serving sizes are suggested on children’s RTEC by the manufacturer(Reference Louie, Dunford and Walker15,Reference Chepulis, Hill and Mearns18) , these are rarely used by consumers to inform actual portion size(Reference Faulkner, Pourshahidi and Wallace22).
Countries like the USA, Canada, the UK, Australia and New Zealand use voluntary regulation of the food industry, and such regulatory control has been shown to effectively improve the nutritional profile of children’s RTEC in the USA(23). Between 2006 and 2016 the total sugar content of children’s RTEC included in the Children’s Food and Beverage Advertising Initiative (CFBAI) was halved, with 35 % of all cereals containing less than 35 % sugar(23). In contrast, studies in New Zealand and Australia suggest that voluntary regulation has done little to improve the nutritional profile of children’s RTEC in recent years(Reference Louie, Dunford and Walker15,Reference Chepulis, Hill and Mearns18) .
Currently, there is minimal research on how the nutrient profile of RTEC compares across different countries, particularly those products targeted for consumption by children. Thus, the aim of the current study was to compare the nutrient profile, package size and recommended serving size of children’s breakfast cereal products sampled from five different English-speaking Western countries (Australia, Canada, New Zealand, the UK and the USA).
Methods
Product identification and collection
Package size and nutritional information data were collected from the Nutrition Information Panels (NIP) of children’s RTEC from supermarkets in Australia, Canada, New Zealand, the UK and the USA. Children’s RTEC were defined as being all those which included cartoons or characters (fictional) on the packaging, or enclosed games or cards (or provided online access)(Reference Tong, Rangan and Gemming19). Additional criteria included affiliation or promotion of non-fictional characters such as sport stars, toy animals, advertising of bite size or child size pieces, and obvious advertising towards children such as use of character names and font. Cereals were also included if they were located in the category of children’s cereals in online shopping, although all were manually checked to see if they met the above criteria for inclusion. RTEC that included enclosed cards or games that did not meet at least one of the other criteria above were deemed to not be a product designed for children and were excluded.
The supermarkets chosen for data collection represented the major supermarket retailers in each country and nutrient data were collected from all cereals within the chosen supermarket stores. In New Zealand, data were collected from Countdown, Pak ‘N’ Save and New World (both instore and online) in Rotorua between November 2017 and January 2018. The Australian and UK data were obtained from The George Institute for Global Health’s FoodSwitch food composition database. In Australia, the data were periodically collected between July and September each year from 2013 to 2017 from four retail supermarket stores in Sydney, Australia (ALDI, Coles, IGA, Woolworths), and also obtained through crowdsourcing using the FoodSwitch Data Collector App during the same time period(Reference Trevena, Neal and Dunford24). Data from the UK included data collected from nine different supermarket chains inGreater London and the surrounding areas (including ASDA, Sainsbury’s, Tesco, Marks & Spencer’s, Co-Operative Food, Morrisons, Waitrose, Aldi and Lidl) between 2013 and 2017. These data were also collected through crowdsourcing using the FoodSwitch Data Collector App and were stored in the UK FoodSwitch online database. For both Australia and the UK, data were obtained from the FoodSwitch database after it had been updated in 2017. Data collected using apps (Australia and the UK) were also supplemented by checking online shopping stores (during January and February 2018). These included Coles (Australia), as well as Tesco’s and Sainsbury’s (UK).
Canadian and US data were collected by accessing online shopping websites between January and March 2018. Canadian data were obtained from Zehr’s and Loblaws, and US data were collected from Walmart, Kroger, Target, Harris Tetter and HyVee. Online shopping websites were restricted to supermarket chains with physical stores and excluded multi-commerce websites such as Amazon that sell online only. Canadian data were collected from websites with a Canadian domain name; US data were collected from websites with a .com suffix.
For all products sourced online, the NIP content was taken directly from the supermarket websites. Approximately 10 % of the online products were then checked for accuracy against the nutritional information available on the manufacturer or retailer websites.
Initially all products, including products with multiple packet sizes, were retained for each country, although the same products in different stores were identified as duplicates and were removed to allow an assessment of package size per country. Following this, identical products of differing sizes were then removed from the data set to leave only one of each type of product (unless the nutritional information differed across different pack sizes). Where possible, any missing data (ingredients or nutritional information) were later added to the spreadsheet by checking the product labels in question, either by viewing the product in the supermarket (where possible) or on the manufacturer website.
For each product, the following data were recorded from the product labels: brand name, product name, energy (kcal or kJ), protein, fat, saturated fat, carbohydrate, sugar and fibre content (all g/100 g), Na content (mg/100 g), ingredients list, manufacturer-declared serving size and number of servings per pack. Energy recorded in kilocalories was converted to kilojoules for analysis using a conversion factor of 4·2. Where the amount of a nutrient was recorded as <1 g or <0·1 g, it was entered into the spreadsheet as 0·5 g or 0·05 g, respectively. For values where the nutrient value was not reported (e.g. the fibre content was not reported on all labels), this was left blank in the datasheet. Where applicable, salt (g) was converted to Na content (mg) by multiplying by a conversion factor of 400.
Data analyses
Package size
The median package size and interquartile range were compared across countries for all products, and then separately within countries for products with and without promotional characters. Promotional characters were defined as cartoons, animals or characters (fictional or non-fictional). The number of products with package size of ≥750 g was also recorded for each country.
Nutritional content
Median and interquartile range values of manufacturer-declared serving size, as well as total energy (kJ), total protein, fat, saturated fat, carbohydrate, sugar, Na and fibre content per manufacturer-declared serving size, of all products and for all countries, were calculated using the per 100 g data.
The number of products with added sugars was also determined by reviewing the ingredients lists for all products. Added sugar was defined as sugar, cane sugar/juice, glucose–fructose syrup, dextrose, fructose, corn syrup, honey, golden syrup, glucose syrup and/or sucrose. Products were then divided into five separate categories for analysis. These included one category for no added sugar and four categories for added sugar: <5 %, 5–10 %, 10·1–20 % or >20 % sugar.
A comparison between the nutritional quality of products with and without promotional characters from each country was determined by analysing the median nutritional information (g/100 g) of products within each country.
Product nutritional information was then used to calculate the Food Standards Australia New Zealand (FSANZ) Nutrient Profile Scoring Criterion (NPSC)(25) for each RTEC as described previously with both Australasian(Reference Devi, Eyles and Rayner17,Reference Chepulis, Hill and Mearns18) and international data(Reference Kaur, Scarborough and Matthews26,Reference Franco-Arellano, Labonté and Bernstein27) . In brief, the NPSC score uses nutrient information (fat, sugar, sodium, protein, fibre and fruit/vegetable content) to produce an overall product score which can be used to determine if the product can carry a health claim. Products with a score of <4 are deemed to be ‘healthy’ (and can carry a health claim) while those with an overall score of ≥4 are considered to be ‘less healthy’. In the current study, the proportion of children’s breakfast cereals with and without promotional material in each country, as well as the proportion of total products in each country that each achieved an NPSC score of ≥4 (‘less healthy’), were compared.
Statistical analysis
Data were organized and processed in Microsoft® Excel 2016. Statistical analyses were performed using the statistical software package IBM SPSS Statistics version 24. As most variables were not normally distributed, category-level summary statistics are reported as median and interquartile range. Kruskal–Wallis tests with Dunn post hoc analysis were used to determine variance between countries for package size and for nutritional information. Mann–Whitney U tests were used to compare the difference in package size and nutritional quality with and without the presence of promotional characters (within countries). The χ 2 test was used to assess differences between countries for the proportion of products of large package size (≥750 g) and to compare the proportion of products with an NPSC score of ≥4.
Given the number of comparisons made, significance was accepted at P ≤ 0·01.
Results
Package size
Initially 636 products were collected including seventy-six from Australia, forty-seven from New Zealand, 123 from the UK, 283 from USA and 107 from Canada (Table 1). Overall, the median package size was larger in Canada (510 g) than all other countries (400–425 g; H = 12·48, P = 0·014) although no other differences were observed. Package size was not statistically different across countries for products that contained promotional characters. In contrast, median package size was larger in Canada and the UK for products without promotional characters compared with other countries (Table 1). No statistically significant difference was noted for the median product size with and without promotional materials within a particular country.
Package size of the children’s breakfast cereals (n 636) sampled from supermarkets in five different Western countries, 2013–2018
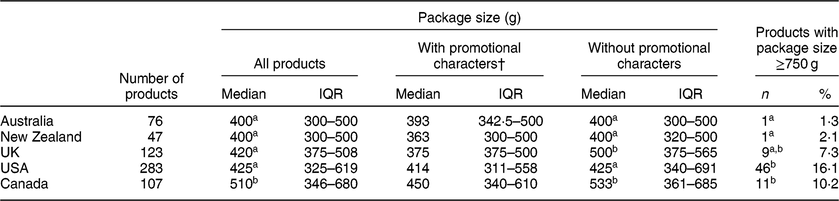
IQR, interquartile range.
a,bValues within a column unlike superscript letters were significantly different (P ≤ 0·01).
† Includes cartoons, animals or characters (fictional or non-fictional).
Overall, the USA had a greater portion (16·1 %) of children’s breakfasts cereals available in large package sizes ≥750 g (χ 2 = 21·26, P = 0·0002; see Table 1). This was significantly higher than New Zealand (2·1 %; P < 0·01) and Australia (1·3 %; P < 0·001) but not the UK (7·3 %) or Canada (10·2 %).
Nutritional content
After removal of multiple package sizes, a total of 491 products were available for analysis (Table 2). Manufacturer-declared serving size was consistent across all countries, with a median of 30 g for each country. No statistical differences were observed between countries for median energy per serving. Additionally, small but statistically significant differences were observed for other nutrients. The median fat content per serving was significantly lower in Australia and New Zealand cereals compared with the UK, USA and Canada (all P ≤ 0·01). However, the median sugar content per serving was significantly higher in US cereals (10·0 v. 7·7–9·1 g for other countries; H = 79·6, P < 0·0001).
Nutritional information per manufacturer-declared serving size of the children’s breakfast cereals (n 636) sampled from supermarkets in five different Western countries, 2013–2018
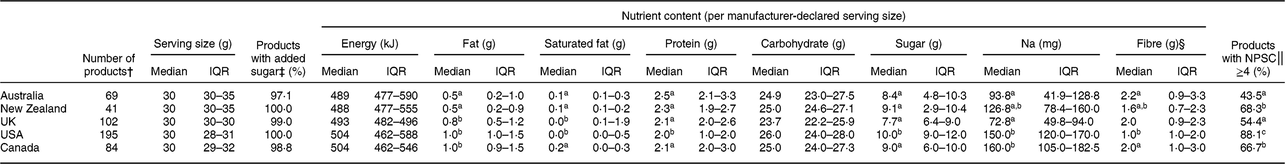
IQR, interquartile range.
a,b,cValues within a column with unlike superscript letters were significantly different (P ≤ 0·01).
† Excluded multiple products of different package sizes within each country.
‡ Includes sugar, cane sugar/juice, glucose–fructose syrup, dextrose, fructose, corn syrup, honey, golden syrup, glucose syrup and/or sucrose.
§ n 59 for Australia and n 33 for New Zealand due to missing data on Nutrition Information Panels.
‖ NPSC = Nutrient Profile Scoring Criterion as calculated using the Food Standards Australia New Zealand online calculator(25).
Almost all children’s RTEC from all five countries contained added sugar (Table 2). Of the 195 US children’s cereals included in the analysis, 10 % of all products (n 19) listed sugar first on the ingredients list indicating that it was the predominant ingredient used in that product. In contrast, no products from Australia, New Zealand or the UK listed sugar as first ingredient, and only three from Canada (3·8 %). Similarly, the USA had a significantly larger proportion of products that contained >20 % sugar (89·7 v. 57·1–74·5 % for other countries; χ 2 = 39·98, P < 0·0001; see Table 3). Nearly twice as many RTEC in New Zealand than in Australia (both n 10) contained 5–10 % sugar (24·4 v. 14·5 %; χ 2 = 10·95, P = 0·0009).
Number of products with differing levels of sugar in the children’s breakfast cereals (n 636) sampled from supermarkets in five different Western countries, 2013–2018
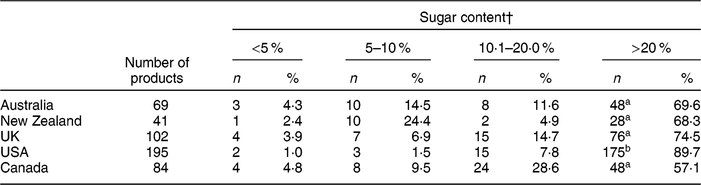
a,bValues within a column with unlike superscript letters were significantly different (P < 0·0001).
† Sugar content is calculated as grams of sugar per 100 g of product and expressed as percentage of the total product.
Median Na levels also differed significantly between countries (H = 125·2, P < 0·0001). Na levels were lowest in UK (72·8 mg) and Australian (93·8 mg) products, this being half that observed in the USA (150·0 mg; both P < 0·001) and Canada (160·0 mg; both P < 0·001; see Table 2). The median Na content of New Zealand RTEC (126·8 mg) was not significantly different from any other country.
Fibre content was not listed on ten out of sixty-nine Australian and eight out of thirty-three New Zealand product NIP, but it was included on all NIP from the UK, USA and Canada. For those products available for analysis, the median fibre content was significantly lower (H = 18·71, P < 0·001) in US products (1·0 g/100 g) than for Canadian (2·0 g/100 g) or Australian (2·2 g/100 g). The fibre content of products in the UK (2 g/100 g) and New Zealand (1·6 g/100 g) was not significantly different compared with any other countries.
The proportion of products with an NPSC score ≥4 differed significantly between countries (χ 2 = 72·29, P < 0·00001; see Table 2). The proportion of products with a score ≥4 was lowest in Australia (43·5 %) and the UK (54·4 %). In contrast, nearly twice as many products in the USA were deemed to be ‘unhealthy’, with 88·1 % of products having a score of ≥4 (see Table 2).
Effects of promotional material use on nutritional quality
The use of promotional characters on children’s RTEC is reported in Table 4. No differences were observed between products with and without promotional characters for all nutrients assessed in the USA, Australia and New Zealand. However, a small number of differences were noted for other countries. In the UK, the median carbohydrate content was lower in products without promotional material (78·0 v. 73·0 g/100 g; P = 0·002), while the protein content was not significantly higher (P = 0·03). In the present study we used a P ≤ 0·01 cut-off due to the large number of comparisons. In Canada, the median sugar content was higher in products that contained promotional material (30·0 v. 22·8 g/100 g; P = 0·007).
Nutritional information (per 100 g of product) of products with (YES) and without (NO) promotional characters for the children’s breakfast cereals (n 636) sampled from supermarkets in five different Western countries, 2013–2018
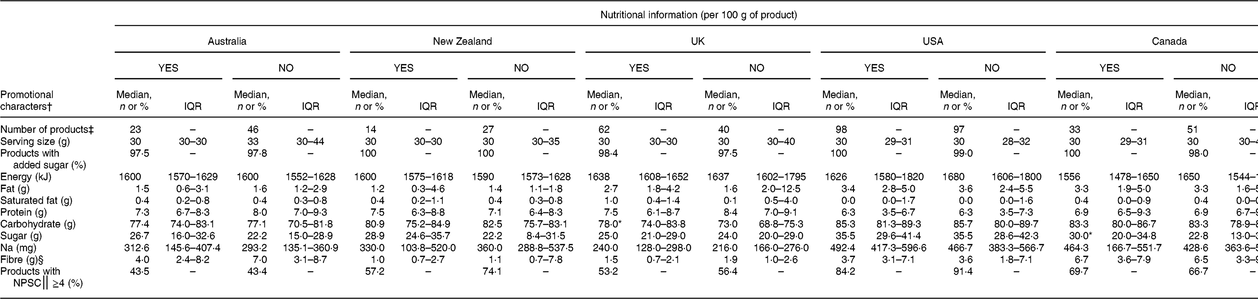
IQR, interquartile range.
* P < 0·01 v. products without promotional material within the same country.
† Included cartoons, animals or characters (fictional or non-fictional).
‡ Excluded multiple products of different package sizes within each country (one product of each was retained in the data set).
§ Calculated for products where fibre content was present in the Nutrition Information Panel.
‖ NPSC = Nutrient Profile Scoring Criterion as calculated using the Food Standards Australia New Zealand online calculator(25).
Discussion
The present study compared the nutrient profile, package size and recommended serving size of children’s RTEC, sampled across five countries: Australia, Canada, New Zealand, the UK and the USA. The results of our study suggest there are some significant differences in the nutritional profile of children’s breakfast cereals in the five countries studied. Overall, the UK had the lowest total sugar and salt in the RTEC, when compared with the other four countries. This may reflect successful measures such as the industry voluntary reduction of salt and sugar content in UK pre-packaged foods, including cereals(Reference He, Brinsden and MacGregor28). Virtually all products from all countries contained added sugars, with the median sugar content ranging across countries from 7·7 to 10·0 g/serving.
Products from the USA contained a significantly higher median sugar content than the other countries with a correspondingly higher proportion of products with >20 % sugar. Importantly, the US CFBAI, a voluntary advertising self-regulation programme that represents the majority of companies responsible for child-directed food advertising in the USA, reported significant reductions in the sugar content of children’s breakfast cereals, with no products containing more than 10 g of sugar per 1 oz serving (equivalent to 28·4 g) in 2016(23). Our results suggest that half of all US RTEC surveyed contained at least 10 g of sugar per serving (median serving size 30 g) with 18/195 (9·3 %) of products being comprised of at least 50 % sugar, so the findings in our study differ from the CFBAI’s reported sugar reductions in children’s breakfast cereals. It must be noted that the CFBAI comprised only eighteen companies as of September 2018, many of whom are not producers of RTEC (e.g. McDonald’s and Coca-Cola)(29), so the CFBAI is likely reporting on only a small number of RTEC. However, the CFBAI programme does suggest that voluntary self-regulation of the industry can still make valuable improvements to the nutritional profile of foods, as the amount of sugar in the products included in their data set was successfully halved between 2006 and 2016(23).
Very few other voluntary changes appear to have been undertaken (or at least actively promoted) in the other countries included in our study. One major cereal manufacturer in the UK (Kellogg’s™) announced in November 2017 that it would be decreasing the sugar content of several of its children’s breakfast cereals by up to 40 %(30) following changes to government sugar content recommendations(31). While this does not apply to all Kellogg’s products, and those deemed to be ‘adult cereals’ are exempt from these reformulations, the company is also taking the lead on other strategies to better inform consumers of the sugar content, including the use of a traffic light label(Reference Hoggan32). However, currently this appears to be a UK-based policy only and this reformulation does not appear to be actioned into the manufacturer’s products in other countries, despite the fact that this company produces RTEC worldwide. It is possible that the drive towards this RTEC reformulation is being driven more by government regulations and the possibility of sugar taxation than any industry self-regulation policy, and this needs to be explored further. Additionally, the progress to change observed in the UK may also be a result of less industry resistance to change as improved nutritional profiles have also been observed in other UK products (e.g. sugar-sweetened beverages) compared with other countries(Reference Chepulis, Mearns and Hill33). In contrast, countries such as the USA are often considered to be driven more by corporate growth rather than the need to improve health and well-being(Reference Nestle34), and as such there is often significant industry resistance to product reformulation and regulation. Certainly, the impact of food politics needs to be explored and future studies are needed to evaluate if voluntary formulation changes such as those outlined above impact upon sales, consumption and/or nutrient intake.
Data from the 2011–2012 Australian Health Survey show that breakfast cereals contribute 3 % of both added sugars and free sugars to the diet per capita(35) although recent data suggest that this varies dramatically depending on whether a cereal contains low or higher levels of sugars. Of 1269 children aged 2–18 years, 38 % consumed cereal sweetened with ≥15 % sugar, which contributed 22·2 % of mean daily energy intake. In contrast, those consuming lower-sugar cereals ingested significantly lower quantities of sugar, even when adjusted for added sugars such as milk, honey and fruit(Reference Fayet-Moore, McConnell and Tuck6). Similar findings were also reported in a US study where it was shown that children will readily consume breakfast cereals that contain low sugar (1–4 g per serving) when offered against higher-sugar options (11–12 g per serving) with the option of added sugar and fruit(Reference Harris, Schwartz and Ustjanauskas36). The children in that study (aged 5–12 years, n 91) reported no significant difference in how much they liked the cereal and the total amount of refined sugar consumed overall in this breakfast meal was still halved in those in the low-sugar cereal group (12·5 v. 24·4 g)(Reference Harris, Schwartz and Ustjanauskas36). It was also reported that children tend to consume large portion sizes of high-sugar cereals (61 v. 35 g for the low-sugar cereal)(Reference Harris, Schwartz and Ustjanauskas36) and this likely also contributes to the higher total sugar consumption seen with these RTEC, particularly given that ‘portion distortion’ leads to the majority of consumers eating more than recommended serving sizes of cereal(Reference Schwartz and Byrd-Bredbenner37) and the fact that manufacturer-declared serving sizes are rarely used to inform actual portion size(Reference Faulkner, Pourshahidi and Wallace22).
The results of the present study suggest that there may be some influence of promotional material on the nutritional quality of some products. Canadian RTEC contained significantly more sugar when promotional materials were present on the box, and numerically higher median sugar contents were also noted for Australia (+4·5 g) and New Zealand (+6·7 g) compared with products without promotional material. Many studies report on the effectiveness of using promotional material towards children to influence purchasing behaviour(Reference Devi, Eyles and Rayner17,Reference Harris, Schwartz and Brownell38–Reference Page, Montgomery and Ponder41) and the findings are similar to our study results where products with promotional characters on the packaging are less healthy(Reference Devi, Eyles and Rayner17,Reference Hebden, King and Kelly39,Reference Page, Montgomery and Ponder41) . Further, it has been reported that high-sugar/low-fibre breakfast cereals are more frequently promoted than healthier options(Reference Kent, Rudnicki and Usher11). These studies, along with our own findings, suggest that more emphasis needs to be placed on regulations governing marketing of foods to children. These restrictions are in place for television advertising(Reference Boyland and Halford42,Reference Adams, Tyrrell and Adamson43) but need to be extended to a wider range of marketing methods.
The Na content of cereals in the USA and Canada was significantly different from that in other countries, being approximately 60–120 % higher, respectively, than those in Australia and the UK. In the NPSC health rating, products score incremental unhealthy points for Na content of >90 mg/100 g up to 900 mg/100 g of product. Only RTEC in the UK attained this <90 mg/100 g level with a median Na content of 72·8 mg/100 g of product, while products from Australia (93·8 mg/100 g), New Zealand (126·8 mg/100 g), the USA (150·0 mg/100 g) and Canada (160·0 mg/100 g) exceeded the cut-off for a healthier NPSC Na score(Reference Devi, Eyles and Rayner17). Given that children worldwide consume excess salt each day and that a significant percentage of children’s daily salt intake (36 % of the reference daily intake) has been identified as coming from bread and cereals, there is room for improvement on the Na content of these RTEC. The lower salt content in UK RTEC may reflect the successful UK voluntary salt and sugar reduction programme, implemented to gradually reduce salt consumption to no more than 3 g/d per person by 2025(Reference Kelly, Hattersley and King40). While this reduction is applied across a range of pre-prepared foods, over a 7-year period salt intake in breakfast cereals decreased by 56 % which is very encouraging(Reference Kelly, Hattersley and King40).However, it is not clear how this salt reduction applies across RTEC marketed to children.
The lower Na content of RTEC may have influenced the significant difference in NPSC values across countries, with Australia (43·5 %) and the UK (54·0 %) having the lowest proportion of products with a less healthy NPSC of ≥4 compared with the USA (88·1 % of products having a score of ≥4). However, even in Australia and the UK, this is a worrying percentage of RTEC cereals marketed to children that do not meet the NPSC definition of a healthy product. Further research is warranted on whether consumption of these RTEC in children negates the previous reported benefits of breakfast consumption: a lower risk of overweight and obesity(Reference Veltsista, Laitinen and Sovio9,Reference Szajewska and Ruszczyński10) and a higher level of academic performance in the classroom(Reference Adolphus, Lawton and Dye3).
To our knowledge the present study is the first of its kind to comprehensively compare the nutrient profile of RTEC marketed to children across five Western countries; however, there are some limitations to the study. First, the data were obtained from both in-store and online NIP labels and there may have been discrepancies between these and the actual nutrient content of a product(Reference Fitzpatrick, Arcand and L’Abbe44,Reference Fabiansson45) . Second, there were differences in how the data were collected in different countries. Australian and UK data were obtained primarily from an established database (which was collected in-store using an app), New Zealand data were mostly collected in-store, while Canadian and USA data were collected online only. We tried to mitigate these differences by also checking the online grocery stores in Australia, the USA and New Zealand, but it is possible that the data collected in the present study do not accurately reflect the products available throughout these countries, particularly for Canada and the USA where no stores were physically visited. This may also partially explain the different sample sizes recorded for each country and any future studies should ideally aim to use a more consistent method of data collection, i.e. if the same app used to collect the Australian and UK data could be used in other countries, including from multiple regions and from smaller stores. Realistically, though, collection of large data sets across multiple countries is a difficult and costly process, and within such constraints can often only be achieved through the use of trusted data repositories(Reference Mbuagbaw, Foster and Cheng46). Additionally, we also note that NIP labels do differ between countries and this may also have led to some misinterpretation of our data. The influence of these different NIP labels is likely to be low, however, as all data were thoroughly cleaned and checked for inconsistencies and missing data prior to analysis (e.g. some nutrient information, such as fibre content, was missing from some product NIP labels). Importantly, we also used the NPSC tool to calculate whether products were ‘healthy’ or ‘less healthy’ and this is a tool that was initially designed for foods in Australia and New Zealand. Other countries do have their own scoring systems to rank foods based on their nutritional composition(Reference Romero-Fernandez, Royo-Bordonada and Rodríguez-Artalejo47–Reference Scarborough and Rayner49), but these can be misleading, using terms such as ‘nutrient-dense’ as a synonym for ‘healthier’ without actually quantifying how healthy or unhealthy the products is(Reference Scarborough and Rayner49). The NPSC tool has been used and reported on in many studies, including in the UK(Reference Kaur, Scarborough and Matthews26) and Canada(Reference Franco-Arellano, Labonté and Bernstein27), and potentially it can be applied to any nutritional data so long as quantified nutrient information is available. Also, RTEC were analysed alone, but in reality they are consumed with other foods such as fruit, milk, yoghurt or sugars which then alters the nutritional profile of the breakfast meal consumed. They are also an important source of vitamins and minerals through product fortification(Reference Hennessy, Walton and Flynn50), and our analysis did not include any of these variances.
Conclusions
Across all countries, there was a high proportion of RTEC marketed for children that did not meet the NPSC definition of a healthy product eligible to make health claims. The majority of RTEC contained added sugars, with many exceeding recommendations for free and added sugars. For countries such as the USA and Canada, the median Na content was also higher than the NPSC maximum Na content required for a healthier product for Na content. Strategies, regulations and policies are needed to improve the nutrient value of RTEC for children, so they provide a breakfast food that meets nutrition guidelines. These include limiting the percentage of added sugar in the products and complying with nutrition guideline recommendations for minimum fibre and maximum Na content for cereals. Research supports that consumption of breakfast cereals confers positive health benefits for children. However, these benefits will not be realised if the formulations of RTEC marketed for children do not meet the criteria for a healthy product, nor if promotion and marketing of these products to children is not limited, as this is currently not restricted as is advertising. Lastly, research is needed on the difference that fiscal regulation can make to the formulation of RTEC, particularly in relation to sugar taxes, and food standards regarding fibre, saturated fat and Na content of RTEC products.
Acknowledgements
Financial support: This study was supported by contestable University of Waikato Funding. The funder had no additional role in the design, analysis or writing of this article. Conflict of interest: None. Authorship: L.C. designed the study, supported data collection/analysis and prepared the manuscript. N.E. collected all data and prepared data for analysis. L.C. analysed the data, G.M. and R.N. supported study design and manuscript writing. All authors have contributed to the critical revision of the article, have reviewed the final version and approve the manuscript. Ethics of human subject participation: Not applicable.


