

Introduction
The woylie Bettongia penicillata is an important mycophageous ecosystem engineer and propagule vector (particularly of mycorrhizal fungi), previously found across much of southern and central Australia (Christensen, Reference Christensen1980; Garkaklis et al., Reference Garkaklis, Bradley and Wooler2004; Zosky, Reference Zosky2012; Wayne et al., Reference Wayne, Maxwell, Ward, Vellios, Ward and Liddelow2013). By the 1960s the species was found only in three small areas in south-west Western Australia but it then made a significant recovery. In 1996 it became the first Australian taxon to be removed from threatened species lists as a result of successful conservation actions, principally fox control and translocations (Start et al., Reference Start, Burbidge and Armstrong1995). However, since 1999 populations throughout south-west Western Australia have undergone unexpected, rapid and substantial declines. By 2006 this keystone species had declined by c. 90% (c. 182,000 individuals). It is now considered one of the most threatened marsupials in Australia and is categorized as Critically Endangered on the IUCN Red List (Wayne et al., Reference Wayne, Friend, Burbidge, Morris and van Weenen2008a, Reference Wayne, Maxwell, Ward, Vellios, Ward and Liddelow2013). The decline continues and the causes are not proven.
The decline diagnosis framework we applied to the woylie (Wayne et al., Reference Wayne, Maxwell, Ward, Vellios, Ward and Liddelow2013) is based on the declining population paradigm and cognate scientific approaches (Caughley, Reference Caughley1994; Caughley & Gunn, Reference Caughley and Gunn1996; Peery et al., Reference Peery, Beissinger, Newman, Burkett and Williams2004). Having verified that the decline is real and reviewed the ecology of the species (Wayne et al., Reference Wayne, Maxwell, Ward, Vellios, Ward and Liddelow2013), we focus on (1) determining the spatial, temporal and demographic characteristics of the observed decline, (2) identifying all potential causes, and (3) using available evidence to shortlist potential causes. This research provides the basis for future work to rigorously test putative causes and, given the evidence, determine the most appropriate conservation and management responses.
Study area
The study area (Fig. 1) is the Upper Warren region of south-west Western Australia, which includes 140,000 ha of publicly managed forest. Perup Nature Reserve constitutes the eastern part of the region, and the western portion, broadly known as Greater Kingston, consists of National Park and State Forest (DEC, 2012). The Perup/Kingston subdivision is consistent with woylie genetic distinctions (Pacioni et al., Reference Pacioni, Wayne and Spencer2011). The largely contiguous public forests are subdivided into management units of c. 5,000 ha, called forest blocks.
Woylie monitoring sites in the Upper Warren region, south-west Australia, and the year in which recent substantial declines began. The dashed line distinguishes the Greater Kingston area (west) from the Perup area (east). The inset shows the location of the main map in Australia.

The Mediterranean type climate supports forests dominated by jarrah Eucalyptus marginata, marri Corymbia calophylla and wandoo Eucalyptus wandoo. Management activities in the region (Wayne et al., Reference Wayne, Cowling, Lindenmayer, Ward, Vellios, Donnelly and Calver2006, Reference Wayne, Maxwell, Ward, Vellios, Ward and Liddelow2013; DEC, 2012) have included fire (McCaw et al., Reference McCaw, Hamilton, Rumley, Calver, Bigler-Cole, Bolton, Dargavel, Gaynor and Horwitz2005), timber harvesting (Wayne et al., Reference Wayne, Cowling, Lindenmayer, Ward, Vellios, Donnelly and Calver2006 & references therein) and the control of the introduced red fox Vulpes vulpes using fox baits since 1977; since late 1996 fox baits have been distributed quarterly on a broad scale, primarily by aircraft (Burrows & Christensen, Reference Burrows and Christensen2002, Wayne et al., Reference Wayne, Cowling, Lindenmayer, Ward, Vellios, Donnelly and Calver2006).
Methods
Data collation and establishment of monitoring transects
We aggregated > 35 historical independent trapping datasets (1974 to present) from the Upper Warren into a single database, with > 62,000 animal records, including > 28,000 woylie capture records involving > 5,500 individuals (DEC, Reference Wayne2008; Wayne et al., Reference Wayne, Maxwell, Ward, Vellios, Ward and Liddelow2013).
Monitoring transects across the Upper Warren region were standardized in 2005 (Fig. 1), with each transect involving 50 wire-cage traps (20 × 20 × 45 cm) baited with peanut butter, rolled oats and sardines. The traps were spaced 200 m apart, adjacent to minor forest tracks, and each one operated for 4 consecutive nights. Captured individuals were uniquely marked with ear tags for identification, and standardized data and sample collection methods were used. Non-standard variants of this trapping methodology were used on some pre-existing transects (Balban, Yackelup and Yendicup; Wayne et al., Reference Wayne, Maxwell, Ward, Vellios, Ward and Liddelow2013) to enable longitudinal comparisons within these sites to continue.
Surveys along transects were conducted each spring (October–November) and autumn (March–April) during 2005–2007. Thereafter surveys were conducted annually on eight transects (consistently either in spring or autumn, depending on the transect), biannually on two transects (Keninup and Warrup) and periodically at Corbal (Wayne et al., Reference Wayne, Maxwell, Ward, Vellios, Ward and Liddelow2013). Monitoring was conducted in accordance with requisite procedures, protocols and approvals (Wayne et al., Reference Wayne, Maxwell, Ward, Vellios, Ward and Liddelow2013).
Woylie capture rates in the Upper Warren are highly correlated with abundance estimations based on capture–mark–recapture modelling across time and space and across the observed range of woylie densities (Wayne et al., Reference Wayne, Maxwell, Ward, Vellios, Ward and Liddelow2013) and so were used in this study as an index of abundance. On some occasions between 2000 and 2010 a non-standard bait was used at the Balban trapping transect, to reduce woylie captures and increase capture rates of other native species (Wayne et al. Reference Wayne, Rooney, Morris and Johnson2008b). Capture rates using the alternative meat-based ‘smelly’ bait were adjusted to an equivalent capture rate using standard bait (peanut, oats and sardines); i.e. y = 0.0 + 3.6 × log(x + 1), where x = woylie capture rate (%) using smelly bait and y = woylie capture rate (%) using standard bait. The regression model used to derive this relationship was based on a comparison of capture rates using the two bait types on the same sites (Balban, Winnejup and Warrup, 1997–2008) within a month of each other (R2 = 0.98, P < 0.001, n = 10). In this way the Balban data could be reliably included to calculate regional-scale annual median capture rates and assess spatial patterns of decline.
The main variations in survey methodology along the transects in the Upper Warren prior to 2005 were summarized by Wayne et al. (Reference Wayne, Maxwell, Ward, Vellios, Ward and Liddelow2013) and generally related to differences such as the time of year and frequency of trapping, number of traps per transect and, in particular, the level of detail collected on captured individuals (e.g. identification, biometrics). The effect of such variations over space and time on capture rates is unknown but may be considered minor with respect to the overall population trends examined here.
The timing of the commencement of decline at monitoring sites was generally based on trapping data (i.e. > 10% decline in capture rate within a given year). At Warrup and Winnejup, where trapping data were absent or insufficient in some years, detection rates from routine spotlight data were also used (Wayne et al., Reference Wayne, Cowling, Rooney, Ward, Wheeler, Lindenmayer and Donnelly2005, Reference Wayne, Maxwell, Ward, Vellios, Ward and Liddelow2013 & unpubl. data).
Demographic attributes
A conservative selection of datasets were used to investigate woylie demographics, to provide robust and reliable results. Demographic data prior to 1998 were considered inadequate for a regional assessment. A subset of six sites (Keninup, Warrup, Camelar, Boyicup, Moopinup and Chariup) was used because the survey methodology was comparable over space and time (Wayne et al., Reference Wayne, Maxwell, Ward, Vellios, Ward and Liddelow2013) and these sites had the most comprehensive and reliable datasets. Nonetheless, within this subset there was still some variation between the datasets for each attribute investigated (Table 1); for example there were no data for Chariup in 2002, 2004 or 2009, and the number of breeding females was based on data from Keninup, Warrup and Camelar only.
Summary of the number of adults at six study sites, used to investigate demographic attributes over time. The attributes investigated were the age and sex ratios, the % of females breeding, and the mean adult body mass. Blank cells indicate that no surveys were conducted; 0 indicates that surveys were conducted but no data are available.

The annual mean for each of the demographic attributes was derived per site from the means for each session within a given year (i.e. equal statistical weight was assigned to each session within a year). Annual measures across the region were derived from the mean across sites within a given year (i.e. equal statistical weight was assigned to each site).
Subadults were defined as independent and sexually immature. Adulthood was based on sexual maturity or, in some cases, other indicators that individuals were mature albeit not breeding (e.g. age based on trap history and/or body mass).
Females were considered breeding if a pouch young was present (97% of cases identified as breeding) or the pouch was active but without pouch young (e.g. lactating teat). Repeat measures of the same individual from different trapping sessions within a given year were considered independent and were included in annual figures, given that the sampling intervals (generally > 120 days) were sufficient relative to the 100-day breeding cycle (Christensen, Reference Christensen1980, Reference Christensen and Strahan1995).
Results
Characteristics of the decline
Individual monitoring transects in the Upper Warren showed increases in woylie numbers between the 1970s and 2007 (Figs 2–4). Commonly there were marked increases in woylie capture rates between the first and second years of a transect survey (e.g. Boyicup, Chariup and Moopinup, 1998–1999; Balban, 2000–2001; and Keninup, 2005–2006), which are attributed to a preliminary phase of trap-learning by woylies (A. Wayne, unpubl. data). There were also marked increases in the capture rates of woylies associated with improvements to the fox-baiting regime (e.g. Boyicup, 1979–1980; Yendicup, 1989–1990; Warrup and Winnejup, 1994–1998; and more generally since 1996). The first detectable declines on individual transects varied between 1999 (Warrup, Greater Kingston) and 2007 (Keninup, northern Perup; Figs 1–4). The first apparent recovery began at Warrup in 2005 but, having recovered to a 40% capture rate, the population began to decline again in 2009 (Fig. 2).
Annual mean trap capture rates of woylies along monitoring transects in Greater Kingston (western Upper Warren) during 1994–2010.

Annual mean trap capture rates of woylies along monitoring transects in southern Perup (south-eastern Upper Warren) during 1974–2010.

Annual mean trap capture rates of woylies along monitoring transects in northern Perup (north-eastern Upper Warren) during 1976–2010.

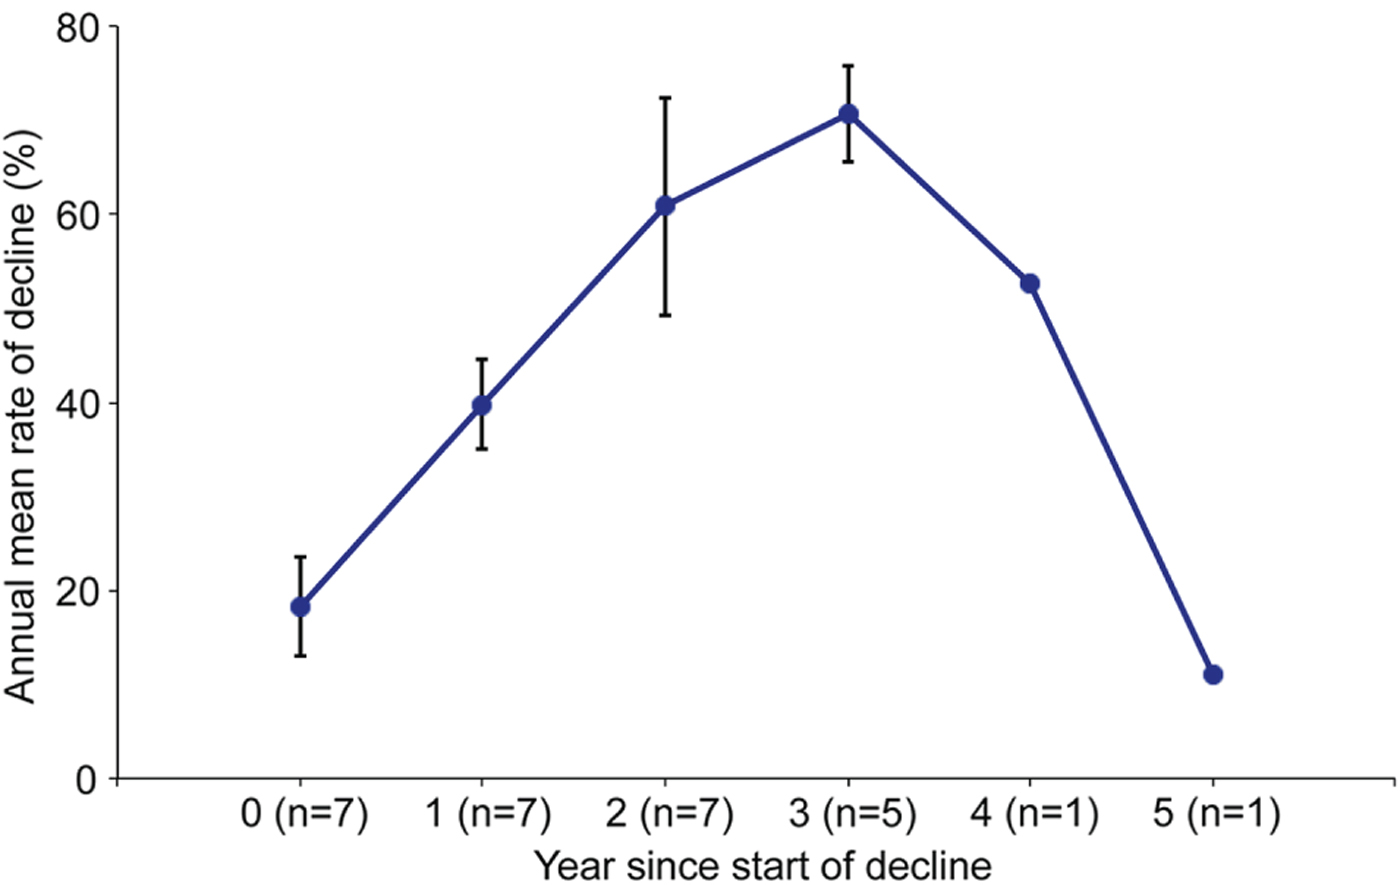
The characteristics of the decline were similar across sites throughout the Upper Warren. Prior to the decline all sites had a capture rate of 40–80% (> 1.0 woylies per ha; mean = 61% or 1.5 woylies per ha; based on the relationship between capture rates (x) and density estimates (y) modelled by Wayne et al., Reference Wayne, Maxwell, Ward, Vellios, Ward and Liddelow2013); R 2 = 0.90, P < 0.0001, n = 16, with y = 0.000 + 2.519x). The decline occurred at each site for a mean of 4 years (range 3–5 years), with 25–95% annual rates of decline. The profile of the annual rate of decline over time was similar across sites (Fig. 5), with an overall mean reduction of 96% (range 87–100%). A spatial pattern was evident in the decline in Perup: beginning in Camelar in 2002, the decline extended by c. 4 km per year and ended 22 km north, in Keninup, in 2007 (Fig. 6).
Mean rate of decline in woylie trap capture rates in Perup, based on the number of years since the start of the decline.
Schematic spatial model of the annual rates of woylie decline in Perup, Upper Warren. Annual rates of decline are calculated based on changes in the mean annual capture rate and do not indicate the first detection of declines in any given area. Names and boundaries of forest blocks, and the locations of transects, are shown on the 2001 model. The numbers represent the decline (%) in woylie trap capture rates.

Demographic attributes
There were insufficient data to investigate age ratio (subadults : adults) over time, given that only 1.6% of the 3,443 independent woylie captures across the six sites examined during 1998–2010 were subadults. Datasets considered sufficiently large and reliable were used to examine sex ratio, proportion of adult females breeding and body mass (Table 1).
There was no apparent pattern in adult sex ratio or proportion of adult females breeding when examined by year (1998–2010), but adult body mass steadily increased by 15%, from an annual regional mean of 1,293 ± SE 34 g in 1998 to 1,491 ± SE 14 g in 2010 (with a peak of 1,535 ± SE 54 g in 2007). Associations were more pronounced when regional means for demographic attributes were related to year since the start of the decline (Fig. 7).
Woylie demographic attributes in relation to year since the start of decline for sites in the Upper Warren region.

The overall mean male : female ratio was 1.6 (n = 2,882, annual range 1.3–1.8). There were no notable differences in sex ratio between sites, except for Camelar. This site had a high male bias (M : F ratio = 1.9–2.7) prior to the local woylie decline, and this increased in the second and third years of the decline (M : F = 4.5, n = 22 individuals in 2003 and M : F = 5.0, n = 12 individuals in 2004; this site accounts entirely for the trend in increased male bias in these years in Fig. 7). Sample sizes at Camelar were smaller in 2005–2008 (0–2 individuals) but the sex ratios were within the normal range in 2009 and 2010 (M : F ratio = 1.7, n = 8, and M : F ratio = 1.3, n = 7, respectively).
Overall, 97% of captured adult female woylies showed evidence of breeding (annual range 92–100%, n = 954, where breeding status was reliably recorded across six sites). All females were breeding except in years −1, 0 and 1 since the start of the decline, when 98 ± SE 1.5%, 95 ± SE 0.4% and 90 ± SE 2.4%, respectively, were breeding (Fig. 7).
Adult body mass was 900–1,800 g for males and 800–1,800 g for females (not including the body mass of pouch young). The annual mean body mass of adult woylies across the Upper Warren (1998–2010) was not significantly different between sexes (P = 0.23) or sites (P = 0.32) or the interaction term for these two factors (P = 0.37; two-factor ANOVA, n = 114). Mean body mass at sites increased in the 5 years following the commencement of decline, but some of these gains were lost again in the 8th and 9th years after the decline commenced (Fig. 7). The weight loss corresponded with an increasing trend in the mean woylie capture rate (particularly as a result of the increases at Warrup) that began 7 years after the decline began.
Discussion
The nature of the woylie decline and the approach to understanding it is pertinent to global efforts in species conservation. The unexpectedness, magnitude and speed of the decline are particularly salient and highlight the importance of adequate monitoring even when populations are abundant and not considered at risk (Groom, Reference Groom2010).
The woylie decline is relevant to other co-occurring species that are threatened and/or declining, such as the numbat Myrmecobius fasciatus, wambenger Phascogale tapoatafa, ngwayir Pseudocheirus occidentalis, quenda Isoodon obesulus fusciventer, and chuditch Dasyurus geoffroii. Factors causing woylie decline may also affect these species, which are generally more difficult to investigate because of their more cryptic nature, lower abundances, and the limited data available. Therefore, resolving the causes of decline in the woylie may assist in the identification of the agents of decline in co-occurring species and vice versa.
Using a declining population diagnosis framework and characterizing the nature of the decline can help to identify its causes, which is necessary for effective management of the conservation and recovery of populations. The findings from the Upper Warren are also critical in determining whether the same factors are responsible for the concurrent declines in most of the other large woylie populations across southern Australia (Groom, Reference Groom2010; Yeatman & Groom, Reference Yeatman and Groom2012).
Characteristics of the decline
There was a net loss of 95%, or c. 160,000 woylies, during 2002–2010 in the Upper Warren (Wayne et al., Reference Wayne, Maxwell, Ward, Vellios, Ward and Liddelow2013), and the decline clearly shows a spatio-temporal pattern. Although the timing may have varied, many of the characteristics of decline were similar across the monitoring sites. The duration, successive annual rates of decline and magnitude of decline were also similar. Warrup is the only site to have undergone a substantial recovery but, having reached an apparent minimum threshold density common to all sites that have recently declined (> 1.0 woylie per ha), the population is declining again. Changes in some demographic attributes were apparently associated with decline, including a 15% increase in body mass in the 5 years following the commencement of the decline, up to 10% reduction in the proportion of adult females breeding, and at the Camelar site, a marked increase in the male bias 2–3 years into the decline. These findings provide potential clues to the cause and effect of the decline, but associations may be coincidental.
The generally high proportion of adult females breeding (overall mean of 97%) is consistent with earlier findings (e.g. Christensen, Reference Christensen1980). The adult male bias in the Upper Warren (overall mean M : F = 1.6) is in contrast to the female-dominated trapping results from the dense and stable woylie population within the fenced, 275 ha, predator-free Karakamia Wildlife Sanctuary, Western Australia (M : F ratio = 0.7; DEC, Reference Wayne2008). Although there may be a real difference between populations, caution is advised when comparing areas with different animal densities and/or different trapping methods (including spatial arrangement and density of traps), given that the actual sex ratio of a population cannot be inferred directly from raw trapping data (Wayne et al., Reference Wayne, Rooney, Morris and Johnson2008b).
Female woylies had body mass of up to 1,800 g, which is larger than past records (Christensen, Reference Christensen and Strahan1995; de Tores & Start, Reference de Tores, Start, Van Dyck and Strahan2008). The post-decline increase in woylie body mass is most likely attributable to increased availability of food resources as a result of lower woylie density. Evidence of the species’ responsiveness to food resources was found in the population at Karakamia, where body mass decreased by c. 10% to a mean of 1,070 g (and breeding became seasonal) when woylie numbers stabilized at an apparent carrying capacity after their introduction (in 1994) and initial population growth (DEC, Reference Wayne2008).
Mortality can be deduced as a driver of the decline, given that the rates of decline (25–95% per annum at any given site) are greater than would be expected in the event of a complete failure of recruitment by reproduction and given an average life expectancy of 2.6–2.9 years (A. Wayne, unpubl. data) and 4–6 years (Christensen, Reference Christensen and Strahan1995). There is no evidence of substantial emigration, based on trapping histories and radio-telemetry (A. Wayne, unpubl. data).
Other woylie population declines
Commonalities exist across other woylie populations that have recently declined. All of the major declines detected to date (DEC, unpubl. data) began within a 10–year period, although there is no apparent large-scale spatial pattern to the timing between populations (Fig. 8). Affected populations have typically declined by 90–100% and declines have occurred across much of the species’ current range. Seven of the 10 populations with > 200 individuals in 2001 have declined (Groom, Reference Groom2010). All recorded declines have been on mainland Australia, where introduced foxes and cats were present. The substantial populations that have not declined are physically isolated by fences (Karakamia, Western Australia) or ocean (St Peter's and Wedge Islands, South Australia) in areas free of introduced predators. Further work is needed to distinguish the characteristics of populations that have and have not declined and to investigate the causes of decline.
Locations of woylie populations, with the year they began to decline shown in parentheses if applicable. The rectangle on the inset shows the location of the main map.

Potential causes of decline
Introduced predators (fox and cat), habitat loss and disease are among the principal factors thought to be responsible for historical declines of the woylie and other species in Western Australia (Burbidge & McKenzie, Reference Burbidge and McKenzie1989; Start et al., Reference Start, Burbidge and Armstrong1995; Short et al., Reference Short, Atkins and Turner2005; Abbott, Reference Abbott2006, Reference Abbott2008). How these or other factors may relate to the current decline is not fully understood. Most potential agents of decline can be broadly categorized into four major groups: resources, predators, disease, and direct human interference.
Key resources include food, water, shelter, space and mates. Although food would appear to be the most likely of these to be a factor in woylie decline, available evidence indicates that food is unlikely to be a primary cause of decline in the Upper Warren: there was a marked increase in body mass after the commencement of a decline, and comparative spatio-temporal investigations of diet and the availability of sequestrate fungi (the woylie's primary food source) found no associations in relation to the recent decline (Zosky, Reference Zosky2012). The woylie does not require free water for survival (de Tores & Start, Reference de Tores, Start, Van Dyck and Strahan2008). Shelter and space are unlikely to be primary factors, given that there has been no major change in the habitat or its extent, nor has there been any indication of a major increase in competitors in the region (e.g. quenda and koomal Trichosurus vulpecula hypoleucus; Orell, Reference Orell2004; DEC, unpubl. data). Mates should have been readily available, given the high densities of woylies prior to decline.
Human activities might have directly interfered with woylie breeding and/or survival. Perverse effects on trapped individuals include disrupted breeding success, reduced condition, injuries, increased stress and susceptibility to other mortality factors. These are unlikely causes of the decline, based on preliminary investigations (DEC, Reference Wayne2008) regarding the nature, timing and extent of activities and the characteristics of the decline. Habitat loss and modification, fire, and timber harvesting are also not readily associated with the decline in the Upper Warren (DEC, Reference Wayne2008).
Based on the available evidence collated to date, the leading hypothesis is that woylies have been made more vulnerable to predation by disease, with mortality being the primary driver of decline. Feral cats Felis catus, and to a lesser extent foxes, have been associated with most woylie mortalities observed during the woylie declines in the Upper Warren (DEC, Reference Wayne2008; A. Wayne, unpubl. data) and Dryandra (N. Marlow pers. comm.). However, the characteristics of the decline in the Upper Warren are not readily explained by predation alone, and the clear spatio-temporal pattern of its progression through the region is consistent with an agent with limited mobility, such as some infectious diseases, moving through the population. A high prevalence of moderate to severe skin and fur conditions has been associated with populations undergoing decline (DEC, Reference Wayne2008; A. Wayne, unpubl. data), as have haematological attributes such as lymphocytosis (Pacioni, Reference Pacioni2010; Pacioni et al., 2013) and some parasites (DEC, Reference Wayne2008; Smith et al., Reference Smith, Clark, Averis, Lymbery, Wayne, Morris and Thompson2008), although the significance of these associations is unknown. The apparent association of woylie density and proportion of breeding females with the commencement of initial and secondary declines at sites within the Upper Warren (> 1 woylies per ha) is also consistent with some diseases and resources (otherwise dismissed as a putative cause in this case) and merits further investigation.
Disease has been shown to be a key factor in population declines in other species (Tompkins et al., Reference Tompkins, White and Boots2003; Miller et al., Reference Miller, Grigg, Kreuder, James, Melli and Crosbie2004; Pedersen & Greives, Reference Pedersen and Greives2008; McCallum et al., Reference McCallum, Jones, Hawkins, Hamede, Lachish and Sinn2009; Foley et al., Reference Foley, Clifford, Castle, Cryan and Ostefeld2011), and in some cases extinction (Skerratt et al., Reference Skerratt, Berger, Speare, Cashins, McDonald and Phillott2007; Wyatt et al., Reference Wyatt, Campos, Gilbert, Kolokotronis, Hynes and DeSalle2008; Smith et al., Reference Smith, Acevedo-Whitehouse and Pederson2009). Diseases may be genetic, viral, parasitic, bacterial, nutritional or toxicological. Several organisms hosted by the woylie have been identified recently (Smith et al., Reference Smith, Clark, Averis, Lymbery, Wayne, Morris and Thompson2008; Bennett et al., Reference Bennett, Reiss, Stevens, Heylen, Van Ranst and Wayne2010; Parameswaran et al., Reference Parameswaran, Thompson, Sundar, Pan and Grigg2010; Kaewmongkol et al., Reference Kaewmongkol, Kaewmongkol, Burmej, Bennett, Fleming and Adams2011; Botero et al., Reference Botero, Thompson, Peacock, Clode, Nicholls, Wayne, Lymbery and Thompson2013; Thompson et al., Reference Thompson, Botero, Wayne, Godfrey, Lymbery and Thompson2013), but whether they are related to the decline, and, if so, their significance, remains to be verified. In the meantime, activities involving woylie populations must strictly adhere to disease risk management protocols (Chapman et al., Reference Chapman, Sims and Mawson2011).
Decline diagnosis development
This and an earlier study (Wayne et al., Reference Wayne, Maxwell, Ward, Vellios, Ward and Liddelow2013) have addressed the first four steps of the woylie decline diagnosis framework for the Upper Warren populations. The next steps are to continue to use evidence to shortlist the potential agents of decline, test the strength and nature of observed associations, and seek direct evidence of the actual causes. The hypothetico-deductive approach (Caughley, Reference Caughley1994) used in this study involves parallel lines of enquiry addressing the numerous possible agents of decline and factors such as climate change and fire. A population or site comparison approach may also assist in identifying associations between woylie demographics, survival and mortality, predators, disease, and resources. Specific targeted investigations are also necessary. Given the diversity and complexity involved in investigating the causes of decline, a corresponding diversity of multi-disciplinary collaboration is needed.
Species decline in perspective
The recent and rapid 90% decline of the woylie is particularly challenging for the conservation of the species, given that all indigenous populations have declined. These encapsulated the extant genetic diversity of the species, which prior to the recent decline had lost c. 50% of its genetic diversity and 98% of its abundance over the 200 years since the settlement of Australia by Europeans (Hunt, Reference Hunt2010). Nonetheless, the genetic diversity in these populations had generally remained high prior to recent declines (Pacioni et al., Reference Pacioni, Wayne and Spencer2011).
The small size of remnant populations, and the uncertainty as to whether these populations will be able to recover naturally, increases the risk of continued genetic loss and local extinction, which has already occurred at Tutanning (Pacioni et al., Reference Pacioni, Wayne and Spencer2011; DEC, unpubl. data). Other particularly vulnerable populations include the remaining indigenous populations (Dryandra, Upper Warren) and the population at Batalling. Since 2001 the Dryandra population has undergone > 90% decline. The Batalling population, previously the largest translocated population in Western Australia (< 10,000 individuals; Wayne et al., Reference Wayne, Maxwell, Ward, Vellios, Ward and Liddelow2013), has undergone 99% decline and has remained at extremely low levels since 2007 (Yeatman & Groom, Reference Yeatman and Groom2012).
Insurance populations that adequately secure the remaining genetic diversity of the species are also necessary to maximize the short- and long-term conservation and recovery prospects of the species. This is being addressed, in part, by the establishment of the Perup Sanctuary (420 ha predator-free enclosure of native habitat in Perup Nature Reserve) in 2010 to complement Karakamia Wildlife Sanctuary.
Conclusions
The often spectacular recovery of woylie populations in response to fox control (Orell, Reference Orell2004) demonstrates the resilience of the species. However, while the recent decline continues, residual populations remain low and no recoveries are sustained, the conservation risks increase. Diagnosing the decline remains the most effective way to improve the long-term conservation prospects for the species but it is also important to understand the factors limiting recovery (small population paradigm; Caughley, Reference Caughley1994).
A systematic comparative assessment of the associative evidence from other woylie populations is key to the diagnosis of the decline and impediments to recovery. A particular focus on disease and predators is recommended. However, direct evidence will ultimately be necessary to unequivocally confirm the causes of the decline and factors limiting population recovery.
Given the rapidity and magnitude of the woylie decline, active adaptive management (Walters & Holling, Reference Walters and Holling1990; Lee, Reference Lee1999) within a rigorous scientific framework may be a timely and effective means of providing direct evidence regarding key putative agents, such as introduced predators, while also aiming to deliver better conservation outcomes. Adequate and standardized ecological monitoring (Yoccoz et al., Reference Yoccoz, Nichols and Boulinier2001; Legg & Nagy, Reference Legg and Nagy2006) may prove equally important in gathering associative evidence of the most likely putative agents of decline. Effective monitoring is also critical to the timely detection of significant population changes. These priorities are consistent with the national recovery plan (Yeatman & Groom, Reference Yeatman and Groom2012) and should form the basis of an integrated and comprehensive conservation and management strategy for the species, with adequate resources and support to deliver a favourable conservation outcome for this keystone species and potentially for other threatened species.
Acknowledgements
Many professionals, organizations, students and volunteers have been actively involved with the Woylie Conservation Research Project, of which this study is a component. Access to historical datasets was provided by various custodians: P. Christensen, N. Burrows, G. Liddelow, B. Ward, P. Orell and DEC. Funding sources included the Western Australia Department of Environment and Conservation (now the Department of Parks and Wildlife), the Western Australian Government, the Australian Research Council and the Environment Division of the United Nations Association of Australia (WA) Incorporated. Cassidy Newland produced Fig. 1. Ian Abbott, Carlo Pacioni, Joern Fischer and two anonymous reviewers provided helpful comments.
Biographical sketches
Adrian Wayne, Marika Maxwell, Colin Ward and Chris Vellios are a research team focusing on the conservation and management of threatened and sensitive species, with an interest in the ecology of forest vertebrate fauna in south-west Australia. Ian Wilson and Julia Wayne are responsible for the management of biodiversity and conservation values on public lands, including the region where this study was focused. Matthew Williams is a biometrician.


