


INTRODUCTION
The production of symbols frequently accompanies violent conflicts. The dedication of monuments, the performance of rituals, the sacralization of events or sites, and the production and distribution of images and objects are used to publicize, justify, and celebrate the violence. We mourn and commemorate our victims and glorify those who commit violence on our behalf. Indeed, these activities are far more common than the killing itself and endure long after violence subsides.
While intuitively we may think of this “symbolic” activity as a byproduct of past violence, I argue that symbols can also affect the likelihood of future violence and therefore the trajectories of conflict. I conceptualize political symbols as common knowledge heuristics about the social order. The core prediction of the theory is that when political symbols affirm an emerging or existing social order, they are likely to reduce political violence, acting as a substitute for the communicative functions that political violence otherwise performs. Conversely, when political symbols are removed or altered, they signal that the social order is contested, increasing the likelihood that further political violence will occur.
I test the theory by investigating the effects of a prominent political symbol that emerged following a civil war, namely, the construction and removal of Confederate monuments celebrating the cause of Southern secession after the United States Civil War. Following its military defeat and the abolition of the institution it sought to protect with secession (chattel slavery), the Confederate cause transformed from a virulent territorial nationalism to a civil religion glorifying what came to be known as the Lost Cause (Wilson Reference Wilson1980). The ideology of the Lost Cause was rife with rituals, infused with Christian motifs, and preoccupied with racial and sexual purity and martial conceptions of masculinity (Wilson Reference Wilson1980). One of the central achievements of the Lost Cause’s proponents, spearheaded by the highly effective women’s organization which championed it, the United Daughters of the Confederacy (UDC), was the “filling [of] the civic spaces of the South with monuments glorifying the Confederacy and other episodes of white heroism” (Brundage Reference Brundage2008, 54).
I argue that these monuments had the paradoxical effect of reducing the likelihood of anti-Black performative political violence: lynchings and public executions. The primary purpose of lynching, and to a large degree public executions as well, was to establish a white supremacist social order characterized by Black subordination and white solidarity through the use of performative, often extra-lethal violence (Cox Reference Cox1945; Fujii, Finnemore, and Wood Reference Fujii, Finnemore and Wood2021; Smångs Reference Smångs2016a; Reference Smångs2016b; Tolnay and Beck Reference Tolnay and Beck1995; Wood Reference Wood2009).
Existing research on the relationship between Confederate monuments and lynching suggests that monuments increase the likelihood of anti-Black sentiment and therefore anti-Black violence (Bazzi et al. Reference Bazzi, Ferrara, Fiszbein, Pearson and Testa2023; Henderson et al. Reference Henderson, Powers, Claibourn, Brown-Iannuzzi and Trawalter2021). But this argument cannot explain the fact that while lynchings continued throughout the twentieth century, their frequency declined substantially from their horrific peak in the early 1890s, just as Confederate monument construction was accelerating. Scholars variously attribute this decline to changes in the economic structure of the Southern states, fluctuations in cotton prices, increased state-led violence against Blacks, as well as greater normative pressure from anti-lynching activists and Northern publics (Clarke Reference Clarke1998; Smångs Reference Smångs2016a; Reference Smångs2016b; Tolnay and Beck Reference Tolnay and Beck1995; Weaver Reference Weaver2019). I test an alternative, and altogether crueler, explanation for the decline in performative violence in the aftermath of Reconstruction: it was no longer as necessary once a post-war white supremacist social order was reestablished. The question is how did Southerners—both white and Black—observe and internalize this new status quo.
The theory and results presented here contribute to the rich literature on racial threat. Racial threat theory posits that as majorities perceive that their power is eroding (either via demographic changes or as the relative socioeconomic power of minorities increases), their sense of threat increases, leading to increased support for repression and violence (Blalock Reference Blalock1967; Reference Blalock1982; Key Reference Key1949). I argue that political symbols play a critical role in shaping these threat perceptions.
One palpable, observable indicator of this reestablished social order were Confederate monuments. I argue that monuments functioned as political symbols that affirmed and reassured whites’ dominant position and Blacks’ subordinate position. I propose that monuments reduced violence through three possible mechanisms. First, monuments’ presence lowered the motivation of whites to carry out public violence since they provided an alternative source of validation of renewed dominance. Second, monuments may have led Black Southerners to migrate or adopt more deferential behaviors to avoid violence. These two possible mechanisms are mutually reinforcing because monument-induced migration or supplication further affirmed the white dominance communicated by the monuments, creating a cycle leading to a reduction in performative violence. Third, the UDC and affiliated organizations built the monuments in part as educational tools, designed to instill in white children the belief that their position atop the hierarchy was secured by the actions of their Confederate ancestors. Once those children who grew up under the shadow of monuments became adults capable of violence, they were not nearly as motivated to reverse perceived status loss.
Using a difference-in-differences design alongside archival work, I test the effects of Confederate monuments on the likelihood of performative violence events between 1877 and 1928. To support a causal interpretation of my results, I use estimators which are able to accommodate staggered treatment timing and heterogeneous treatment effects. The bulk of the evidence confirms the logic of substitution: counties in which Confederate monuments were built were less likely to subsequently experience performative violence events, such as lynchings or public executions. When extrapolating across the 52 years between 1877 and 1928, I estimate that approximately 315 lynching events (out of a total of 3,090 that actually took place) and 725 performative violence events (out of 5,433 that actually took place) did not occur due to the presence of a Confederate monument in a county. In other words, monuments may account for a reduction of 10% to 13% in performative violence events.
In addition, the effects of Confederate monuments appear to have strengthened over time, further reducing the prevalence of performative violence as new generations internalized this new social order. Moreover, the effects of Confederate monuments were larger in counties with growing or large Black populations, and where the legacy of chattel slavery is most pronounced. In other words, monuments attenuated performative violence precisely where we might expect racial threat to be highest, suggesting that the information political symbols provide may be especially salient in those counties that are more susceptible to racial threat. I also conduct additional analyses to test the plausibility of a causal interpretation, including an instrumental variable approach using the national price of cut stone, and an analysis examining the effect of Confederate commemoration days on anti-Black violence.
Of course, Confederate monuments are not merely a matter of the late nineteenth and early twentieth centuries. In the past decade, Confederate monuments have prominently featured in instances of political violence in the US and have meaningfully affected the country’s politics. The 2015 massacre of nine Black parishioners in a Charleston, SC church, along with the killing of a protester at the 2017 Unite the Right Rally in Charlottesville, VA led to a rethinking and removal of Confederate monuments and other elements of Lost Cause iconography, such as the Confederate battle flag. In addition, at the outset of his second term in office, President Trump has sought to stop the removal of Confederate monuments and possibly reinstate monuments that have been removed from federal lands. Using an executive order titled, “Restoring Truth and Sanity to American History,” the Trump Administration has tried to counter what it views as a decade-long “false reconstruction of American history” that “inappropriately minimize(s) the value of certain historical events or figures” (United States Government 2025).
My theory holds that when monuments are removed we should expect the likelihood of political violence to increase because the substitution effect wanes. Monument removals signal that the social order is contested, heightening the risk of political violence. I test this prediction by examining the effects of Confederate monument removal on anti-Black hate crimes in the present day. Although they are quite different, anti-Black hate crimes echo the lynchings of the postbellum era because they are committed by citizens against each other for political, rather than explicitly criminal, purposes. They are likelier to be performative because they can only be classified as hate crimes when the motivation behind them is sufficiently clear. The violence is not just coercive: a message is being explicitly sent. Consistent with my theory, I find that counties in which a Confederate monument was removed were more likely to experience anti-Black hate crimes compared with counties in which Confederate monuments remained in place. I find no comparable effect on antisemitic hate crimes, which serves as a placebo test since Confederate monument removal have less to do with Jews. The finding is consistent with the logic of substitution: once monuments are removed they no longer substitute for violence affirming the existing social order. This result comports with existing evidence showing that monument removal is likelier in counties in which there is a sizable and organized Black population, which could be interpreted as especially threatening to the status quo represented by the monuments (Benjamin et al. Reference Benjamin, Block, Clemons, Laird and Wamble2020). The finding is also consistent with the aforementioned extension of the racial threat literature: monuments may serve as an especially salient source of common knowledge in places where racial threat is likelier to be high.
Taken together, the evidence suggests that the use of political symbols—raising a flag or burning it, building a monument or removing it, performing a ritual or canceling a parade—can have a tangible influence on performative political violence and therefore on the long-term trajectories of conflicted societies. I conclude by considering the implications of my findings for the study of political symbols and performative violence, as well as broader implications for the present-day US.
SENSING SOCIAL ORDER: POLITICAL SYMBOLS, COALITIONAL COGNITION, AND PERFORMATIVE VIOLENCE
Political symbols and performative political violence share an important function: both are tools for inferring and influencing the social order. I define the social order as a more or less shared mental representation of group boundaries and status hierarchies. Who belongs and who is excluded? Who is dominant and who is subordinate? Both symbols and violence “solve” fundamental problems of the social order: how to “sense” it and how to shape it. The social order is not directly observable in the context of large-scale modern societies characterized by imagined communities (Anderson Reference Anderson2006) and is always inferred. Moreover, the social order is nearly always dynamic and contested to some degree because actors want to influence it to achieve their own aims.
How do we build such a mental representation given that the social order is not directly observable? Evidence from evolutionary and cognitive psychology suggests that we possess a specialized cognitive apparatus to make inferences about the social order and social alliances: a kind of coalitional cognition (Cikara Reference Cikara and Gawronski2021; Kurzban, Tooby, and Cosmides Reference Kurzban, Tooby and Cosmides2001; Lopez, McDermott, and Petersen Reference Lopez, McDermott and Petersen2011; Pietraszewski Reference Pietraszewski2022; Pietraszewski, Cosmides, and Tooby Reference Pietraszewski, Cosmides and Tooby2014). I argue that political symbols activate this coalitional cognition and allow us to track status hierarchies and mark group boundaries. Coalitional cognition is likely triggered and sustained by emotions having to do with status and belonging: envy, humiliation, shame, anger, pride, and resentment (Barnhart Reference Barnhart2021; McClendon Reference McClendon2018; McDermott Reference McDermott2020; Mendelberg Reference Mendelberg2022; Sznycer et al. Reference Sznycer, Tooby, Cosmides, Porat, Shalvi and Halperin2016; Tooby and Cosmides Reference Tooby, Cosmides, Lewis, Haviland-Jones and Berrett2008). Coalitional cognition relies upon common knowledge heuristics: mental shortcuts that inform our assumptions about what is widely known and what is not (De Freitas et al. Reference De Freitas, Thomas, DeScioli and Pinker2019). I argue that political symbols are an essential input of coalitional cognition: enabling us to both infer and influence the social order.
Political symbols can be understood as the tip of an iceberg.Footnote 1 We can see what is present above the surface (i.e., a public monument) and use that to infer the size, shape, and location of what is underneath (the social order, power relations). The cognitive challenge is that we cannot directly access what is under the surface, we must infer it. Because it is impossible to attend to the full extent of possible indicators of the social order, political symbols serve as a valuable heuristic. That “filling in” may be based on previous experience, education, and knowledge. I do not argue that monuments are the sole source of information about the social order, only that they are critical cues.
Drawing upon and synthesizing a large interdisciplinary literature on symbols and politics, I define political symbols as common knowledge heuristics with content about the social order. Political symbols have to do with common knowledge because they generate intersubjective or mutualistic knowledge. Their main function is informing us what other people know. They are heuristic because we make these intersubjective assumptions automatically rather than consciously. They are about the social order because they communicate information about collective identity and hierarchy (Abdelal et al. Reference Abdelal, Herrera, Johnston and McDermott2006; Mendelberg Reference Mendelberg2022). In particular, political symbols help define who we are and what is our relationship to other groups.
Examples of symbols include monuments, flags, rituals, parades, religious/nationalist sites and events. A large and diverse body of scholarship has investigated the causal effects of symbols on a range of political outcomes, although there is no widely agreed-upon definition (Butz Reference Butz2009; De Juan et al. Reference De Juan, Haass, Koos, Riaz and Tichelbaecker2024; Dinas, Martinez, and Valentim Reference Dinas, Martinez and Valentim2024; Kaufman Reference Kaufman2019; Kertzer Reference Kertzer1988; Reference Kertzer1996; Manekin, Grossman, and Mitts Reference Manekin, Grossman and Mitts2019; Rahnama Reference Rahnama2024; Wedeen Reference Wedeen1999). Existing literature has conceptualized symbols in five main ways: as meaning-makers (Wedeen Reference Wedeen2002; Geertz Reference Geertz1973), political resources (Cohen Reference Cohen1974; Edelman Reference Edelman1964; Laitin Reference Laitin1986), deep-seated attitudes (Cobb and Elder Reference Cobb and Elder1973; Kaufman Reference Kaufman2001; Mendelberg Reference Mendelberg2022; Sears Reference Sears, Iyengar and McGuire1993), a special type of information (Chwe Reference Chwe2001; O’Neill Reference O’Neill2001), and as identity markers (Elgenius Reference Elgenius2018; Lamont and Molnár Reference Lamont and Molnár2002; Mach Reference Mach1993; Ross Reference Ross2007).
I contribute to this literature by introducing the heuristic nature of political symbols and connecting it to the problems of inferring and influencing the social order. By way of illustration, consider the Berlin Wall as a political symbol which signified the division of Germany into two polities, as well as the broader ideological struggle of the Cold War. An observer looking at the Wall was able to infer the prevailing social order. However, as soon as the Wall came down, the Germans who tore it apart challenged the old social order, communicating the beginning of reunification, and heralding the end of the Cold War. Alternatively, the old bridge in the city of Mostar in Bosnia and Herzegovina was destroyed during the ethnic civil war that convulsed the former Yugoslavia in the 1990s. Its reconstruction signified the postwar order of reconciliation and inter-ethnic amity. Similarly, the monument at the pearl roundabout in Manama, Bahrain, which served as the locus of Arab Spring demonstrations in 2011, was subsequently destroyed by the country’s government and turned into a traffic intersection. The demolition meant to illustrate that the relatively more open era that birthed the protests was over. Finally, following the fall of Syrian President’s Bashar Al-Assad regime in 2024, ordinary Syrians spontaneously took to the streets to remove and deface statues of Al-Assad and his father, Hafez, marking the end of that family’s long rule. These are four examples among many.
Considering political symbols in this light has important and under-explored implications for the likelihood of political violence, especially status- or honor-motivated violence. One of the main drivers of political violence is status (Renshon Reference Renshon2017). Scholars of interstate wars have found that states frequently fight due to inconsistency between their perception of their deserved status and their actual status (Dafoe, Renshon, and Huth Reference Dafoe, Renshon and Huth2014; Duque Reference Duque2018; Paul, Wohlforth, and Larson Reference Paul, Wohlforth and Larson2014; Renshon Reference Renshon2016). Similarly, Barnhart (Reference Barnhart2021) and Petersen (Reference Petersen2002) have shown how humiliation and resentment, especially when associated with actual or perceived reversals in power, frequently lead to violence as groups attempt to regain lost position in a hierarchy. However, the status literature does not address whether lost status leads to particular kinds of violence, and how actors know that status has been regained. This is especially challenging since status is by definition something that is conferred by others (Renshon Reference Renshon2017). Which patterns of political violence do status motivations lead to (Gutiérrez-Sanín and Wood Reference Gutiérrez-Sanín and Wood2017)?
I argue that status injuries are likely to lead to performative, rather than merely coercive, violence. While violence can be purely instrumental, for instance when used to kill a would-be assailant, it can also be used to “send a message,” for instance in a terrorist attack or forms of extra-lethal violence (i.e., the mutilation of a dead body). Violence is frequently motivated by “moral” considerations: people carry out violent actions not only because they believe that violence will lead to just outcomes but also because they believe that the violence itself is just (Fiske and Rai Reference Fiske and Rai2014; Slovic et al. Reference Slovic, Mertz, Markowitz, Quist and Västfjäll2020). Violence is seen as a way of “ratifying” desired social relationships and political orders, and existing evidence suggests that participating in violence in and of itself strengthens group identification (Cohen Reference Cohen2016; Fiske and Rai Reference Fiske and Rai2014; Kalyvas, Shapiro, and Masoud Reference Kalyvas, Shapiro, Masoud, Shapiro, Kalyvas and Masoud2008; Littman Reference Littman2018). Performative and public violence is used to clarify group boundaries and status hierarchies: “When actors put violence on display, they are bringing to life ideas about how the world should be and more specifically, how it should be ordered—who should have power and who should be included and on what basis people should claim belonging” (Fujii, Finnemore, and Wood Reference Fujii, Finnemore and Wood2021, 3). In sum, performative violence serves a similar function to political symbols: to communicate information about the social order.
The overlapping function of political symbols and political violence raises the possibility that symbols may act as a substitute for performative violence. In that sense, political symbols whose meaning is aligned with the aims of status-based violence are likely to reduce rather than increase political violence. Political symbols shape perceptions of the status quo and therefore affect the motivation to carry out status-based violence. If the social order has been restored to its “rightful” state, then violence that “fixes” it is unnecessary. Paradoxically, it is precisely when symbols reify the social order that violence is meant to affirm that they reduce the likelihood of future violence by attenuating the motivation to carry it out. Rather than creating a permissive environment for violence, political symbols show that the social order is already secure, making the violence less necessary. Conversely, when political symbols are removed or altered, we should expect the motivation to carry out political violence to increase, as actors seek to protect an existing social order that is now perceived to be under threat.
Put differently, political symbols enable individuals to evaluate and shape the balance of power among social groups. In doing so, they directly influence perceptions of group power and threat—factors long recognized as causes of violence and social control, particularly in the context of U.S. race relations (Blalock Reference Blalock1967; Key Reference Key1949). Precisely because the social order is impossible to directly observe, is inherently contested, and may involve contradictory signals, political symbols serve as powerful heuristics for hierarchy and group belonging.
THE POST-RECONSTRUCTION UNITED STATES SOUTH, 1877–1928
I test this theory by looking at the effect of Confederate monument presence and removal on anti-Black performative violence (lynching/public executions and hate crimes) in the US. The aftermath of the American Civil War and the Reconstruction period represent an important case of contestation over the post civil war order (Byman Reference Byman2021). The Union victory in the civil war destroyed the antebellum white supremacist social order, which was defined by the institution of chattel slavery. The defense of slavery was the prime motivator of Southern nationalism, secession, and mobilization for war. Following the war, Southerners were contesting the contours of the new social order in the 11 former Confederate states.Footnote 2 For the formerly enslaved, two of the most important post-war goals were guaranteeing the franchise and equal protection under the law. They had also played a critical role in securing the defeat of the Confederacy and their own freedom. By 1865, 10% of all Union troops were Black and, equally important, Black Southerners provided valuable intelligence to Union troops throughout the war (Litwack Reference Litwack1979).
For most white Southerners, the end of the war represented an almost unfathomable humiliation. White Southerners faced a reality in which a large proportion of military-aged white Southern males died during the war, Union soldiers were still occupying the South (including eighty thousand Black Union troops [Litwack Reference Litwack1979]), they had suffered enormous economic losses due to the destruction of slavery, and were now forced to treat their former chattel as social and political equals. In addition, former Confederate combatants were not allowed to vote or carry weapons until they re-pledged allegiance to the Union. The post-war situation was described in apocalyptic terms by white Southerners sympathetic to the Confederacy. In her 1914 textbook, future UDC Historian-General Laura Rose Martin, describes the Reconstruction period as far worse than the actual civil war, calling Reconstruction “a situation fraught with more terrors than the war itself” and as a “bondage worse than death” (Rose Reference Rose1914, 16-7).
At the risk of oversimplifying a complex historical period, I conceptualize the period between the end of the Civil War and the end of Reconstruction (1865–77) as a protracted contest between a vision of an unranked, more egalitarian political order and a ranked, hierarchical one (Horowitz Reference Horowitz2001).Footnote 3 On the one hand, the Reconstruction period represented an attempt at creating an unranked ethnic system in the form of a multiracial democracy, what Foner (Reference Foner2019) has called the Second Founding (Du Bois Reference Du Bois and Gates2014; Foner Reference Foner2002).Footnote 4 On the other hand, we can characterize “redemption” policies—which involved the use of violence, electoral intimidation, and attempts to legally restrict democratic participation—as an attempt by Southern whites to restore central elements of a social order defined by white superiority and impose a system of legal segregation (Byman Reference Byman2021; Du Bois Reference Du Bois and Gates2014). We now know that the ranked vision won the day, establishing authoritarian enclaves in the former Confederacy until the Civil Rights Movement of the mid-twentieth century, and over time, forcing many who objected to flee northward (Mickey Reference Mickey2015; Tolnay and Beck Reference Tolnay and Beck1992). Du Bois writes that over this time period “a determined psychology of caste was built up. In every possible way it was impressed and advertised that the white was superior and the Negro an inferior race. This inferiority must be publicly acknowledged and submitted to” (Du Bois Reference Du Bois and Gates2014, 695). I argue that white Southerners used the construction of Confederate monuments and the gruesome performative violence of lynching—alongside public executions—to build this social order.
Lynching and Performative Violence
The post-Reconstruction period in the former Confederacy was characterized by pervasive racial terrorism. There were 3,823 lynching victims between 1877 and 1928, and likely far more whose deaths were never recorded. By 1928, nearly 70% of counties in the 11 former Confederate states experienced at least one lynching event. This figure was over 90% in Mississippi, Louisiana, and Alabama. See Figure 1 for a spatial distribution and Table A5 in Section F.8 of the Supplementary Material (SM) for a full breakdown by state. Even shortly after the time period, Black thinkers understood lynching’s broader purpose as far more than mere vigilantism: “Lynchings serve the indispensable social function of providing whites with the means of periodically reaffirming their collective sentiment of white dominance” (Cox Reference Cox1945, 581). The practice of lynching was a “routine and systematic effort to subjugate the African-American minority” (Tolnay and Beck Reference Tolnay and Beck1995, 17) through the use of extralegal, extra-lethal,Footnote 5 quasi-ritualistic violence (Cox Reference Cox1945; Wells-Barnett Reference Wells-Barnett2002; Wood Reference Wood2009; Patterson Reference Patterson1998). This kind of lynching was distinct from other forms of vigilante violence in U.S. history, with scholars suggesting that this period represents a unique “lynching regime” governed by the logic of ethnic terrorism (Seguin and Rigby Reference Seguin and Rigby2019; Staggs Reference Staggs2021).
Spatial Distribution of Lynching Events in the Former Confederacy by 1928
Note: The map shows the spatial distribution of lynching events by 1928 in the counties of the 11 former Confederate states (AL, AR, FL, GA, LA, MS, NC, SC, TN, TX, VA). Counties highlighted in gray experienced at least one lynching event between 1870 and 1928. Counties highlighted in white did not.

One of the core functions of lynching was to serve “as a symbolic manifestation of the unity of white supremacy” (Tolnay and Beck Reference Tolnay and Beck1995, 50). These extralegal activities were often carried out openly and proudly, with grisly depictions of the violence shared via postcards, stories, and newspapers afterwards (Wood Reference Wood2018, 759). This was, in many ways, the whole point. Lynchings were often festival-like gatherings with large crowds, which reflected widespread public sentiment, and in which it was not unusual for prominent members of a community to participate in the mob (Douglass Reference Douglass1892; Tolnay and Beck Reference Tolnay and Beck1995; Wells-Barnett Reference Wells-Barnett2002).
Contrary to common perception, lynchings were likely not a result of action by organized groups such as the Ku Klux Klan (KKK). The lynchings of the post-Reconstruction period peaked in the early 1890s, during years in which the KKK was likely inactive (see Figure 2). Although the use of KKK discourse and ideology persisted throughout the late nineteenth and early twentieth century, the first KKK was disbanded by 1872, five years prior to Reconstruction’s end, and was only reconstituted as the second KKK in 1915 (Parsons Reference Parsons2015). This understanding of lynching is consistent with contemporary scholarship about vigilantism which recognizes its influence on public discourse and social hierarchies (Bateson Reference Bateson2021). Indeed, recent work shows that lynchings were more likely in counties that had been occupied by Black union troops during the Civil War and Reconstruction (Byun and Kwon Reference Byun and Kwon2025), in counties in which Democrats lost the popular vote (Testa and Williams Reference Testa and Williams2025), and in counties that had a Freedman’s Bureau office (Chyn, Haggag, and Stuart Reference Chyn, Haggag and Stuart2024). This evidence conforms with the notion that lynching violence was rooted in a desire to reverse perceived status loss and shape power relations.
Lynching Events, Lynching Victims, and Confederate Monument Dedications in the Former Confederate States, 1870–1928
Note: The plot summarizes the number of lynching events, lynching victims, and Confederate monument dedications in the former Confederate states between 1870 and 1928. The solid black line represents the number of lynching events. The two-dashed gray line represents the number of lynching victims. The dashed black line represents the number of Confederate monuments dedicated.

Lynchings proliferated despite the fact that the Southern legal system remained unmistakably hostile to Black Americans (Litwack Reference Litwack1979). In fact, both lynchings and public executions were violent spectacles that frequently had similar features. Lynchings emulated and took on the characteristics of the public executions of the time period: “The boisterous behavior at lynching rituals, the taking of photographs and the collecting of souvenirs, were carryovers from public hangings” (Wood Reference Wood2018, 773). While political scientists routinely make the analytical distinction between legal, state-led violence and vigilantism, I propose a different kind of distinction here. In the case of the postbellum South, where legal and extralegal violence worked in tandem to enforce racial hierarchy, the relevant distinction is between public, performative violence and purely coercive violence. I argue that public hangings and lynchings are conceptually similar. To be clear, this is an ideal-type distinction and many forms of violence might include both performative and coercive dimensions. There is no doubt that lynching and public executions were coercive in addition to being performative.
While instances of lynching continued throughout the twentieth century, their frequency declined substantially from their peak in the early 1890s, as can be seen in Figure 2. Scholars are divided about the causes of lynching’s decline: variously attributing it to changes in the economic structure of the Southern states, fluctuations in cotton prices, an increase in state violence against Blacks, as well as greater normative pressure from anti-lynching activists and the Northern public (Bailey and Tolnay Reference Bailey and Tolnay2015; Clarke Reference Clarke1998; Smångs Reference Smångs2016a; Reference Smångs2016b; Tolnay and Beck Reference Tolnay and Beck1995; Weaver Reference Weaver2019). While these explanations are plausible they are also incomplete. Economic explanations struggle to account for lynching’s performative nature: it is not immediately obvious why a change in prices would lead someone to hang or mutilate their neighbor in a public spectacle. The argument that state-led violence—in the form of legal executions—acted as a substitute to lynchings (see Clarke Reference Clarke1998) does not address why legal violence against Blacks, which was a readily available option throughout the peak of the lynching era, was suddenly deemed preferable to the extralegal violence represented by lynching. Moreover, this argument does not distinguish between lynch-like public executions by hanging and private executions. The latter were carried out via the electric chair without an audience, within the confines of a penitentiary, and can therefore be considered more strictly coercive. Public executions follow similar patterns to lynching while private executions do not (as can be seen in Figure A10 in Section B.3 of the SM).
The contention that normative pressure—facilitated by the development of railroads and applied through the work of anti-lynching activists—was effective in reducing lynching (Weaver Reference Weaver2019) is appealing but there are reasons to believe that its effects were partial. Lynching was condemned nationally and even locally within the South, but the practice persisted and was a central focus of civil rights organizations well into the mid-twentieth century. Chronologically, the NAACP was not founded until 1909, well past lynching’s peak, and struggled to build effective chapters in the South from its headquarters in New York. For instance, in a 1925 letter from the NAACP’s Director of Branches to a Mr. William Porter of Montgomery, Alabama, the Director laments that “…looking over our records, I find that Alabama has made an exceedingly poor showing, most of the branches of the state having done very little for the Association.”Footnote 6 Additionally, the political power of the Southern states, especially in the U.S. Senate, was robust enough to resist federal anti-lynching legislation well into the 1950s.
By the 1910s, mainstream historical understanding of the Civil War and Reconstruction was overwhelmingly sympathetic to the South or at least to the idea of sectional reconciliation. This trend was exemplified by the screening of the film Birth of a Nation in 1915 in Woodrow Wilson’s White House, as well as the 1914 dedication of a Confederate monument at Arlington National Cemetery. And as Ang (Reference Ang2023) has shown, screenings of the movie increased rates of violence and KKK membership. In addition, Bazzi et al. (Reference Bazzi, Ferrara, Fiszbein, Pearson and Testa2023) provide evidence that as Confederates and their descendants migrated away from the former Confederacy, they brought Confederate culture along with them. Moreover, during the 1920s, the revived, second KKK was a powerful national organization with millions of members.
Descriptive patterns suggest that the logic of substitution described above is plausible, although of course, I am not suggesting that monument construction is the sole cause of change in performative violence. Figure 2 shows that as the rate of lynching declined, the rate of monument dedications increased (see also Figures A10 and A11 in Section B.3 of the SM). Notably, this figure does not show continued monument presence in a given year, only the dedication of new monuments in a given year.
Confederate Monuments
Drawing on the theoretical account of political symbols, I propose an under-appreciated cause of the decline in lynchings and anti-Black performative violence: the proliferation of Confederate monuments throughout the post-Reconstruction South. The primary purpose of Confederate monument construction was the glorification of the Lost Cause and absolution for Confederate soldiers and their leaders (Cox Reference Cox2004; Brundage Reference Brundage2008; Wilson Reference Wilson1980). This was not only an ideological battle. Understandably, the descendants of Confederate soldiers did not want their own children to view their fathers, uncles, and grandfathers as traitors to the US. As one UDC Secretary-General put it to the organization’s annual convention in 1917, its members have been “working with tireless zeal… to teach our children that not one drop of the blood of traitors flowed through the veins of their Confederate ancestors!” (Odenheimer and Merchant Reference Odenheimer and Merchant1918, 8).
Monument construction was a central pillar in a broader set of activities meant to rehabilitate the reputation of the defeated Confederacy and transmute the perceived shame and humiliation of Reconstruction into a source of pride. Although the architects of this strategy were a range of Confederate heritage organizations engaged in monument construction (including the United Sons of Confederate Veterans, United Confederate Veterans, and Ladies Memorial Associations), it was the women of the UDC who were the most effective builders of Confederate monuments. They launched highly effective campaigns to build monuments, introduced textbooks teaching their preferred version of history into schools, wrote catechisms to instruct children in the history of the Confederacy, and established rituals to memorialize the Confederate dead (such as marking Confederate Memorial Day). Figure 3 shows the spatial distribution of UDC chapters and Confederate monuments.Footnote 7 While the two are not perfectly correlated, it is evident that most counties with monuments also had a UDC chapter. Equally important, it is worthwhile noting that not all counties with UDC chapters also had a monument, reflecting the fact that other organizations were also responsible for monument construction and that not all UDC chapters were equally effective.
Spatial Distribution of United Daughters of the Confederacy (UDC) Chapters and Confederate Monuments
Note: The map shows the spatial distribution of UDC chapters and Confederate monuments by 1928 in the counties of the 11 former Confederate states (AL, AR, FL, GA, LA, MS, NC, SC, TN, TX, VA). Counties highlighted in dark gray have a UDC chapter present by 1919. Counties highlighted in light gray do not. Black dots indicate the presence of a Confederate monument in a county by 1928.

The dedication ceremonies of Confederate monuments reflected both the importance of this intergenerational mission, as well as the white supremacist message they conveyed. The dedications of monuments were often grand, community-wide affairs that included parades and speeches, frequently involving white children unveiling the monuments as if they were gifts to be opened (Cox Reference Cox2004). By the end of the nineteenth century, UDC-funded Confederate monuments were often built in public and conspicuous spaces, such as courthouses and town squares precisely so that children could routinely observe them and internalize the status quo they communicated (Brundage Reference Brundage2008; Cox Reference Cox2004). This shift in location also coincided with a shift in the content of the inscriptions on the monuments, which became far more focused on Lost Cause ideology, as opposed to individual memorializing of the fallen (O’Connell and Forrest Reference O’Connell and Forrest2020). Dedication ceremonies also included speeches by prominent public figures or Confederate veterans.Footnote 8 The speeches are quite explicit about the purpose of the monuments: celebrating the reversal of the unjust social order of the Reconstruction era and the affirmation of the re-emerging white supremacist order. The following excerpt from a speech given at the 1913 dedication of a monument on the campus of the University of North Carolina in Chapel Hill is illustrative.
The present generation, I am persuaded, scarcely takes note of what the Confederate soldier meant to the welfare of the Anglo Saxon race during the four years immediately succeeding the war, when the facts are, that their courage and steadfastness saved the very life of the Anglo Saxon race in the South when “the bottom rail was on top” all over the Southern states, and to-day, as a consequence the purest strain of the Anglo Saxon is to be found in the 13 Southern States. Praise God. (Carr Reference Carr1913)
The passage shows the desire to transmit coalitional information about racial hierarchy across generations. The phrase “the bottom rail was on top” was used to describe the perceived status inversion that white Southerners resented during the Reconstruction era. Confederate heritage organizations actively fostered this sentiment. For instance, the initiation ritual of the USCV included a definition of the Confederacy as the last “white man’s government that the world ever saw.”Footnote 9
While they were relatively small, Confederate heritage organizations were effective at marshaling people and resources to help achieve their goals. For instance, a company operating a casino and dancing pavilion in Montgomery, AL, provided the free use of its facilities for a 1903 fundraiser to build a monument.Footnote 10 In other instances, railroad companies provided subsidized transport to unveiling ceremonies in order to increase attendance.Footnote 11
Causal Effects of Confederate Monuments on Performative Violence
Drawing on this historical record, and on the theory developed above, I argue that performative violence—especially lynching—and Confederate monuments served similar purposes in the post-Reconstruction South. They both reified a newly reconstituted racial hierarchy in which Black Southerners occupied an unmistakably subordinate position. They both communicated the existence of this hierarchy to the public and to future generations raised in their imposing shadow. This similarity in function suggests that the presence of Confederate monuments may have caused a decline in performative violence.
Existing work on the direct relationship between lynching and Confederate monuments argues that Confederate monuments increase white supremacist sentiment and therefore encourage further violence, suggesting a logic of permission and amplification. Henderson et al. (Reference Henderson, Powers, Claibourn, Brown-Iannuzzi and Trawalter2021) and Turner and Binkovitz (Reference Turner and Binkovitz2021) both use cross-sectional data to suggest that the presence of a Confederate monument in a county predicts a greater likelihood of lynching. Recent work by Taylor (Reference Taylor2025) finds that in the immediate post-Reconstruction period Confederate monuments increased Democratic vote share and had little discernible effect on lynchings. Similarly, Bazzi et al. (Reference Bazzi, Ferrara, Fiszbein, Pearson and Testa2023) have found evidence for this connection in areas of the country outside of the former Confederacy, as white Southerners migrated in the twentieth century. While it is true that Confederate monument construction reflected white supremacist sentiment, reconsidering monuments in light of my theory suggests a logic of substitution. In the former Confederacy, monuments affirmed and reassured whites’ dominant position, therefore alleviating the desire to engage in performative violence. This logic also leads to an alternative explanation for the decline in lynching in the aftermath of Reconstruction: the motivation to commit performative violence was attenuated once white Southerners believed that a post-war racial social order was restored. I argue that Confederate monuments enabled the internalization of this belief by generating common knowledge about the social order. This would be fully consistent with the explicit mission of the Confederate heritage organizations which financed, designed, and built the monuments.
My theoretical account contributes to racial threat theory in three ways. First, it highlights the conditions under which threat is perceived and attenuated. In that sense it is in the tradition of Cunningham’s (Reference Cunningham2013) account of the emergence of the KKK in North Carolina during the Civil Rights era, which shows that racial threat is understood and mediated in unexpected ways. Second, it also allows us to test how racial threat is activated beyond changing demographic composition alone, extending work by Jardina (Reference Jardina2019) and McClerking (Reference McClerking2001). Third, while racial threat theory suggests that greater perceived threat leads to attempts at social control (such as violence), I offer some specificity about what types of political violence we can expect to see (coercive or performative).
The argument also has clear observable implications for the removal of Confederate monuments and other symbols of the Confederacy. The theory suggests that the removal of political symbols can lead to political violence since it signals that the status quo is contested. Existing work suggests that monument removal improves racial attitudes and may lead to a modest decline in anti-Black hate crimes, but that study only examines the time period between 2014 and 2015 with respect to violence (Rahnama Reference Rahnama2024). In non-U.S. contexts, there is some evidence pointing in the opposite direction—whereby removal of monuments or the changing of street names leads to political backlash (Rozenas and Vlasenko Reference Rozenas and Vlasenko2021; Villamil and Balcells Reference Villamil and Balcells2021). The removal of Confederate monuments signals that the existing social order is under threat, increasing the motivation for violence.
I empirically test two hypotheses that emerge from my theory.
-
1. Substitution Hypothesis: Counties in which monuments were built were less likely to experience a subsequent lynching or performative violence event compared to counties without monuments.
-
2. Removal Hypothesis: Counties in which Confederate monuments were removed are more likely to experience an increase in anti-Black hate crimes compared to counties with monuments.
RESEARCH DESIGN AND EMPIRICAL STRATEGY
To test these hypotheses, I employ a difference-in-differences design with staggered treatment timing to estimate the causal effect of Confederate monuments on the likelihood of lynching between 1877 and 1928 in the 11 former Confederate states. I construct a panel dataset of Confederate monuments and lynchings between the years 1877 and 1928, which takes the county and 3-year bins as its primary units of analysis (county-bin). The county is the standard unit of analysis used in previous work (Seguin and Rigby Reference Seguin and Rigby2019; Tolnay and Beck Reference Tolnay and Beck1995). I use 3-year bins as the time unit for two primary reasons. First, staggered treatment estimators do not perform well and risk losing observations if there are small treatment cohorts in specific years. While binning sacrifices some granularity, it provides more reliable treatment effect estimates, and most important, uses all the available observations. Second, binning by three years allows me to more easily rule out the possibility of treatment anticipation, a critical identifying assumption for difference-in-differences. While there was variation in the time it took to build monuments, 3 years is a reasonable duration to account for fundraising, design, and construction of a monument (alternative 1- and 10-year bins are presented in Section E of the SM).
I use both lynching count and binary variables (i.e., whether any lynching event took place) as the primary outcomes. While multiple lynchings in the same county in the same year were quite rare, it is more reasonable to test for the quantity of lynching events when using 3-year bins. In addition, throughout the manuscript, I also present results for performative violence outcomes, combining lynching and public executions together since they conform with the central idea that Confederate monuments substitute for performative violence.
I restrict the timeframe to 1877–1928 for both conceptual and practical reasons. Conceptually, the end of Reconstruction in 1877 marked the beginning of the period of “redemption,” while the 1928 onset of the Great Depression fundamentally altered the country. Practically, the years between 1865 and 1877 were marked by upheaval and highly unreliable reporting on lynching, although it is likely that the rate of anti-Black violence was very high (Litwack Reference Litwack1979, 276–7). Following standard practice in the difference-in-difference literature, I conceptualize the treatment as binary (Roth et al. Reference Roth, Sant’Anna, Bilinski and Poe2023). Once a county has a monument dedicated, I consider treatment “on” in that county. Most counties with monuments only have one monument, and no county had a monument removed in the time period.Footnote 12
I use staggered difference-in-differences estimators that are designed to accommodate cases in which there are meaningful departures from the classic two-way fixed effects setup (Callaway and Sant’Anna Reference Callaway and Sant’Anna2021; Roth et al. Reference Roth, Sant’Anna, Bilinski and Poe2023; Roth and Sant’Anna Reference Roth and Pedro H. C.2023; Sun and Abraham Reference Sun and Abraham2021). In the case of Confederate monument dedications (the treatment or independent variable), there is staggered rather than uniform treatment timing (monuments were built in different counties in different years), multiple rather than two time periods (a 52-year time period), and the possibility of heterogeneous treatment effects (monuments may have affected the likelihood of lynching differently across counties and time periods). In addition, a causal interpretation of the classic two-way fixed effects estimator relies on several identifying assumptions that can be implausible in most real-world settings. Staggered estimators allow for some violations of these identifying assumptions without losing the ability to make causal claims.
Identifying Assumptions
Difference-in-differences estimators can have a causal interpretation under three identifying assumptions: parallel trends, no anticipation, and uniform treatment effects. The parallel trends assumption states that absent treatment (in this case, a Confederate monument dedication) the treated (counties with monuments) and control groups (counties without monuments) would continue in parallel along the same outcome trend lines (lynching events and performative violence). Importantly, this does not mean that the two groups have the same pre-treatment values, only that the trends over time move more or less in parallel and the trajectory is only altered by the introduction of the treatment (a monument). Prior to monument dedications counties that eventually get monuments and counties that do not should follow the same trend in lynching events, and would have continued to follow this trend absent monument dedications. The parallel trends assumption does not require that monuments be randomly or quasi-randomly built and, while pre-treatment trends are a useful plausibility check, the assumption refers to the potential outcome trend post-treatment. The parallel trends assumption is plausible in the case of Confederate monument dedication and the pre-treatment trends presented below provide additional evidence. I also conduct formal sensitivity analyses and report results that condition the parallel trends assumption on covariates in Section F.2 of the SM.
Although monuments were not randomly assigned, their exact construction pattern and timing was not easily predictable. Various constellations of Confederate heritage organizations built monuments, occasionally with financial support from local or state governments. While Confederate monuments reflected white supremacist sentiment, we can assume that with perhaps a few exceptions,Footnote 13 racial animus and support for the concept of white supremacy was fairly widespread in the former Confederacy. While a monument was likely to be built in a county if there was a chapter of a Confederate heritage organization, this was by no means guaranteed (see Figure 3). Monument construction relied on chapters that wanted to build a monument in a county and able to raise the funds and see the construction to fruition. Just as the UDC was able to place a Confederate flag in white public schools in the former Confederate states, their intention was to raise monuments throughout the former Confederacy (Cox Reference Cox2004). While local chapters often built monuments in their home counties, it was not unusual for chapters to raise funds for one another’s monuments (for instance, during annual conventions), or for chapters to build monuments outside their home county. Chapters also banded together to raise funds for large and especially important projects. Excepting variation in fundraising and organizational capacity, there were probably a range of idiosyncratic, unpredictable, and, in my view, not entirely obvious reasons why a monument was or was not built in a particular county in a particular year. There is no a priori reason to believe that monuments were predisposed to be built in some counties but not others.
The no anticipation assumption stipulates that the process of building Confederate monuments did not affect lynching likelihood prior to the monument itself being dedicated. This assumption is plausible for three main reasons. First, monuments were dedicated to great fanfare, in large-scale ceremonies with large crowds in attendance. There was a clear demarcation between the period prior to the monument dedication and the period after its dedication. There is little chance that individuals would mistake the monument as being “on” prior to its unveiling ceremony, and therefore it would be unlikely to exert influence on behavior prior to its formal dedication. Second, the actual dedication date was governed by an unpredictable fundraising, design, and construction process, making it difficult to exactly anticipate when a monument would be complete. Some monuments would have a base built or cornerstone laid but then would take several years until the entire structure was finished. Successful monument dedications were difficult to anticipate in advance, making it less likely for them to affect lynching prior to dedications. Third, it is possible that mobilization prior to monument dedication somehow affected the likelihood of violence before the unveiling. Perhaps the collective action that led to monument dedications influenced the probability of violence. This is unlikely since construction efforts were carried out over the course of multiple years by relatively small monument committees. While these activists intermittently cajoled sympathetic community members for funds and participation, most other white community members were not actively mobilized toward the construction of the monument.
The third identifying assumption requires that monuments should affect counties in which they are dedicated in similar ways and that they only affect those counties in which they were dedicated, rather than adjacent counties. In other words, the treatment effects need to be largely homogeneous and there must be no spatial spillover effects or interference between units. This assumption is less plausible in the case of Confederate monument dedication. While the meaning of the monuments is quite clear, it is possible that Confederate monument dedications affected neighboring counties and that monuments did have heterogeneous treatment effects, especially given the fact that monuments were dedicated at different times. Fortunately, both of these possible violations can be addressed. Staggered difference-in-differences estimators—like the ones used in this study—are able to accommodate treatment effect heterogeneity. Below I also explicitly explore treatment effect heterogeneity related to racial threat and I perform robustness checks to examine spatial correlation and spillover effects in Section F.8 of the SM.
I discuss additional threats to inference in detail in Section C of the SM and enumerate robustness checks below.
Estimation
The primary estimator I use is called the group-time average treatment effect (Callaway and Sant’Anna Reference Callaway and Sant’Anna2021).Footnote 14 The intuition behind this estimator is that in cases with staggered treatment timing, counties should first be divided into groups (g) based on treatment date. The parameter estimates the average treatment effect for units in a specific group (g) at a particular time period (t). This approach is meant to accommodate treatment effect heterogeneity. The logic is that groups treated during the same time may be more similar to one another compared with groups treated later or earlier. This feature is especially appealing in settings with relatively longer time frames, as is the case with Confederate monuments. For instance, it is quite possible that counties in which monuments were dedicated in 1910 (call them the 1910 cohort) are more similar to each other as opposed to counties that are part of the 1882 cohort.
Equation 1 puts this approach in potential outcomes notation, where g is the specific group/cohort in which monuments were dedicated, t is a particular time (in my case, 3-year period), Y is the outcome (lynching/performative violence), G is the more general notation for group/cohort, and C is the control group (those counties without monuments either because they are never built or because they have yet to be built in time period t):
 $$ \begin{array}{r}ATT(g,t)=E[{Y}_t-{Y}_{g-1}|G=g]-E[{Y}_t-{Y}_{g-1}|C=1].\end{array} $$
The group-time average treatment effect estimator calculates these values for all cohorts across the relevant time frame. The comparisons to years prior to each cohort being “treated” are used to form the pre-treatment trend estimates. I then aggregate these individual parameters into an overall average treatment effect in one of two ways. First, a simple weighted average across the entire timeframe, which is weighted according to the number of observations per cohort, so larger cohorts have greater weight. Second, as event study parameters, which estimate the treatment effect of monuments e periods after a monument is dedicated. Equation 2 presents the event-study estimator, where w is the weight, and $ g+e $
is used instead of t. I report results for both types of aggregation:
$ g+e $
is used instead of t. I report results for both types of aggregation:
 $$ \begin{array}{rl}{ATT}_w^e={\displaystyle \sum_g}{w}_gATT(g,g+e).& \end{array} $$
The group-time average treatment effect estimator can also have a causal interpretation if we relax the parallel trends assumption such that it only holds conditional on relevant pre-treatment covariates. In this case, a doubly-robust estimation method is used (see Callaway and Sant’Anna Reference Callaway and Sant’Anna2021; Sant’Anna and Zhao Reference Sant’Anna and Zhao2020). As a robustness check, I also condition the parallel trends assumption on covariates (see Section F.2.2 of the SM) and report alternative difference-in-differences estimators (see Section E.1 of the SM).
As another plausibility check, I also report more standard two-way fixed effects estimation, presented in Equation 3. $ \delta $
is the parameter of interest where
$ \delta $
is the parameter of interest where $ MonumentCounty $
/
$ MonumentCounty $
/ $ MonumentRemoval $
is a binary indicator of whether that county-bin has a monument built or removed.
$ MonumentRemoval $
is a binary indicator of whether that county-bin has a monument built or removed. $ \alpha $
is a unit fixed effect and
$ \alpha $
is a unit fixed effect and $ \gamma $
is the time fixed effect. The subscript i is a unit indicator, in this case a county. The subscript t is a time indicator, in this case 3-year bins. I also use the two-way fixed effects estimators (TWFE) and the same type of specification to test the effect of Confederate monument removal on anti-Black hate crimes:
$ \gamma $
is the time fixed effect. The subscript i is a unit indicator, in this case a county. The subscript t is a time indicator, in this case 3-year bins. I also use the two-way fixed effects estimators (TWFE) and the same type of specification to test the effect of Confederate monument removal on anti-Black hate crimes:
 $$ \begin{array}{rl}\begin{array}{l}PerformativeViolenc{e}_{it}={\alpha}_i+{\gamma}_t\\ {}\hskip11em +MonumentCounty{\delta}_{it}+{u}_{it,}\\ {}AntiBlack{HateCrimes}_{it}={\alpha}_i+{\gamma}_t\\ {}\hskip9.5em +MonumentRemoval{\delta}_{it}+{u}_{it.}\end{array}& \end{array} $$
Data Sources
To construct the panel dataset used in the analysis, I use six different data sources. Additional detail about each data source is provided in Section A of the SM. Confederate monuments data are taken from the Southern Poverty Law Center’s “Whose Heritage?” project (SPLC 2019). Lynching data are from (Bailey and Tolnay Reference Bailey and Tolnay2015) and lynching data for Texas were hand-coded from the Equal Justice Initiative’s (EJI) Legacy Museum. Demographic and economic covariate data are taken from the U.S. Census via ICPSR (Haines and Inter-University Consortium for Political and Social Research Reference Haines2010). UDC chapter data are from Bazzi et al. (Reference Bazzi, Ferrara, Fiszbein, Pearson and Testa2023) and supplemented by hand-coding of UDC Annual Meeting minutes. Executions data are from the Espy file (Espy and Smykla Reference Espy and Smykla2016). Hate crimes data are collected by the FBI (Federal Bureau of Investigation N.d).
RESULTS
I report results estimating the effect of Confederate monument presence on performative violence outcomes. I test the Substitution Hypothesis by estimating the group-time average treatment effect of monument presence on performative violence outcomes, which I present alongside TWFE estimation. Second, I present event-study results that allow us to conduct “visual inference” of the parallel trends assumption by investigating pre-treatment parallel trends, and to test whether Confederate monuments’ effects strengthen or weaken over time (Roth Reference Roth2024). Third, I explore treatment effect heterogeneity based on subsample analyses of demographic and economic variables related to racial threat. Fourth, I summarize a range of robustness checks that account for the impact of UDC presence in a county, victim’s race, economic factors, spatial spillover, and demographic compositional changes. Fifth, I present results that test the effect of the removal of Confederate monuments on the likelihood of anti-Black hate crimes. As a placebo test, I also estimate the effect of monument removal on antisemitic hate crimes.
The results provide strong support for both the Substitution and Removal Hypotheses. The dedication of Confederate monuments appears to have reduced the likelihood of lynching and performative violence, while their removal appears to increase the likelihood of anti-Black hate crimes but not antisemitic hate crimes.
Main Specifications
Figure 4 presents the main test of the Substitution Hypothesis and the overall theory: what is the effect of Confederate monument presence on performative violence? The figure presents the average treatment effect of Confederate monuments on performative violence outcomes in a given county in a 3-year time period. The main estimator is the group-time average treatment effect (called Staggered CS in the figure and labeled with a dot). The figure also includes a more traditional two-way fixed effects difference-in-differences estimator for comparison (called TWFE in the figure and labeled with an empty triangle). The left-hand side panel, titled Lynching Only, presents the effect of monument construction on both a binary and continuous lynching outcome variable. The right-hand side panel, titled Lynching and Public Executions, presents the effect of monument construction on all instances of performative violence, both lynching and executions. The figure presents a binary and continuous construction of this variable. If the theory is correct, then we should expect to see negative coefficients for all of these outcomes.Footnote 15
The Causal Effect of Confederate Monuments on Performative Violence Outcomes
Note: The coefficient plot presents the effect of Confederate monument presence on the likelihood of four different performative violence outcomes. The main estimator is the group-time average treatment effect estimator, labeled Staggered (CS) and represented with a circle. For the staggered estimator, standard errors are clustered at the county level and calculated using simultaneous confidence bands and bootstrapping. For comparison, a two-way fixed effects estimator, labeled TWFE and represented by an empty triangle is also shown. For TWFE, county and period are used as fixed effects and standard errors are clustered at the county level. All models use 3-year bins and cover the period between 1877 and 1928 in the 11 former Confederate states. Binary indicates a binary outcome variable. Count indicates a continuous outcome variable. Dots are coefficient estimates and whiskers are 95% confidence intervals. ATT stands for Average Treatment effect on the Treated and the numbers are the precise coefficient estimates of each model. Full tables of the results are presented in Tables A6 and A7 in Section D of the SM.

This is indeed what the figure shows. Consistent with the substitution hypothesis, the results suggest that counties in which Confederate monuments are dedicated are subsequently less likely to experience lynching events specifically, and performative violence events generally. The results are consistent—though they vary in magnitude—across all four outcomes and both types of estimators. All model estimates are statistically significant at conventional levels. The results are also substantively significant. When looking at the binary indicator for lynching and performative violence, a Confederate monument dedicated in a county makes lynching approximately 5 percentage points less likely in a given county-bin, relative to the sample mean of 0.12. Performative violence in general is 9 percentage points less likely. When extrapolating across the 52 years between 1877 and 1928, I estimate that approximately 315 lynching events and 725 performative violence events did not occur due to the presence of a Confederate monument in a county.
I estimate an event study design of the group-time average treatment effect to probe the parallel trends and no anticipation assumptions and to test whether the effect of Confederate monument dedications strengthens or decays over time. The event study parameter estimates the effect of exposure to treatment at various time points following monument dedication. Each period refers to a 3-year bin: period 0 is the first period of monument construction (e.g., 1900–1902 for a monument erected in 1900, 1901, or 1902), period 1 includes years 3–5 post-construction (e.g., 1903–1905), and so on. Figure 5 shows the event study of the group-time average treatment effect estimator. The aggregate dynamic group-time average treatment effect (called ATT in Figure 5) is larger than the simple aggregate estimate of the group-time average treatment effect presented in Figure 4: −0.161 and statistically significant at conventional levels. The event study also allows us to visually inspect the pre-treatment trends. The pre-treatment trends are statistically indistinguishable from zero, providing plausible evidence that the parallel trends assumption holds. In other words, there is no statistically significant difference in the likelihood of lynching between treated and untreated counties in the 30 years prior to monument dedication. The results in Figure 5 also suggest that the effect of Confederate monuments strengthen rather than decay, as it takes time for individuals to internalize the status quo generated by the monuments.
The Effect of Confederate Monuments on the Number of Lynching Events in a Period. Event Study of Group-Time Average Treatment Effect
Note: The figure presents a dynamic estimation of the effect of exposure to Confederate monuments on the number of lynching events. Zero is the first treatment period. The dotted line separates pre-treatment periods from post-treatment periods. The estimator is the Callaway and Sant’Anna doubly-robust estimator for group-time average treatment effect. Years are binned into 3-year periods. Dots are coefficient estimates. Whiskers are 95% confidence intervals which are clustered at the county level and calculated using bootstrapping and continuous confidence bands. ATT is the aggregated average treatment effect. SE is the standard error. Table A8 in Section D of the SM presents the full results.

In addition, Figure 6 presents the results of an event study estimating the effect of Confederate monument presence on performative violence aggregating lynching events and public executions into a single variable. Much like in Figure 5, the pre-treatment trends appear indistinguishable from zero, suggesting that the parallel trends assumption is plausible, and the post-treatment periods show a sharper decline in the likelihood of performative violence. Similar to the results in Figure 4, the effect size is larger than for lynching events alone. The aggregate coefficient estimate is −0.366 and statistically significant at conventional levels. This result is robust to additional specifications using different permutations of the dependent variable, as well as ones that condition parallel trends on covariates (see Section F.2.2 of the SM). I also provide formal sensitivity analysis of the parallel trends assumption in Section F.2 of the SM, which suggests that the results are robust to departures from linearity due to secular trends.
The Effect of Confederate Monuments on the Number of Performative Violence Events (Lynchings and Public Executions). Event Study of Group-Time Average Treatment Effect
Note: The figure presents a dynamic estimation of the effect of exposure to Confederate monuments on the number of performative violence events. Performative violence events are both lynchings and public executions. Zero is the first treatment period. The dotted line separates pre-treatment periods from post-treatment periods. The estimator is the Callaway and Sant’Anna doubly-robust estimator for group-time average treatment effect. Years are binned into 3-year periods. The timeframe is 1877–1928. Dots are coefficient estimates. Whiskers are 95% confidence intervals which are clustered at the county level and calculated using bootstrapping and continuous confidence bands. ATT is the aggregated average treatment effect. SE is the standard error. Table A9 in Section D of the SM presents the full results.

It should be noted that the individual estimates are relatively imprecise: while the point estimates remain negative throughout the treatment periods, the later treatment estimates have increasingly wide confidence bands. This could suggest that there is some source of additional treatment effect heterogeneity, or simply could be a mechanical function of the dependent variable becoming sparser over time. However, the results in Figure 6 are less noisy once public executions are included.
Treatment Effect Heterogeneity Based on Racial Threat
A plausible alternative explanation is that monuments may be incidental to broader dynamics associated with racial threat—that is, the central findings may reflect underlying structural and demographic conditions rather than the influence of monuments themselves. For instance, we should expect counties with large and/or growing Black populations, entrenched histories of slavery, or more intense cotton production to experience both more violence and more monuments. If this is the case, then monuments are not attenuating performative violence; rather, they are co-occurring with other conditions that drive both violence and commemoration. Under this account, we should expect most of the effect of monuments to be concentrated in counties with less racial threat and lower white supremacist sentiment because the underlying structural conditions—rather than the monuments—are causing the decline in violence. In other words, it is possible that monuments are simply built in counties where racial threat is lower.
To address this possibility, I split the sample into two groups based on ten covariates commonly associated with racial threat, including the proportion of the Black population, change in Black population share, indicators of the historical intensity of slavery, cotton output, and other characteristics.Footnote 16 I then estimate the causal effect of monuments on anti-Black performative violence for each subsample separately in order to see whether the aggregate effect reported above is systematically concentrated in certain counties and not others.Footnote 17
Figure 7 presents the results of this subgroup analysis. The findings suggest that Confederate monument presence attenuates performative anti-Black violence in precisely those counties where we might expect racial threat to be highest prior to the introduction of monuments. This means that among counties with higher indicators of racial threat, counties where Confederate monuments were built experienced lower rates of anti-Black performative violence compared to similar counties without monuments. At the same time, with the exception of one, we do not see any statistically significant effects for counties where we might expect racial threat to be lower. Importantly, I also do not observe any positive treatment effect across these subsample analyses, suggesting that monuments did not increase performative violence in areas with lower racial threat. The panel titled Pct Black Change is particularly telling in this regard. The variable measures the change in a county’s Black population and splits the sample based on whether the county’s proportion of Blacks between 1870 and the pre-treatment period average increased or decreased. Changing demographics and perceived threats of replacement have been linked to greater support for political violence (Reeping et al. Reference Reeping, Wintermute, Robinson, Crawford, Tomsich and Pear2024; Thompson et al. Reference Thompson, Beveridge, McCabe, Ahern, Cortes, Axford and Franks2025). The figure shows that monuments reduce performative violence in counties where the Black population has been increasing prior to monument construction but that the effect is statistically indistinguishable from zero in counties experiencing a decline in Black population. This finding is consistent with forthcoming work by Rahnama (Reference Rahnama2025) showing that UDC chapters were likelier to emerge in areas with higher Black human capital and greater economic pressures.
The Effect of Confederate Monument Presence on Anti-Black Performative Violence, Conditional on 10 Key Covariates Associated with Racial Threat
Notes: The figure presents coefficient plots of the conditional effect of Confederate monument presence on likelihood of anti-Black performative violence. Coefficients are represented as circles, whiskers are 95% boostrapped confidence intervals constructed using standard errors clustered at the county level. All models use 3-year bins and cover the period 1877–1928 in the 11 former Confederate states. Each panel splits the sample by median values (or directional change) of relevant racial threat pre-treatment covariates. Pct Urban: counties with less than 0.1% urban population (below median) vs. greater than 0.1% (above). Pct Black: counties with less than 28% Black population vs. more than 28%. Pct Enslaved (1860): counties with less than 19% enslaved population vs. more than 19% in 1860. Population: counties with fewer than 13,582 residents vs. more than 13,582. Pct Black Change: counties with negative Black population growth vs. positive growth between 1870 and the pre-treatment period. Economic Strength: the aggregate value of economic output in a county, split at the median. No. Slaveholders (1860): counties with fewer than 191 slaveholders vs. more than 191 in 1860. Slaveholder–Enslaved Ratio (1860): counties with fewer than 5.84 enslaved persons per 1 slaveholder in 1860 vs. more than 5.84. Cotton Production: counties producing fewer than 4,081 bales vs. more than 4,081. Farm Value: split at the median value of total farm output. Table A10 in Section D of the SM presents the full results.

Robustness Checks
In addition to the above analyses that account for treatment effect heterogeneity, the main results are robust to a range of additional checks and placebo tests. I report eight different robustness checks to examine the plausibility of the substitution hypothesis, as well as the credibility of a causal interpretation, which are presented in Section F of the SM. Even granting that most of the identifying assumptions hold, one possible threat to inference is that monument construction is systematically correlated with other activities that could influence violence, especially by the UDC, that are introduced at the same time. These include observing rituals, participating in fundraisers, the introduction of textbooks to schools, cemetery cleanups, etc.
First, I verify that the results hold when trimming the data only to counties which have a UDC chapter, indicating latent propensity for monument construction. The results are nearly identical to those presented in the main specifications (see Section F.3 of the SM). Monument construction was the costliest (and most difficult) activity for UDC chapters, while other activities were likely more common. In effect, I am trimming the control group to the counties most likely to have non-monument Confederate activities that could bias the results. Monument construction was typically more common in counties with active and well-organized UDC chapters, where the process likely involved other significant activities, such as rituals or cemetery cleanups. In addition, because monuments took so long to build, while other activities were far more easily implementable, if these activities influenced violence, we would expect to see negative pre-treatment trends before monument dedication, but such trends are not observed.
Second, I conduct placebo tests to check whether the findings are an artifact of a secular decline in violence that affects both white and Black victims equally. I compare performative violence against Blacks to performative violence against whites. Consistent with my theory, I find that Confederate monument presence had no discernible effect on the likelihood of performative violence against white victims (see Section F.7 of the SM).
Third, I report results that account for structural, demographic, and economic covariates, which could affect the likelihood of monument construction (see Section C of the SM for a fuller discussion). The central findings are robust to the inclusion of demographic and economic covariates as well as to conditioning the parallel trends assumption on the latent economic power of a county (see Sections F.2.2 and F.10 of the SM). I also present more traditional saturated results with fully time-varying covariates in Table A50 in Section F.10 of the SM. These include voting restrictions, cotton production, and other plausible covariates.
Fourth, I test the possibility of spatial spillover: specifically, that counties in which Confederate monuments are built may affect the likelihood of violence in neighboring counties as well. Statistical tests suggest that there are no spillover effects, at least between adjacent counties. In addition, the results are robust to using Conley standard errors, which account for spatial correlation. See Section F.8 of the SM.
Fifth, and intimately tied to the idea of spatial spillover, is the possibility that monuments and/or performative violence could affect the demographic composition of counties. I examine demographic compositional changes that may have affected the outcome, following Ferlenga (Reference Ferlenga2023). Figure A.37 in Section F.9 of the SM presents the effect of Confederate monument dedication on the racial composition of a county. The results suggest a very clear pattern: Confederate monuments lead Black residents to leave a county. The results imply that one potential mechanism through which monuments could reduce violence is the out-migration of Black residents. It is possible that as a new hierarchical status quo solidifies with a monument dedication, some proportion of Black residents in that county decide to leave. Their departure, in turn, could further assuage white fears that the social order is under threat, thereby reducing the motivation to engage in violence.
Sixth, I conduct an instrumental variables (IV) analysis leveraging the fact that monument construction required cut stone like marble, granite, and limestone. I use the national price of quarried stone as an instrument for Confederate monument construction. Higher cut stone prices would therefore mean that monuments were less likely to be built. The results are presented in Section F.5 of the SM. The instrument is strong, as indicated by the F-statistic in Table A40 in the SM. The exclusion restriction assumes that stone prices influence violence only through their impact on monument building, and plausible violations—such as stone prices reflecting broader economic downturns—would bias the estimates toward zero. Nonetheless, the IV results reveal a strong negative effect of monuments on performative violence, even after controlling for key economic and demographic covariates. These findings strengthen the causal interpretation of the main results.
Seventh, I expand the geographic scope of the analysis to include the five border states (Delaware, Kentucky, Maryland, Missouri, and West Virginia), which were not part of the Confederacy but played an important role in the Civil War. These states permitted slavery, contributed troops to the Confederacy, and implemented varying degrees of segregation after the war, while also maintaining geographic and political ties to the North. I find that the results remain consistent—and if anything, the effect sizes are slightly larger when including the border states. These results also hold when I restrict the sample to only counties with UDC chapters. Section F.6 of the SM presents the results.
Eighth, I investigate whether Confederate memorial rituals influence the relationship between monuments and anti-Black violence by constructing a county-day panel from 1877 to 1928, focusing on the 14-day windows surrounding official Confederate memorial days across Southern states. Using a two-way fixed effects model with county and month fixed effects and clustering at the county-year level, I find that while counties with monuments experience significantly fewer lynchings, the presence of Confederate ritual windows does not significantly affect violence nor mediate the monument effect. These findings, presented in Section F.4 of the SM suggest that rituals associated with commemoration do not drive the observed relationship, lending further credibility to the causal interpretation of the results.
Present-Day Effects of Monument Removal, 2014–22
I now turn to testing the Removal Hypothesis, which posits that anti-Black violence increases after the removal of Confederate monuments since it signals that the social order is contested, leading to an increase in political violence designed to stabilize it. Specifically, I examine anti-Black hate crimes as an outcome. While thankfully lynching and public executions are no longer a common practice, anti-Black hate crimes theoretically approximate the logic of public, performative violence (although of course, they are different in many respects). The FBI defines a hate crime as a “criminal offense against a person or property motivated in whole or in part by an offender’s bias against a race, religion, disability, sexual orientation, ethnicity, gender, or gender identity” (Federal Bureau of Investigation N.d.). Hate crimes are generally forms of violence or intimidation that are committed by citizens against other citizens rather than violence that is committed by the state. In addition, hate crimes are committed for political, not merely criminal purposes and are likelier to be performative since they can only be classified as hate crimes when the motivation behind them is communicated by the perpetrator. The violence is not just coercive: a message is being explicitly sent.
To test the Removal Hypothesis, I adapt the framework for the main analysis in several ways. First, I expand the geographic scope beyond the former Confederate states. Since the 1920s, Confederate monuments have been dedicated in states that lie outside the 11 former Confederate states (see Bazzi et al. Reference Bazzi, Ferrara, Fiszbein, Pearson and Testa2023). Second, I only compare counties in which there are already Confederate monuments to counties that have removed them. A county cannot lose a monument if it doesn’t have one in the first place. Third, I restrict the time period to 2014–22. Monument data are only available until 2022 and monument removal began in 2015 following the Charleston massacre, as described above. I start in 2014 to account for the period prior to removal, following Rahnama (Reference Rahnama2024). Fourth, the number of monument removals in each year is quite small, making it difficult to reliably use staggered treatment estimators using the county-year as the unit (see Section “Research Design and Empirical Strategy” for a description of the problem). Instead, I use 2-year bins which allow for sufficiently large treatment cohorts while still maintaining granularity. I also report more traditional two-way fixed effect estimators using the county-year as the unit of analysis in Section F.2.1 of the SM.
As Benjamin et al. (Reference Benjamin, Block, Clemons, Laird and Wamble2020) have shown, monuments are likelier to be removed in counties with a large and organized Black community alongside consistent support for the Democratic Party. In addition, Rahnama (Reference Rahnama2024) finds that monument removals improve anti-Black attitudes. Most of the time, monument removals fall under the authority of city and local governments. And while some states, like Alabama, have passed laws penalizing the removal of historic monuments, these laws have not necessarily stopped communities from removing monuments (as was the case of Birmingham, AL). On its face, we would expect counties where monuments are removed to be less likely to experience anti-Black hate crimes since the local governments and the populace are largely sympathetic to monument removals. In that sense, removals appear likely to trigger the type of racial threat that could lead to greater violence.
However, one concern is that perhaps citizens may feel more comfortable reporting hate crime incidents to local police departments in counties where monuments have been removed, and in turn, police departments may feel more willing to share those data with the FBI. To account for this possible source of bias, as well as broader concerns regarding measurement error and the voluntary nature of hate crime reporting to the FBI, I also report results for a placebo test: antisemitic hate crimes. While anti-Black hate crimes are the most frequent hate crimes in the US, antisemitic hate crimes follow closely behind and are the most frequent hate crimes per capita.Footnote 18 The placebo test addresses concerns that sudden changes in the willingness to report hate crimes as a result of monument removals might account for subsequent changes in hate crime rates.
Figure 8 presents the results of difference-in-differences estimations of Confederate monuments’ removal on anti-Black and antisemitic hate crimes. I present the staggered estimator alongside a more traditional TWFE. The left-side panel presents the results for anti-Black hate crimes, while the right-side panel presents the results for the placebo test of antisemitic hate crimes. The coefficient estimate is 1.66 and statistically significant at conventional levels. Substantively, this means that the removal of a monument leads to an average increase of 1.66 anti-Black hate crimes in a county-period. This is a large effect size by conventional standards: the removal of a monument increases hate crimes by 88% of a standard deviation. While the TWFE coefficient is slightly smaller (a difference of 0.28), it is also statistically significant. This lends support to the Removal Hypothesis. By comparison, monument removals appear to have no effect on antisemitic hate crimes. The results are robust to conditioning the parallel trends assumption on the proportion of a county’s Black, white, and Hispanic residents, and if anything, the effect sizes are slightly larger (see Table A31 in the SM for results).
Effect of Confederate Monument Removal on Anti-Black and Antisemitic Hate Crimes, 2014–22
Note: The coefficient plot presents the effect of Confederate monument removal on the likelihood of anti-Black and antisemitic hate crimes (the latter being a placebo) between 2014 and 2022 in counties with Confederate monuments throughout the US. The main estimator is the group-time average treatment effect estimator, labelled Staggered (CS) and located on the left side of both panels. For the staggered estimator, standard errors are clustered at the county level and calculated using simultaneous confidence bands and bootstrapping. For comparison, a two-way fixed effects estimator, labeled TWFE and located on the right side of both panels is included. For TWFE, county and period are used as fixed effects and standard errors are clustered at the county level. The models use 2-year bins. The outcome in the left-side panel, titled Anti-Black Hate Crimes is a continuous variable indicating the number of anti-Black hate crimes that have taken place in a county-period. The outcome in the right-side panel is a continuous variable indicating the number of antisemitic hate crimes that have taken place in a county-period. The dots are coefficient estimates, the whiskers are 95% confidence intervals. ATT stands for Average Treatment effect on the Treated: the numbers below each coefficient are the precise coefficient estimates of each model. Full results are presented in Tables A11 and A12 in Section D.1 of the SM.

I also assess the plausibility of the parallel trends assumption by looking at the pre-treatment trends between treated and control counties. Figure 9 presents two event-study plots estimating the effect of Confederate monument removal on anti-Black hate crimes (Panel a, at the top) and antisemitic hate crimes (Panel b, at the bottom). The event study plots allow us to both visually assess the plausibility of the parallel trends assumption and to see the effect of monument removal over time. The event study estimates provide additional support for the Removal Hypothesis. The pre-trends suggest that the parallel trends assumption is plausible for both anti-Black hate crimes and antisemitic hate crimes, as there is no statistically significant difference between treated and control counties prior to the removal of monuments. Much like in Figure 8, Confederate monument removal leads to an increase in the likelihood of anti-Black hate crimes. The aggregate coefficient is 1.73 and statistically significant at conventional levels. Notably, unlike the slow-building effect of monument construction, the effect of removal seems to be driven by the “on-impact” treatment effect: the 2-year period immediately after monument removal. Although it is worth noting that subsequent periods are noisier and less clear-cut. Section F.2 of the SM provides additional sensitivity analysis of the parallel trends assumption in this case, suggesting that it holds. In contrast to anti-Black hate crimes, the effect of monument removal on antisemitic hate crimes is the statistical equivalent of zero (note the different scales on the y-axes in the different panels).
Effect of Confederate Monument Removal on Anti-Black and Antisemitic Hate Crimes, 2014–22 (Event-Study)
Note: The two event-study plots present the effect of Confederate monument removal on the likelihood of anti-Black and antisemitic hate crimes between 2014 and 2022 among counties with Confederate monuments throughout the US. Panel a presents the event study for anti-Black hate crimes. Panel b presents the placebo outcome, antisemitic hate crimes. The estimator for both panels is a dynamic group-time average treatment effect estimator. Years are binned into 2-year periods. Dots are coefficient estimates. Whiskers are 95% confidence intervals which are clustered at the county level and calculated using bootstrapping and continuous confidence bands. ATT is the aggregated average treatment effect. SE is the standard error. Tables A13 and A14 in Section D.1 of the SM present the full results.

The results presented in Figures 8 and 9 suggest that monument removal, by challenging the prevailing social order, likely triggers racial threat, negating the substitution effect of monuments and leads to an increase in anti-Black hate crimes.
DISCUSSION, LIMITATIONS, AND FUTURE DIRECTIONS
Taken together, the findings suggest that in the post-Reconstruction era (1877–1928), the dedication of Confederate monuments throughout the former Confederate states reduced the likelihood of performative political violence. I argue that monuments played this role because they were able to substitute for some of the performative, communicative functions played by anti-Black lynching and public executions. This finding is best explained by conceptualizing Confederate monuments as political symbols and taking into account the performative nature and order-shaping purpose of lynching and public executions. I also find that monuments had greater effect in those areas that are most susceptible to racial threat, suggesting that political symbols might be especially salient in such contexts. The results help us better understand the scope conditions of political symbols and the possible mechanisms through which they influence political violence.
The effect of Confederate monuments did not decay, rather, it strengthened slowly with time. This pattern suggests that the impact of political symbols like monuments may be slower to take root, but could be more durable compared with one-off mass rituals, however extravagant and well-attended (Ang Reference Ang2023). Durably shifting perceptions of the prevailing social order—especially in a region scarred by slavery, a brutal civil war, and a tumultuous and violent Reconstruction period—is unlikely to happen quickly and probably requires repeated “exposure.” This logic is consistent with existing studies that show the persistent and long-term legacies of slavery and mass atrocities more broadly on contemporary politics (Acharya, Sen, and Blackwell Reference Acharya, Sen and Blackwell2018; Charnysh and Finkel Reference Charnysh and Finkel2017; Williams Reference Williams2022). We should expect changes in entrenched mass perceptions to take time. That monuments have an effect at all only underscores the importance of better understanding political symbols.
The central findings may also speak to a difference in strength between more temporary symbols (i.e., rituals, flags, or posters) and more permanent physical structures such as monuments. The results regarding Confederate memorial days reported in Section F.4 of the SM lend further credence to this interpretation. Where monuments differ from other “symbolic” activity is that they are highly visible, costly public markers. Recent evidence from Switzerland, for instance, shows that visible mosques (as opposed to inconspicuous ones) lead to an increase in support for far-right parties and anti-migrant initiatives (Valli et al. Reference Valli, Gravelle, Nai, Medeiros, Murri and Eugster2025).
The slow-building nature of the treatment effect might also point to the possibility of a generational change underway, which would be consistent with the mission adopted by the UDC and their ilk. As more white children grew up in the shadow of monuments, where they felt secure in their dominant position and farther away from the searing experience of perceived lower status brought about by the Civil War and Reconstruction, the less motivation there was to engage in the kind of public violence meant to restore lost status. Taylor (Reference Taylor2025) reports some evidence consistent with this interpretation, finding that counties with monuments are likelier to have a greater proportion of children named after Confederate leaders.
Of course, just because the rate of lynchings and public executions declined does not mean that they disappeared altogether. As Cox (Reference Cox1945) has pointed out, it was not just lynching itself that enforced white dominance, it was also the threat of lynching. That is the point of performative violence: to send a message. In this sense, it is possible to understand Confederate monuments in the post-Reconstruction South as communicating the credible threat of public violence. This interpretation also helps explain the effect of monument dedications on Black out-migration presented in Section F.9 of the SM and in Ferlenga (Reference Ferlenga2023). Du Bois, for instance, understood the meaning of monuments quite well. In a 1931 article in The Crisis about a trip to the South, he wrote quite clearly (albeit acerbically) about how he understood monuments:
The most terrible thing about War, I am convinced, is its monuments—the awful things we are compelled to build in order to remember the victims. In the South, particularly, human ingenuity has been put to it to explain on its war monuments, the Confederacy. Of course, the plain truth of the matter would be an inscription something like this: “Sacred to the memory of those who fought to Perpetuate Human Slavery.” (Du Bois Reference Du Bois1931, 279)
To many Southern whites, on the other hand, Confederate monuments represented an affirmation of justly-restored dominance. Depending on who you were, Confederate monuments’ central message was intimidating or reassuring. But the reason monuments worked in creating a “psychology of caste” is that both Black and white populations were mutually aware of each other’s receiving of this same message. I argue that the intersubjective dimension is an essential part of monuments’ ability to attenuate racial threat among whites.
While previous research has shown that perceived status reversal or changes can lead to greater violence (Byun and Kwon Reference Byun and Kwon2025; Cikara, Fouka, and Tabellini Reference Cikara, Fouka and Tabellini2022; Petersen Reference Petersen2002; Testa and Williams Reference Testa and Williams2025), to my knowledge, far fewer studies have examined the reverse: whether status-affirmation attenuates violence. In the psychology literature, affirmation interventions have largely been studied as a means of encouraging a sense of social belonging among marginalized individuals (Tay and Cohen Reference Tay and Geoffrey L.2025). I am unaware of any studies that directly test affirmation strategies among dominant groups and their effect on support for violence. A recent study about perceived victimhood finds that it mediates support for violence in the US (Armaly, Buckley, and Enders Reference Armaly, Buckley and Enders2022). Future research should explore the specific ways that the substitution mechanism works psychologically, likely requiring longitudinal designs.
In addition, although it is difficult to directly test, it is possible that the mechanisms of reduced white motivation and Black out-migration reinforced one another. The presumed logic is that as monuments went up, Black citizens fled, while those who remained may have adopted a myriad of behaviors to avoid violence. While this interpretation is speculative, it seems plausible that Confederate monument dedications altered the behavior of Black Americans, leading them to be more deferential and circumspect around their white neighbors, as they too internalized the reification of a white supremacist social order.Footnote 19 Whites who observed these types of avoidant behaviors by their Black neighbors likely interpreted them as further confirmation of the entrenched racial hierarchy in which they were dominant. Future research could investigate these possible mechanisms, along with the intergenerational transmission mechanism, further.
A limitation of the present study is that it only focuses on Confederate monuments and does not explicitly take into account other political symbols or other activities by Confederate heritage organizations, such as attempts to influence school curricula, the display of flags, and the naming of roads and public buildings after Confederate leaders. If the theory presented here is correct, then these activities should amplify the effects of Confederate monuments. In this sense, focusing solely on monuments likely represents a hard test for the theory of political symbols. To extend the iceberg metaphor used earlier, we should expect that the more of the iceberg is exposed, the more it should change our behavior. In other words, monuments—and political symbols more broadly—are an important heuristic people use to construct mental models of their own structural conditions. In addition, the study focuses on performative, even spectacular, violence as an outcome, and does not account for more quotidian forms of violence or the wide range of indignities and forms of “structural” violence that were integral to the Jim Crow era. Future research could investigate these other important potential causes and outcomes.
I also report results that the removal of Confederate monuments in the present day increases the likelihood of anti-Black hate crimes. The Removal Hypothesis offers evidence that removing Confederate monuments signals that the present social order is under threat, thereby increasing the motivation to engage in anti-Black hate crimes in order to protect the status quo. This finding shows how the same political symbols may have different effects on political violence depending on the time period. At the same time, it should be noted that the results indicate a relatively short-lived backlash. It is possible that a brief violent backlash is an acceptable cost for longer-term changes to the social order. In addition, there is some evidence that monument removal is not associated with increased state repression and several scholars have written about the value of “reclaiming” public and symbolic space, via monument removals, legislation, as well as the construction of alternative spaces for memorialization (Davies Reference Davies2024; Larrabee Reference Larrabee2022; Turner and Crabtree Reference Turner and Crabtree2021).
This also leads us to consider the implications of political symbols for the second Trump administration. In its short time in office, the second Trump administration’s actions appear squarely aimed at reshaping public conceptions of the social order in the US. These include the glorification of Confederate figures through gestures such as renaming military bases after Confederate generals, concerted efforts to control historical narratives by banning books and reshaping cultural institutions, and threats to withhold federal funds in order to compel the removal of symbols like Black Lives Matter Plaza in Washington DC that contradict this new order. In addition, new proposals to build monuments, such as carving President Trump into Mount Rushmore, and renaming Dulles Airport after him, have emerged among the President’s supporters (Jacobs and Svirnovskiy Reference Jacobs and Svirnovskiy2025).
Most striking, the March 27, 2025 executive order on “Restoring Truth and Sanity to American History” mandates the reinstatement of monuments and condemns what it calls “a concerted and widespread effort to rewrite our Nation’s history, replacing objective facts with a distorted narrative driven by ideology rather than truth” (United States Government 2025). These actions suggest that the administration understands, and cares about, the value of public acknowledgment and submission, to echo Du Bois’ aforementioned comments about the “psychology of caste.” It appears that a core part of the administration’s agenda is the generation of common knowledge about who belongs and who is excluded, who is dominant and who is subordinate. All of this is consistent with extant findings that highlight group status threat as a core pillar of electoral support for President Trump (Mutz Reference Mutz2018; Parker and Lavine Reference Parker and Lavine2025).
What this means for future political violence is uncertain. However, persistent contestation over political symbols could lead to highly unstable perceptions of status and belonging, which could in turn lead to increases in performative violence. It is conceivable that repeated failures to reshape the social order via symbolic means might be replaced with the use of performative violence to achieve the same end. The fact that cabinet-level officials, such as Homeland Security Secretary Kristi Noem, have already shown a willingness to engage in displays of performative cruelty in order to demonstrate their view of who does not belong in the US bodes ill (Brandon and Santana Reference Brandon and Santana2025).
While it is beyond the scope of this article to test the theory in other cases, future research could expand beyond the US. Some scholars are already pushing in this direction. For instance, Balcells and Voytas (Reference Balcells and Voytas2025) show the limited effects of visits to a museum exhibit in Northern Ireland. Another promising future direction is to apply the theory to religious sites, which often serve as political symbols and potential flashpoints for violence. For example, the 1992 razing of the Babri mosque in India was followed by sustained Hindu–Muslim riots, while the recent construction of a Hindu Temple on top of the former mosque has transpired without any violence. This discrepancy can potentially be explained by the solidification of a Hindu nationalist status quo under Prime Minister Narendra Modi. Similarly, Jerusalem’s Temple Mount/Al-Aqsa Mosque has long been a trigger for Israeli-Palestinian violence, especially during times when the set of informal yet delicate religious arrangements that govern the site (called the status quo) are perceived as threatened or changing (as they are at the time of writing). More generally, while the specific meanings of political symbols are context-specific and important to understand, my theory suggests that their underlying messages are parsimonious: they concern status hierarchies or group boundaries. The approach offers a flexible conceptual framework to the study of political symbols across cultures and opens the door to future research on the relationship between political symbols and political violence.
SUPPLEMENTARY MATERIAL
To view supplementary material for this article, please visit https://doi.org/10.1017/S0003055425101007.
DATA AVAILABILITY STATEMENT
Research documentation and data to support the findings of this study are openly available at the American Political Science Review Dataverse: https://doi.org/10.7910/DVN/TAQCKK.
ACKNOWLEDGMENTS
I thank my committee members, Rose McDermott, Rob Blair, and Donghyun Danny Choi for their support and for multiple rounds of in-depth comments on this project. Paul Testa provided critical comments and guidance. Damali Britton, Kristen Essel, Karra McCray Gibson, Roxanne Rahnama, Marie Schenk, David Skarbek, Connor Staggs, Christopher Woods, and Marques Zarate provided feedback on the manuscript at various stages. Juliet Hooker welcomed me to her classes and provided critical suggestions. Jonathan Roth, Frank Donnelly, and John Logan provided timely technical guidance. I thank four anonymous reviewers for their constructive suggestions, and Professor Marisa Abrajano who shepherded the manuscript to publication. I am grateful to participants at the 2024 PIAS workshop at MPSA, the 2024 Graduate Student Workshop at Chapman University’s IRES, and NEWEPS 2024 (especially Taylor Jaworski, Donia Kamel, and María Ballesteros) for their constructive comments. I thank Samuel Bazzi and colleagues for graciously sharing data on UDC chapters, as well as the staff at the Alabama State Archives and the Alabama State University Archives for their generous assistance. Special thanks to the docents and staff at the Equal Justice Initiative’s Legacy Museum, who tolerated my continued presence in their main exhibit.
CONFLICT OF INTEREST
The author declares no ethical issues or conflicts of interest in this research.
ETHICAL STANDARDS
The author affirms this research did not involve human participants.


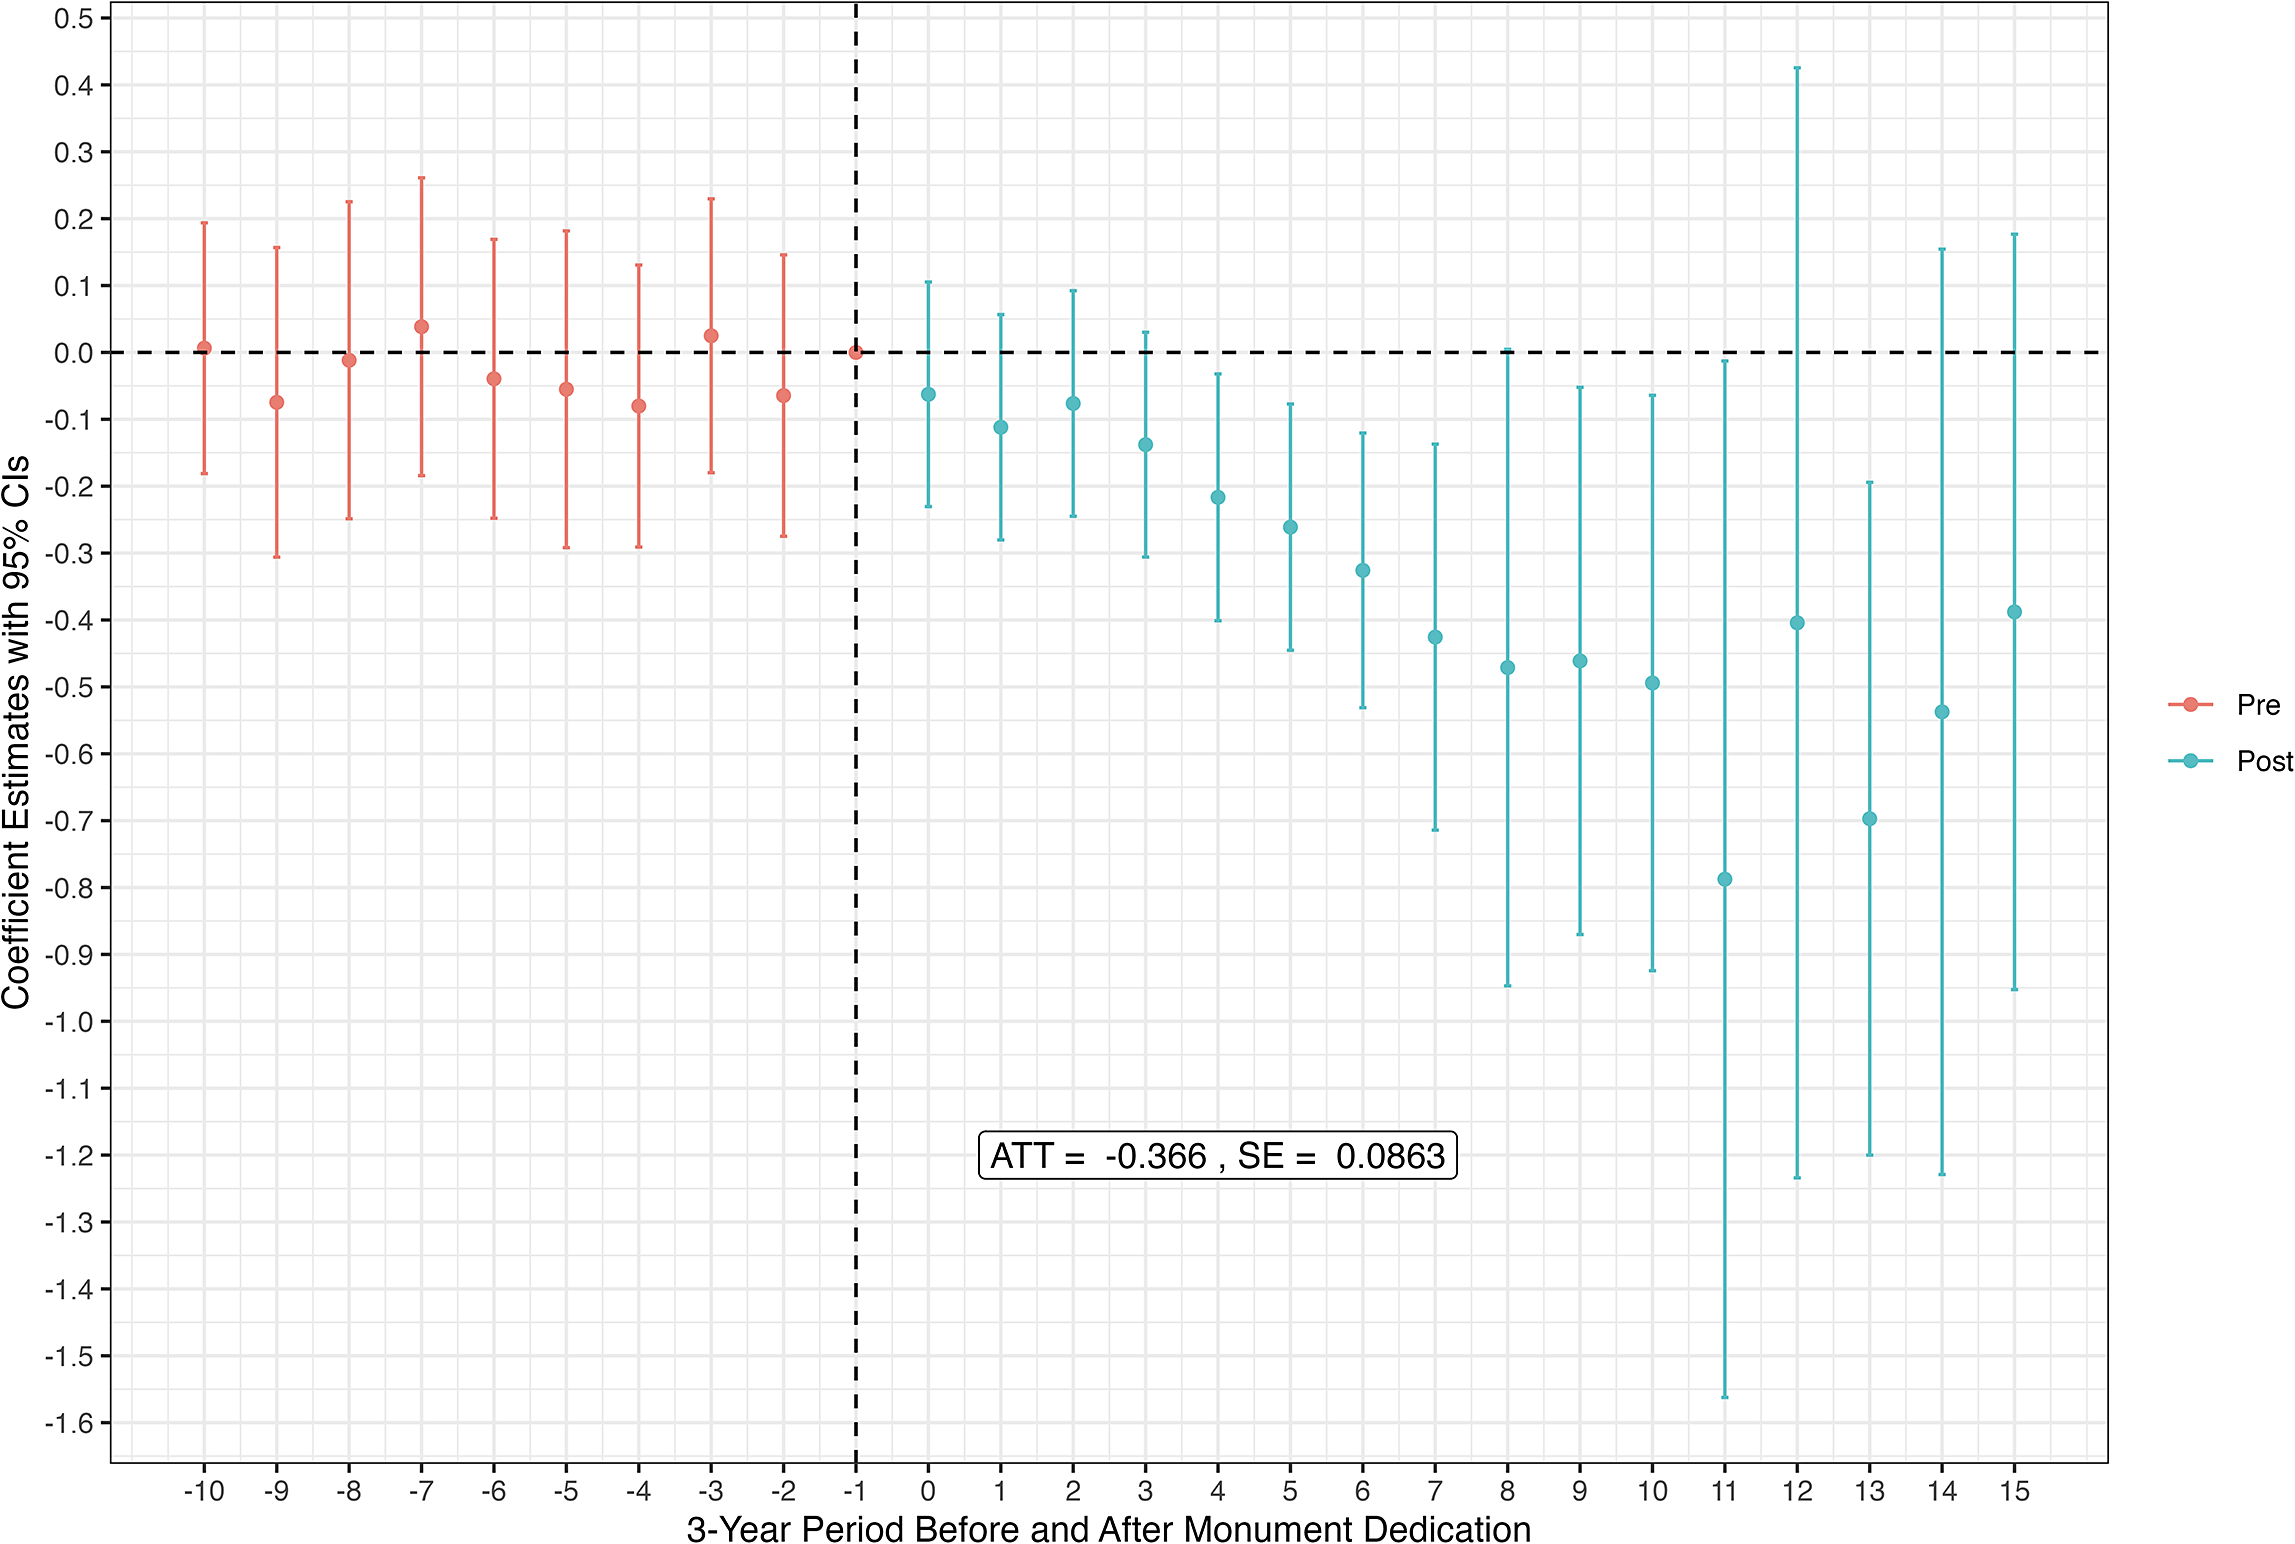


 Open access


Comments
No Comments have been published for this article.