

INTRODUCTION
Non-typhoidal strains of Salmonella enterica are a major cause of foodborne illness in humans. In the United States alone, Salmonella accounts for an estimated 1·4 million cases of illness, 16 000 hospitalizations and 600 deaths annually [Reference Mead1]. Cattle are recognized as an important source of Salmonella causing human illness, particularly for antimicrobial-resistant strains. Transmission from cattle to humans has been described via contaminated meat [Reference Dechet2], milk [Reference Olsen3], dairy products [Reference Cody4] and also by direct contact with sick animals and their environment [Reference Gupta5]. Recently, the emergence of several multidrug-resistant (MDR) strains of Salmonella, notably MDR Typhimurium DT104 and Newport, has complicated treatment and control of clinical disease in humans; humans infected with MDR strains are at greater risk of bacteraemia, hospitalization and death compared to patients infected with susceptible strains [Reference Helms6, Reference Martin7].
Prevention of human salmonellosis depends on decreasing the prevalence of infections in livestock hosts as well as identifying and intervening along key transmission routes. Controlling the spread of Salmonella at farm level and through the food chain has proven difficult [Reference Humphrey8]; partly because of the large variation observed in the epidemiological characteristics of Salmonella infection at herd level, which range from large clinical outbreaks to endemic persistence without clinical cases [Reference Wray9, Reference Anderson10]. Elucidation of effective control strategies requires, therefore, an improved understanding of the dynamics of infections within host populations and the causes of such a wide range of outcomes in the host–pathogen interaction [Reference Cobbold11]; including interactions among immunity of the host, infectious dose and virulence of the serotype, and environmental factors [Reference Anderson and May12].
Mathematical models of disease dynamics provide a comprehensive framework in which our current understanding of disease transmission can be summarized, and the impact of intervention strategies can be evaluated [Reference Anderson and May12]. There are only three existing mathematical models of Salmonella transmission dynamics in dairy herds. Xiao and colleagues developed theoretical deterministic [Reference Xiao13] and stochastic [Reference Xiao14] models of Salmonella infections. These authors investigated the effects of demographic (e.g. culling rate) and epidemiological (e.g. pathogen-induced mortality) factors on epidemic behaviour and threshold for invasion, while Chapagain et al. developed a mathematical model to describe an outbreak of S. Cerro in a dairy herd [Reference Chapagain15].
Heterogeneity in host–pathogen interaction (such as heterogeneous infectious period and contagiousness) may play an important role in determining the outcome of a Salmonella infection. Cattle with clinical salmonellosis, which can shed up to 1010 c.f.u./g faeces [Reference De Jong and Ekdahl16], may be responsible for amplifying environmental contamination and therefore raising the challenge exposure enough to cause large outbreaks in the herd [Reference Anderson10]. On the other hand, long-term persistence of Salmonella in herds has been attributed to the presence of a few individuals that persistently excrete the organism, and thus, removing those individuals has been proposed as a control measure [Reference Cobbold11]. Heterogeneity in infection transmission has not been addressed in previous models [Reference Xiao13, Reference Chapagain15].
The overall objective of this study was to assess how heterogeneity in infectious period and contagiousness affect transmission dynamics of Salmonella infection in dairy herds. In particular we addressed the following questions: (1) What is the relative importance of clinical and subclinical cases in the transmission of the infection? (2) What is the role of long-term shedders? (3) How can heterogeneity in host infectiousness impact the efficiency of control strategies such as vaccination? To address these questions we developed a series of state transition models (i.e. SIR models) in which different infectious states representing current knowledge were included.
MATERIAL AND METHODS
Models formulation
We developed three deterministic SIR models of Salmonella transmission within cattle group. In an SIR-type model, the host population is categorized according to infection status into susceptible (S), infected (I), and recovered (R) classes [Reference Anderson and May12]. A latent state was not included in the models as the latent period in Salmonella infections is thought to be very short (24–48 h), and therefore it has little impact on the infection dynamics [Reference Anderson and May12]. Infection with Salmonella can result in clinical or subclinical disease [Reference Wray, Davies, Wray and Wray17]. For subclinically infected animals, the duration of faecal shedding can be highly variable [Reference Cobbold11, Reference Huston, Wittum and Love18]. To account for these differences, several I stages were included in the models. Each of the I stages differ in several parameter values, including infectious period and ‘transmission coefficient’, also known and defined here as ‘β’, describing the rate at which susceptible hosts are ‘converted’ into infected hosts by their contact with infectious material (defined as in [Reference Begon19]). An assumption in assigning β for each infected stage is that bacterial load is the only factor that varies among infected stages, and thus other factors that determine the probability of successful transmission are identical.
The following assumptions are common to all three models:
(1) The population size is constant as the recruitment rate is equal to the exit rate. This reflects the tendency of dairy farms to maintain a constant herd size.
(2) All newly introduced animals are susceptible. In reality, a replacement animal could be infected and actually serve as a vehicle for introduction of new infection into the herd. However, the purpose of this study was not to evaluate sources for Salmonella infection into the herd and a simplifying assumption was accepted.
(3) Direct transmission is the only route of new infection (i.e. vertical and indirect transmission were not considered). Although the main route of transmission is faecal–oral, and therefore infection is mostly acquired through contact with bacteria shed in the environment (i.e. an indirect exposure), an environment compartment is not explicitly included in the model. We instead assume one common environment in which environmental proliferation is rather limited. In addition, the main objective is to assess the relative contribution of different types of infected animals to transmission, which would remain unchanged whether or not we include indirect route of infection. The potential for vertical transmission was not included because it is thought to be less important than other routes of infection [Reference Jones, Watson, Wallis and Andrews20] and also because we modelled an adult cow population.
We selected the transmission term to be ‘density-dependent’, and thus the force of infection (λ) is represented by βI. This form was favoured because increased prevalence of Salmonella infection has been reported with increasing herd size [Reference Kabagambe21, Reference Warnick22].
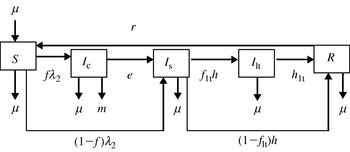
The ordinary differential equations describing the three models are presented in Appendix 1. Two I states were included in model 1: clinically infected (I c) and subclinically infected (I s) (Fig. 1); a fraction of the infected animals was assumed to become I s immediately following infection, and all I c were assumed to become I s before full recovery. These states reflect the biological reality that not all infected animals develop clinical salmonellosis [Reference Wray, Davies, Wray and Wray17], and cattle that have recovered from clinical disease can continue to shed Salmonella [Reference Wray and Sojka23, Reference Warnick24]. Exposure to cattle with clinical salmonellosis has been described as a risk factor for development of salmonellosis [Reference Warnick22, Reference Fossler25], as I c may shed larger quantities of c.f.u. than do I s. Therefore, it was assumed that the transmission coefficient for I c was greater than for I s.
Flow diagram representing model 1. Four transition states are included: susceptible (S), clinically infected (I c), subclinically infected (I s) and recovered (R). Animals move from S to I c at rate fλ 1 and from S to I s at rate (1−f)λ1, where f is the proportion of infected animals that develop clinical disease. Clinically infected animals progress to I s at rate e. Animals in I s acquire immunity at rate h. The immunity of recovered animals wanes at rate r. Exit for all compartments and replacement for compartment S takes place at rate μ. Animals in I c also exit the compartment at rate m.

A third infected stage, termed long-term shedders (I lt), was included in addition to the I c and I s states in model 2 (Fig. 2). Long-term persistence of Salmonella at farm level has been observed for several serotypes, including MDR S. Newport [Reference Cobbold11] and S. Dublin [Reference Wray9]. On farms with persistent Salmonella, few animals without clinical signs were reported to shed Salmonella persistently or intermittently. Because animals at the I lt stage do not present clinical signs, their transmission coefficient was assumed to be equivalent to the transmission coefficient for I s.
Flow diagram representing model 2. Five transition states are included: susceptible (S), clinically infected (I c), subclinically infected (I s), long-term shedders (I lt) and recovered (R). Animals move from S to I c at rate fλ 2 and from S to I s at rate (1−f)λ2, where f is the proportion of infected animals that develop clinical disease. Clinically infected animals progress to I s at rate e. Animals in I s either acquire immunity at rate (1−f lt)h or become I lt at rate f lth, where f lt is the proportion of I s that become I lt. The immunity of recovered animals wanes at rate r. Exit for all compartments and replacement for compartment S takes place at rate μ. Animals in I c also exit the compartment at rate m.
In model 3, an alternate third infected stage, termed super-shedders (I ss), was included in addition to the I c and I s states (Fig. 3). For other bacteria within the family Enterobacteriaceae, the term super-shedder has been used to describe those animals that harbour and shed bacteria at high levels [Reference Low26]. Super-shedders have a significant impact on the transmission dynamics of E. coli O157, and thus removal of high-shedding individuals has been proposed as a control measure [Reference Matthews27]. For Salmonella, we hypothesized that a fraction of the animals, after recovering from clinical signs of disease, would continue to shed high numbers of Salmonella for a long period of time. It is assumed that the transmission coefficient for I ss is equal to the transmission coefficient for I c.
Flow diagram representing model 3. Five transition states are included: susceptible (S), clinically infected (I c), subclinically infected (I s), super-shedders (I ss) and recovered (R). Animals move from S to I c at rate fλ 3 and from S to I s at rate (1−f)λ3, where f is the proportion of infected animals that develop clinical disease. Clinically infected animals progress to I s at rate (1−f ss)e and to I ss at rate f sse, where f ss is the proportion of I c that become I ss. Animals in I s acquire immunity at rate h and I ss acquire immunity at rate h ss. The immunity of recovered animals wanes at rate r. Exit for all compartments and replacement for compartment S takes place at rate μ. Animals in I c also exit the compartment at rate m.
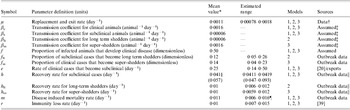
Model parameters
Model parameters are defined in Table 1 and mean values and observed range are presented. Data from a longitudinal study to determine the incidence of salmonellosis in dairy cattle in the Northeastern United States was used to estimate some of the parameters [Reference Ray28]. Of 34 herds enrolled in the study, 22 farms with at least two laboratory-confirmed cases of salmonellosis and on-farm individual cow milk records were enrolled in a prospective follow-up study to determine the duration of faecal shedding following clinical salmonellosis. Diagnostic was established by bacteriological culture of faecal samples. Faecal samples from dairy cattle exhibiting clinical signs of salmonellosis were collected at around monthly intervals until three consecutive negative samples were obtained or the animal was lost to follow-up [Reference Warnick24, Reference Ray28]. Because no serological or faecal diagnostic tests were available for all apparently healthy animals, the actual size for all the compartments could not be determined, and therefore the transmission coefficient could not be calculated directly from the data.
List of parameters
* Value used when parameter was not varied in a simulation.
† Based on average lactating cows longevity in a convenience sample of New York herds (from Ambulatory and Production Medicine Services, Cornell University).
‡ Based on iterative fitting of the model output to the available outbreak data.
§ Estimated value for model 1. Estimated values for models 2 and 3 in parentheses.
¶ Lower range value was estimated from an outbreak of Salmonella group C; Upper value was estimated from an outbreak of Salmonella group B.
The reciprocal of the duration of the clinical signs was assigned as recovery rate for I c. The mean duration of clinical signs was estimated to be 4 days based on the literature [Reference Jones, Watson, Wallis and Andrews20] and by interviewing veterinarians experienced in bovine medicine (T. Divers, C. Guard, L. Warnick, personal communication). Data from the two enrolled herds with the largest outbreaks were used to estimate the remaining recovery rates, fraction of long-term shedders (f lt) and super-shedders (f ss) and diseased induced mortality rates. Recovery rates for I s, I ss, and I lt were estimated from the available Salmonella faecal shedding data. Duration of Salmonella shedding was estimated by the Kaplan–Meier life-test method; animals without three consecutive negative samples after the last positive sample were right-censored [Reference Warnick24]. The proportion of animals shedding after clinical salmonellosis follows a decay curve. To obtain the recovery rates for each model, it was assumed that the decay curve was the result of one or two populations (depending on the model) shedding at given rates, and an exponential compartment model based on the model structure was fitted to the data:
(1) For model 1, since all infected animals after I c become I s, the proportion of animals shedding at time t (P(t)) was fitted to one single exponential decay curve,
(1)
(2) In model 2, there are two populations of animals shedding sequentially. All animals in I s shed at rate h, and a fraction of I s (f lt) continues to shed at a rate h lt. Solving the corresponding system of differential equations analytically gives the following sequential irreversible compartmental model,
(2)(3) In model 3, there are two populations of animals shedding simultaneously (I s and I ss), and therefore the decay curve is the sum of two exponential decay curves,
(3)
The decay functions were fitted to the data by nonlinear regression, using the NLIN procedure of SAS (SAS Institute, Cary, NC, USA). The Levenberg–Marquard algorithm was used.
Salmonella-induced mortality rate was calculated as the number of deaths which reported Salmonella as the cause divided by the number of days at risk of death times the number of cows at risk, where cows at risk were defined as the animals with clinical signs and days at risk of death were the mean duration of clinical signs.
Models analysis and simulations
Both numerical and analytical techniques were used to analyse and compare the models. For the numerical simulations, the median of the census of lactating cows in farms with at least two clinical cases in the longitudinal study [Reference Ray28] was used as the value for the total population (N=345). Simulations started with a complete susceptible population and the introduction of one clinically infected animal. The models were implemented and simulated with Vensim professional version 5.0a (Ventana Systems Inc., Harvard, MA, USA). A fourth-order Runge–Kutta method was used for integration. We assessed the effect of changing the proportion of the different infected stages on the pattern of prevalence of infection and clinical disease and the relative contribution of each stage to new infections. We tested values for the fractions f, f lt and f ss greater than the range used on the sensitivity analyses (±25% from the mean) in order to explore range of patterns of prevalence simulated by each model. For model 1, we simulated the model with the following arbitrarily chosen f values, 0·15 and 0·85. For models 2 and 3, we used the values 0·05 and 0·25 for f lt and f ss.
The basic reproduction number (R 0) is the average number of secondary infections produced when one infected individual is introduced into a wholly susceptible host population and is the threshold quantity that determines when an infection can invade and persist in a new host population [Reference Diekmann and Heesterbeek29]. If R 0<1, an infected individual produces less than one newly infected individual on average over the course of its infectious period, and therefore the infection cannot invade or persist [Reference Diekmann and Heesterbeek29]. For a SIR model with one category of infected individuals, R 0 is the product of the infection rate and the mean duration of the infectious period. Because our models have several categories of infected individuals (e.g. clinically and subclinically infected individuals), the next-generation method was used to obtain R 0 expressions [Reference Diekmann and Heesterbeek29, Reference van den Driessche and Watmough30]; Appendix 2 contains the derivation of R 0. To assess the potential impact of the heterogeneity of infectiousness on a vaccination programme, the critical proportion of the population to be immunized in order to decrease R 0 to below 1 (p c) was estimated for each model. The efficacy for Salmonella vaccinations is highly variable [Reference House31, Reference Robertsson32], therefore p c was calculated for different vaccination efficacies (Φ). In a population with homogenous mixing, and with a vaccine that is equally effective across all infectious stages, p c is given by the expression [Reference Anderson and May12],
R 0 can be expressed as the sum of the contribution of the clinical stage (R 0c) and the contribution of the other infected stages (R 0c′), i.e.
The eradication criterion in a homogenously mixed population is [Reference Anderson and May12]
If we assume that the vaccines that attenuate the severity of the clinical cases but do not prevent infection only reduce the transmission due to clinically infected animals (i.e. p c′=0), then p c is given by the expression,
If R 0c′>1, then the reduction of the transmission from the clinically infected individuals would not be enough to prevent an epidemic or eliminate an endemic infection.
Because the parameters were obtained either from only two outbreaks or were assumed, we tested the sensitivity of the predicted endemic prevalence of infection and R 0 to the parameters' uncertainties. We performed a global sensitivity analysis in which all parameters tested were varied simultaneously using Monte Carlo techniques [Reference Helton and Davis33]. Parameters were described by uniform distribution with ±25% from the mean as the minimum and maximum values. The sampling technique chosen for drawing the samples from the distributions was the Latin Hypercube [Reference Helton and Davis34]. In order to relate the variation in the model outputs to the parameters, a stepwise regression analysis was used. Standard regression coefficients (SRC) were used to rank the parameters. When models are linear or moderately nonlinear (R 2>0·70), SRC provide a measure of importance of each parameter based on the effect of moving each parameter away from its mean value by a fixed fraction of its standard deviation while retaining all the other parameters at their mean value [Reference Helton and Davis33]. For all the models, the R 2 for the stepwise regression was >0·95. Monte Carlo simulations (200 iterations) were carried out in Vensim professional version 5.0a (Ventana Systems Inc.) and the REG procedure of SAS was used for the stepwise regressions (SAS Institute, Cary, NC, USA).
RESULTS
Epidemic and endemic behaviour
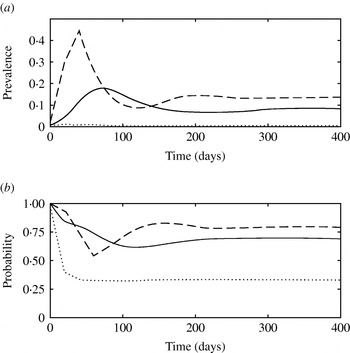
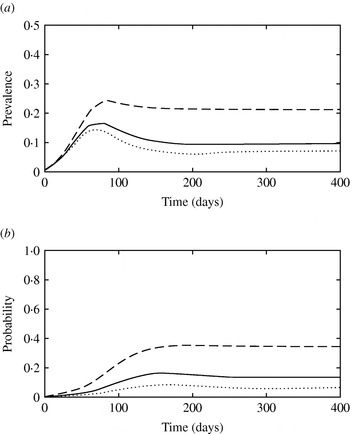
The simulated prevalence of infection at the peak of the epidemics and at the endemic stage using the mean parameter values from Table 1 were 0·18 and 0·08 for model 1, 0·16 and 0·10 for model 2 and 0·32 and 0·17 for model 3, respectively. Figure 4 shows the simulated total prevalence of infection when the fraction of newly infected individuals that develop clinical diseases (f) was varied for model 1. When f was low (0·15), subclinically infected animals were not able to maintain the infection, and an outbreak did not take place (predicted R 0<1). On the other hand, large f (f=0·85) resulted in well-defined epidemics that peaked early and were followed by damped oscillations before reaching a steady state. Predicted endemic prevalence was greater for large f. High β for clinically infected animals and a faster recovery rate for subclinically infected animals had a similar impact to large f on the pattern of infection (results not shown).
(a) Simulated prevalence of infection with model 1 when the fraction of clinically infected animals (f) is 0·15 (· · · · · ·), 0·5 (––––) and 0·85 (– – –). (b) Probability that a newly infected case arises from contact with a clinically infected animal in model 1 when f is 0·15 (· · · · · ·), 0·5 (––––) and 0·85 (– – –).
When the fraction of subclinically infected individuals that become long-term shedders (f lt) was varied in model 2 (Fig. 5), the early stages of epidemics remained similar (<100 days) as the early contribution of long-term shedders is relatively low (Fig. 5 b). High f lt resulted in patterns in which prevalence of infection increased almost monotonically until it reached equilibrium; the prevalence of infection at the peak and the prevalence at equilibrium were very close (Fig. 5 a).
(a) Simulated prevalence of infection with model 2 when the fraction of subclinically infected animals that become long-term shedders (f lt) is 0·05 (· · · · · ·), 0·12 (––––) and 0·25 (– – –). (b) Probability that a newly infected case arises from contact with a long-term shedder in model 2 when f lt is 0·05 (· · · · · ·), 0·12 (––––) and 0·25 (– – –).
The presence of super-shedders impacted both the short-term epidemic dynamics and the endemic stage fixed point (Fig. 6a), as a result of their high contribution to transmission (Fig. 6b). When the fraction of clinically infected animals that become super-shedders (f ss) was 0·25, the probability that a new infection was transmitted by a super-shedder increased to 0·81 (Fig. 6b).
(a) Simulated prevalence of infection with model 3 when the fraction of subclinically infected animals that become super-shedders (f ss) is 0·05 (· · · · · ·), 0·14 (––––) and 0·25 (– – –). (b) Probability that a newly infected case arises from contact with a super-shedder in model 3 when f ss is 0·05 (· · · · · ·), 0·14 (––––) and 0·25 (– – –).

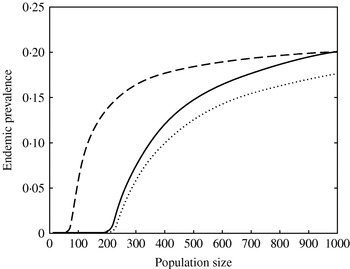
The relationship between population size and predicted endemic prevalence was highly nonlinear (Fig. 7). Models 1 and 2 had similar population size threshold values (N~215), while in model 3 the presence of super-shedders decreased the threshold value to 75 (Fig. 7). At large population size, the three models predicted similar prevalence.
Effect of population size on the predicted endemic prevalence for model 1 (· · · · · ·), model 2 (––––), and model 3 (– – –).
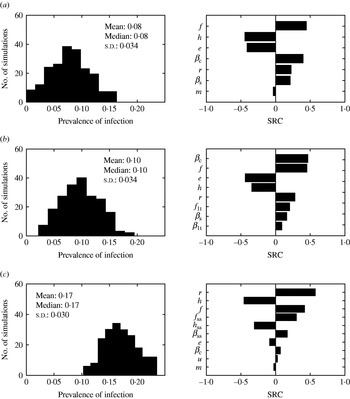
The impact of the parameter uncertainty on the prevalence of infection at equilibrium was assessed (Fig. 8). Models 1 and 2 behaved very similarly. The standard deviation around the mean predicted prevalence was the same, and the five parameters ranked as most influential (βc, e, f, h, r) were the same, with similar SRC. On the other hand, model 3 predictions were also very sensitive to the parameters related to super-shedders (βss, f ss, h ss). All three models were sensitive to the duration of immunity for Salmonella (r).
Histograms of predicted endemic prevalence of infection when parameters were varied ±25% and standard regression coefficients (SRC) for the parameters ranked as the most influential for (a) model 1, (b) model 2 and (c) model 3. Parameters are defined in Table 1.
Basic reproduction number and critical vaccination thresholds
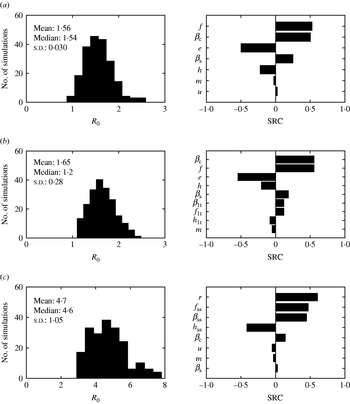
For models with several stages of infection such as the ones presented in this paper, the i terms that make up R 0 expressions can be interpreted as the number of new infections produced by a ‘typical’ individual during the time it spends in the ith infectious stage. For model 1, the three terms of R 0 expression represent the newly infected individuals produced by the ‘typical’ infected individual while clinically symptomatic [first term, R 0c in equation (5)], subclinically infected (second term), and subclinically infected after clinical recovery (third term) [equation (A 2.1)]. The sum of the second and third terms represents R 0c′ in equation (5). Using the mean parameter estimates from Table 1, the three terms for model 1 were 1·05, 0·25, 0·23 and thus the estimated R 0 was 1·53; the mean predicted R 0 values were greater for model 2 (R 0=1·62) and model 3 (R 0=4·7). In model 2, the contribution of the long-term shedder stage to the newly infected cases was 0·21 cases, while for model 3, the contribution of the super-shedders was 3·32 new cases.
The sensitivity of R 0 to the model parameters was also explored (Fig. 9). The contribution of I c to R 0 was the same for the three models (see Appendix 2). Therefore altering βc resulted in an identical marginal increase of R 0 in the three models (with a R 0 change of 0·66 units with each change of 10−4 units of βc). However, βc rankings differed in the SRC analysis; for model 1, βc was the second most influential parameter (SRC=0·50), first most influential parameter (SRC=0·55) for model 2, and fifth for model 3 (SRC=0·09) (Fig. 9). The predicted R 0 for model 3 had a more skewed distribution when uncertainty on the parameters was included (Fig. 9). Model 3 was very sensitive to βss, f ss, and h ss.
Histograms for predicted basic reproduction number (R 0) when parameters were varied ±25% and standard regression coefficients (SRC) for the parameters ranked as the most influential for (a) model 1, (b) model 2 and (c) model 3. Parameters are defined in Table 1.
The critical vaccination thresholds [equations (4) and (7)] were estimated for different scenarios (Table 2). When low vaccine efficacy (φ<0·50) was assumed, vaccination was inefficient in preventing an epidemic or eliminating an endemic infection, particularly if the vaccine is assumed to reduce only transmission from clinically ill animals. When the vaccine efficacy was >0·75, vaccination was a feasible control strategy for models 1 and 2. However, the presence of super-shedders would complicate the eradication of the infection. For model 3, only vaccinations that reduced transmission from all infected animals and had perfect efficacy were able to reduce R 0 to <1.
Critical vaccination thresholds when vaccination is equally effective across all infectious stages (pc) or only transmission from clinically infected animals is reduced (pc(cl)) for the three models assuming different vaccination efficacies (Φ) and group sizes (N)
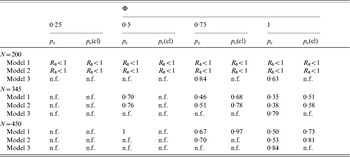
n.f., Non-feasible, p c>1.
DISCUSSION
The overall objective of this study was to address the impact of heterogeneity of contagiousness and infectious period. Our approach consisted in the development of deterministic compartment models, in which heterogeneity was added by postulating different homogenous infected subgroups. The dynamics displayed by the models and threshold quantities were studied.
Importance of the different infection stages on Salmonella transmission
The three models exhibited different qualitative dynamic patterns. Model 1 was more prone to damped oscillations, especially with a high fraction of clinically infected animals, high transmission coefficients or fast recovery rates. Model 2 tended to increase the prevalence of infection until it reached the endemic prevalence, with a less defined epidemic curve. Model 3 simulated an epidemic with a well-defined peak followed by high prevalence at equilibrium. All these dynamic patterns are plausible for Salmonella, whose epidemic behaviour at herd level range from large clinical outbreaks to endemic persistence without clinical cases. The range of prevalence of faecal shedding and clinical disease reported in the literature for Salmonella is also wide. The prevalence of faecal shedding for MDR S. Newport in post-parturient cows was 0·23 and 0·09 in two dairy farms with a history of clinical disease [Reference Cobbold11]. Huston et al. [Reference Huston, Wittum and Love18] reported prevalence of faecal shedding in adult cows as high as 0·87 without clinical signs for farms infected mostly with S. Kentucky and S. Cerro. This suggests that the presence of different infected states is the result of the combined effect of host immunity, herd and serotype characteristics.
Clinically infected animals were the main force of transmission for models 1 and 2. Increasing the number of clinically infected individuals resulted in larger outbreaks and higher prevalence at the endemic stage. The relevance of clinical cases on Salmonella persistence has been outlined in previous studies. In a case study, the prevalence was higher for the two herds that had a previous history of clinical salmonellosis [Reference Anderson10]. Exposure to cattle with clinical salmonellosis has been described as a risk factor for both salmonellosis and Salmonella shedding [Reference Warnick22, Reference Fossler25]. Diarrhoeic animals can shed Salmonella in a range of 108–1010 c.f.u./g faeces [Reference De Jong and Ekdahl16], which overlaps with the order of magnitude of the reported oral challenge doses for adult cattle (109–1011) [Reference Jones, Watson, Wallis and Andrews20]. In order to simulate the high prevalence of subclinical infection displayed by some serotypes (e.g. S. Cerro) in the absence of clinically infected animals (f=0), slower recovery rates for subclinically infected animals and long-term shedders than the values reported in Table 1 were necessary in our study.
Although heterogeneity in transmission has not been previously addressed for Salmonella, extensive work has been undertaken to investigate sources of heterogeneity for Escherichia coli O157 [Reference Matthews27, Reference Matthews35]. The distribution of prevalence for E. coli O157 is overdispersed; most of the farms have low prevalence, while a small proportion demonstrate high prevalence of infection [Reference Matthews35]. Matthews et al. [Reference Matthews35] evaluated several stochastic SIS models that included different sources of heterogeneity. Models that included between-animal variability in infectious period failed to reproduce the observed data. Similarly, simulations with model 2 showed that only when long-term shedders (f lt=0·12) had very slow recovery rates (i.e. duration of shedding longer than 2 years), were they able to maintain R 0 >1, suggesting that the role a few individuals with unusually long infectious period but low contagiousness have on the persistence and transmission of the infection may be overestimated. On the other hand, models that incorporated either farm or animal variability in transmission rates improved the fit to the E. coli O157 prevalence data [Reference Matthews35]. It was estimated that the fraction of animals with higher transmission rates (50 times higher) was 0·05 [Reference Matthews35] for E. coli O157. In model 3, we included the super-shedder stage; based on our parameter estimates from field data and model assumptions, those super-shedders had both greater transmission rates (26·7 times higher than I s) and longer infectious periods (5·7 times longer than I s). It is reasonable to assume that animals that shed Salmonella in greater counts do so for a longer period of time. As has been shown before [Reference Matthews27, Reference Lloyd-Smith36], those individuals would have an important impact on the dynamics of transmission, being responsible for ~80% of the transmission (Fig. 6b). Sensitivity analysis indicated that the assumed high βss made model 3 very sensitive to the recovery rate for I ss. (Figs 8, 9). In fitting the shedding data, continuous shedding of Salmonella was assumed. However, intermittent shedding of Salmonella can also take place [Reference Wray, Davies, Wray and Wray17, Reference Matthews27], in which case, the total duration of shedding would be shorter and therefore recovery rates would be higher than the values reported in Table 1.
Impact of heterogeneity on vaccination programmes for Salmonella
An important implication of the presence of heterogeneity on the transmission of disease is that individual-specific control measures designed to target the most infectious individuals (e.g. isolation) are more efficient at eradicating disease than are population-wide control measures (e.g. random vaccination) [Reference Lloyd-Smith36, Reference Woolhouse37]. However, targeting specific subgroups to control Salmonella in a farm environment may prove very challenging. There are difficulties in identifying persistently infected individuals without clinical signs. For example, in the case of S. Dublin, the reported sensitivity of ELISA and bacterial culture from faeces may be as low as 21–50% and 6–14%, respectively in animals without clinical symptoms [Reference Nielsen, Toft and Ersboll38]. Further, ill-conceived intervention strategies may actually increase the prevalence of infection; the isolation of clinically ill animals in joint hospital and maternity pens has been reported to favour Salmonella persistence [Reference Cobbold11]. Therefore, we focused on evaluating the impact that heterogeneity has on population-wide control measures such as vaccination when the objective of vaccination is to eradicate an endemic Salmonella infection or prevent its introduction in a completely susceptible population.
The proportion of individuals that must be vaccinated to eliminate the infection is related to both R 0 and vaccine efficacy. The objective of the simulated scenarios (Table 2) was to compare models rather than provide absolute vaccination threshold values. Results indicated that vaccines with low efficacy would be rather ineffective at providing protection against persistent or invasive Salmonella infection. High efficacy vaccines that either reduce transmission from clinically ill animals or from all infective individuals were predicted to aid in eradicating infection for models 1 and 2. In one study comparing the efficacy of a Salmonella bacterin and a modified live Salmonella vaccine for adult cattle on a commercial dairy, the bacterin did not have any effect on faecal shedding; while the modified live vaccine was able to reduced the frequency of faecal shedding for the same serogroup by 25% [Reference House31]. This would not reach the efficacy thresholds needed to eliminate infection as predicted for models 1 and 2. However, we cannot give a general recommendation regarding Salmonella vaccination because our study did not addresses economic factors such as vaccine costs and benefits other than elimination of infection. In addition, key data such as vaccine efficacy for current vaccines are not available.
The presence of super-shedders decreases the effectiveness of population-wide strategies, making necessary the application of strategies that target this specific group. The onset of large clinical outbreaks may be associated with the presence of concurrent diseases (e.g. metabolic diseases) or nutritional stress [Reference Anderson10, Reference Wray, Davies, Wray and Wray17]. It is plausible that the super-shedder stage of Salmonella could be associated with herd-level characteristics that induce a generalized decrease on the immunological resistance to Salmonella. In that case, further work examining the factors that predispose a herd to immunological incompetence against Salmonella are a necessary step to design appropriate control measures.
We demonstrated the impact of individual heterogeneity on Salmonella transmission dynamics and eradication thresholds. Infected individuals with clinical signs were the main force of infection and transmission for models 1 and 2, thus demonstrating that reducing transmission from I c could be an effective way to reduce Salmonella prevalence. Long-term shedders had a small impact on the transmission of the infection and on the estimated vaccination thresholds, while the presence of super-shedders increased R 0 and decreased the effectiveness of population-wide strategies to reduce infection, making necessary the application of strategies that target this specific group. The question of which model is more appropriate to describe Salmonella transmission under various conditions remains contingent upon future findings. Data on Salmonella counts for clinically infected animals and apparently healthy animals in Salmonella outbreaks would help to elucidate the relative contribution of the infected stages to transmission. In addition, because farms are small populations, large fluctuations on the prevalence can occur by chance, and therefore, stochastic approaches will be necessary to move modelling efforts forward to determine the presence of heterogeneity in Salmonella transmission.
APPENDIX 1
List of the differential equations for the state transition models
Model 1
Model 2
Model 3
APPENDIX 2
The R 0 expressions were obtained by using the next-generation matrix method [Reference Diekmann and Heesterbeek29, Reference van den Driessche and Watmough30]. R 0 is defined as the spectral radius (dominant eigenvalue) of the next-generation matrix. To construct the next-generation matrix (FV −1), we define the matrices F and V as follows:
where the (i, j) entry of F is the rate at which infected individuals in compartment j produce new infections in compartment i and the (i, j) entry of V is the net rate of change of animals in compartment i by any other means. The rates are evaluated at the disease-free equilibrium x=x 0. For model 1, F and V matrices are:
The next-generation matrix is then given by the product FV −1⋅V −1, which indicates the average time that an individual spends in compartment i during its lifetime, is:
![V^{ \minus \setnum{1}} \equals \left[ {\matrix{\displaystyle {{1 \over {e \plus \mu \plus m}}} \tab 0 \cr {\displaystyle{e \over {\lpar e \plus \mu \plus m\rpar \lpar h \plus \mu \rpar }}} \tab\displaystyle {{1 \over {h \plus \mu }}} \cr} } \right]\hfill](https://static.cambridge.org/binary/version/id/urn:cambridge.org:id:binary:20151016071014818-0453:S0950268807000209_eqnU4.gif?pub-status=live)
and thus
![\openup4FV^{ \minus \setnum{1}} \equals \left[ {\matrix{\displaystyle {{{f\beta _{\rm c} S_{\setnum{0}} } \over {e \plus \mu \plus m}} \plus {{fe\beta _{\rm s} S_{\setnum{0}} } \over {\lpar e \plus \mu \plus m\rpar \lpar h \plus \mu \rpar }}} \tab\displaystyle {{{f\beta _{\rm s} S_{\setnum{0}} } \over {h \plus \mu }}} \cr {\displaystyle{{\lpar 1 \minus f\;\rpar \beta _{\rm c} S_{\setnum{0}} } \over {\lpar e \plus \mu \plus m\rpar }} \plus {{\lpar 1 \minus f\;\rpar e\beta _{\rm s} S_{\setnum{0}} } \over {\lpar e \plus \mu \plus m\rpar \lpar h \plus \mu \rpar }}} \tab \displaystyle{{{\lpar 1 \minus f\;\rpar \beta _{\rm s} S_{\setnum{0}} } \over {h \plus \mu }}} \cr} } \right].\hfill](https://static.cambridge.org/binary/version/id/urn:cambridge.org:id:binary:20151016071014818-0453:S0950268807000209_eqnU5.gif?pub-status=live)
The dominant eigenvalue of the matrix FV −1 gives R 0, which is obtained by solving the characteristic equation (FV −1)I−ΛI=0 where Λ is the eigenvalue and I is the identity matrix. The characteristic equation is given by
Thus the dominant eigenvalue is given by
For model 2, F and V matrices are:
The next-generation matrix is then given by the product FV −1. The characteristic equation for FV −1 is then given by
Thus the dominant eigenvalue is given by
For model 3, F and V matrices are:
The characteristic equation for the next-generation matrix FV −1 is given by
Thus the dominant eigenvalue is given by
ACKNOWLEDGEMENTS
This project has been funded with Federal funds from the National Institute of Allergy and Infectious Diseases, National Institute of Health, Department of Health and Human Services, under Contract no. NO1-AI-30054.
DECLARATION OF INTEREST
None.


