


1. Introduction
Finite wall-mounted cylinders (FWMCs) in a cross-flow are encountered in many engineering applications including buildings, cooling towers, bridge piers, heat exchangers and offshore structures. The flow around a single FWMC has served as a generic model for extensive investigation of the three-dimensional (3-D) complex vortex system of FWMCs which includes quasi-periodic Kármán vortex shedding from the sides, tip vortices near the free end and base vortices near the bottom wall of the cylinder (Sumner, Heseltine & Dansereau Reference Sumner, Heseltine and Dansereau2004; Krajnović Reference Krajnović2011; Porteous, Moreau & Doolan Reference Porteous, Moreau and Doolan2014; Crane et al. Reference Crane, Popinhak, Martinuzzi and Morton2022). The tip vortices induce a downwash flow while the base vortices induce an upwash flow that compete against each other and alters the vortex shedding of FWMCs compared with two-dimensional (2-D) or infinite cylinders. The complexity of the flow structure of FWMCs increases considerably when two or more cylinders are mounted near each other using tandem (inline), staggered or side-by-side arrangements. For example, two FWMCs arranged in tandem are further influenced by wake interference as the unsteady wake dynamics of the upstream cylinder (UC) directly interacts with the downstream cylinder (DC) (Zdravkovich Reference Zdravkovich1997; Zhou & Yiu Reference Zhou and Yiu2006). Wake interference can have a significant impact on the vortex shedding modes of both cylinders leading to unsteady loading, acoustic noise and fatigue failure. Although tandem FWMCs have been studied both experimentally and numerically over the past decades (Zhou & Mahbub Alam Reference Zhou and Mahbub Alam2016; Sumner & Reitenbach Reference Sumner and Reitenbach2019), most of the studies focused on identical height configurations. As a result, our understanding of the unsteady wake interference of FWMCs of unequal height is limited, despite their diverse engineering applications such as clusters of low- and high-rise buildings, industrial chimneys and cooling towers.
The flow around tandem 2-D circular cylinders can be classified into three main regimes based on the spacing ratio ( $s/d$, where s is the centre-to-centre spacing between the cylinders and d is the cylinder diameter): extended-body, reattachment and co-shedding regimes (figure 1) (Zdravkovich Reference Zdravkovich1997; Papaioannou et al. Reference Papaioannou, Yue, Triantafyllou and Karniadakis2006; Zhou & Yiu Reference Zhou and Yiu2006). For the extended-body regime ( $s/d \le 2$), the separated shear layers from the UC overshoot the DC leaving a near-stagnant flow in the gap between the cylinders. The reattachment regime occurs at $s/d \in [2,5]$ where the shear layers of the UC attach to the DC creating a quasi-steady gap flow. The co-shedding regime ( $s/d \ge 5$), on the other hand, is associated with a roll-up of the shear layers of the UC in the gap between the cylinders, resulting in a highly unsteady gap flow. A bi-stable regime may exist between the reattachment and co-shedding regimes where shear layers of the UC intermittently roll up or attach to the DC (Elhimer et al. Reference Elhimer, Harran, Hoarau, Cazin, Marchal and Braza2016; Alam et al. Reference Alam, Elhimer, Wang, Jacono and Wong2018). The transition or critical spacing ratios for the regimes are dependent on Reynolds number ( $Re = {U_\infty }d/\nu $, where ${U_\infty }$ is the free-stream velocity and $\nu $ is the kinematic viscosity of the fluid) and free-stream turbulence intensity (Ljungkrona, Norberg & Sundén Reference Ljungkrona, Norberg and Sundén1991; Sumner Reference Sumner2010; Alam Reference Alam2014).

Figure 1. Schematic of the three main types of wake interference around 2-D circular cylinders arranged in tandem: (a) extended-body regime ( $s/d \le 2$), (b) reattachment regime ( $s/d \in [2,5]$) and (c) co-shedding regime ( $s/d \ge 5$). The sketches are based on wake structures outlined in Zdravkovich (Reference Zdravkovich1997) and Zhou & Yiu (Reference Zhou and Yiu2006).
For tandem FWMCs, the flow regimes are further influenced by the aspect ratio of the cylinders ( $AR = h/d$ or $H/d$), relative boundary layer thickness ( $\delta /d$) or submergence ratio ( $\delta /h$ or $\delta /H$) and height ratio ( $h/H$), where h and H are the height of the UC and DC, respectively, and $\delta $ is the boundary layer thickness (see figure 2). Similar to single FWMCs, Kármán vortex shedding from tandem cylinders is suppressed for low aspect ratios ( $AR \le 2.5$) and the cylinders are often considered as roughness elements (Kawamura et al. Reference Kawamura, Hiwada, Hibino, Mabuchi and Kumada1984; Sumner et al. Reference Sumner, Heseltine and Dansereau2004; Moreau & Doolan Reference Moreau and Doolan2013; Hamed, Peterlein & Randle Reference Hamed, Peterlein and Randle2019). For high submergence ratio ( $\delta /H > 1$ and $h/H \le 1$), the cylinders are fully submerged in the turbulent boundary layer (TBL) and as a result encounter stronger mean shear and higher turbulence intensity in the approach flow compared with cylinders mounted in thin TBL $(\delta /H \ll 1)$ or uniform flow. Sumner & Reitenbach (Reference Sumner and Reitenbach2019) conducted a comprehensive review of previous studies on tandem FWMCs and concluded that the effects of wake interference are not well understood due to the strong influence of aspect ratio and submergence ratio of the FWMCs. Palau-Salvador, Stoesser & Rodi (Reference Palau-Salvador, Stoesser and Rodi2008) investigated the unsteady wake dynamics of low-aspect-ratio tandem FWMCs of identical height ( $AR = 2.5$, $h/H = 1$ and $\delta /H = 1.2$) and spacing ratio ( $s/d = 2$) and found that the spanwise shear layers of the UC reattach onto the DC, suppressing vortex shedding in the gap between the cylinders. Sumner & Li (Reference Sumner and Li2014) conducted an experimental study to investigate the three flow regimes of tandem FWMCs of high aspect ratio ( $AR = 9.0$ and $h/H = 1$) and in a thin TBL ( $\delta /H = 0.4$). The recirculation region, downwash and upwash flow behind the DC were reduced compared with a reference isolated single cylinder. For the extended body and reattachment regimes ( $s/d = 1.125$ and 2), pairs of tip and base vortices were observed behind the DC, but for the co-shedding regime ( $s/d = 5$), additional pairs of vortices associated with the UC were observed behind the DC. In the experimental study by Kim & Christensen (Reference Kim and Christensen2018), particle image velocimetry (PIV) was used to investigate the wake interference of identical tandem FWMCs with low aspect ratios ( $AR = 1.33$ and $2.37$) and high submergence ratios ( $\delta /H = 5.3$ and 7.1). For $s/d = 2$ and 3, the cylinders exhibited a reattachment regime, characterized by the separated shear layer from the free end of the UC directly attaching to the DC. This reattachment suppressed the downwash and recirculation region behind the DC. However, as the spacing ratio increased ( $s/d = 5$ and 7), the flow structure transitioned to a co-shedding regime. In this regime, the downwash from the free end of the UC deflected towards the wall, resulting in a stronger downwash and a larger recirculation bubble behind the DC.

Figure 2. Schematic of two FWMCs of unequal height and arranged in tandem. Each cylinder has the same diameter d and they are separated by a centre-to-centre streamwise distance s. The height of the UC is denoted h and that of the DC H. Both cylinders are fully submerged in a TBL of free-stream velocity  ${U_\infty }$ and boundary layer thickness $\delta $. The left-handed Cartesian coordinate system adopted has the origin of the streamwise (x), wall-normal (y) and spanwise (z) directions at the centre of the DC on the bottom wall.
The wake interference of unequal-height tandem FWMCs is more complex than that of identical-height tandem cylinders, yet our understanding is limited to a few previous investigations (Hamed et al. Reference Hamed, Peterlein and Randle2019, Reference Hamed, O'Brien, Hall, Gallary, DaRosa, Goddard and Mcatee2023; Hamed & Peterlein Reference Hamed and Peterlein2020; Freidooni et al. Reference Freidooni, Sohankar, Rastan and Shirani2021; Essel, Balachandar & Tachie Reference Essel, Balachandar and Tachie2023). A salient feature of this configuration is the sheltering of part or the whole span of the DC from direct interaction with the approach flow by the UC (figure 2). Sheltering can be employed as a flow control strategy for improving urban ventilation, reducing pollutant dispersion and unsteady loading on high-rise buildings and structures. Hamed et al. (Reference Hamed, Peterlein and Randle2019) used PIV to study the influence of height ratio (h/H = 0.50, 0.75 and 1.0) on time-averaged wake interference of low-aspect-ratio cylinders ( $H/d = 2.5$) with spacing ratios of $s/d = 2, 4$ and 6. The cylinders were fully submerged in the TBL ( $\delta /H = 5.0$). They found that sheltering is strongly influenced by both the height ratio and spacing ratio of the cylinders. As the height ratio increased, the effects of sheltering significantly reduced the downwash flow and recirculation region behind the DC compared to an isolated single cylinder. However, increasing the spacing ratio minimized the effects of sheltering. In a recent study, Essel et al. (Reference Essel, Balachandar and Tachie2023) performed a comprehensive investigation on the effects of height ratio (h/H = 0.10, 0.25, 0.50, 0.75 and 1.00) on the unsteady wake dynamics of unequal-height FWMCs with fixed spacing ratio of $s/d = 4$. The aspect ratio of the DC was kept constant at a high $AR = 7.0$ while the $AR$ for the UC was varied to obtain the various height ratios. The submergence ratio for the DC was $\delta /H = 1.2$. For $h/H = 0.10$, the downwash from the free end of the UC attached on the bottom wall of the gap region before interacting with the DC. As a result, the wake dynamics of the DC for $h/H = 1.0$ was similar to that of an isolated cylinder. As the height ratio increased, the strength of the downwash from the UC increased and it impinged directly on the frontal surface of the DC, inducing a strong upwash on the opposite rear end of the DC. The induced upwash significantly altered the unsteady wake characteristics of the DC compared with an isolated cylinder.
The objective of the present study is to investigate the effects of spacing ratio on the unsteady wake interference of unequal-height FWMCs submerged in a TBL ( $\delta /H = 1.2$). The spacing ratio was varied at $s/d = 2,4$ and 6 for a fixed height ratio of $h/H = 0.75$. This height ratio was chosen based on the findings of Essel et al. (Reference Essel, Balachandar and Tachie2023) and Hamed et al. (Reference Hamed, Peterlein and Randle2019), which demonstrated stronger sheltering effects on the mean flow and turbulence characteristics of the DC. Furthermore, Essel et al. (Reference Essel, Balachandar and Tachie2023) reported the occurrence of lock-in pumping motion and vortex shedding at a fixed $s/d = 4$ for $h/H = 0.75$, making it an intriguing choice for further investigation of the effects of spacing ratio. High aspect ratios of $AR = 5.3$ and 7.0 were used for the UC and DC, respectively. A time-resolved PIV system was used to conduct detailed spatio-temporal measurements of the tandem cylinders and a reference isolated single cylinder with the UC removed. In all cases, the Reynolds number was kept constant at $Re = 5540$. The remainder of the paper is organized as follows. Section 2 presents the experimental procedure for the time-resolved PIV measurements and test conditions. The effects of spacing ratio on the unsteady wake dynamics of the unequal-height tandem cylinders are presented in § 3. The major conclusions are summarized in § 4.
2. Experimental set-up and procedure
2.1. Flow facility and test conditions
The experiments were conducted in an open recirculating water channel at the University of Manitoba. The water channel consists of a flow-conditioning unit, a test section and a return plenum as shown in figure 3. The flow from the plenum is driven by a 30 kW variable-speed drive pump through the flow-conditioning unit before entering the test section. The flow-conditioning unit consists of perforated plates, hexagonal honeycombs, mesh screens of different sizes and a 4.88:1 contraction section. The test section is made of transparent super-abrasion-resistant acrylic plate and has dimensions of  $6.00\ \textrm{m} \times 0.45\ \textrm{m} \times 0.60\ \textrm{m}$ in the streamwise, vertical and spanwise directions, respectively. The cylinder models were vertically mounted using screws on flat acrylic plates that line the entire floor of the test section. Each cylinder was a smooth round acrylic rod of diameter $d = 12.7\ \textrm{mm}$ and heights $h/d = 5.3$ for the UC and $H/d = 7.0$ for the DC. The centre of the DC was set as the origin of the left-handed Cartesian coordinate system adopted in this study, where $x, y$ and z represent the streamwise, wall-normal and spanwise directions, respectively. As shown in figure 3, the origin is located at a streamwise distance of $315d$ from the channel's inlet and the mid-span ( $z/d = 0$) of the channel. The cylinder models and the top surface of the bottom plate on which they were mounted were painted with a non-reflective black spray to minimize surface glare from the laser illumination. The approach flow was tripped with a 16-grit sandpaper at the entrance of the test section to facilitate the transition to turbulent flow. The sandpaper had an average roughness height of 1.5 mm, a strip length of 80 mm and spanned the entire width of the channel.

Figure 3. Schematic of experimental set-up used in the present study. The PIV measurements were carried in the x–y plane at the symmetry (z/d = 0) of the cylinders. The depth of the water channel, the boundary layer thickness, the free-stream velocity and streamwise velocity at the height of the DC are denoted  $D/d$, $\delta /d$, ${U_\infty }$ and ${U_H}$, respectively. Not drawn to scale.
2.2. Test conditions
To investigate the effects of spacing ratio, the UC was positioned at a streamwise distance of  $s/d = 2,4$ and 6 measured from the fixed centre location of the DC. These spacing ratios mimic the three main flow regimes for tandem FWMCs: extended-body, reattachment and co-shedding regimes, respectively. For brevity, the test cases are denoted as SR2, SR4 and SR6, respectively. Measurement was also conducted for a reference isolated cylinder case without the UC installed, hereafter denoted as SC. For each experiment, the depth of the water in the channel was kept constant at $D = 11.42d$ ( $145\ \textrm{mm}$) and the maximum blockage ratio of the cylinders was 1.3 %. The approach TBL was measured before installing the cylinders in the channel. The free-stream velocity was ${U_\infty } = 0.436\ \textrm{m}\ {\textrm{s}^{ - 1}}$ and the Reynolds number based on $d$ and ${U_\infty }$ was $Re = 5540$. The Froude number ( ${U_\infty }/\sqrt {gD} $, where $g = 9.81\ \textrm{m}\ {\textrm{s}^{ - 2}}$ is the acceleration due to gravity) was 0.37 and the free-stream turbulence intensity was ${u_{rms}}/{U_\infty } = 1.6\%$, where ${u_{rms}}$ is the root mean square of the streamwise velocity fluctuations. The boundary layer thickness, based on the wall-normal location of $0.99{U_\infty }$ from the bottom wall, was $\delta = 8.7d$, while the displacement and momentum thicknesses were ${\delta ^\ast } = 1.63d$ and $\theta = 1.16d$, respectively.
2.3. Time-resolved PIV
A planar time-resolved PIV system was used to measure the velocity field at the mid-span of the channel with the cylinders installed. Initial measurements were performed with the standard double-frame mode of the system to characterize the approach TBL. The water was seeded with  $10\ {\rm \mu}\mathrm{m}$ silver-coated hollow glass spheres with a specific gravity of 1.4. The Stokes number of the particles was determined as $7.6 \times {10^{ - 5}}$ (Essel, Tachie & Balachandar Reference Essel, Tachie and Balachandar2021) which is orders of magnitude lower than the threshold value of 0.05 for the particles to follow the flow faithfully (Samimy & Lele Reference Samimy and Lele1991). A dual-cavity high-speed pulsed Nd:YLF laser with a wavelength of 527 nm and maximum energy of $30\ \textrm{mJ}\ \textrm{puls}{\textrm{e}^{ - 1}}$ at a sampling frequency of ${f_{sp}} = 1000\ \textrm{Hz}$ was used to illuminate the flow field. The laser sheet was set to a thickness of 1 mm using a combination of spherical and cylindrical lenses. The particle images were captured using a high-speed 12-bit CMOS camera with a $10\ {\rm \mu}\mathrm{m}$ pixel pitch and a resolution of $2560\ \textrm{pixels} \times 1600\ \textrm{pixels}$. The field of view of the camera was set to $20.5d \times 13.0d$ in the $x$–
$x$– $y$ directions with a magnification factor of 10 pixels mm−1. The camera and laser were mounted on a traverse system which allowed simultaneous streamwise movement of both devices at accurate locations. The data acquisition and image post-processing were performed with the LaVision Inc. software DaVis 10.
For the approach flow, a sample size of 9000 instantaneous images was captured at a sampling frequency of 4 Hz using the double-frame mode of the PIV system. However, 48 000 instantaneous single-frame images were obtained at a sampling frequency of  ${f_{sp}} = 1000\ \textrm{Hz}$ for the time-resolved measurements of the wake of the cylinders. The single-frame images were obtained in eight batches of 6000 images per batch. A convergence test was performed based on the SC to ensure that the total sample size was sufficient to achieve statistical convergence of the mean velocities, Reynolds stresses and spectral quantities reported herein. Furthermore, the ratio of the sampling frequency to the spanwise vortex shedding frequency ( $f$) at the mid-height of the SC was determined as 182 cycles and the number of cycles per batch of images acquired was 33, resulting in a total of 264 cycles for the total sample size. These results also confirmed that the temporal resolution was sufficient to capture the unsteady wake characteristics and the total sampling time was adequate for statistical convergence of the mean flow and turbulence quantities.
As shown in figure 3, measurements were focused on a streamwise–wall-normal plane located at the symmetry plane of the cylinders. This plane was chosen because it captures the primary interests of this study which includes understanding the effects of wake interference on the quasi-periodic expansion and contraction (i.e. pumping motion) of the recirculation bubbles, unsteady dynamics of the downwash and upwash motions and vortex shedding in the gap region and behind the DC. Here, the laser illumination was from the top of the channel with the camera viewing through the sidewall. For consistency with previous studies on submerged FWMCs at similar approach flow conditions by Essel et al. (Reference Essel, Tachie and Balachandar2021, Reference Essel, Balachandar and Tachie2023), a thin square acrylic plate ( $600\ \textrm{m}{\textrm{m}^2}$) with rounded leading edge was positioned beneath the camera and partially submerged in the water to a depth of 2 mm. The plate induced a thin boundary layer thickness of $0.5d$ which had no significant effect on the bulk flow beneath it.
During the data acquisition, it was ensured that the particle image diameter was 2–4 pixels to minimize pixel-locking-induced errors (Raffel, Willert & Kompenhaus Reference Raffel, Willert and Kompenhaus1998; Adrian & Westerweel Reference Adrian and Westerweel2011). All the PIV images were post-processed using an adaptive multi-grid cross-correlation algorithm based on multi-pass fast Fourier transform with a one-dimensional Gaussian peak-fitting function to determine the average particle displacement in an interrogation area (IA). The initial IA was  $128\ \textrm{pixels} \times 128\ \textrm{pixels}$ with $50\,\%$ overlap and the final IA was $32\ \textrm{pixels} \times 32\ \textrm{pixels}$ with $75\,\%$ overlap in each direction. The resulting vector spacing was $0.064d$ in each direction. Following Sciacchitano & Wieneke (Reference Sciacchitano and Wieneke2016) and Essel et al. (Reference Essel, Tachie and Balachandar2021), for the double-frame measurements, the uncertainty in the streamwise mean velocity at 95 % confidence level is less than ${\pm} 1.0\,\%$, while the uncertainty in the Reynolds stresses is ${\pm} 3.0\,\%$. For the time-resolved measurements, the uncertainty in the mean velocities across the height of the cylinders ranges from ${\pm} 1\,\%$ to ${\pm} 5\,\%$ while the uncertainties in the Reynolds stresses are within ${\pm} 3\,\%$ to ${\pm} 14\,\%$.
3. Results and discussion
3.1. Approach TBL characteristics
The features of the approach TBL pertinent to the unequal-height tandem FWMCs are presented in this section. A detailed characterization of the TBL is presented in Essel et al. (Reference Essel, Tachie and Balachandar2021) and is not repeated here for brevity. Figure 4 shows profiles of the normalized streamwise mean velocity ( $U/{U_\infty }$), root mean square of the streamwise velocity fluctuations ( ${u_{rms}}/{U_\infty }$) and the streamwise integral length scale ( ${l_{u{u_x}}}/d$) of the approach unperturbed TBL. Following Wang & Ghaemi (Reference Wang and Ghaemi2022), the integral length scale ${l_{u{u_x}}}$ was determined by integrating the autocorrelations of the streamwise velocity fluctuations ( ${R_{uu}}$) from the self-correlation point to the downstream location where ${R_{uu}} = {\textrm{e}^{ - 1}}$, where $\textrm{e}$ is the exponential constant. For submerged cylinders, the section of the TBL that directly interacts with the cylinders has a stronger influence on the flow separation and wake dynamics around the cylinders (Lim, Castro & Hoxey Reference Lim, Castro and Hoxey2007; Fang & Tachie Reference Fang and Tachie2019; Essel et al. Reference Essel, Tachie and Balachandar2021). Here, the section of the TBL is demarcated by the submergence ratio of each cylinder, which is $\delta /h = 1.6$ for the UC and $\delta /H = 1.2$ for the DC. For the UC, the free end of the cylinder encounters a streamwise mean velocity of ${U_h} = 0.38\ \textrm{m}\ {\textrm{s}^{ - 1}}$ ( ${U_h}/{U_\infty } = 87\%$) in the logarithmic layer, ${h^ + } = h{u_t}/\nu = 1080$, where ${u_t}$ is the friction velocity obtained fitting the velocity profile to the logarithmic law as shown in Essel et al. (Reference Essel, Tachie and Balachandar2021). The corresponding turbulence intensity ${u_{rms,h}}/{U_\infty } = 4.5\,\%$ and integral length scale ${l_{u{u_x}}}/d = 1.73$. On the other hand, the free end of the DC experiences a marginal increase in approach velocity of ${U_H} = 0.41\ \textrm{m}\ {\textrm{s}^{ - 1}}\,({U_H}/{U_\infty } = 94\,\%)$ in the outer layer ( ${h^ + } = 1420$) and integral length scale of ${l_{u{u_x}}}/d = 1.80$, but the turbulence intensity reduces to ${u_{rms,H}}/{U_\infty } = 3.8\,\%$.

Figure 4. Approach TBL profiles of the (a) streamwise mean velocity ( $U$) and (b) root mean square of the streamwise velocity fluctuations ( ${u_{rms}}$) and streamwise integral length scale ( ${l_{u{u_x}}})$. The horizontal dashed lines represent the heights of the UC ( $y/d = 5.3$) and SC/DC ( $y/d = 7.0$), and boundary layer thickness ( $\delta $). The magnitudes of the quantities at the respective heights are shown on the plots.
3.2. Time-averaged wake characteristics
Figure 5 shows contours of the streamwise and wall-normal mean velocities for the SC and the unequal-height tandem cylinders (SR2, SR4 and SR6). The cylinder diameter d and  ${U_H}$ are used as the length and velocity scales, respectively, for all the results presented herein. In each plot, the contour line of the 50 % forward-flow probability ( $\gamma = 0.5$) is superimposed to define the reverse-flow region ( $U < 0$) around the cylinders. Here, the forward-flow probability is defined as the probability of flow in the downstream direction, indicated by a positive instantaneous streamwise velocity (Kiya & Sasaki Reference Kiya and Sasaki1983). For figure 5(a–d), the contour line of $U/{U_H} = 0.5$ is used to highlight the perturbation in the wake of the cylinders, while the $U/{U_H} = 1.0$ contour line depicts the interface between the portion of the TBL that directly interacts with the cylinders and the bulk of the flow above the cylinder. The mean streamlines are superimposed on the wall-normal mean velocity plots to visualize the flow pattern. The SC exhibits a quadruple wake structure with a saddle point near the mid-height of the cylinder ( $y/H \approx 0.5$) (figure 5e). This quadrupole wake structure results from tip vortices inducing the downwash flow ( $V < 0$) and base vortices inducing the upwash flow ( $V > 0$) near the wall (Sumner et al. Reference Sumner, Heseltine and Dansereau2004; Krajnović Reference Krajnović2011). These features of the quadrupole wake structure contrast with the simpler dipole wake structure found in low-aspect-ratio FWMCs (Sumner et al. Reference Sumner, Heseltine and Dansereau2004; Hamed et al. Reference Hamed, Peterlein and Randle2019; Hamed & Peterlein Reference Hamed and Peterlein2020; Essel et al. Reference Essel, Tachie and Balachandar2021).

Figure 5. Contours of (a–d) streamwise and (e–h) wall-normal mean velocities for SC, SR2, SR4 and SR6. Superimposed on the wall-normal contours are the mean streamlines and the saddle point indicated by the red dots. The green solid line on the streamwise and wall-normal velocity contours represents the isopleth of 50 % forward-flow probability which bounds the reverse-flow region. The red and blue dashed lines on the streamwise velocity contours are the isopleth of  $U/{U_H} = 0.5$ and $U/{U_H} = 1.0$, respectively.
The unequal-height tandem FWMCs exhibit intriguing wake features influenced by the spacing ratio. For SR2, the downwash from the free end of the UC immediately impinges on the DC, deflecting downwards towards the bottom wall in the gap region. Part of the deflected flow reattaches on the rear end of the UC, splitting the reverse-flow region in the gap into two distinct halves. The deflection and close proximity of the DC also suppress the generation of an upwash flow in the gap. The sudden attachment of the downwash of the UC onto the DC aligns with the findings of Hamed et al. (Reference Hamed, Peterlein and Randle2019) for  $s/d = 2$ and $h/H = 0.75$; however, no reattachment of the deflected flow on the UC was observed in the previous study. This disparity is attributed to the relatively high-aspect-ratio cylinders used in this study. The wake structure of the DC for SR2 is significantly altered compared to the SC. In particular, the reverse flow region is substantially reduced in the sheltered portion of the DC ( $y/d \in [0,5.3]$) and the impingement of the downwash of the UC on the DC induces a strong upwash flow on the opposite rear end of the DC. The induced upwash flow interacts with the downwash from the DC much earlier (i.e. at the saddle point, $y/H = 0.86$), enlarging the reverse-flow region near the free end of the cylinder. With an increase in spacing ratio, the prominent modification to the wake structure occurs in the gap region. For SR4, the reverse-flow region behind the UC is well defined and exhibits a pair of counter-rotating recirculation bubbles with foci near the free end and bottom wall of the cylinder. Due to the reduced wake interference by the DC, an upwash flow is generated near the bottom wall of the gap, but the stronger downwash results in a saddle point located closer to the bottom wall ( $y/h = 0.23$). In the case of SR6, the upwash flow in the gap is enhanced, causing the saddle point to shift to the mid-height of the UC ( $y/h \approx 0.5$). This observation contrasts with the results of Hamed et al. (Reference Hamed, Peterlein and Randle2019) ( $s/d = 6$ and $h/H = 0.75$) where no upwash flow was observed in the gap due to the low aspect ratios of the cylinders. Additionally, they observed the downwash flow from the UC to reattach onto the gap bottom wall, which differs from the present observation. Behind the DC for SR2, SR4 and SR6, the strength of the downwash tends to increase with increasing spacing ratio while the induced upwash flow is weakened as the spacing ratio increases.
In comparison with identical tandem FWMCs (Palau-Salvador et al. Reference Palau-Salvador, Stoesser and Rodi2008; Sumner & Li Reference Sumner and Li2014; Kim & Christensen Reference Kim and Christensen2018), the key distinction is the direct interaction of the approach flow with the unsheltered portion of the DC. This interaction, as observed in figure 5, significantly enhances the downwash and the recirculation bubble behind the free end of the DC, in contrast to the wake structure observed behind identical cylinders. In agreement with Kim & Christensen (Reference Kim and Christensen2018) and Essel et al. (Reference Essel, Balachandar and Tachie2023), the wake structure formed in the gap region is strongly dependent on the aspect ratio of the UC and the spacing ratio.
Figure 6 shows contours of the turbulent kinetic energy (TKE) and the Reynolds shear stress ( $ - \langle uv\rangle$). Here, the TKE was approximated based on the measured streamwise $\langle u^{\prime}u^{\prime}\rangle$ and wall-normal $\langle v^{\prime}v^{\prime}\rangle$ Reynolds normal stresses as $\textrm{TKE} = 0.5(\langle u^{\prime}u^{\prime}\rangle + \langle v^{\prime}v^{\prime}\rangle)$. It is noteworthy that the unmeasured out-of-plane component $\langle w^{\prime}w^{\prime}\rangle$ also significantly contributes to the TKE due to the three-dimensionality of the flow (Essel et al. Reference Essel, Tachie and Balachandar2021, Reference Essel, Balachandar and Tachie2023). For the SC, the TKE (figure 6a) is enhanced along the periphery of the reverse-flow region which coincides with the vortex formation locations along the span of the cylinder (Szepessy & Bearman Reference Szepessy and Bearman1992; Rodríguez et al. Reference Rodríguez, Lehmkuhl, Chiva, Borrell and Oliva2015). The TKE is more intense in the downwash flow than in the upwash flow due to the strong mean gradient ( $\partial V/\partial y$) that contributes to high production of $\langle v^{\prime}v^{\prime}\rangle$ in that region (Essel et al. Reference Essel, Tachie and Balachandar2021). In the case of SR2, the TKE is significantly enhanced in the gap region. In contrast to the SC, the TKE in the wake of the DC is more intense in the induced upwash flow than in the downwash flow. Figure 6(c) shows enhanced TKE near the impingement location in the gap region of SR4; however, the turbulence level behind the DC is reduced compared with SR2. For SR6, the spatial distribution of the TKE behind the UC (figure 6d) is akin to that of the SC. However, the distribution of the TKE behind the DC for SR6 is consistent with SR2 and SR4, demonstrating the strong effects of sheltering by the UC.

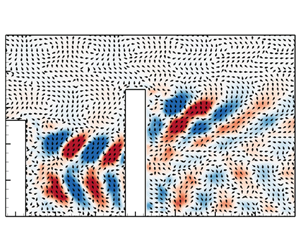
Figure 6. Contours of (a–d) TKE and (e–h) Reynolds shear stress for SC, SR2, SR4 and SR6. Superimposed on the contours are the isopleth of 50 % forward-flow probability (green solid line) which bounds the reverse-flow region and the saddle points indicated by the black dots. The values of the local maxima are shown in each plot.
The contours of  $ - \langle uv\rangle$ (figure 6e–h) reveal the various shear layers in the flow field for each test case. The signs are consistent with the orientation of the mean shear ( $\partial U/\partial y$) except near the leading edge of the cylinders, where $ - \langle uv\rangle $ is negative while $\partial U/\partial y$ is positive. As demonstrated in previous studies with flow separation at the leading edge of the bluff body (Fang & Tachie Reference Fang and Tachie2019, Reference Fang and Tachie2020), this discrepancy in sign arises from the misalignment of the mean streamline and the fixed x axis of the Cartesian coordinate system. While this misalignment can be addressed with the use of a curvilinear coordinate system, it does not affect the sign of $ - \langle uv\rangle $ in the wake, which is the primary region of interest in this study. For each cylinder, positive $ - \langle uv\rangle $ in the wake is usually associated with a downwash flow while negative $ - \langle uv\rangle $ is often associated with an upwash flow. However, in the gap region of SR2, it is interesting to notice negative $ - \langle uv\rangle $ in the reverse-flow region, despite the dominance of downwash flow in that region (see figure 5f). This was investigated using the production term of $ - \langle uv\rangle $ transport equation given as
 \begin{equation}{P_{ - uv}} = \langle u^{\prime}u^{\prime}\rangle \partial V/\partial x + \langle v^{\prime}v^{\prime}\rangle \partial U/\partial y.\end{equation}
In the wake region of each cylinder, the second term,  $\langle v^{\prime}v^{\prime}\rangle \partial U/\partial y$, was found to be the primary source of $ - \langle uv\rangle $, except in the gap region of SR2, where $\langle u^{\prime}u^{\prime}\rangle \partial V/\partial x$ was dominant. This dominance is due to enhanced negative $\partial V/\partial x$ arising from the reattachment of the deflected downwash flow on the UC. Consequently, $ - \langle uv\rangle $ attains a negative sign in the gap region of SR2. Figure 6(e–h) also demonstrates that the $ - \langle uv\rangle $ in the wake of the DC is significantly enhanced compared with the SC; however, the peak values tend to decrease with increasing spacing ratio. This observation is in contrast with identical tandem FWMCs (Kim & Christensen Reference Kim and Christensen2018), where $ - \langle uv\rangle $ in the downwash shear layer of the DC was found to increase with increasing spacing ratio and approaches the peak of an isolated cylinder at $s/d = 6$.
3.3. Unsteadiness of the separated shear layers
For high-aspect-ratio FWMCs, the wake consists of three main separated shear layers: spanwise shear layers, downwash shear layer and upwash shear layer. Extensive investigations have been conducted on the spanwise shear layers due to their association with Kármán vortex shedding (Kawamura et al. Reference Kawamura, Hiwada, Hibino, Mabuchi and Kumada1984; Sumner et al. Reference Sumner, Heseltine and Dansereau2004; Porteous et al. Reference Porteous, Moreau and Doolan2014); however, less attention has been given to the unsteadiness of the downwash and upwash shear layers. As reported in the literature (Sumner et al. Reference Sumner, Heseltine and Dansereau2004; Krajnović Reference Krajnović2011; Sumner & Li Reference Sumner and Li2014; Kim & Christensen Reference Kim and Christensen2018; Crane et al. Reference Crane, Popinhak, Martinuzzi and Morton2022; Essel et al. Reference Essel, Balachandar and Tachie2023) and observed in § 3.2, the downwash and upwash motions play crucial roles in the formation of the recirculation bubbles and the wake structure of the FWMCs. Therefore, this section aims to investigate the impact of wake interference and sheltering on these motions to improve our understanding of their dynamic behaviour.
Figure 7 shows the contours of the downwash-flow probability  $\zeta $ used to examine the intermittency of the downwash and upwash motions. Analogous to $\gamma $, the downwash-flow probability was determined as
 \begin{equation}\zeta = \frac{1}{N}\sum\limits_{i = 1}^N {(v(x,y,t) < 0)} ,\end{equation}
where  $v(x,y,t)$ is the instantaneous wall-normal velocity and N is the total sample size. Here, $\zeta > 0.5$ indicates a stronger probability of downwash, while $\zeta < 0.5$ denotes a stronger probability of upwash. The contour line of $\zeta = 0.5$ represents the interface between the upwash and downwash motions and the wall-normal location where $\zeta = 0.5$ intersects with the surface of the cylinder is denoted as the impingement point. Figure 7(a) demonstrates that the approach flow impinges on the frontal surface of the SC at $y/d = 5.1$ (equivalently, $y/H = 0.72$). After the impingement, part of the approach flow that deflects downwards contributes to the formation of horseshoe vortices at the junction of the cylinder and the bottom wall (Apsilidis et al. Reference Apsilidis, Diplas, Dancey and Bouratsis2015). At the free end, a low $\zeta $ of 0.01 (i.e. strong upwash) is observed at the leading edge but this is accompanied by a large $\zeta = 0.99$ region behind the cylinder. It is interesting to notice that, in the upwash-dominated region near the wall (see figure 5e), the downwash flow exhibits intermittency of 25 %, corresponding to a 75 % upwash-flow probability.

Figure 7. Contours of the downwash-flow probability for (a) SC, (b) SR2, (c) SR4 and (d) SR6. The red arrows represent the impingement points on SC/UC while the green arrows represent the impingement points on the DC.
For the unequal-height FWMCs, the impingement point of the approach flow on the UC is  $y/h = 0.63 \pm 0.03$ for all test cases. The downwash from the free end of the UC impinges on the frontal surface of the DC at $y/H = 0.91$ and dominates the entire gap region of SR2. For SR4, the impingement point near the free end of the DC is comparable with that of SR2. However, due to the presence of upwash flow within the gap, the extent of strong interaction between the downwash and the DC is restricted to the region $y/H \in [0.27,0.91]$. As spacing ratio increases to SR6, the strong downwash interaction region is further reduced to $y/H \in [0.33,0.87]$. Behind the DC, the region of intense downwash (i.e. $\zeta = 0.99$) for SR2–SR6 is significantly reduced compared with the SC. Moreover, the induced upwash region (i.e. $\zeta = 0.25$) is larger for SR4 than for SR2 and SR6.
The temporal evolution of profiles of the wall-normal velocity fluctuations is presented in figure 8. The profiles for the tandem cylinders were obtained at three streamwise locations: within the gap and near the DC ( $x/d ={-} 1.0$), through the intense downwash and upwash regions behind the DC ( $x/d = 2.0$) and further downstream ( $x/d = 5.0$). Similar plots were extracted for the SC to better understand the impact of the wake interference. The time-averaged saddle point behind the UC and the height of the UC/SC are indicated on the $x/d = - 1.0$ plots, while corresponding lines for the DC/SC are shown on the $x/d = 2.0$ and 5.0 plots. Figure 8(a) demonstrates that the SC encounters alternating regions of positive and negative fluctuations in the approach flow. The intense regions are mostly confined below the height of the SC and larger away from the bottom wall, consistent with the damping of wall-normal motions near the wall. These large motions are inclined towards the wall ( $\textrm{d}y/\textrm{d}t < 0$), which aligns with the high downwash-flow probability observed upstream of the SC (figure 7a). The slope ( $\textrm{d}y/\textrm{d}t$) of the intense regions also indicates the advection speed of the structures that interact with the cylinder. The slope of the dashed lines suggests that the approach structures convect downward with a speed of approximately ${U_H}$. With the presence of the UC for SR2, the alternating intense regions that interact with the DC are larger and more organized than observed upstream of SC. The slope of the regions also indicates lower advection speed ( $0.36{U_H}$), possibly due to the blockage by the DC (figure 7b). In addition, the consistent time interval ( $\Delta t$) between the alternating regions demonstrates strong periodicity in the motion of the structures, and this is examined in more detail in figure 9. In figure 8(c), the downwash motions that interact with the DC for SR4 are less organized compared with SR2. The occurrence of both large and small streaks may suggest intermittent bursts of large-scale motions that impinge on the DC. The advection speed of these large motions is approximately $0.50{U_H}$. Below the saddle line, the upwash motions exhibit weak fluctuations, allowing the strong downwash motions to penetrate towards the wall. Figure 8(d) shows that, for SR6, the alternating regions upstream of the DC have higher periodicity and less pronounced slope compared with SR2 and SR4. This is expected as the wider spacing ratio of SR6 allows the formation and shedding of vortices prior to interacting with the DC.

Figure 8. Temporal evolution of profiles of the wall-normal velocity fluctuations extracted at (a–d)  $x/d = - 1.0$, (e–h) $x/d = 2.0$ and (i–l) $x/d = 5$ for SC, SR2, SR4 and SR6. The solid black lines correspond to the height of UC/SC (a–d) and DC/SC (e–l). The dashed black lines represent the time-averaged location of the saddle point behind the UC (a–d) and the DC/SC (e–l). The inclined black dashed lines are used to highlight the slope of the structures. To maintain consistent legend ranges across all test cases, a scale-up factor of 6 is applied to the original results of the SC (a).

Figure 9. Spectra of the wall-normal velocity fluctuations behind the (a) UC and (b) SC/DC for each test case. The profiles behind the UC were extracted at  $x/d = - 1.0$ for SR2 and SR4 and at $x/d = - 3.0$ for SR6 while those behind the SC/DC were obtained at $x/d = 5.0$ for all test cases. The loci of the maximum ${u_{rms}}$ in the downwash (DW) and the upwash (UW) regions are used for the wall-normal positions. For clarity, the spectra are offset arbitrarily. The Strouhal number, 0.17, is reported at the mid-height of the SC (Essel et al. Reference Essel, Tachie and Balachandar2021).
At  $x/d = 2.0$, the temporal evolution of the velocity fluctuations behind the SC demonstrates more organized and larger structures in the downwash region than in the upwash region. The downwash structures are inclined towards the wall ( $\textrm{d}y/\textrm{d}t < 0$) while the upwash structures are inclined away from the wall ( $\textrm{d}y/\textrm{d}t > 0$). Further downstream ( $x/d = 5.0$), the alternating regions behind the SC continue to persist; however, the downwash and upwash structures seem to align along the saddle line while others merge to form larger structures. For SR2, figure 8(f) shows that the intense upwash and downwash regions behind the DC are dominated by long horizontal streaky structures in contrast to that observed behind the SC. However, these streaky structures are less persistent as they break down into smaller structures further downstream (figure 8j). For both SR4 and SR6, the evolution of the velocity fluctuations behind the DC exhibits similarities to that of the SR2, except that the streaky structures at $x/d = 2.0$ are longer for SR2.
In Essel et al. (Reference Essel, Tachie and Balachandar2021), the spanwise vortex shedding at three different wall-normal locations along the span of the SC was analysed. The SC was found to undergo cellular shedding behaviour where the Strouhal number ( $St = fd/{U_H}$) near the bottom wall ( $St = 0.20$) decreased to 0.17 at the mid-height of the cylinder and substantially reduced to 0.02 at the free end of the cylinder. In a related study, Essel et al. (Reference Essel, Balachandar and Tachie2023) investigated the spanwise vortex shedding at five different wall-normal locations along the height of the SR4 test case using spectral analysis of the velocity fluctuations and proper orthogonal decomposition (POD). They found that the attachment of the spanwise-separated shear layers of the UC on the DC induced a lock-in anti-symmetric vortex shedding in the sheltered part of the DC. The Strouhal number along the height of the UC was $St = 0.15$, while the DC exhibited Strouhal numbers $St \in [0.10,0.21]$ along the span of the cylinder and $St = 0.02$ near the free end. In the present study, the vortex shedding associated with the downwash and upwash motions along the symmetry plane of the SC and the unequal-height tandem FWMCs is examined using the spectra of the wall-normal velocity fluctuations in figure 9. The profiles were extracted at streamwise locations behind the UC (i.e. $x/d = - 1.0$ for SR2 and SR4 and $x/d = - 3.0$ for SR6) and the DC/SC ( $x/d = 5.0$). The wall-normal locations were selected as the locations of the maximum ${u_{rms}}$ in the downwash and upwash regions separated by the $\zeta = 0.5$ contour line (see figure 7). The spectra were obtained using Welch's method with a window size of 6000 data points, corresponding to a duration of $6\ \textrm{s}$, and a Hanning window. The resulting frequency resolution was $0.1221\ \textrm{Hz}$.
In figure 9(a), the gap region of SR2 is mainly characterized by a low-frequency vortex shedding ( $St = 0.056$) with a dominant second harmonic ( $St = 0.117$). In contrast, SR4 shows an increased Strouhal number of $St = 0.249$ for the downwash motions behind the UC, while the upwash motions have a higher Strouhal number of $St = 0.283$. It is worth noting that both the upwash and downwash motions for the UC of SR4 have significantly higher Strouhal numbers compared with the spanwise vortex shedding of UC ( $St = 0.150$) reported in Essel et al. (Reference Essel, Balachandar and Tachie2023). For SR6, the dominant Strouhal numbers are $St = 0.283$ and 0.287 for the downwash and upwash motions behind the UC. In the case of the SC (figure 9b), both the upwash and downwash motions have a higher Strouhal number of $St = 0.344$, which is outside the range of $St \in [0.02,0.21]$ reported in the spanwise planes of SC (Essel et al. Reference Essel, Tachie and Balachandar2021). These observations indicate that the upwash and downwash motions behind the cylinders are associated with relatively smaller vortices compared with the large-scale Kármán vortices shed in the spanwise shear layers. Figure 9(b) also shows that the upwash and downwash motions behind the DC for SR2–SR6 exhibit broader and less pronounced vortex shedding frequencies compared with the SC, mainly due to the effects of sheltering. However, the identifiable dominant peaks in the spectra of these motions are comparable to that of the SC.
3.4. Spatio-temporal characteristics of the recirculation bubbles
Although the time-averaged flow field provides useful insight into the overall impact of wake interference on the recirculation bubbles, the averaging tends to obscure interesting phenomena such as the quasi-periodic pumping motion of the reverse-flow region. To capture and understand the mutual interaction between the pumping motions behind the unequal-height tandem FWMCs, the spatio-temporal evolution of the reverse-flow region behind each cylinder is examined using the time-resolved flow field. Figure 10 presents a characteristic snapshot of the instantaneous flow field for each test case, demonstrating the unsteadiness of the reverse-flow regions under the influence of wake interference and sheltering. The instantaneous streamlines also reveal intriguing flow patterns that compose the time-averaged wake structure of the FWMCs observed in figure 5. Following Pearson, Goulart & Ganapathisubramani (Reference Pearson, Goulart and Ganapathisubramani2013), the temporal variation of the reverse-flow area behind each cylinder is calculated as follows:
 \begin{equation}A(t) = \int_M {{\mathcal{H}}(u(x,y,t))\,\textrm{d}\kern 0.06em x\,\textrm{d}y} ,\end{equation}
where the detector function  ${\mathcal{H}}(p)$ is evaluated as ${\mathcal{H}}(p) = 0$ for the event where $p \ge 0$ and ${\mathcal{H}}(p) = 1$ for $p < 0$. The event $p = u(x,y,t)$ is the instantaneous streamwise velocity at each IA, while $\textrm{d}\kern 0.06em x$ and $\textrm{d}y$ are the vector spacing in the x and y directions, respectively. The integral area M is designated as a fixed region, $x/d \in [0.5,5.0]$ and $y/d \in [0.0,8.0]$ for the SC and the DC of the unequal-height cylinders. For the UC, the streamwise distance ( $x/d$) of M was varied based on the gap between the rear end of the UC and the front end of the DC for each spacing ratio, but the wall-normal distance was kept constant at $y/d \in [0.0,8.0]$.

Figure 10. Contours of characteristic snapshot of instantaneous streamwise velocity and streamlines for (a) SC, (b) SR2, (c) SR4 and (d) SR6. The instantaneous reverse-flow area is represented by the contour level  $u < 0$.
Before discussing the temporal characteristics of the reverse-flow region, the mean reverse-flow area ( ${A_m}$) and the streamwise extent of the reverse-flow region ( ${L_r}$) behind each cylinder are presented in figure 11. The value of ${L_r}$ is determined as the streamwise distance from the rear end of the cylinder to the furthest location of the contour line of $\gamma = 0.5$ (see figure 5c). The corresponding values of ${A_m}/{d^2} = 7.8$ and ${L_r}/d = 2.3$ reported in Essel et al. (Reference Essel, Tachie and Balachandar2021) for an isolated FWMC with similar aspect ratio and submergence ratio to the UC are also shown on the plots for comparison. In the case of SR2, the strong wake interference significantly suppresses ${A_m}$ behind the UC and limits ${L_r}$ to the streamwise distance of the gap (i.e. $1d$). However, for SR4, ${A_m}$ and ${L_r}$ for the UC substantially increase to values 24 % and 30 % larger than results reported for a similar isolated FWMC (Essel et al. Reference Essel, Tachie and Balachandar2021). This would imply that the deflection of the downwash flow by the DC and the weak resistance by the upwash flow in the gap for SR4 augment the formation of the reverse-flow region behind the UC. For SR6, the impact of wake interference is reduced and the upwash flow in the gap is enhanced; therefore, ${A_m}$ and ${L_r}$ for the UC are reduced by 11 % and 26 % compared with values of SR4. Although ${L_r}$ for the UC (SR6) is similar to that for the isolated cylinder (Essel et al. Reference Essel, Tachie and Balachandar2021), ${A_m}$ exhibits an increase of 11 %. Behind the DC, ${A_m}$ increases gradually with a slope of $k = 0.18$ as the spacing ratio increases; however, these values are substantially lower than that of the SC. On the other hand, the length of the reverse-flow region for the DC is ${L_r}/d = 1.85 \pm 0.15$ for SR2–SR6.

Figure 11. Distribution of (a) the mean reverse-flow area ( ${A_m}$) and (b) the streamwise extent of the reverse-flow region ( ${L_r}$) behind the UC and the DC for the various spacing ratios. The results of Essel et al. (Reference Essel, Tachie and Balachandar2021) for an isolated cylinder similar to the UC used in the present study are shown for comparison.
Figure 12(a,b) shows the probability density function (PDF) of the fluctuations of the reverse-flow area ( $A^{\prime} = A - {A_m}$) behind each cylinder, where $A^{\prime} > 0$ demonstrates expansion of the reverse flow region relative to ${A_m}$, while $A^{\prime} < 0$ signifies contraction. The skewness ( ${S_k}$) and kurtosis ( $K$) of $A^{\prime}(t)$ are shown on the plots to facilitate comparison with a Gaussian distribution, where ${S_k} = 0$ and $K = 0$ for perfectly symmetric pumping motion. For the UC, the PDF for SR2 demonstrate slightly negative skewness and positive kurtosis; however, both the negative skewness and positive kurtosis significantly increase for SR4. This implies more frequent contraction of the reverse-flow region behind the UC for SR4 than for SR2. On the other hand, the PDF for SR6 exhibits positive skewness with near-zero kurtosis, indicating stronger expansion of the reverse-flow region behind the UC as the wake interference reduces. In figure 12(b), the reverse-flow region behind the SC shows an intense pumping motion characterized by more frequent contractions than expansions. However, as the spacing ratio increases, the pumping motion behind the DC transitions from an asymmetric to a more symmetric pattern.

Figure 12. The PDFs of the fluctuations of the reverse-flow area ( $A^{\prime}$) behind the (a) UC and (b) SC/DC for SR2–SR6. Parameters ${S_k}$ and K represent the skewness and kurtosis of $A^{\prime}$, respectively. (c) The JPDFs of fluctuations of the reverse-flow area for UC and the DC. The PDF and JPDF are normalized such that the maximum value is unity.
To further investigate the correlation between the pumping motions of the unequal-height tandem cylinders, contours of the joint PDF (JPDF) of  $A^{\prime}$ for the UC and the DC are presented in figure 12(c). The quadrants of the JPDF are denoted Q1 to Q4, where Q1 corresponds to a synchronized expansion of the reverse-flow regions of both cylinders, while a synchronized contraction occurs in Q3. The event where the reverse-flow region contracts behind the UC while expanding behind the DC is captured in Q2. Quadrant Q4 represents the opposite event of Q2. For SR2 and SR6, the JPDFs are elliptical and aligned with the vertical and horizontal axes, respectively. This implies that the pumping motion behind the UC is not directly correlated with that of the DC for SR2 and SR6. In contrast, the JPDF for SR4 is inclined towards Q1 and Q3, indicating strong interconnection between the pumping motions behind the UC and the DC. The synchronized pumping motion of SR4 aligns with the lock-in characteristics of the reattachment regime of tandem FWMCs (Zdravkovich Reference Zdravkovich1997; Papaioannou et al. Reference Papaioannou, Yue, Triantafyllou and Karniadakis2006; Zhou & Yiu Reference Zhou and Yiu2006).
For 2-D bluff bodies, the unsteadiness of the reverse-flow region is influenced by two main mechanisms: low-frequency pumping motion and high-frequency vortex shedding (Kiya & Sasaki Reference Kiya and Sasaki1983; Cherry, Hillier & Latour Reference Cherry, Hillier and Latour1984; Largeau & Moriniere Reference Largeau and Moriniere2006; Kumahor & Tachie Reference Kumahor and Tachie2023). Fang & Tachie (Reference Fang and Tachie2019) performed unsteady measurements over a forward–backward-facing step and showed that the reverse-flow region also carries signatures of large-scale motions embedded in the approach TBL. In the case of FWMCs, the unsteadiness of the reverse-flow region is further complicated by the strong influence of the 3-D complex vortex system (i.e. tip vortices, base vortices and Kármán vortex shedding) around the cylinders. These competing vortices also imbed their frequency signatures in the temporal variation of the reverse-flow region (Essel et al. Reference Essel, Tachie and Balachandar2021, Reference Essel, Balachandar and Tachie2023). However, to the authors’ best knowledge, the influence of spacing ratio on the frequency signatures of the reverse-flow regions of unequal-height tandem cylinders has not been investigated in previous studies.
Figure 13 shows the premultiplied frequency spectra of the fluctuations of the reverse-flow area behind each cylinder. The presence of multiple peaks in these spectra highlights the impact of the complex 3-D vortex system on the temporal dynamics of the reverse-flow region. In figure 13(a), the pumping Strouhal number  $S{t_p} = {f_p}d/{U_H} = 0.016$ of an isolated cylinder similar to the present UC (Essel et al. Reference Essel, Tachie and Balachandar2021) is shown on the plot for comparison, where ${f_p}$ denotes the pumping frequency. For SR2, the reverse-flow region for the UC exhibits three dominant frequency signatures: a low-frequency Strouhal number $S{t_p} = 0.056$ with a second harmonic $2S{t_p}$ and a high-frequency Strouhal number $S{t_p} = 0.316$. The pumping Strouhal numbers $S{t_p} = 0.056$ and $2S{t_p}$ are similar to the shedding frequencies captured in the downwash shear layer of the UC for SR2 (see figure 9a). This observation demonstrates the strong influence of the free-end vortices in the downwash flow on the pumping motion of the reverse-flow region. For SR4 and SR6, the reverse-flow area behind the UC exhibits relatively lower pumping Strouhal numbers (i.e. $S{t_p} = 0.006$ and 0.009, respectively, and accompanying harmonics) than that for SR2. It is also interesting to notice that the spectra for SR4 and SR6 also show dominant Strouhal numbers of $S{t_p} = 0.130$ and 0.152, respectively, which are comparable to the Strouhal number ( $St = 0.150$) of the spanwise vortex shedding of the UC reported in Essel et al. (Reference Essel, Balachandar and Tachie2023). When these Strouhal numbers are calculated based on the free-stream velocity, the values agree with $S{t^\ast } \in [0.150- 0.180]$ usually reported for spanwise vortex shedding of circular FWMCs of $AR < 10$ (Porteous et al. Reference Porteous, Moreau and Doolan2014). The profiles for SR4 and SR6 also show that, unlike SR2, the Strouhal numbers of the downwash and upwash motions behind the UC (figure 9a) have no footprints on the temporal dynamics of the reverse-flow region. This would imply that the large-scale spanwise vortices overwhelm the small-scale vortices in the downwash and upwash shear layers, thereby suppressing their impact on the reverse-flow region of the UC for SR4 and SR6.

Figure 13. Premultiplied frequency spectra of the fluctuations of the reverse-flow area behind the (a) UC and (b) SC/DC for SR2–SR6. The vertical dotted line in (a) represents the pumping Strouhal number of an isolated cylinder similar to the UC reported in Essel et al. (Reference Essel, Tachie and Balachandar2021). The spectra are offset arbitrarily for clarity.
Behind the SC, the spectra of the reverse flow region also exhibit a low pumping Strouhal number ( $S{t_p} = 0.012$) with a second harmonic ( $2S{t_p}$), and a higher Strouhal number ( $S{t_p} = 0.166$) that is similar to the Strouhal number of the spanwise vortex shedding ( $St = 0.170$) at the mid-height of the SC (Essel et al. Reference Essel, Tachie and Balachandar2021). In contrast, the spectra of the DC for SR2–SR6 show multiple peaks that tend to increase with increasing spacing ratio. This demonstrates a more erratic modulation of the reverse-flow region of the DC due to the combined influence of sheltering and spacing ratio.
3.5. Spectral proper orthogonal decomposition
The spatial and temporal characteristics of the energetic vortical structures in a time-resolved flow field can be examined using spectral POD (SPOD) (Towne, Schmidt & Colonius Reference Towne, Schmidt and Colonius2018). While the conventional space-only POD (Lumley Reference Lumley, Yaglon and Tatarski1967; Sirovich Reference Sirovich1987) extracts the spatial energetic structures of the entire frequency domain, SPOD complements POD by sorting these structures based on their advection frequencies. The SPOD procedure outlined by Towne et al. (Reference Towne, Schmidt and Colonius2018) involves performing a Fourier transform of the time-resolved flow field and decomposing the Fourier-transformed flow field using the POD technique. The decomposed fluctuating velocity field, for example, is given as
 \begin{equation}\vartheta ^{\prime}(x,y,t) = \sum\limits_{j = 1}^\infty {\sum\limits_{m = 1}^\infty {\phi _j^m(x,y)a_j^m\,{\textrm{e}^{ - \textrm{i}{\omega _j}t}}} } + \textrm{c}\textrm{.c}\textrm{.,}\end{equation}
where  $\vartheta ^{\prime}$ denotes the fluctuating velocity component, the indices j and m represent the frequency and mode number, respectively, $\phi _j^m(x,y)$ is the orthogonal set of spatial eigenfunctions (modes) and $a_j^m$ is their associated coefficients, the wavenumber ${\omega _j} = 2{\rm \pi} {f_j}$, $\textrm{i} \equiv \sqrt { - 1} $ and $\textrm{c}\textrm{.c}\textrm{.}$ denotes the complex conjugate.
In the present study, SPOD was used to investigate the effects of spacing ratio on the energetic structures associated with vortex shedding in the symmetry plane of the FWMCs. The total sample size of 48 000 was divided into eight blocks based on the batches of 6000 images acquired. Fast Fourier transform was performed on each block with a Hanning window, resulting in a frequency resolution of  $\Delta f = 0.12\ \textrm{Hz}$. To reduce computational cost, the flow field was trimmed to a streamwise distance from the leading edge of the UC/SC to $x/d = 8.0$ and $y/d \in [0.0,10.0]$ for each test case. The region occupied by each cylinder was blanked out during the analysis. For each selected dominant frequency, the snapshot POD method (Sirovich Reference Sirovich1987; Sen, Bhaganagar & Juttijudata Reference Sen, Bhaganagar and Juttijudata2007) was performed on the Fourier-transformed data using singular value decomposition (Fang, Tachie & Dow Reference Fang, Tachie and Dow2022; Chalmers, Fang & Tachie Reference Chalmers, Fang and Tachie2023; Essel et al. Reference Essel, Balachandar and Tachie2023). The singular value decomposition computes the modes and eigenvalues ( $\lambda $), which represent the energy content of each mode. The eigenvalues are arranged in descending order, ${\lambda ^1} > {\lambda ^2} > \cdots {\lambda ^b}$, where b = 8, equivalent to the number of blocks used. The first few modes are associated with the energetic large-scale structures advecting at the selected frequency, while the higher-order modes capture the smaller-scale structures.
Figure 14 shows the premultiplied energy spectra of the first five modes for each test case. The modes for the SC exhibit a consistent Strouhal number of  $St = 0.344$, which is highly pronounced for Mode 1. This Strouhal number is consistent with the peaks of the spectra of the velocity fluctuations in the upwash and downwash shear layers of the SC (figure 9b). For SR2, the spectrum for Mode 1 shows a dominant Strouhal number of $St = 0.117$ with accompanying Strouhal numbers with reduced energy content. The Strouhal numbers $St = 0.056$ and 0.117 were also observed in the spectra of the velocity fluctuations in the downwash shear layer (figure 9a) and pumping motion of the reverse-flow region (figure 13a) behind the UC. In contrast, the spectra of Modes 2–5 for SR2 have broad peaks with traces of frequency signatures captured in Mode 1. Unlike SR2, Mode 1 for SR4 demonstrates a pair of Strouhal numbers, $St = 0.249$ and 0.283, consistent with the vortex shedding frequencies in the downwash and upwash shear layers behind the UC (figure 9a). However, Modes 2–5 for SR4 also exhibit broad peaks. In the case of SR6, all the modal spectra exhibit a Strouhal number of $St = 0.287$, but the peaks reduce with increasing mode number. The Strouhal number $St = 0.287$ is comparable with the vortex shedding frequencies behind the UC for SR6 (figure 9a). The dominant Strouhal numbers of the SPOD suggest that, for the unequal-height tandem FWMCs, the vortex shedding of the UC is more pronounced and dictates the shedding behaviour of the DC. This observation aligns with the distinct peaks of the spectra of the velocity fluctuations behind the UC (figure 9a), in contrast to the relatively broader peaks observed behind the DC (figure 9b). The results also demonstrate that the SPOD Mode 1 contains the pertinent shedding dynamics of the large-scale energetic structures in the flow field, which agrees with previous bluff body studies (Yauwenas et al. Reference Yauwenas, Porteous, Moreau and Doolan2019; Chen et al. Reference Chen, Li, Sun and Liang2022; Fang et al. Reference Fang, Tachie and Dow2022; Chalmers et al. Reference Chalmers, Fang and Tachie2023).

Figure 14. Premultiplied energy spectra of the first five modes for (a) SC, (b) SR2, (c) SR4 and (d) SR6. The Strouhal numbers similar to those observed in the spectra of the velocity fluctuations are shown in bold text. The spectra are offset arbitrarily for clarity.
The fractional and cumulative energy contributions of the first five modes to the TKE associated with the dominant Strouhal numbers of each test case (figure 14) are presented in figure 15. The most energetic mode, Mode 1, contains 59 % of the energy for the SC but reduces to 53 % for SR2. The energy content of Mode 1 for SR4, on the other hand, dramatically reduces to 26 %, while SR6 exhibits an energy content of 43 % in Mode 1. In contrast, Mode 2 for SC, SR2 and SR6 contains about 11 % of the energy while that for SR4 contains 17 %. Mode 5 captures less than 10 % of the energy for SC, SR2 and SR6 and 10 % for SR4. The energy content of Mode 1 and the cumulative energy distribution (figure 15b) indicate that the range of scales is wider for the unequal-height tandem cylinders than for the SC. Moreover, the wider range of scales for SR4 would indicate that the vortex dynamics of SR4 is relatively more complex than that of SR2 and SR6.

Figure 15. Distributions of the (a) fractional energy and (b) cumulative energy contributions of the first five modes at the dominant Strouhal numbers for SC, SR2, SR4 and SR6.
Figure 16 compares the vortex shedding motions of the various test cases using the streamwise ( ${\phi _u}$) and wall-normal ( ${\phi _v}$) components of Mode 1 at the dominant frequencies $St = 0.344$, $0.117$, $0.283$ and $0.287$ for SC, SR2, SR4 and SR6, respectively. Given the periodicity of the vortex shedding motion, the real and imaginary parts of the SPOD mode were used to reconstruct the complete phases of the motions as follows:
 \begin{equation}\varPhi _j^m(x,y,\alpha ) = \phi _j^m(x,y)\,{\textrm{e}^{ - \textrm{i}{\omega _j}t}} + \textrm{c}\textrm{.c}\textrm{.,}\end{equation}
where  $\alpha = {\omega _j}t$ is the phase angle varied from 0 to $2{\rm \pi} $. The animations of these phases are provided in supplementary movies 1–4 available at https://doi.org/10.1017/jfm.2023.952. For the SC, figure 16(a,e) and movie 1 demonstrate that the free-end vortices roll up near the trailing edge and get entrained behind the cylinder due to the downwash induced by the tip vortices. These free-end vortices merge with the spanwise vortices that appear to be initiated near the mid-height of the SC and at $x/d = 1$. At the junction of the cylinder and the wall, small-scale vortices associated with the upwash motion are generated at about $x/d = 2$ and these small-scale vortices also merge with the spanwise vortices. Consequently, due to the effects of the upwash and downwash motions, the spanwise vortex shedding bends away from the wall and the free end of the cylinder as the flow evolves downstream. The present observation agrees with the results of Crane et al. (Reference Crane, Popinhak, Martinuzzi and Morton2022), which demonstrated the temporal evolution of the 3-D vortical structures behind a circular FWMC with a quadruple wake structure.

Figure 16. Contours of (a–d) streamwise ( ${\phi _u}$) and (e–h) wall-normal ( ${\phi _v}$) components of Mode 1 at the dominant Strouhal numbers for SC, SR2, SR4 and SR6. The vectors of ${\phi _u}$ and ${\phi _v}$ are shown in (e–h).
For SR2 (figure 16b,f and movie 2), it is observed that the free-end vortices over the UC are completely overwhelmed by the strong downwash of the approach flow that is deflected by the unsheltered portion of the DC. Here, the downwash is not attributed to tip vortices of the UC due to the relatively short spacing distance between the UC and the DC. Flow separation from the trailing edge of the UC also generates vortices that impinge on the DC and break up as they evolve downward in the gap region. Behind the DC, the free-end vortices are shed and deflected downwards by the tip vortices of the DC. The vortices from the UC that immediately impinge on the DC induce a pair of large alternating vortices on the opposite rear end of the cylinder. Meanwhile, large packets of vortices are also shed near the bottom wall ( $y/d \in [0,3]$). These alternating vortices in the sheltered portion of the DC may be attributed to the combined effects of shedding from the sides of the DC and the roll-up of vortices in the spanwise shear layers of the UC. These vortices from the UC overshoot the DC due to the small spacing ratio, thereby contributing to the present observation.
The temporal evolution and spatial distributions of the vortices around the cylinders for SR4 (figure 16c,g and movie 3) are significantly different from those for SR2. Here, the free-end vortices from the UC impinge on the frontal surface of the DC and the deflected vortices collide with the vortices associated with the upwash flow. The spanwise shear layers of the UC attach onto the DC as reported in Essel et al. (Reference Essel, Balachandar and Tachie2023). Behind the DC, alternating pair of large vortices are observed in the induced upwash flow and these vortices interact with the free-end vortices from the DC. The results also suggest that Kármán vortex shedding from the sides of the DC is predominant on the upper half of the cylinder while the lower half is associated with small-scale vortices due to the effects of sheltering. In figure 16(d,h) and movie 4, the spatio-temporal evolution of the vortices for SR6 demonstrates a co-shedding regime. However, unlike tandem cylinders of identical heights, vortex shedding is significantly enhanced on the unsheltered portion of the DC.
3.6. Temporal scales
The SPOD analysis revealed that the unequal-height tandem FWMCs have a wider range of turbulent scales compared with the SC, while among the tandem FWMCs, SR4 has the largest range of scales. This range includes larger structures with longer time scales and smaller structures with shorter time scales. Therefore, this subsection examines the effects of wake interference on the integral time scales of the FWMCs. Following Tennekes & Lumley (Reference Tennekes and Lumley1972) and Kiya & Sasaki (Reference Kiya and Sasaki1983), the integral time scales of the streamwise ( ${{\mathcal{T}}_u}$) and wall-normal ( ${{\mathcal{T}}_v}$) velocity fluctuations were computed by integrating the temporal autocorrelations from zero-time displacement to the first zero correlation point. The temporal autocorrelations were computed as
 \begin{equation}{R_{\xi \xi }}(x,y,t) = \frac{{\langle \xi (x,y,t)\xi (x,y,\, t + \tau )\rangle }}{{\sqrt {\langle {\xi ^2}(x,y,t)\rangle } \sqrt {\langle {\xi ^2}(x,y, t + \tau )\rangle } }},\end{equation}
where the component of the velocity fluctuation is represented by  $\xi $, while t and $\tau $ denote the reference time and the temporal separation, respectively. To take advantage of the whole-field time-resolved PIV measurements, the integral time scales were determined at each vector point of the velocity field as presented in figures 17 and 18.

Figure 17. Contours of the streamwise integral time scales ( ${{\mathcal{T}}_u}$) for (a) SC, (b) SR2, (c) SR4 and (d) SR6. Superimposed are the saddle points marked by green dots and the isopleth of 50 % forward-flow probability (black solid line) which bounds the reverse-flow region. The values of the local maxima are shown in each plot.

Figure 18. Contours of the wall-normal integral time scales ( ${{\mathcal{T}}_v}$) for (a) SC, (b) SR2, (c) SR4 and (d) SR6. Superimposed are the saddle points marked by green dots and the isopleth of 50 % forward-flow probability (black solid line) which bounds the reverse-flow region. The values of the local maxima are shown in each plot. The green arrows on the DC represent the impingement points.
Figure 17(a) shows that the streamwise integral time scales are enhanced near the bottom wall as the approach flow interacts with the SC. This observation suggests the presence of large-scale structures upstream of the cylinder in agreement with the results of two-point autocorrelations reported in Essel et al. (Reference Essel, Balachandar and Tachie2023). As expected, the unperturbed free stream is dominated by large time scales associated with large spatial structures. Behind the SC, the streamwise time scales are enhanced near the trailing edge of the free end of the cylinder, in agreement with the shedding of the free-end vortices into the wake as observed in SPOD movie 1. The streamwise integral time scales are suppressed within the reverse-flow region but significantly enhanced along the periphery of the reverse-flow region from the bottom wall to the saddle point. Furthermore, these time scales are also enhanced in the strong downwash region that connects with the saddle point. The enhancement of the time scales near the periphery of the reverse-flow region is attributed to the roll-up of large-scale structures in the spanwise and upwash shear layers. Meanwhile, the roll-up and merging of the free-end vortices with the spanwise vortices lead to the enhancement of the time scales near the upper half of the reverse-flow region. In figure 17(b), a long stretch of large streamwise time scales is observed over the top surface of the UC for SR2. These large-scale structures may be formed due to blockage by the unsheltered portion of the DC. The plot also shows that the gap region and the induced upwash region behind the DC are occupied by smaller structures, while the downwash region behind the DC contains larger structures due to the free-end vortex shedding. For SR4 (figure 17c), the downwash flow behind the UC and the induced upwash flow behind the DC are also dominated by smaller-scale structures. However, it is interesting to observe regions of large time scales near the saddle point and the secondary reverse-flow region at the junction of the UC and the bottom wall. The presence of large streamwise time scales observed near the saddle points for each of the cylinders (figure 17) may be attributed to the influence of local stagnation. For SR4, the large time scales near the secondary reverse- flow region are associated with the base vortices of the upwash flow as observed in SPOD movie 3. Moreover, the large time scales in the primary reverse-flow region may be associated with large structures trapped in the region. Behind the DC for SR4, the streamwise time scales are also enhanced in the downwash flow. In figure 17(d), it is observed that the regions of enhanced streamwise time scales behind the UC for SR6 have similar spatial distribution to that of the SC due to the weak wake interference by the DC. Moreover, the regions of enhanced streamwise time scales behind the DC for SR6 exhibit similarities to those of SR2 and SR4, except that the time scales are smaller for SR6.
The time scales associated with the wall-normal velocity fluctuations are presented in figure 18. The difference in topology between wall-normal and streamwise time scales highlights the significant large-scale anisotropy of the turbulent flow around the FWMCs. For the SC, the salient features include large wall-normal time scales over the trailing edge and behind the free end of the cylinder. These time scales may be associated with free-end vortices that are deflected downwards into the wake by the tip vortices. For the unequal-height tandem cylinders, the time scales are suppressed over the trailing edge of the UC for SR2 but gradually become pronounced as spacing ratio increases. Moreover, the attachment of the downwash flow on the DC also enhances the time scales near the impingement point in a manner that tends to increase with increasing spacing ratio. Unlike SR2 and SR6, SR4 shows a large region of enhanced time scales in the reverse-flow region behind the UC. These large time scales are attributed to the vortices in the downwash flow that are deflected backwards after impinging on the DC (see SPOD movie 3). Behind the DC, the spatial distribution of the wall-normal time scales is similar for SR2–SR6; however, the scales behind the free end are significantly enhanced in the case of SR4.
4. Summary and conclusions
The effects of spacing ratio on the unsteady wake interference of unequal-height tandem FWMCs submerged in a TBL were investigated using a time-resolved PIV system. The cylinders have a height ratio of h/H = 0.75 based on aspect ratios of  $h/d = 5.3$ and $H/d = 7.0$ for the UC and DC cylinders, respectively. The Reynolds number based on the cylinder diameter and free-stream velocity was $Re = 5540$ while the submergence ratio was $\delta /H = 1.2$. To investigate the three main flow regimes of tandem FWMCs (i.e. extended-body, reattachment and co-shedding regimes), the spacing ratios of the cylinders were varied at $s/d = 2.0$ (SR2), 4.0 (SR4) and 6.0 (SR6), respectively. Moreover, measurements were also performed for an isolated SC similar to the DC to serve as a reference test case.
The wake structure of the unequal-height tandem FWMCs showed that, for SR2, the gap region is primarily dominated by a strong downwash of the approach flow that is deflected from the unsheltered portion of the DC. Based on frequency spectra of the velocity fluctuations and SPOD analysis, this downwash flow was found to be characterized by large packets of alternating low- and high-momentum fluid, exhibiting a low Strouhal number ( $St = fd/{U_H}$) of 0.056 and a second harmonic of 0.117. The quasi-periodic expansion and contraction (i.e. pumping motion) of the reverse flow in the gap region were also found to have a strong correlation with the low-Strouhal-number shedding motions of the downwash flow. As spacing ratio increased to SR4, significant modifications in the wake structure of the gap region were observed compared with SR2. Specifically, the downwash flow from the free end of the UC impinged on the frontal surface of the DC, but the upwash flow induced near the junction of the UC and the bottom wall restricted the deflected downwash flow from attaching onto the bottom wall. The presence of both upwash and downwash flow indicated a quadruple wake structure behind the UC of SR4. Unlike SR2, the downwash shear layer was found to contain small-scale vortices shed from the free end of the UC, while small-scale vortices in the upwash shear layer were generated near the bottom wall. The Strouhal numbers of the vortices in the upwash ( $St = 0.283$) and downwash ( $St = 0.249$) shear layers were significantly larger than $St = 0.150$ reported for Kármán vortex shedding in the spanwise shear layers of the UC. However, these small-scale vortices could not significantly impact the pumping motion of the reverse flow in the gap region of SR4. For the largest spacing ratio (SR6), the wake structure behind the UC was akin to that of isolated FWMCs with a quadrupole wake structure, except that the upwash and downwash shear layers were curtailed downstream due to the presence of the DC. The free-end vortices and vortices in the upwash flow merged with the Kármán vortex streets prior to interacting with the DC. The Strouhal number of these small-scale vortices in the gap region of SR6 was $St \approx 0.285$ and, similar to SR4, this had no impact on the pumping motion of the reverse-flow region.
The wake structure of the DC for SR2–SR6 was significantly different compared with the SC and identical tandem FWMCs due to partial sheltering effects. For each test case, the impingement of the downwash from the shorter UC on the DC induced a strong upwash flow on the opposite rear end of the sheltered portion of the DC, ultimately moving the saddle point closer to the free end of the DC compared with the SC. Moreover, the direct interaction of the approach flow with the unsheltered section of the DC significantly enhanced the downwash and recirculation bubble near the free end of the DC, in contrast to the observations of identical tandem FWMCs. The spatio-temporal evolutions of the SPOD Mode 1 revealed that the induced upwash flow behind the DC is associated with alternating large-scale vortices shed from the opposite sides of the DC. For SR2, these large-scale vortices are shed along the entire unsheltered portion of the DC, while for SR4 and SR6, they are concentrated near the free end of the cylinder. The Strouhal number of the vortex shedding in the upwash and downwash shear layers of DC for SR2–SR6, however, showed similarity to the value of  $St \approx 0.344$ observed for the SC. This Strouhal number was larger than $St \in [0.10,0.21]$ reported for the Kármán vortex shedding in the spanwise planes of the SC/DC.
The spatial distributions of the integral time scales were investigated for both the SC and the unequal-height tandem FWMCs. The results showed that both streamwise and wall-normal integral time scales are significantly enhanced over the free end of the cylinders and within the downwash of the DC/SC. In the gap region, the time scales are suppressed in the case of SR2; however, increasing the spacing ratio significantly enhances the streamwise time scales near the saddle point and the wall-normal time scales near the impingement points on the DC.
The insight from this study can guide the development of flow control strategies for reducing unsteady loading on low- and high-rise buildings and structures, enhancing urban ventilation and decreasing pollutant dispersion around structures. Building upon the present findings, future investigations employing 3-D experimental measurements or numerical simulations could further improve our understanding of wake interference in unequal-height tandem FWMCs.
Supplementary movies
Supplementary movies are available at https://doi.org/10.1017/jfm.2023.952.
Acknowledgements
E.E.E. is grateful to Dr R. Balachandar and Dr M. Tachie for their support during his NSERC PDF at the University of Windsor.
Funding
The authors are grateful to the Natural Sciences and Engineering Research Council of Canada (NSERC) for its financial support through NSERC Postdoctoral Fellowship (PDF) and Discovery Grant for E.E.E. We are also grateful to Canada Foundation for Innovation (CFI) for funding for the experimental facility at the University of Manitoba. We acknowledge the computational resources provided by the Speed HPC facilities at Concordia University.
Declaration of interests
The authors report no conflict of interest.


 Open access