

1. Introduction
Glacier surface mass balance (MB) reflects climatic fluctuations and is important for the assessment of water resources (e.g. Reference Ohmura, Bauder, Müller and KappenbergerOhmura and others, 2007). The Himalaya is one of the largest glacierized areas outside the polar regions, with a total glacier coverage of 22 800 km2 (Reference BolchBolch and others, 2012). Therefore, understanding the evolution of Himalayan glaciers is of great interest in diagnosing future water availability in these highly populated watersheds (e.g. Reference Kaser, Grosshauser and MarzeionKaser and others, 2010; Reference Thayyen and GerganThayyen and Gergan, 2010; Reference Prasch, Mauser and WeberPrasch and others, 2013). A reliable prediction of glacier behaviour in the future demands an assessment of their response to climate in the past.
Since the Intergovernmental Panel on Climate Change (IPCC) dispute (Reference SolomonSolomon and others, 2007), the Himalaya have become a focus of research interest, and subsequent ground-based MB (e.g. Reference CogleyCogley, 2009; Reference AzamAzam and others, 2012; Reference VincentVincent and others, 2013) as well as remote-sensing studies (e.g. Reference Bolch, Pieczonka and BennBolch and others, 2011, Reference Bolch2012; Reference Gardelle, Berthier and ArnaudGardelle and others, 2012, Reference Gardelle, Berthier, Arnaud and Kääb2013; Reference Kääb, Berthier, Nuth, Gardelle and ArnaudKääb and others, 2012) have been conducted over recent years. Unfortunately, data on recent glacier changes over the Himalaya are sparse, and even sparser as we go back in time (e.g. Reference CogleyCogley, 2011; Reference BolchBolch and others, 2012), so the rate at which these glaciers have been changing is still not well assessed. Direct measurements of glacier-wide surface MB over the Indian Himalaya are available on a limited number of glaciers (13 glaciers covering ~00 km2) and mostly come from the period 1975-90 (Reference VincentVincent and others, 2013). Chhota Shigri glacier is one of the best-observed glaciers in this region for its glacier-wide MB, surface velocity and geodetic MB. Although the direct glacier-wide surface MB since 2002 (Reference WagnonWagnon and others, 2007; Reference AzamAzam and others, 2012) and geodetic MB since 1988 (Reference VincentVincent and others, 2013) are available, it is desirable to have longer series in order to extend our knowledge of the glacier–climate relationship. There is therefore a necessity to reconstruct the surface MB of Himalayan glaciers in the past and to assess the impacts of climatic variables on glacier MB.
Melt models are customary approaches to MB reconstruction. These models generally fall into two categories: temperature-index models (e.g. Reference Jóhannesson, Laumann and KennettJóhannesson and others, 1995; Reference Braithwaite and ZhangBraithwaite and Zhang, 2000; Reference VincentVincent, 2002; Reference HockHock, 2003; Reference Pellicciotti, Brock, Strasser, Burlando, Funk and CorripioPellicciotti and others, 2005; Reference Zhang, Liu, Xie and DingZhang and others, 2006; Reference Huss, Bauder, Funk and HockHuss and others, 2008) and energy-balance models (e.g. Reference Fujita and AgetaFujita and Ageta, 2000; Reference Hock and HolmgrenHock and Holmgren, 2005; Reference Nemec, Huybrechts, Rybak and OerlemansNemec and others, 2009; Reference PaulPaul, 2010; Reference Mölg, Maussion, Yang and SchererMölg and others, 2012). Temperature-index models are based on a statistical relationship, between melting and near-surface air temperatures, using a restricted number of input data (generally air temperature), and hence do not possess extensive physical resolution. This approach was first used for an Alpine glacier by Reference Finsterwalder and SchunkFinsterwalder and Schunk (1887). Air-temperature data are usually the most widely available; thus, temperature-index melt models have been applied in a variety of studies. Conversely, energy-balance models estimate melt based on sophisticated energy-balance equations (Reference Hock, Radić and De WoulHock and others, 2007) and in turn provide a detailed physical resolution but demand an extensive input dataset. It is still unclear how the empirical relationship between air temperature and melt holds under different climate conditions (Reference HockHock, 2003), but the good performance of temperature-index models is generally attributed to the fact that many components of energy balance are strongly correlated with temperature (Reference OhmuraOhmura, 2001). Temperature-index models are known to perform better on mid-latitude glaciers than on low-latitude glaciers (Reference Sicart, Hock and SixSicart and others, 2008). However, Chhota Shigri glacier is similar to mid-latitude glaciers with an ablation season limited to the summer months and a mean vertical gradient of mass balance in the ablation zone similar to those reported in the Alps (Reference WagnonWagnon and others, 2007).
Consequently, in this study, a temperature-index model (e.g. Reference HockHock, 2003) together with an accumulation model is used to reconstruct the MB of Chhota Shigri glacier since 1969 using meteorological data from Bhuntar Observatory. The goals of this study are (1) to determine long-term time series of mean specific annual MB and (2) to resolve them into winter and summer balances. This provides a basis for the study of climate–glacier interaction as well as some principles of the MB-governing processes in the Western Himalaya.
2. Study Site
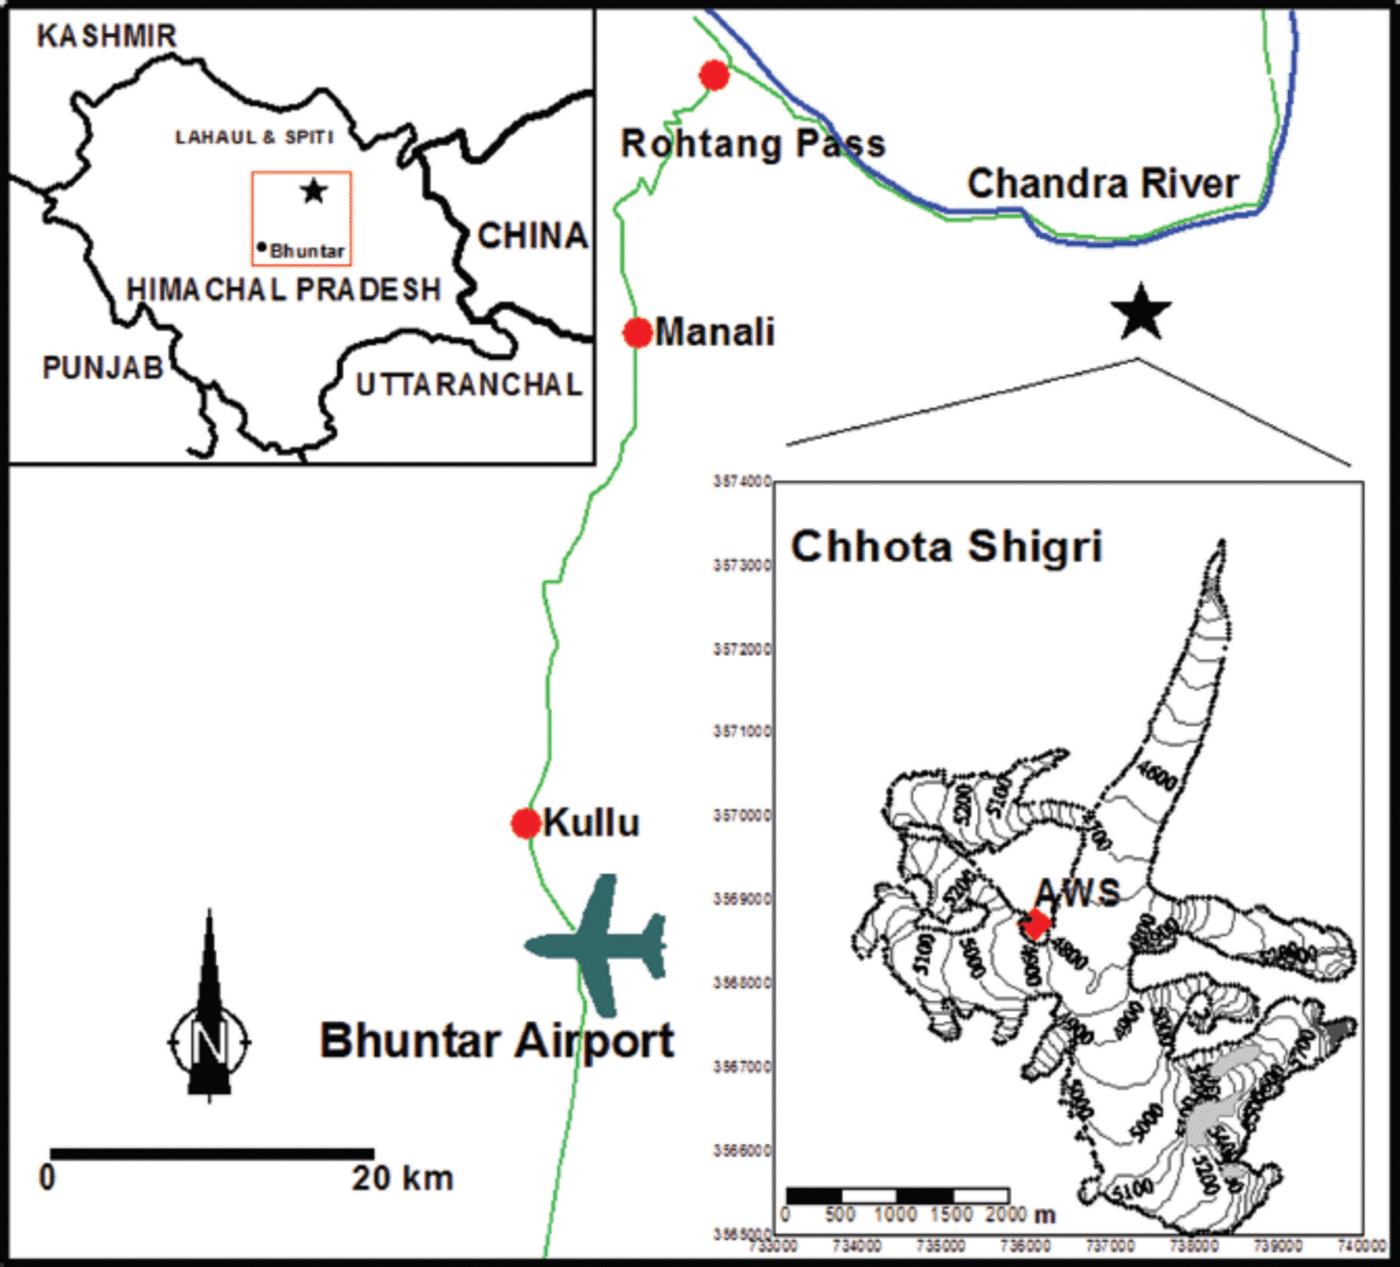
Chhota Shigri glacier (32.28° N, 77.588E) is a valley-type, non-surging glacier located in the Chandra-Bhaga river basin of Lahaul and Spiti valley, Pir Panjal range, Western Himalaya (Fig. 1). It lies -25 km from the city of Manali. This glacier is located in the monsoon-arid transition zone and is influenced by two atmospheric circulation systems: the Indian summer monsoon during summer (July-September) and the Northern Hemisphere mid-latitude westerlies during winter (January-April) (Reference Bookhagen and BurbankBookhagen and Burbank, 2010). Chhota Shigri glacier feeds Chandra River, one of the tributaries of the Indus River system. This glacier is likely to be temperate and extends from 6263 to 4050ma.s.l. with a total length of 9 km and area of 15.7 km2 (Reference WagnonWagnon and others, 2007). It is mainly oriented north-south in its ablation area but its tributaries and accumulation area have a variety of orientations (lower right inset in Fig. 1). Its snout is well defined, lying in a narrow valley and producing a single proglacial stream. The lower ablation area (<4400ma.s.l.) is covered by debris representing 3.4% of the total surface area (Reference VincentVincent and others, 2013). The debris layer is highly heterogeneous, ranging from silts measuring a few millimeters to big boulders sometimes exceeding several meters. The equilibrium-line altitude (ELA) for a zero net balance is close to 4900ma.s.l. (Reference WagnonWagnon and others, 2007).
Location map of Chhota Shigri glacier and its surroundings. Roads are shown in green, river in blue and Chhota Shigri glacier as a star. The upper left inset shows a map of Himachal Pradesh, India, with the location of the Bhuntar Observatory and glacier (star) indicated in the box. The lower right inset is a map of Chhota Shigri glacier with the location of the AWS (red diamond). The map coordinates are in the UTM 43 (north) World Geodetic System 1984 (WGS84) reference system.
3. Data and Climatic Settings
3.1. Mass-balance data
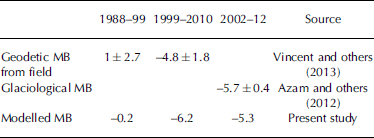
Jawaharlal Nehru University, India, and the Institut de Recherche pour le Déeloppement (IRD), France, have been collaborating closely on Chhota Shigri glacier since 2002, with annual glacier-wide MB measurements being conducted by the direct glaciological method at the end of September or the beginning of October. Details of direct MB measurements are provided by Reference WagnonWagnon and others (2007) and Reference AzamAzam and others (2012). Between 2002 and 2012, the glacier lost mass at a rate of 0.57±0.40mw.e.a-1 . Its volume change was also measured between 1988 and 2010 using in situ geodetic measurements. Topographic measurements conducted in 1988 (Reference DobhalDobhal, 1992) were resurveyed in October 2010 using carrier-phase GPS to determine the thickness variations of the glacier over 22 years. These thickness variations were converted to cumulative MB between 1988 and 2010 (-3.8±2.0 m w.e., corresponding to -0.17 ± 0.09 m w.e. a–1) (Reference VincentVincent and others, 2013). Using satellite digital elevation model differencing and field measurements, a negative MB between 1999 and 2010 (-4.8 ± 1.8 m w.e., corresponding to -0.44 ± 0.16 m w.e. a–1) was observed. Thus, a slightly positive or near-zero MB between 1988 and 1999 (+1.0±2.7 m w.e., corresponding to +0.09 ± 0.24 m w.e. a–1) was deduced.
3.2. Meteorological data
At Chhota Shigri glacier, in situ meteorological data since 18 August 2009 are available from an automatic weather station (AWS) located on a lateral moraine at 4863 ma.s.l. (lower right inset in Fig. 1). The nearest long-term meteorological record comes from Bhuntar Observatory, Kullu Airport (31.50N, 77.9° E; 1092 ma.s.l.). This observatory is located - 5 0 km southwest of Chhota Shigri glacier and belongs to the Indian Meteorological Department (IMD). The daily maximum and minimum temperature and precipitation data are available from January 1969 to October 2012.
3.2.1. Air temperature
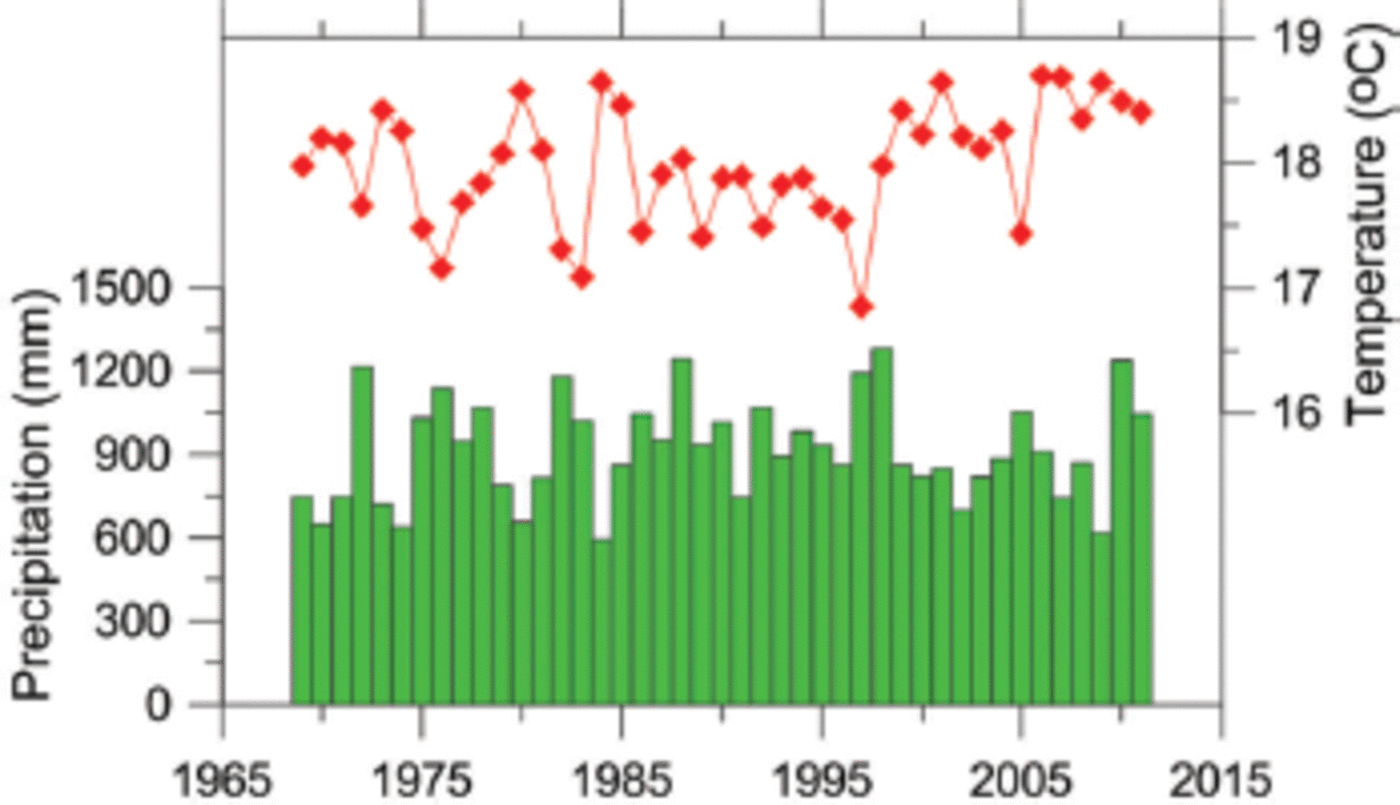
Air temperatures (minimum and maximum) are recorded daily by traditional maximum–minimum thermometers at Bhuntar Observatory. Daily mean temperature is calculated as a mean of daily maximum and minimum temperatures. This averaged temperature may differ slightly from a daily temperature derived from continuous measurements recorded at hourly or infra-hourly timescale, but since this mean temperature is used to assess degree-day factors (see Section 4.2.2), this difference does not impact MB results. The temperature series from Bhuntar Observatory has some data gaps, usually of some days to a couple of months. Out of 16 010 days, a total of 1182 days are missing (7.3% data gaps). Short gaps of 1 or 2 days were filled by a linear interpolation method between data from the days immediately preceding and following the missing day. In the case of longer gaps (more than 2 days) a correlation is calculated between daily mean temperatures from Bhuntar Observatory and daily reanalysis temperatures from the US National Centers for Environmental Prediction/US National Center for Atmospheric Research (NCEP/NCAR) (Reference KalnayKalnay and others, 1996). Given that the correlation is influenced by temperature seasonality, both temperature series were de-seasoned using a multiplicative decomposition model to remove the seasonality of the data. To achieve this task, before performing any correlation, any daily temperature value was divided by a mean daily index of the corresponding day. This index was computed (1) by dividing the daily temperature value by the 365 day moving average of the same date and (2) by averaging all resulting day-of-year index values over the whole study period (e.g. averaging all values for 1 January over the 4 3 years to compute the mean index of 1 January). The NCEP/NCAR reanalysis data for temperature are available since 1948 for the gridpoint 32.5 N, 77.5 E (nearest gridpoint to Bhuntar Observatory) at 925 hPa. The correlation coefficient is fairly low (r = 0.49) and a t-test is done for the slope coefficient of the regression. The t-test suggests that the relationship is statistically significant at a confidence level of 95%. The correlation is used to fill the gaps in the Bhuntar temperature series and the seasonality was then added back to yield a continuous temperature series. Figure 2 shows the mean annual temperature since 1969.
Annual mean temperature (red squares) and annual precipitation sums (green bars) recorded at Bhuntar Observatory from January 1969 to October 2012.
3.2.2. Precipitation
The daily precipitation record since 1969 is available from Bhuntar Observatory. At this observatory the precipitation measurements were collected by tipping-bucket rain gauges. The gaps (352 daily data are missing over 16 010 days; 2 . 1% data gaps) are filled using the average value of the daily amount of rain on the same dates in the other years. Figure 2 shows the annual precipitation sums at Bhuntar Observatory since 1969.
3.3. Climatic setting
The Western Himalaya are characterized by, from west to east, the decreasing influence of the mid-latitude westerlies and the increasing influence of the Indian summer monsoon (Reference Bookhagen and BurbankBookhagen and Burbank, 2010), leading to distinct accumulation regimes on glaciers depending on their location. Over the whole Himalayan range, summer precipitation (May to October) is predominantly of monsoonal origin, whereas in winter (November to April) precipitation accompanies mid-latitude westerlies (Reference Wulf, Bookhagen and ScherlerWulf and others, 2010). Mean monthly precipitations with monthly standard deviation at Bhuntar Observatory are shown in Figure 3. The Indian summer monsoon (May to October) accounts for 5 1% of the average annual rainfall (916mm a–1) over 1969–2012, while mid-latitude westerlies (November to April) contribute 49%. Almost equal precipitations from Indian summer monsoon and mid-latitude westerlies, recorded since 1969 at Bhuntar Observatory, suggest that Chhota Shigri glacier is a good representative of a transition zone that is alternatively influenced by the Indian summer monsoon and winter mid-latitude westerlies.
Mean monthly precipitations between 1969 and 2012 at Bhuntar Observatory. Summer precipitation (red bars) predominantly derives from the Indian summer monsoon, whereas winter precipitation (blue bars) predominantly derives from mid-latitude westerlies. The error bars represent the standard deviation (±1) of the monthly precipitation mean.

4. Methods
4.1. Model description
The annual glacier-wide MB is computed using the temperature-index model (e.g. Reference HockHock, 2003) together with an accumulation model. The temperature-index model relates the amount of melt/ablation with positive air temperature sums (cumulated positive degree-days, CPDD) with a proportionality factor called the degree-day factor (DDF).
The ablation M is computed by
where DDF denotes the degree-day factor (mmd–1C1), different for ice, snow and debris-cover surfaces, T is the extrapolated daily mean temperature (°C) at glacier altitudes and TM is the threshold temperature (°C) for melt.
The accumulation A is computed by
where Pand Tare extrapolated daily precipitation (mm) and temperature (°C) at glacier altitudes respectively and TP is the threshold temperature (°C) for snow-rain.
Computations of the DDFs were performed at various altitudes using ablation stakes distributed over the glacier (see Section 4.2.2). Temperature and precipitation at daily resolution are the required input data for the model. The MB is calculated at every altitudinal range of 50 m using temperature and precipitation from Bhuntar Observatory since 1969 extrapolated at the mean altitude (e.g. for the 4400–4450 m band, 4425 ma.s.l.). The model starts on 1 October of a year and calculates both accumulation and ablation for each altitudinal range at a daily time-step for a full hydrological year (until 30 September the following year), taking into account the surface state (snow, bare ice or debris) and using the corresponding DDF. There was no option but to assume that the initial conditions (surface state, snow depth as a function of elevation) of 1 October 1969 were similar to those observed on 1 October 2002 in the field, but this assumption only impacted the MB results of the first year of reconstruction. The sum of accumulation and ablation gives the specific MB. Daily melt of snow-, ice- and debris-covered glacier was calculated when the air temperature was above the threshold melt temperature. Liquid precipitation is assumed not to contribute to glacier mass gain. Refreezing of meltwater or rainfall is discounted as it is negligible for temperate glaciers (Reference Braithwaite and ZhangBraithwaite and Zhang, 2000). Given that the area loss for Chhota Shigri glacier between 1980 and 2010 is only 0.47% of its area in 1980 (Reference Pandey and VenkataramanPandey and Venkataraman, 2013) and mass wastage between 1988 and 2010 is mainly limited to the last decade (Reference VincentVincent and others, 2013), the glacier hypsometry (surface the whole modelling period and equal to the 2004/05 hypsometry given by Reference WagnonWagnon and others (2007).
4.2. Parameter analysis
Table 1 lists all the parameters used in the model. To achieve one of the main objectives of this study, i.e. to assess the temporal variability of the glacier MB since 1969, it was decided to use a simple and robust model with as few calibration parameters as possible. In order not to multiply parameters, this model includes neither a radiation component nor a grid-based approach which could be used to assess the spatial variability of the MB but is less relevant for studying its temporal variability. Moreover, as far as possible, the model parameters are derived from available in situ measurements (temperature gradients as a function of elevation and DDFs for snow-, ice- and debris-covered surfaces). Threshold temperatures for melt and snow-rain limit have been chosen from the literature. Indeed, those temperatures are related to DDFs or temperature and precipitation altitudinal gradients through Eqns (1) and (2), so selecting different values for these temperatures would have resulted in different values of DDFs or temperature and precipitation gradients but would not have significantly changed MB results. The only adjusted parameter, because of a lack of data, was the altitudinal precipitation gradient.
List of the model parameters used for MB reconstruction

4.2.1. Temperature lapse rate (LR)
Daily LRs were calculated using daily mean temperatures from Bhuntar Observatory (1092 m a.s.l) and the glacier-side AWS (4863 ma.s.l.) for the overlapping period between 18 August 2009 and 31 October 2012. Although Bhuntar Observatory is far away (-50 km) from the glacier, air temperature is relatively well correlated over large distances Fig. 3. (Reference Begert, Schlegel and KirchhoferBegert and others, 2005) and can therefore be extrapolated with confidence. There is a pronounced seasonal cycle in LRs, with the highest mean monthly LR (7.03°Ckm–1) in March during winter and the lowest (5.52°C km–1) in August during summer. The low LRs over the summer months are probably due to the strong monsoonal convectional activity producing an efficient mixing of the lower atmosphere.
Temperature-index models generally use a single constant value of LR for the whole modelling period (e.g. Johannesson and others, 1995; Reference VincentVincent, 2002). In the present study, daily LRs were calculated for a full year to capture the annual temporal variability. A mean daily LR for every day of the year over the three hydrological years (1 October 2009 to 30 September 2012) was first calculated to remove the interannual variability and then fitted by an order-10 polynomial function (Fig. 4). This function was used to calculate the LR for every day of the year over the whole year. The daily air temperatures on the glacier surface at each altitude range are computed from Bhuntar Observatory temperatures using these LRs. The average LR is calculated as 6.4°Ckm–1.
Polynomial fit (black line) for the day-of-year average values of LRs (orange circles). Day-of-year 1 corresponds to 1 October. Every dot stands for a daily value of LR for each day of the year, averaged over three hydrological years (1 October 2009 to 30 September 2012). Also shown is the correlation coefficient R 2 between LR daily values and the corresponding polynomial fit (95% confidence level).

4.2.2. Degree-day factors
On Chhota Shigri glacier, the DDFs for the ice-, snow- and debris-covered parts were obtained by linear regression between point ablation measurements performed during the summers of 2009, 2011 and 2012 (June to October) between 4300 and 4900ma.s.l. and the corresponding CPDD. The ablation was measured for different time periods, from a few days to a couple of weeks, at several stakes. These periods are sometimes short because they have been carefully selected to exclude significant snowfall events on the glacier (no observation of snowfalls at the permanent base camp (~3900 m a.s.l.) and no significant fresh snow reported at stake locations during measurements). For each ablation stake, the CPDD is computed from Bhuntar Observatory (1092 m a.s.l.) applying the daily calculated LRs between this observatory and the AWS (4863 m a.s.l.) close to the glacier. Around 500 measurements have been performed at most of the available stakes. Ablation and CPDD have always been compared over the same time period. Given the overall uncertainty of 150 mm w.e. in stake ablation measurements obtained from a variance analysis including all types of errors (ice/snow density, stake height determination, liquid-water content of the snow and snow height) (Reference Thibert, Blanc, Vincent and EckertThibert and others, 2008), all the measurements having ablation lower than 150 mm w.e. were discarded for DDF calculations of ice and debris. Given the limited number of measurements over snow surfaces (the glacier is inaccessible during winter), this threshold has been decreased to 100 mm w.e. to keep the number of measurements large enough for regression analysis. A total of 192 ablation measurements (13, 157 and 22 for snow, ice and debris respectively) were available for the analysis. Figure 5 provides the linear regression curves for snow, ice and debris, and the corresponding slopes are the respective DDFs. The y-intercept has been systematically forced to zero assuming the threshold temperature for ablation is always 0°C.
Measured ablation for debris (black squares), ice (blue dots) and snow (red stars) surfaces as a function of CPDD. In total, 192 measurements performed between June and October in 2009, 2011 and 2012 were selected for analysis. Also shown are the respective correlation coefficients R 2 (95% confidence level).over snow surfaces due to albedo difference. Below 4400 m a.s.l., the glacier is debris-covered, which efficiently protects the ice against melting, explaining why its DDF is lower than the others.
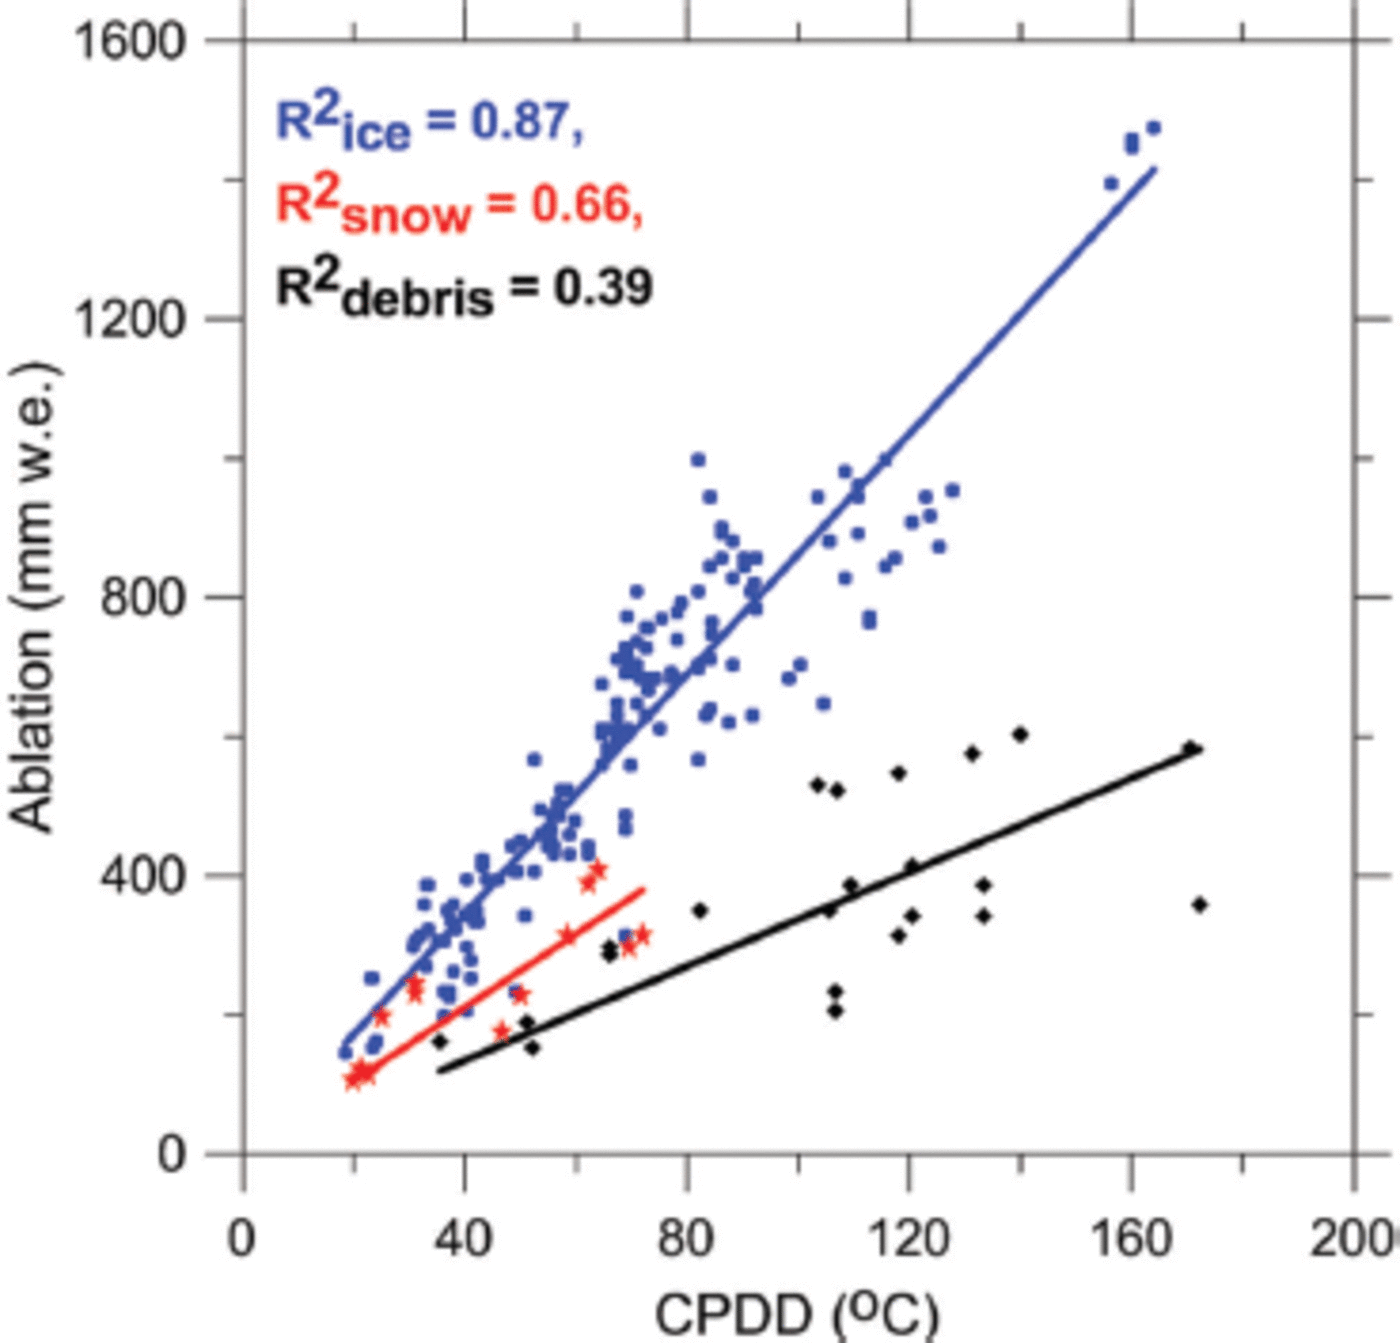
Figure 5 shows a linear increase in ablation as a function of CPDD except for debris-cover surfaces where dispersion is large. Over the debris-cover part, ablation strongly depends on the thickness of the debris, which is very variable in space, in turn, on the stake location which may change from one year to the next when new stakes are installed. The DDFs for debris-cover, snow and ice surfaces, with their respective uncertainties calculated following Reference TaylorTaylor (1997, p. 188), were calculated as 3.34±0.20, 5.28±0.14 and 8.63 ±0.18 mmd-1°C-1 respectively. The DDF for snow is 61% that of ice, a significantly lower value, as expected given that melting is more efficient over ice surfaces than
4.2.3. Precipitation gradient
The distribution of precipitation on the glacier is more complicated to handle than air temperature since precipitation amounts in mountainous regions are spatially nonuniform and have a strong vertical dependence (e.g. Reference Immerzeel, Pellicciotti and ShresthaImmerzeel and others, 2012). Sites only a few kilometres away may receive significantly different amounts of rain or snow. Furthermore, limited information is available about precipitation amounts and gradients over the Western Himalaya at glacier altitudes. Therefore, point MB measurements performed at 5550ma.s.l. on Chhota Shigri glacier seem to be the best available option to quantify the lower limit of the total annual accumulation and to try to derive the precipitation gradient between Bhuntar Observatory and the glacier. Only the lower limit of annual accumulation is assessed because part of the total annual accumulated snow at 5550 m a.s.l. may have been removed by melting, sublimation or wind erosion. Temperature at 5550 m a.s.l. remains below the freezing point, suggesting that melting is insignificant. In addition, the measurement site is flat, and thus not subjected to over-accumulation due to avalanches. The correlation coefficient R2 between point MB at 5550 m a.s.l. and precipitation at Bhuntar Observatory over nine years between 2002 and 2012 at annual timescale is equal to 0.57. The resulting precipitation gradient is positive with altitude at a rate of 0.10 ± 0.03 m km–1, in agreement with the gradient of-0.12 m km–1 reported by Reference Wulf, Bookhagen and ScherlerWulf and others (2010) in Baspa valley (-100km southeast of Chhota Shigri glacier). Considering that this gradient has been derived using the lower limit of total annual accumulation at glacier elevation, it is probably underestimated here. Moreover, this gradient is known to be spatially highly variable (e.g. Reference Immerzeel, Pellicciotti and ShresthaImmerzeel and others, 2012). A calibration of this parameter is performed below to assess it better (see Section 4.3).
Assuming that precipitation linearly increases with altitude, the precipitation gradient has been applied over the whole glacier to compute precipitation at every altitudinal range from Bhuntar Observatory precipitation. Precipitation on the glacier is assumed to fall in the form of snow if the temperature at the corresponding altitude is below a specified threshold (typically 1°C) (e.g. Johannesson and others, 1995; Reference LejeuneLejeune and others, 2007).
4.3. Model calibration
In Section 4.2, model parameters (temperature LRs, DDFs and precipitation gradient) have been obtained from field measurements. Threshold temperatures (TPand TM) have also been assigned as commonly used values. Among these parameters, DDF for debris-covered surfaces comes from a weak correlation (R2 = 0.39), and precipitation gradient is not known with accuracy due to the large spatial variability of these variables and the paucity of field data. A calibration, therefore, is sought for better assessment of these parameters. As the lower part of Chhota Shigri glacier is debris-covered (only 3.4% of its total area), melting from this area is insignificant compared to the whole glacier, suggesting that DDF for debris-covered area is not a sensitive parameter. Consequently, only the precipitation gradient has been adjusted to match the modelled net MB with the observed MB data. The MB has been calculated step-by-step starting from the original measured underestimated precipitation gradient (0.10 m km–1; see Section 4.2.3) and implementing it at each step with an additional 0.01 m km–1 until the best agreement between modelled and observed MBs was achieved. Annual point MB measurements between 2002 and 2012 and decadal geodetic MB observations over the 1988-2010 period (i.e. 1988-99 and 1999-2010) have been used simultaneously for calibration. The model is tuned to minimize at the same time (1) the resulting root-mean-square errors (RMSE) between modelled and measured annual point MBs (averaged every 50 m altitudinal range) from 2002 to 2012 and (2) the difference between modelled MB and geodetic mass changes at decadal scale. The modelled annual glacier-wide annual MBs were cumulated over the periods when decadal geodetic MBs (Reference VincentVincent and others, 2013) were available in order to make a comparison. The annual changing surface is not accounted for in this study, and all cumulative MBs are related to the 2004/05 surface area.
5. Results
5.1. MB as a function of altitude
Figure 6 compares the modelled annual altitudinal gradient of MB (at each altitudinal range of 50 m from 4400 to 5400 m a.s.l.) with the observed gradient for each hydrological year between 2002 and 2012. Modelled and observed gradients show a good agreement, with an RMSE of 0.84mw.e.a-1 for 10 hydrological years between 2002 and 2012. The agreement is best in 2009/10, with an RMSE of 0.42mw.e.a–1, and worst in 2008/09, with an RMSE of 1.66 m w.e. a–1. The other eight years show RMSEs ranging between 0.49 and 0.95 m w.e.a–1. The largest differences come from the ablation zone, below 4800 m a.s.l. (~22% of the glacier area) where for some years (2002-08) modelled ablation is underestimated.
Comparison of reconstructed annual (red dots) with observed annual MBs (black triangles) as a function of elevation for 10 hydrological years 2002–12. RMSE (mw.e. a–1) for each year is also given.

In fact, in the ablation area during summer, predominantly ice is exposed at the surface, hence the DDF for ice has probably been underestimated between 2002 and 2008 since it has been computed by regression analysis using data collected during the summers of 2009, 2011 and 2012 (Section 4.2.3). The corresponding hydrological years 2008/09, 2010/11 and 2011/12 had respective glacier-wide MBs of 0.13, 0.11 and -0.45 ± 0.40 m w.e. a–1, which were above average compared to the prior years. In temperature-index models, DDFs are integrated factors taking into account all kinds of effects responsible for glacier melt. In the present study, the DDF for ice has perhaps been underestimated because some effects likely to enhance melting, such as longwave radiation emitted by the steep valley walls surrounding the glacier tongue below 4700 m a.s.l. (Reference WagnonWagnon and others, 2007) or progressive dust deposition at the glacier surface that might reduce the surface albedo (Reference Oerlemans, Giesen and Van den BroekeOerlemans and others, 2009), have been minimized. Indeed, during positive MB years, glacier surroundings may remain covered by snow for longer even in summer, limiting longwave emission, and the dust deposition effect can be decreased when there are more frequent snowfalls than during negative MB years.
In 2008/09, the opposite is true, melting being sharply overestimated at every elevation by the model (Fig. 6g). The mismatch between modelled MBs as a function of elevation and observations is likely to be due to the large albedo spatiotemporal variability that sometimes occurs in the field. Reference Brock, Willis, Sharp and ArnoldBrock and others (2000) found that the albedo variations exert a significant control on the surface melt rate, and summer snowfall events are particularly important to the summer energy balance. During the 10 years of observations on Chhota Shigri glacier, local observers reported some heavy summer snowfalls usually in September (September 2005; 3–14 September 2009; 13–23 September 2010) and even in August (13 August 2011). These summer snowfall events sometimes deposit as much as 1m of snow in a few days at the glacier snout. Consequently, melting is abruptly reduced or even stopped at the glacier surface for several weeks or even for the rest of the ablation season which usually ends around mid-October in years without such strong summer snowfalls. Such major and abrupt changes are probably difficult to simulate using the model, hence the mismatches between simulation and observation in some years. Moreover, during these events which are probably triggered by the orographic effect (Reference Bookhagen and BurbankBookhagen and Burbank, 2010), precipitation amounts measured at Bhuntar Observatory are not always representative of those occurring on the glacier. This may have been the case in 2008/09. Nevertheless, additional measurements (e.g. systematic comparisons between precipitation at Bhuntar and at the glacier elevation) are still required to explain in detail these discrepancies between modelled and observed MBs.
5.2. Annual mass balance
5.2.1. Cumulative mass balance since 1969
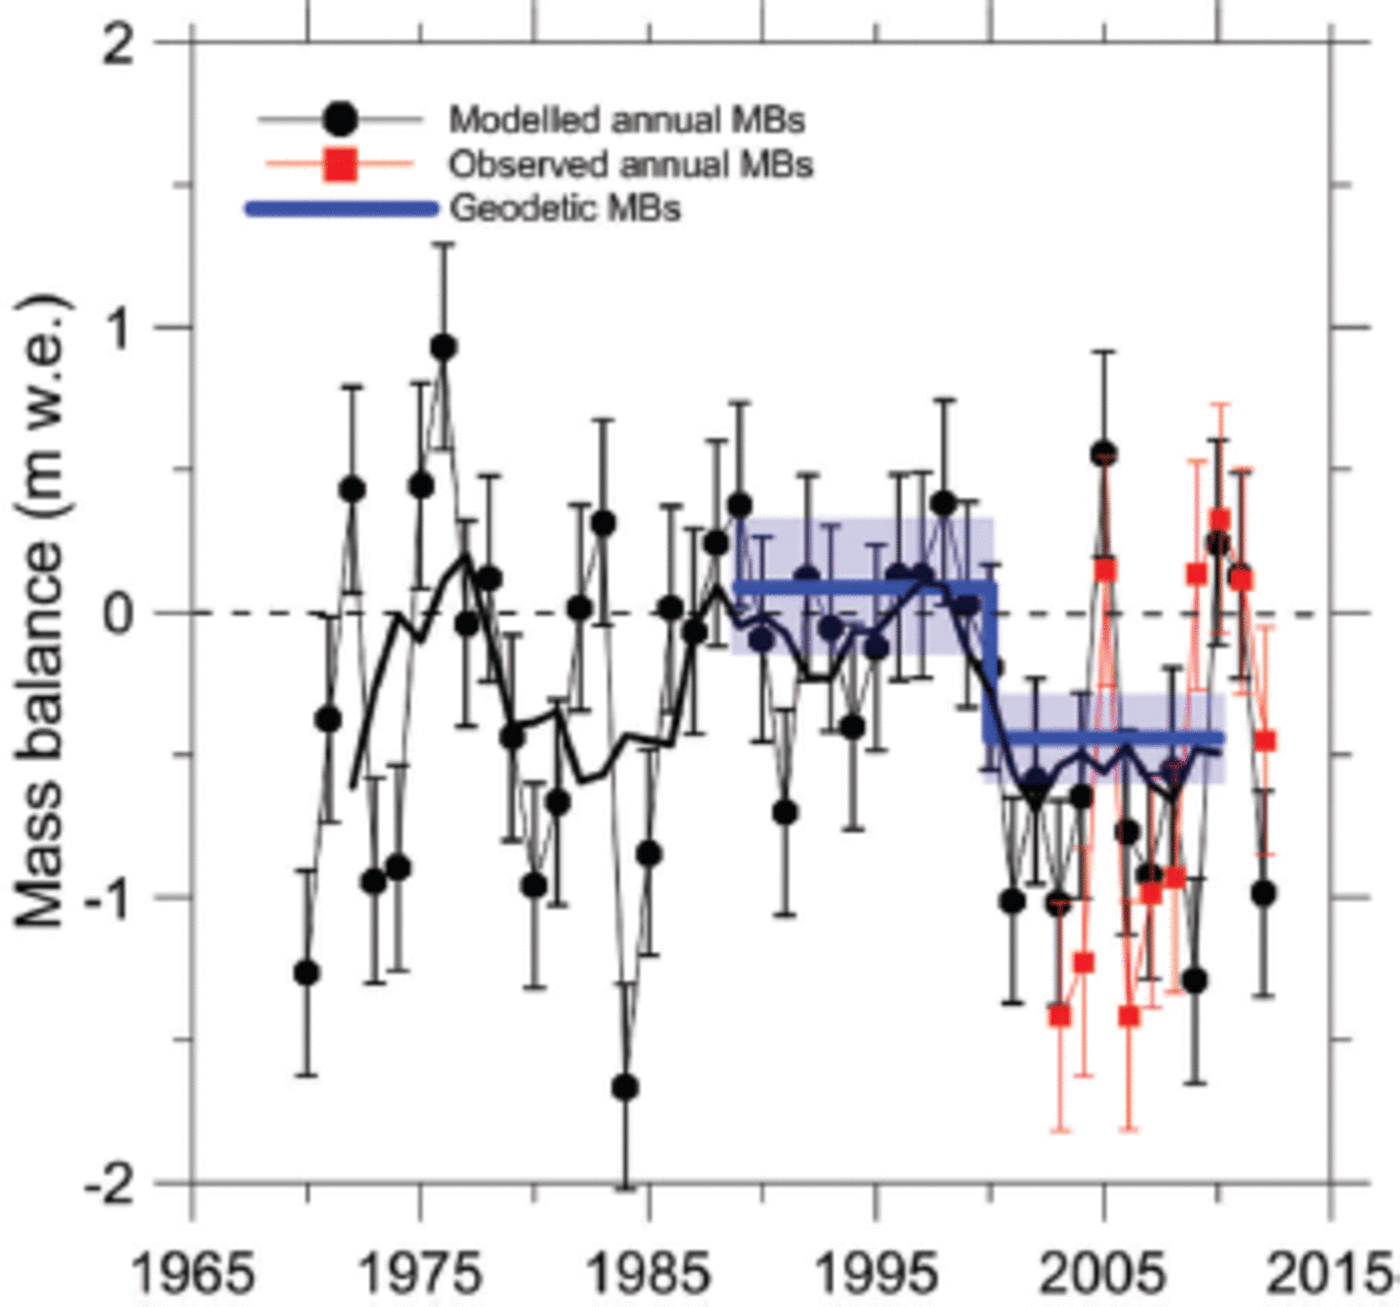
The 1969–2012 glacier-wide modelled MBs are displayed in Figure 7 together with observed 2002–12 annual glacier-wide MBs and 1988–2010 geodetic decadal MBs. Over the whole modelling period the specific annual MB is negative 60% of the time and positive the rest of the time. The cumulative specific MB is found to be –12.89 m w.e. (–0.30mw.e.a–1) between 1969 and 2012, which is a moderate mass loss over these 43 years. The hydrological year 1975/76 shows the maximum MB, 0.93 m w.e., whereas 1983/84 shows the most negative MB, –1.66mw.e.
Comparison of modelled annual glacier-wide MBs (black points) with observed annual glacier-wide MBs (red squares) and decadal geodetic MBs (blue thick lines). The corresponding uncertainties in modelled, observed and geodetic MBs are also shown. Black thick line shows the 5 year running mean value since 1969.
5.2.2. Error analysis
To assess the uncertainties in annual MBs, each sensitive parameter (precipitation gradient and DDFs for ice and snow) has been successively moved step by step from its initial value, the other parameters remaining unchanged, and the resulting cumulative MBs have been compared to observed geodetic MBs at decadal scale (1988-99 and 1999-2010). Every parameter has been modified to allow the maximal variations of the resulting cumulative MBs within the limits prescribed by the uncertainty bounds of the observed geodetic MBs, i.e. ±2.7 and ±1.8 m w.e. for 1988-99 and 1999-2010 respectively (Table 2; Fig. 7). Consequently, each parameter, as modified, provides two new 43 year series of annual MBs, one toward negative values and one toward positive values. The resulting uncertainty in annual MBs is taken as the highest standard deviation calculated between these new series and the initial MB series and is as high as ±0.36 m w.e. a–1.
Comparison of cumulative MBs (mw.e.)
In this study, given that the area loss is small as discussed in Section 4.1, we have not considered the area change of Chhota Shigri glacier over the study period, and MB changes are related to 2004/05 glacier area and hypsometry (Reference WagnonWagnon and others, 2007). However, this assumption induces MB errors due to temperature changes resulting from surface elevation changes that are not taken into account. Indeed, between 1969 and 2005 the calculated cumulative MB is as high as -8.74 m w.e., corresponding to ~9.7 m surface linear glacier-wide lowering between 1969 and 2005 (we assume no lowering at the highest point of the glacier, a maximum lowering at its snout and a linear lowering between these two points, leading to a glacier-wide MB of -8.74 m w.e.). Given a mean annual temperature lapse rate of 6.4°Ckm–1 as obtained in Section 4.2.1, we can recalculate the MB for each year of this period, and the resulting error accounts for -0.06 m w.e. a–1 between 1969 and 2005. The same error analysis was performed between 2005 and 2012, where the cumulative MB is equal to -4.15 mw.e. (i.e. a rough estimate of 4.6 m surface glacier-wide lowering) and the MB error is +0.03 m w.e. a–1. Combining both periods, a MB error of -0.03 m w.e. a–1 is calculated between 1969 and 2012, still low compared with the uncertainties associated with the modelling, i.e. ±0.36m w.e. a–1.
Table 2 compares the modelled cumulated MB with the observed MB for the respective periods where the observed MBs are available. As expected (because these data served to calibrate the model), modelled MBs are in good agreement with geodetic decadal MBs since 1988 and cumulative glaciological MB since 2002.
5.3. Seasonal mass balance
Although mean specific MB is of broad interest and has been determined in numerous glacier-monitoring programmes (e.g. Reference Dyurgerov and MeierDyurgerov and Meier, 2005), it does not provide insights into climate-glacier interaction. Seasonal MB offers the best insights to assess the effects of climatic drivers on glaciers (e.g. Reference OhmuraOhmura, 2006). Every year the beginning and end of the season were demarcated as the day when the MB was at its annual maximum (end of winter) or minimum (end of summer) to retrieve the winter and summer MBs from diurnal MB series. The model suggests that the average summer ablation period lasts from mid-June to the end of September, 96 ± 18 days. The computed summer, winter and annual MBs are shown in Figure 8. Modelled seasonal MBs show large annual variability, with values from -2.31 to -0.33 m w.e. a–1 for summer MBs and 0.31 to 2.16 m w.e. a–1 for winter MBs. Over the whole simulation period the resulting annual MBs vary from -1.66 to 0.93 m w.e. a–1. An error analysis for seasonal MBs similar to that conducted for annual MBs (Section 5.2.2) has been performed, leading to an error range of ±0.35 m w.e. a–1 in summer and winter MBs. The mean values for annual, summer and winter MBs for the 43 year period are -0.30 ±0.36, -1.38 ±0.35 and 1.08 ± 0.35 m w.e. a–1 respectively.
Annual and seasonal MB series of Chhota Shigri glacier, 1969–2012. Black, green and red dots represent the annual, winter and summer MBs with their corresponding error bars respectively. The thick lines are the 5 day running means. The horizontal dotted line represents the zero MB.

6. Discussion
6.1. Mass-balance pattern and climatic drivers
Over the whole simulation period (1969-2012), the cumulative MB of Chhota Shigri glacier was -12.89 mw.e., corresponding to a moderate mass loss rate of-0.30 ±0.36 m w.e. a–1. Three distinct periods (of 12-16 years) of this MB series were distinguished according to the glacier mass gain or loss (Fig. 9). Student’s t-tests, at 95% confidence level, have been performed to check whether periods I, II and III were statistically different from each other. The p-values (probability values) for periods I and II and periods II and III are respectively 0.01 and 0.03, suggesting that period II statistically differs from the other periods, while the p-value for periods I and III is 0.27, suggesting that the two periods are roughly similar. During periods I (1969-85) and III (2001-12), Chhota Shigri glacier lost mass at MB rates of -0.36 ±0.36 and -0.57 ±0.36 m w.e. a–1 respectively, whereas during period II (1986-2000) it remained close to steady-state conditions, with a mean annual glacier-wide MB of -0.01 ± 0.36 m w.e. a–1. The steady-state conditions over the 1990s were qualitatively inferred by Reference AzamAzam and others (2012) using a dynamical approach and quantified by Reference VincentVincent and others (2013) using geodetic in situ measurements between 1988 and 2010. In this context, the present study enables determination of the exact time of glacier shifting from balance to imbalance conditions that Reference VincentVincent and others (2013) could not achieve.
Mean winter, summer and annual MBs for all three periods since 1969 (black thick lines). Red thick line represents the summer mean temperatures (°C), while green line represents the annual winter precipitation sums (mm) at Bhuntar Observatory. The continuous thin red and green lines represent the average summer temperatures (°C) and winter precipitation sums (mm) between 1969 and 2012 respectively. The black dotted line represents zero MB.
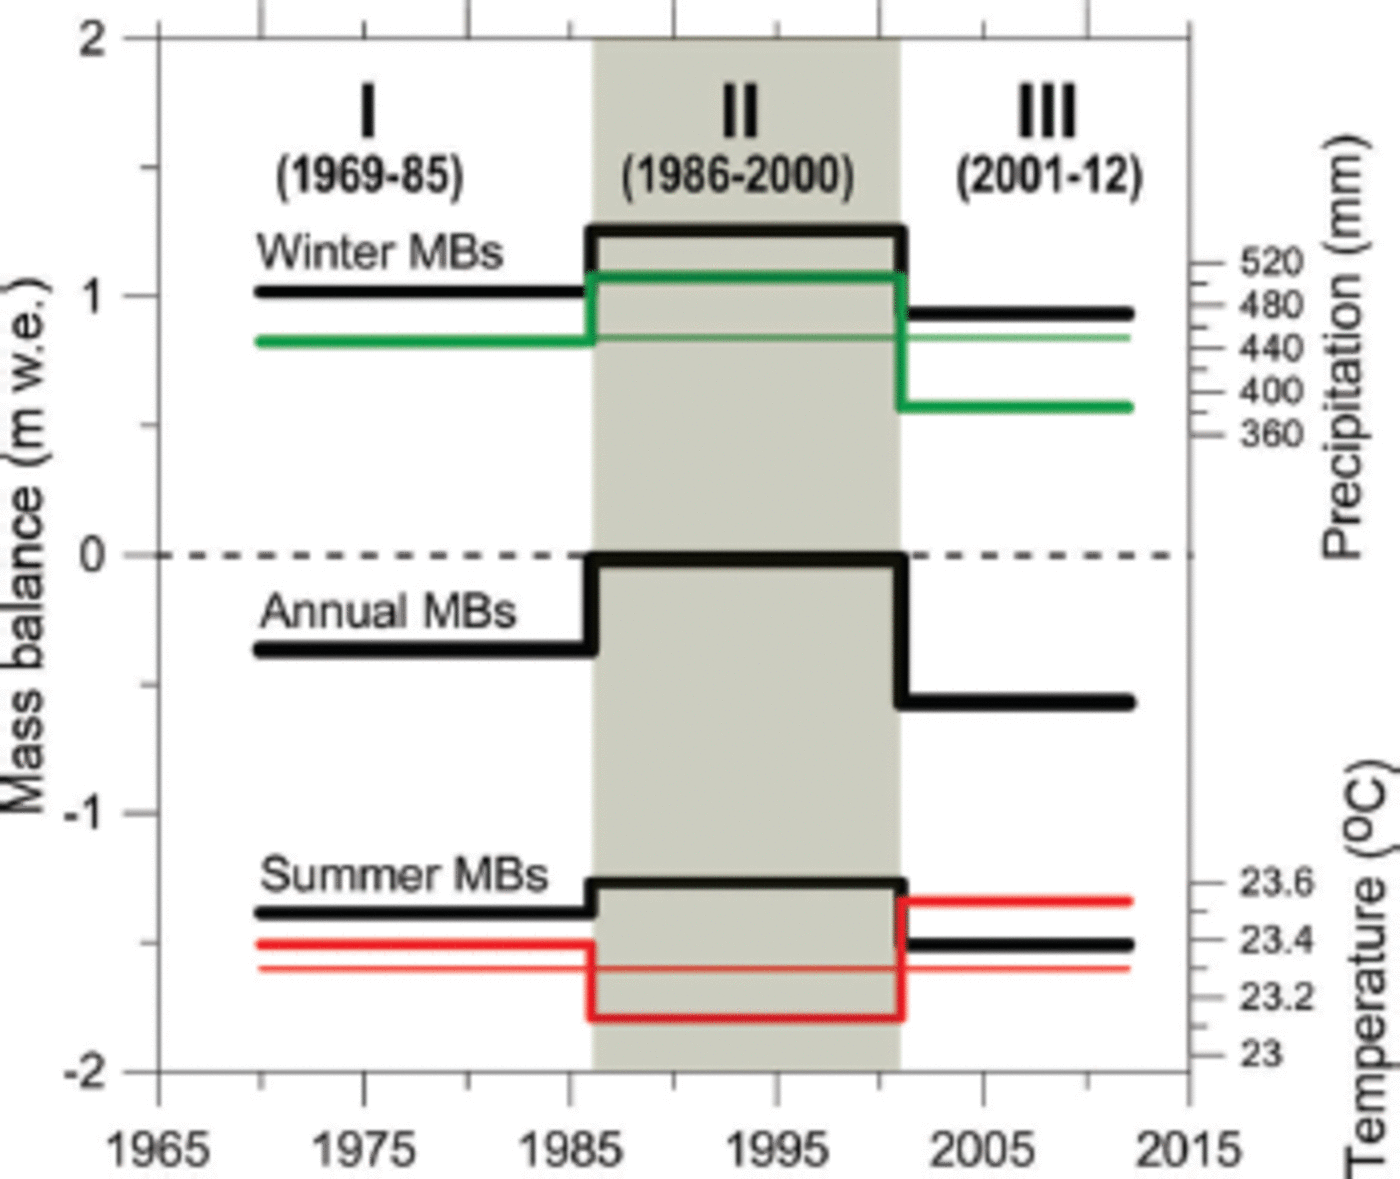
For each period, the mean winter, summer and annual MBs are shown in Figure 9 and Table 3, providing their respective values over the three periods and over a full 43 year period. In order to assess the climatic drivers, the average winter precipitations and summer temperatures at Bhuntar Observatory are also plotted in Figure 9 and reported in Table 3. Period I exhibits the largest interannual variability of the MB of the 43 year reconstructed period, with the most positive (1975/76) and negative (1983/84) hydrological years (Fig. 8). This period also shows high mean summer MB which is partially compensated by winter MB, providing moderate mass loss. Period II is characterized by 56 mm a–1 higher precipitation and 0.2°C lower summer mean temperature than 1969-2012 averages, resulting in roughly equal winter MB and summer MB, leading to steady-state conditions (Table 3). Conditions for period III are diametrically opposite to those of period II, with 65 mm a–1 lower precipitation and 0.2°C higher mean summer temperatures than 1969-2012 averages, resulting in an accelerated mass loss due to reduced winter MB and enhanced summer MB. This comparison between the three periods suggests that winter precipitation and summer temperature are equally important drivers controlling the MB pattern of Chhota Shigri glacier at decadal scale.
Mean annual, summer and winter MBs for periods I, II and III and for the whole 4 3 year period, with their corresponding mean summer temperatures and winter precipitations at Bhuntar

6.2. Comparison with other studies
This 43 year annual MB series, the longest ever reconstructed in the Himalaya, provides the opportunity to make a comparison with other studies. In agreement with our results showing a moderate mass loss over the last four decades, Reference Pandey and VenkataramanPandey and Venkataraman (2013) also reported moderate glacierized area shrinkage for the Chandra-Bhaga basin and a minor area loss (0.47%) for Chhota Shigri glacier between 1980 and 2010. Balance conditions of Chhota Shigri glacier between 1986 and 2000 deviate from the most recent compilation for the entire Himalaya-Karakoram region (Reference BolchBolch and others, 2012). Reference BolchBolch and others (2012) reported ice wastage for this region over the past five decades, with an increased rate of loss roughly after 1995 but with a high spatio-temporal variability. We would stress, as previously stated by Reference VincentVincent and others (2013), that Himalaya-Karakoram MB averages between 1986 and 2000 should be regarded with caution, given the scarcity of MB data (Reference BolchBolch and others, 2012) and the result of this study testifying that Chhota Shigri glacier experienced a balanced mass budget between 1986 and 2000. Since 2000 an increased rate of mass loss is observed, in agreement with Reference BolchBolch and others (2012), with a MB rate of -0.57 ± 0.36 m w.e. a–1, representing 55% of the total mass loss of the last 43 years. This accelerated rate of MB is in agreement with a mass wastage of-0.45 ± 0.13 m w.e. a–1 or -0.39±0.18mw.e.a-1 over 1999-2011, for the Lahaul and Spiti region or Chhota Shigri glacier respectively, calculated by Reference Gardelle, Berthier, Arnaud and KääbGardelle and others (2013).
6.3. MB sensitivity to temperature and precipitation
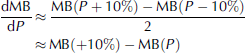
Glacier-wide MB is a key variable widely used as a climate proxy in many environmental and climate change studies (e.g. Reference SolomonSolomon and others, 2007). Temperature-index models are used worldwide to assess the modelled MB sensitivity to climate (e.g. Reference De Woul and HockDe Woul and Hock, 2005; Reference Braithwaite and RaperBraithwaite and Raper, 2007; Reference Shea, Moore and StahlShea and others, 2009; Reference AndersonAnderson and others, 2010; Reference Wu, Li and WangWu and others, 2011) and estimate the future contribution of glaciers to sea-level rise (e.g. Reference Raper and BraithwaiteRaper and Braithwaite, 2006; Reference Radić and HockRadić and Hock, 2011; Reference GardnerGardner and others, 2013). The sensitivity of a glacier MB to climate is usually assessed by rerunning the models with a uniform change in a specific variable, i.e. air temperature or precipitation throughout the year (e.g. Reference OerlemansOerlemans and others, 1998; Reference Braithwaite and ZhangBraithwaite and Zhang, 2000), while the other variables and model parameters are kept unchanged. These sensitivity tests were performed for Chhota Shigri glacier, calculating the annual glacier-wide MB averaged over the period 1969-2012 firstly assuming a 1°C change in air temperature and secondly a 10% change in precipitation. The MB sensitivity to temperature (dMB/dT ) and precipitation (dMB/dP) are calculated following Reference OerlemansOerlemans and others (1998) as
The sensitivity of the modelled glacier-wide MB to temperature is ~0.52 m w.e. a–1 °C–1 which corresponds to the highest sensitivity recently reported by Reference RasmussenRasmussen (2013) who investigated the meteorological controls on glacier MB in High Asia using NCEP/NCAR reanalysis data since 1948. It is also in agreement with the sensitivity of Zhadang glacier, Tibet (-0.47 m w.e. a–1 °C–1), calculated by Molg and others (2012) using an energy-balance model. The Chhota Shigri modelled MB sensitivity to temperature decreases with elevation from -1.21 m w.e.a–1 °C–1 at 4400ma.s.l. to -0.05 m w.e. a–1 °C–1 at 6000ma.s.l. (Fig. 10). It is consistent with the fact that ablation is mainly controlled by air temperature; in turn, in the lower part of the glacier where ablation is predominant, sensitivity of modelled MB to temperature is enhanced. Over the debris-covered part (<4400ma.s.l.) of the glacier, the sensitivity (-0.52 m w.e. a–1 °C–1 ) is lower than over debris-free areas at the same elevation (not shown in Fig. 10). This is due to the low DDF for debris cover (40% of DDF for ice) which efficiently protects ice from fast melting. The dispersion in sensitivity is quite high close to the ELA (~4900 m a.s.l.), where it sharply changes from -0.91 mw.e.a–1 °C–1 at 4850 m a.s.l. to -0.56 m w.e. a–1 °C–1 at 5150 m a.s.l. This is likely due to the albedo pattern which can differ markedly from year to year close to the ELA (Reference VincentVincent, 2002).
MB sensitivity of Chhota Shigri glacier to temperature as a function of altitude (dotted line) compared to glaciers in the French Alps (various symbols) (Reference VincentVincent, 2002). The lower and upper x-axis are the elevations for Chhota Shigri and French glaciers respectively and have been shifted to match their ELAs (thin vertical line).
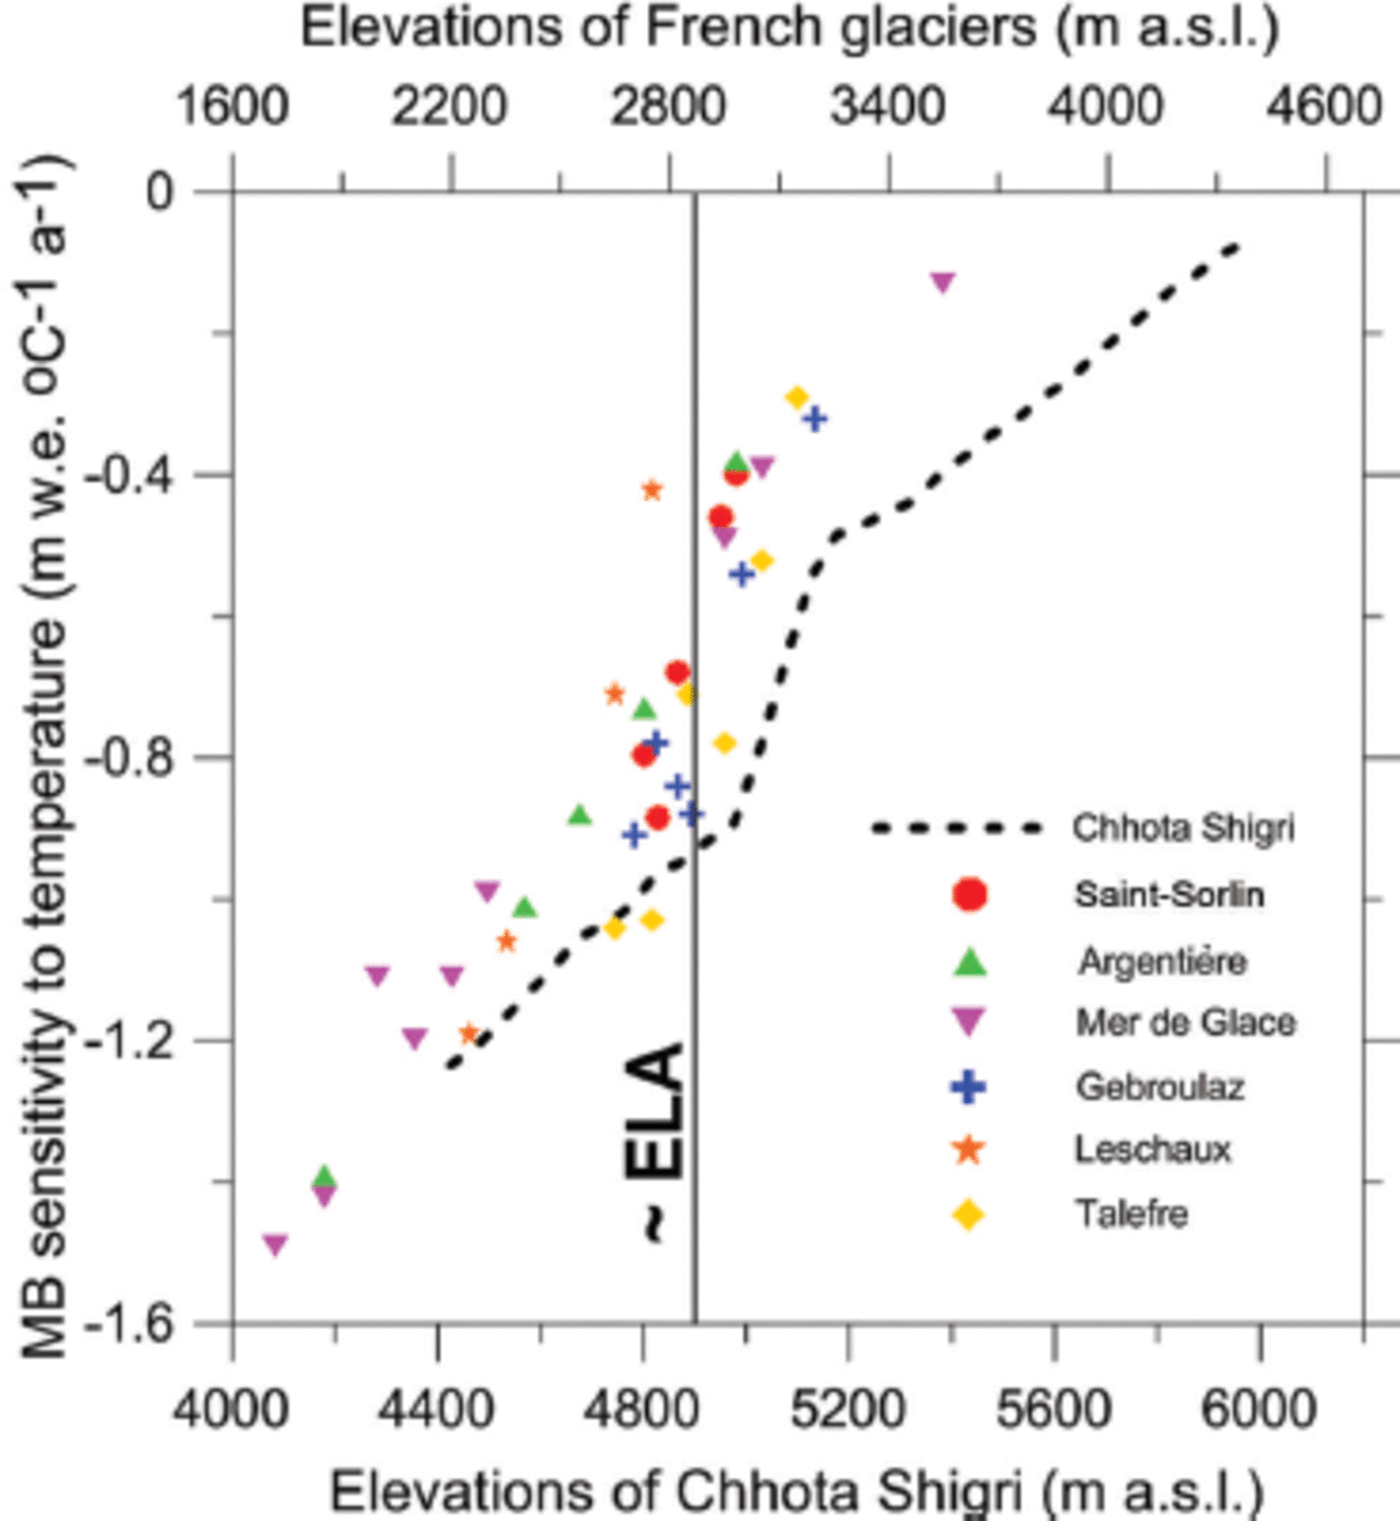
Figure 10 compares the Chhota Shigri glacier modelled MB sensitivity to temperature with summer ablation sensitivities of some monitored French glaciers (Reference VincentVincent, 2002). These ablation sensitivities are calculated for the whole summer period by multiplying the DDF by the mean number of days for which temperature is higher than 0°C at the observation elevation. The glacier altitudes are different, so they have been shifted to match the ELA of Chhota Shigri glacier (~4900 m a.s.l.) to the mean ELA of the French glaciers (~2900 m a.s.l.) in order to compare the sensitivity profiles with respect to elevation. The average sensitivity for Chhota Shigri glacier at approximately the ELA is calculated as -0.73 m w.e. a–1 °C–1, while it is -0.50 m w.e. a–1 °C–1 for the French glaciers. Reference Thibert, Eckert and VincentThibert and others (2013) reported ablation sensitivity for another French glacier, Glacier de Sarennes, as -0.62 m w.e.a–1 °C–1 at 3000ma.s.l. The sensitivity profile of Chhota Shigri glacier with respect to altitude is in good agreement with those of French glaciers with maximum dispersion around ELAs.
A similar sensitivity test was performed for precipitation assuming a 10% increase. MB sensitivity to precipitation is calculated as 0.16 mw.e. a–1 for a 10% change, again in agreement with the value (0.14 m w.e. a–1 for a 10% change) reported by Reference Mölg, Maussion, Yang and SchererMölg and others (2012) on Zhadang glacier. The model was run several times while changing successive total precipitation to discern the precipitation amount needed to compensate a 1 °C change in temperature. A 32% increase in precipitation results in the same change in glacier-wide MB as a 1°C increase in temperature. Our results are in good agreement with Reference Braithwaite, Zhang and RaperBraithwaite and others (2002) and Reference Braithwaite and RaperBraithwaite and Raper (2007), who reported a 30-40% increase in precipitation to offset the effects of a +1°C temperature change.
To test the relative importance of summer temperature and winter precipitation as drivers controlling the annual MB of Chhota Shigri glacier, we compared the sensitivity of the modelled MB to one standard deviation (1σ) of both variables (0.49°C for summer temperature and 145 mm for winter precipitation over the 43 year period). The respective sensitivities are -0.25 mw.e. for 1σ of temperature and +0.30 m w.e. for 1 of precipitation, confirming that the two variables are almost equally important drivers controlling the annual MB of Chhota Shigri glacier at decadal scale.
7. Conclusion
The MB of Chhota Shigri glacier has been measured annually using the glaciological method since 2002 and the geodetic method between 1988 and 2010. In the present study, the MB series of Chhota Shigri glacier has been extended back to 1969 by a temperature-index model together with an accumulation model using daily records of precipitation and temperature from Bhuntar Observatory. Model parameters were mostly derived from field measurements, except the vertical precipitation gradient whose lower limit was first obtained from field data to finally be calibrated because of the paucity of field measurements. The modelled and observed altitudinal MBs show an RMSE of 0.84mw.e.a–1 for the ten years 2002-12. Chhota Shigri glacier experienced a moderate mass wastage at a rate of -0.30±0.36mw.e.a–1 over the 1969-2012 period. The reconstructed MB time series shows two deficit periods (1969-85 and 2000-12) with moderate and accelerated mass loss respectively, and one steady-state period (1986-99) when the glacier MB remained close to zero. The steady-state period is characterized by 56 mm a–1 higher precipitation and 0.2°C lower summer mean temperature than 1969-2012 averages, resulting in roughly equal winter MB and summer MB. The sensitivity of the mean specific MB of Chhota Shigri glacier to precipitation is 0.16 m w.e. a–1 for a 10% change and to temperature is -0.52 m w.e. a–1 0C-1.This sensitivity to temperature ranges from -1.21 mw.e.a–1 0C-1 at 4400ma.s.l. to -0.05 m w.e. a–1 C-1at 6000ma.s.l., whereas it is -0.73 mw.e. a–1 0C–1 around the ELA (~4900ma.s.l.), similar to the sensitivity of French glaciers relative to their ELA (Reference VincentVincent, 2002). A 32% increase in precipitation compensates the effect of +1°C change in temperature.
This study suggests that winter precipitation and summer temperature are almost equally important drivers controlling the MB pattern of Chhota Shigri glacier at decadal scale. Comprehensive precipitation measurements at glacier elevation, presently in progress, will help us to confirm this finding as well as to understand the impact of summer sporadic heavy snowfalls on the annual glacier-wide MB precisely. Further investigations including energy-balance studies at the glacier surface are also required to understand the role of different energy fluxes in annual glacier-wide MB determination.
Acknowledgements
We thank E. Berthier, S. Rajdeep and N. Qazi and two anonymous referees for constructive comments that led to a considerably improved manuscript. This work was supported by IFCPAR/CEFIPRA project No. 3900-W1, the French Service d’Observation GLACIOCLIM and the Department of Science and Technology, Government of India. M.F. Azam is grateful to IRD for providing financial support for his PhD. We thank the IMD, New Delhi, India, for providing the meteorological data from Bhuntar Airport meteorological observatory. A special thanks to our field assistant Adhikari Ji and the porters who have taken part in successive field trips, sometimes in harsh conditions. We thank Jawaharlal Nehru University for providing all the facilities to carry out this work.


