


INTRODUCTION
Ice-core and marine records show millennial-scale climate oscillations from cold to warm states during the last glacial period from the North Atlantic region and Greenland (e.g., Blunier and Brook, Reference Blunier and Brook2001; Alley et al., Reference Alley, Marotzke, Nordhaus, Overpeck, Peteet, Pielke, Pierrehumbert, Rhines, Stocker, Talley and Wallace2003). These climate oscillations coincide with environmental and climate changes in many other regions around the globe (see e.g. references in Clement and Peterson, Reference Clement and Peterson2008). The most probable explanation of these abrupt climate events is changing freshwater input from the surrounding land or from melting ice sheets to the high-latitude North Atlantic Ocean that abruptly weakened the Atlantic meridional overturning circulation (AMOC), and therefore reduced North Atlantic heat transport from the tropics to the high latitudes (Clement and Peterson, Reference Clement and Peterson2008). At the same time, it is still poorly understood how these major climatic events influenced climatic conditions in continental areas of Europe, mainly due to the scarcity of available records (Sanchi et al., Reference Sanchi, Ménot and Bard2014). In Central–Eastern Europe (CEE), for instance, most of the existing sediment records that are suitable for paleoecological and quantitative paleoclimatological analyses, mainly cover the last deglaciation; while sequences older than 14,700 years are rare (e.g., Magyari et al., Reference Magyari, Jakab, Rudner and Sümegi1999, Reference Magyari, Kunes, Jakab, Sümegi, Pelánková, Schäbitz, Braun and Chytrý2014a; Sümegi et al., Reference Sümegi, Magyari, Dániel, Molnár and Törőcsik2013, Reference Sümegi, Gulyás, Molnár, Sümegi, Almond, Vandenberghe and Zhou2018; Feurdean et al., Reference Feurdean, Perşoiu, Tanţău, Stevens, Magyari, Onac and Marković2014; Duprat-Oualid et al., Reference Duprat-Oualid, Rius, Bégeot, Magny, Millet, Wulf and Appelt2017; Feurdean and Tanţău, Reference Feurdean, Tanţău, Rădoane and Vespremeanu-Stroe2017; Újvári et al., Reference Újvári, Stevens, Molnár, Demény, Lambert, Varga, Jull, Páll-Gergely, Buylaert and Kovács2017). From the Carpathian Mountains, some important summary investigations have been published about glacier advances, mainly focusing on the southern (Retezat Mountains at 45°N; Ruszkiczay-Rüdiger et al., Reference Ruszkiczay-Rüdiger, Kern, Urdea, Braucher, Madarász and Schimmelpfennig2016) and the western (High Tatra Mountains at 49°N; Makos et al., Reference Makos, Dzierżek, Nitychoruk and Zreda2014; Engel et al., Reference Engel, Mentlík, Braucher, Minár and Léanni2015) mountain ranges. These studies suggested that the most extended glacier advances in the Carpathians occurred around 22–20.5 ka BP (based on 10Be exposure ages), likely associated with the last glacial maximum (LGM; between ca. 23 ka and 19 ka; Makos et al., Reference Makos, Dzierżek, Nitychoruk and Zreda2014; Engel et al., Reference Engel, Mentlík, Braucher, Minár and Léanni2015; Ruszkiczay-Rüdiger et al., Reference Ruszkiczay-Rüdiger, Kern, Urdea, Braucher, Madarász and Schimmelpfennig2016), similar to dated glacial events in other parts of Europe (e.g., Hughes et al., Reference Hughes, Gibbard and Ehlers2013; Ivy-Ochs, Reference Ivy-Ochs2015). Because lakes situated in glacial basins could only form just after ice retreat, it is not surprising that most of the existing sediment cores from the Carpathians do not cover the last glacial period, and especially the LGM. One of the few exceptional sites is Lake Saint Anne, a crater lake located in the Hargitha Mountains in the Eastern Carpathians (Magyari et al., Reference Magyari, Buczkó, Jakab, Braun, Szántó, Molnár, Pál and Karátson2006, Reference Magyari, Buczkó, Jakab, Braun, Pál, Karátson and Pap2009, Reference Magyari, Veres, Wennrich, Wagner, Braun, Jakab and Karátson2014b, Feurdean et al., Reference Feurdean, Perşoiu, Tanţău, Stevens, Magyari, Onac and Marković2014). Based on an investigation from the region (Gheorghiu, Reference Gheorghiu2012), the most extensive glacier advance in the Eastern Carpathians occurred earlier than in the southern or in the western mountain ranges, between ca. 37 and 26 ka due to moist and cold climatic conditions (Engel et al., Reference Engel, Mentlík, Braucher, Minár and Léanni2015). At this time in the Hargitha Mountains at the location of Lake Saint Anne, glaciers were not developed due to the relatively low elevation of the Ciomadul Mountains (highest peak: 1289 m above sea level; Magyari et al., Reference Magyari, Veres, Wennrich, Wagner, Braun, Jakab and Karátson2014b).
Climate model simulations (Renssen and Isarin, Reference Renssen and Isarin2001; Strandberg et al., Reference Strandberg, Brandefelt, Kjellström and Smith2011; Huntley et al., Reference Huntley, Allen, Collingham, Hickler, Lister, Singarayer, Stuart, Sykes and Valdes2013) suggested generally lower amplitude summer and winter temperature fluctuation during GS-2.1 (ca. 14,692–22,900 b2k, Greenland stratigraphic framework; Rasmussen et al., Reference Rasmussen, Bigler, Blockley, Blunier, Buchardt, Clausen and Cvijanovic2014) in CEE than in Western Europe. This likely provided more favorable conditions for the survival of temperate vegetation elements in CEE than in Western Europe (Magyari et al., Reference Magyari, Veres, Wennrich, Wagner, Braun, Jakab and Karátson2014b). At the same time, only few available quantitative temperature reconstructions exist from the area, mainly from the Carpathian Basin (Sümegi, Reference Sümegi2005; Sümegi et al., Reference Sümegi, Magyari, Dániel, Molnár and Törőcsik2013; Magyari et al., Reference Magyari, Pál, Vincze, Veres, Jakab, Braun, Szalai, Szabó and Korponai2019; Vincze et al., Reference Vincze, Finsinger, Jakab, Braun, Hubay, Veres, Deli, Szalai, Szabó and Magyari2019). Loess mollusk faunas were used to infer July mean-temperature changes in the Great Hungarian Plain, and demonstrate that July mean temperatures gradually decreased after 24,000 cal yr BP from 18°C to 10–11°C by 17,000 cal yr BP (approximately Heinrich event 1; H1) followed by an increase after 16,500 cal yr BP gradually up to 15–16°C. Pollen-based July mean-temperature reconstruction from eastern Hungary furthermore suggested relatively mild summers (~14.5°C) by 19,440 cal yr BP, and buffered July mean-temperature fluctuations throughout the last glacial termination in this region, with < 1°C decrease in summer mean temperatures during the Younger Dryas stadial, and ~2.2°C warming in the Early Holocene. The few available quantitative reconstructions suggest that that in this region of Europe, the warming after H1 (ca. 16,200–16,500 cal yr BP) had similar amplitude to the late glacial warming. These findings were also corroborated by the study of Black Sea sediments that are located relatively close to the Eastern Carpathians, and are characterized by similar weather system (Sanchi et al., Reference Sanchi, Ménot and Bard2014; Wegwerth et al., Reference Wegwerth, Ganopolski, Ménot, Kaiser, Dellwig, Bard, Lamy and Arz2015). The accumulation of illite and kaolinite-rich red clays here were interpreted as a result of increased drainage of glacial meltwater and permafrost, and higher input of terrestrial organic matter via the Volga and Dniester rivers from ca. 16,400 cal yr BP.
Alpine lake sediments with satisfying preservation of chironomid larvae (non-biting midges) offer exceptional possibilities for quantitative climate reconstruction in CCE. Chironomids belong to the two-winged flies (Diptera), and they are important colonizers of lotic and lentic habitats (Pinder, Reference Pinder1986). Their chitinous head capsules preserve well in lake sediments and remain suitable for taxonomic identification to genus and species morphotype level (Brooks et al., Reference Brooks, Langdon and Heiri2007). The distribution of chironomids is strongly influenced by summer air and water-surface temperature (Eggermont and Heiri, Reference Eggermont and Heiri2012). Utilizing this relationship, chironomid-temperature transfer functions have been developed (e.g., Heiri et al., Reference Heiri, Brooks, Birks and Lotter2011; Self et al., Reference Self, Brooks, Birks, Nazarova, Porinchu, Odland, Yang and Jones2011) and successfully used to reconstruct past temperature changes for several regions during the Lateglacial and Holocene (e.g., Il'yashuk et al., Reference Il'yashuk, Gobet, Heiri, Lotter, van Leeuwen, van der Knaap, Il'yashuk, Oberli and Ammann2009; Płóciennik et al., Reference Płóciennik, Self, Birks and Brooks2011; Tóth et al., Reference Tóth, Magyari, Brooks, Braun, Buczkó, Bálint and Heiri2012, Reference Tóth, Magyari, Buczkó, Braun, Panagiotopoulos and Heiri2015; Samartin et al., Reference Samartin, Heiri, Kaltenrieder, Kühl and Tinner2016; Bolland et al., Reference Bolland, Rey, Gobet, Tinner and Heiri2020). Here, we present a new chironomid record and chironomid-inferred summer air-temperature reconstruction from Lake Saint Anne, Eastern Carpathians, Romania, covering the time period between ca. 16,800 cal yr BP and 9100 cal yr BP. The aims of this paper are to: 1) describe the compositional changes of the chironomid assemblages from this unusually old lake sediment record, 2) reconstruct summer air-temperature changes inferred by chironomids, and 3) compare our results with other records from the region. We particularly test two hypotheses: 1) the amplitude of Younger Dryas summer mean-temperature decrease was less in continental CEE due to the diminishing impact of the North Atlantic on CEE climate; and 2) the amplitude of warming after H1 reached the amplitude of the late glacial warming due to polar circulation intensity decrease at this time, while AMOC intensity increase together with high summer insolation were the drivers of the observed July temperature increase at 14,700 cal yr BP (Stanford et al., Reference Stanford, Rohling, Bacon, Roberts, Grousset and Bolshaw2011).
STUDY SITE
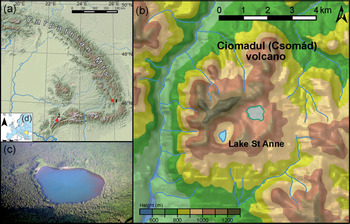
The youngest volcanic activity in Central-Eastern Europe (CEE) occurred at the Ciomadul volcano located in the Harghita Mountains, Eastern Carpathians, Romania. The Ciomadul volcano is a dacitic lava-dome complex with two craters: Lake Saint Anne (Lacul Sfânta Ana) and Mohos (Mohoş) peat bog (Karátson et al., Reference Karátson, Telbisz, Harangi, Magyari, Dunkl, Kiss and Jánosi2013). At present, the area is characterized by heat flux in the magma chamber, microseismicity, and intense CO2 degassing in the lake (Szakács et al., Reference Szakács, Seghedi and Pécskay2002). All of these features suggested that Ciomadul could be regarded as a geologically active volcano, unique in CEE (Karátson et al., Reference Karátson, Telbisz, Harangi, Magyari, Dunkl, Kiss and Jánosi2013).
The crater of Lake Saint Anne was formed by the youngest volcanic eruption of the volcano at ca. 29,600 cal yr BP (Harangi et al., Reference Harangi, Molnár, Vinkler, Kiss, Jull and Leonard2010; Karátson et al., Reference Karátson, Telbisz, Harangi, Magyari, Dunkl, Kiss and Jánosi2013, Reference Karátson, Wulf, Veres, Magyari, Gertisser, Timar-Gabor and Novothny2016). The lake is situated at 946 m asl (46°07′35″N, 25°53′17″ E; Fig. 1), has no outflow, and is fed mainly by rainwater (Pál, Reference Pál2001). Its area is ~189,900 m2, with a mean depth of ~3.1 m and a maximum water depth of ~6 m (Pándi, Reference Pándi2008). However, raised shorelines are apparent in the crater slope, and when compared to the actual sediment surface position, suggest that maximum water depth likely exceeded 12 m in the past (Pál, Reference Pál2001). The lake water is characterized by seasonal pH fluctuation with neutral water during summer (pH between 6–6.4) and acidic water in autumn and spring (pH between 4.2–4.5). However, in recent years at Lake Saint Anne, summer pH has increased due to the effects of human impacts (Magyari et al., Reference Magyari, Buczkó, Jakab, Braun, Pál, Karátson and Pap2009, Reference Magyari, Veres, Wennrich, Wagner, Braun, Jakab and Karátson2014b), and since April 2018, swimming in the lake has been forbidden because of poor water quality.
(a) Locations indicated by red squares of (1) Lake Saint Anne in the East Carpathians and (2) Lake Brazi in the South Carpathians; (b) location of Lake Saint Anne within the Ciomadul Mountains; (c) aerial photo of Lake Saint Anne; (d) location of Romania within Europe. Note Norway Spruce trees located below the beech forest zone due to thermal inversion around the lake. Photo by the courtesy of Zoltán Czajlik.

The climate of the area is continental temperate. Mean annual temperature at lake elevation is 6–7°C; January is the coldest month with mean temperature around –5°C; and July is the warmest month with a mean temperature around 15°C. Annual precipitation is 800 mm (Diaconu and Mailat, Reference Diaconu and Mailat2010). The crater slope is covered by mixed Fagus sylvatica–Picea abies forest, while Carpinus betulus, Betula pendula, Salix caprea, Salix cinerea, Acer platanoides, and Pinus sylvestris appear as admixtures in the forest (Magyari et al., Reference Magyari, Veres, Wennrich, Wagner, Braun, Jakab and Karátson2014b). An interesting characteristic feature of the crater itself is the thermal inversion present in the crater, which means that the vegetation belts are in reverse order as compared to normal distribution, with deciduous forests of F. sylvatica located above P. abies forests (Fig. 1c). At present, a floating fen formed by Carex rostrata and Carex lasiocarpa and on which Sphagnum species and Lysimachia thyrsiflora appear, has developed in the shallow northeastern corner of the lake (Pál, Reference Pál2000).
MATERIALS AND METHODS
Coring
The sediment of Lake Saint Anne has been sampled several times, and herein, we focus on a sediment core obtained in 2010. The sediment core is 1200 cm long, and was taken during winter using a 7-cm-diameter Livingstone piston corer with a chamber length of 200 cm. At the coring location, the water depth was 600 cm. During this expedition, the core taken did not reach the bottom of the lake sediment (see Magyari et al., Reference Magyari, Veres, Wennrich, Wagner, Braun, Jakab and Karátson2014b).
Chronology
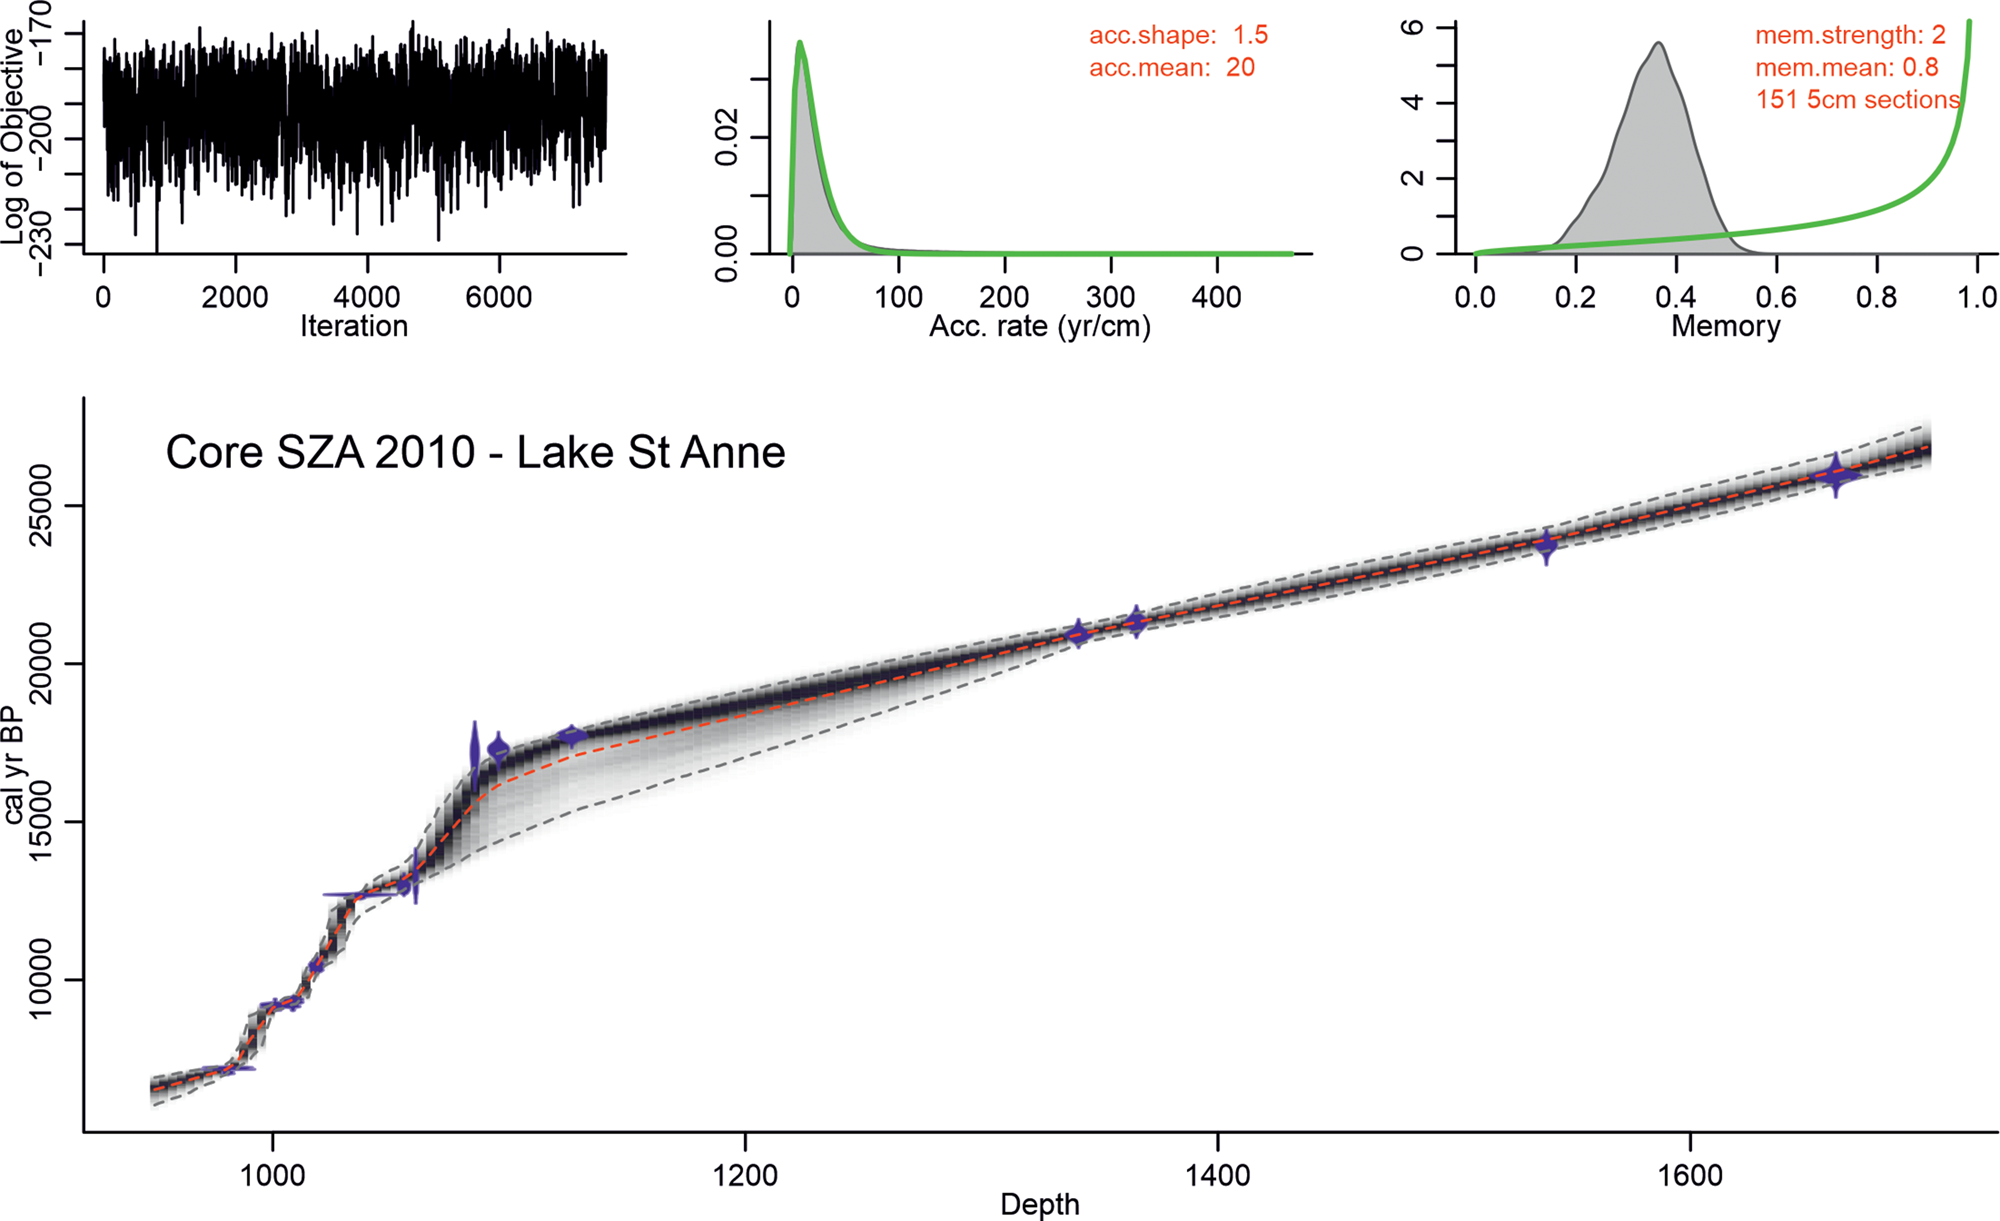
A chronological framework of the sediment was established using 14 AMS radiocarbon ages (Table 1) based on plant macrofossils and charcoal to 1127-cm sediment depth. Below 1340-cm sediment depth, Cladocera eggs and chironomid head capsules were also used because no terrestrial macroremains were found. The radiocarbon ages were calibrated into calendar years before present (cal yr BP) using the IntCal20 calibration curve (Reimer et al., Reference Reimer, Austin, Bard, Bayliss, Blackwell, Bronk Ramsey and Butzin2020). The age-depth relationship of the sediment was assessed using a Bayesian model that excludes two radiocarbon dates (Table 1). The resultant age-depth model differs slightly from the linear model presented in Magyari et al. (Reference Magyari, Veres, Wennrich, Wagner, Braun, Jakab and Karátson2014b), which only used 8 AMS 14C ages, whereas this new model particularly improves the late glacial timescale of the record.
Radiocarbon dates and calibrated calendar years before present (cal yr BP) derived from materials found in core SZA-2010, Lake Saint Anne, East Carpathians. Radiocarbon ages of all samples were calibrated into calendar years before present (cal yr BP) using the IntCal20 calibration curve (Reimer et al., Reference Reimer, Austin, Bard, Bayliss, Blackwell, Bronk Ramsey and Butzin2020).

Laboratory analyses
Sediment lithology, organic matter content (loss-on-ignition analysis; LOI), and magnetic susceptibility measurements of sediment core SZA-2010 were described in detail by Magyari et al. (Reference Magyari, Veres, Wennrich, Wagner, Braun, Jakab and Karátson2014b).
In our present study, we focus on the 1000–1118 cm sediment section of core SZA-2010. For chironomid analysis, 1–4 cm3 sediment subsamples were investigated at 2-cm intervals between 1000 and 1026 cm, and at 1-cm intervals between 1026 and 1118 cm sediment depths. Subsamples were sieved with a 100-μm mesh using distilled water. Chironomid larval head capsules were picked from a Bogorov-counting tray (Gannon, Reference Gannon1971) using a stereomicroscope at 40× magnification. Larval head capsules were mounted on microscope slides in Euparal® mounting medium for identification. Identification of chironomid head capsules followed Wiederholm (Reference Wiederholm1983), Rieradevall and Brooks (Reference Rieradevall and Brooks2001), and Brooks et al. (Reference Brooks, Langdon and Heiri2007).
For plant macrofossil analysis, subsamples were taken contiguously between 950 and 1120 cm. Samples were soaked in distilled water and sieved through a 250-μm mesh. Terrestrial and aquatic plant remains were determined under the stereomicroscope (10× magnification) using Katz et al. (Reference Katz, Katz and Kipiani1965), Tomlinson (Reference Tomlinson1985), Bojnanský and Fargašová (Reference Bojnanský and Fargašová2007), and Velichkevich and Zastawniak (Reference Velichkevich and Zastawniak2008). Sediment components (e.g., Sphagnum sp. leaves) were counted in five randomly chosen 1-cm2 squares in the petri dish, then estimates were given using the relative abundance of the components using the method of Jakab et al. (Reference Jakab, Sümegi and Magyari2004). The concentrations of macrofossils were standardized to 10 cm3 sediment.
Plotting, numerical analyses, and temperature reconstruction
The chironomid relative-abundance diagram and the Sphagnum concentration diagram were plotted using the program Psimpoll 4.27 (Bennett, Reference Bennett2007), and zonation of the chironomid assemblage was based on optimal splitting by information content without data transformation. The significance of each zone was tested using the broken-stick model (Bennett, Reference Bennett2007).
To estimate major subfossil chironomid assemblage changes, detrended correspondence analysis (DCA) was performed using Canoco version 4.5 (ter Braak and Šmilauer, Reference ter Braak and Šmilauer1998). Before DCA, percentage chironomid species data were square-root transformed, and rare taxa were down-weighted. The gradient length of the longest DCA axis (axis 1) was 2.92 SD units.
The chironomid-inferred July air-temperature (TVII) reconstruction was calculated using weighted-averaging partial least-squares regression (WA-PLS; ter Braak and Juggins, Reference ter Braak and Juggins1993), and based on calibration data of the merged Norwegian-Swiss chironomid temperature training sets. The merged Norwegian-Swiss training set includes surface sediment samples from 274 lakes, and covers wide altitudinal, latitudinal, lake-water pH, and air-temperature ranges (Heiri et al., Reference Heiri, Brooks, Birks and Lotter2011; Brooks and Birks Reference Brooks and Birks2000, Reference Brooks and Birks2001). Before the reconstruction, 19 lakes characterized by unusual hydrological conditions from the Norwegian-Swiss data set were excluded as outliers (for more details, see Heiri et al., Reference Heiri, Brooks, Birks and Lotter2011). Prior to the temperature reconstruction, percentage chironomid data were square-root transformed. Chironomid head-capsule concentration was estimated by counting all head capsules in the subsamples. At least 45 head capsules were identified in most of the samples (see Heiri and Lotter, Reference Heiri and Lotter2001). Where the number of chironomid remains was low (< 45 head capsules), the neighboring samples were merged in order to reach a representative count for quantitative analysis (three samples). Summer air-temperature reconstructions and sample-specific errors of prediction (SSPEs) based on bootstrapping (999 bootstrap cycles) were calculated using the program C2 (Juggins, Reference Juggins2007).
In order to estimate the reliability of the chironomid-inferred temperature reconstruction, we estimated the cross-validated root-mean-square-error of prediction (RMSEP), the squared chi-square distance to the closest modern analogue, and the percentage of rare taxa in the training set using C2 (Juggins, Reference Juggins2007), and goodness-of-fit measures using Canoco v. 4.5 (ter Braak and Šmilauer, Reference ter Braak and Šmilauer1998). Prior to the analyses, percent abundance data of chironomids were square-root transformed. Fossil assemblages with a squared chi-square distance to the most similar assemblage in the modern calibration dataset larger than the 2nd and the 5th percentile of all squared chi-square distances in the modern data were identified as samples with “no close” and “no good” analogue, respectively (Birks et al., Reference Birks, Ter Braak, Line, Juggins and Stevenson1990; Heiri et al., Reference Heiri, Lotter, Hausmann and Kienast2003). Fossil samples with a residual distance to the first CCA axis larger than the 90th and 95th percentile of the residual distances of all the modern samples were identified as samples with “poor fit” and “very poor fit” with temperature, respectively (Birks et al., Reference Birks, Ter Braak, Line, Juggins and Stevenson1990). Chironomid taxa with a Hill's N2 (Hill, Reference Hill1973) below 5 in the calibration data were considered to be rare in the modern dataset (Heiri et al., Reference Heiri, Lotter, Hausmann and Kienast2003).
RESULTS
Chronology and sediment stratigraphy
For age-depth modeling, Bayesian modeling was used in Bacon v2.5.0 (Blaauw and Christen, Reference Blaauw and Christen2011; Fig. 2), and two radiocarbon dates were excluded at 1073-cm and 1092-cm sediment depth (Table 1) because the pollen stratigraphy suggested that these radiocarbon dates are too old. In both cases, pollen assemblages suggested interstadial forested conditions with high boreal tree and deciduous tree pollen percentages, while the ages pointed to a stadial stage (GS-2.1).
Age-depth model for core SZA-2010 from Lake Saint Anne, East Carpathians, based on a Bayesian model, excluding two radiocarbon dates at 1073 cm and 1092 cm. Depth scale = cm. Upper left corner shows the number of iterations, upper middle panel shows the accumulation rate prior with two parameters: acc.shape (default value is used = 1.5, higher values result in more peaked shapes) and acc.mean (default value is used = 20); upper right panel shows memory strength that defines how much the accumulation rate of a particular depth in a core depends on the depth above it; we set this memory low (2), since accumulation rate was thought to have changed much over time; the prior for the memory is a beta distribution with values between 0 and 1; here mem.mean = 0.8 was used, and together with the applied mem.strenght these allow for a large range of posterior memory values (Blaauw and Christen, Reference Blaauw and Christen2011).
The sediment stratigraphy of core SZA-2010 between 950 and 977 cm is characterized by coarse, peaty gyttja with high organic content (Unit I). Between 977 and 1036 cm (Unit II), clayey silty gyttja is noted, followed by silt-rich sediment with yellowish color between 1036 and 1100 cm (Unit III). Below 1100 cm (Unit IV), the core shows variations of dark and light gray silt-rich sediments with very low organic matter content (for more detail, see Magyari et al., Reference Magyari, Veres, Wennrich, Wagner, Braun, Jakab and Karátson2014b).
Chironomid assemblage changes, Sphagnum leaves concentration, and organic matter content in Lake Saint Anne
Altogether, 26 chironomid taxa belonging to three subfamilies (Tanypodinae, Orthocladiinae and Chironominae) were identified from the sediments from Lake Saint Anne. Additionally, head capsules from one other insect family (Ceratopogonidae; “no-see-ums”) closely related to chironomids were also found continuously in the sediment between 1071 and 1000 cm (ca. 14,365–9120 cal yr BP).
Based on relative abundance changes, five significant chironomid assemblage zones were distinguished, and zone five was further divided into two subzones based on relative frequency changes of two taxa within this zone (Psectrocladius sordidellus-type, Chironomus anthracinus-type; Fig. 3). Chironomid assemblages were used to reconstruct July air temperatures (TVII; Fig. 4). Zone boundaries are mainly related to abundance shifts of the dominant taxa: Tanytarsus lugens-type, Procladius, Microtendipes pedellus-type, Chironomus anthracinus-type, Dicrotendipes nervosus-type, Tanytarsus mendax-type, and Psectrocladius sordidellus-type.
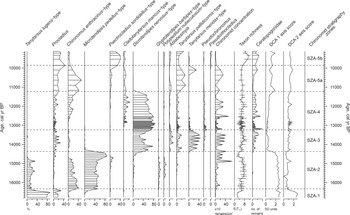
Chironomid relative-abundance diagram including selected chironomid taxa with > 1% relative abundance, chironomid concentration (number of head capsules/cm3), taxonomic richness (rarefaction analysis), number of Ceratopogonidae remains (number of head capsules), detrended correspondence analysis axes scores (DCA axis 1 and DCA axis 2, expressed in SD units), and zones for the chironomid stratigraphy from Lake Saint Anne (East Carpathians).

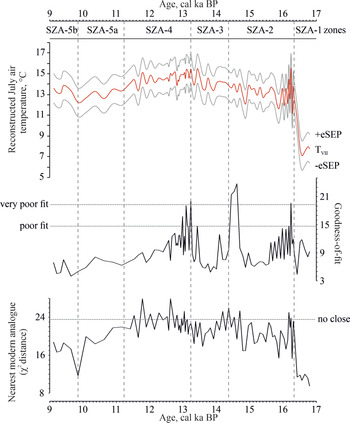
Chironomid-inferred July temperature estimates based on the merged Norwegian-Swiss calibration datasets (red line; TVII); with their sample-specific standard errors (eSEP; gray lines) from Lake Saint Anne, East Carpathians (top). Reconstruction diagnostic statistics of the chironomid-inferred July air-temperature reconstructions include goodness-of-fit statistics of the fossil samples with temperatures (middle) and nearest modern analogues for the fossil samples in the calibration data set (bottom) (Birks et al., Reference Birks, Ter Braak, Line, Juggins and Stevenson1990).

The first chironomid stratigraphy zone (SZA-1; 1118–1101 cm; ca. 16,800–16,335 cal yr BP) was dominated by T. lugens-type and Procladius. Generally, the taxonomic richness (measured by rarefaction analysis; mean 3 taxa) and the concentration of chironomid remains (mean < 20 remains per cm-3) was very low (Fig. 3). Moreover, loss-on-ignition inferred organic-matter content was also low (~5%) in this sediment section (Fig. 5).
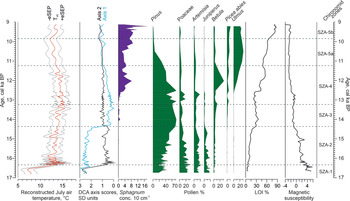
Data derived from core SZA-2010, Lake Saint Anne, East Carpathians. Chironomid-inferred temperature estimates (TVII; red line) and sample-specific standard errors of prediction (eSPE; gray lines); detrended correspondence analysis axes scores DCA axis 1 (gray line) and 2 (blue line) expressed in SD units; Sphagnum leaves concentration (per 10 cm-3) from this study. Percentage abundance of selected pollen types (Pollen %), loss-on-ignition (LOI %) and magnetic susceptibility values from earlier published data (Magyari et al., Reference Magyari, Veres, Wennrich, Wagner, Braun, Jakab and Karátson2014b), with zones delineated by chironomid stratigraphy from this study (SZA-1 to SZA-5b).

At the onset of the second zone (SZA-2; 1101–1071 cm; ca. 16,335–14,365 cal yr BP), relative abundances of T. lugens-type and Procladius decreased abruptly, while M. pedellus-type and C. anthracinus-type became dominant. At the same time despite its decreased relative abundance, T. lugens-type remained prevalent in the chironomid assemblage. Glyptotendipes barbipes-type and Polypedilum nubeculosum-type also occurred in this zone with stable numbers (Fig. 3). Generally, chironomid concentration and taxon richness showed increasing values in parallel with increasing organic matter content (from ~5–6% to 11%) in SZA-2. Between 1076 and 1071 cm (ca. 14,790–14,365 cal yr BP), a short-term decline was seen in the taxonomic richness (from ~7 taxa to 3 taxa; Fig. 3); C. anthracinus-, T. lugens-, G. barbipes- and P. nubeculosum-types disappeared from the chironomid assemblage, while M. pedellus-type as the dominant taxon reached its highest abundance (~80–88%; Fig. 3). Moreover, Sphagnum leaves appeared for the first time at ca. 14,100 cal yr BP (at ~1068-cm sediment depth) in low but constant numbers in the sediment; however, Sphagnum concentration remained below 1000 leaves per 10 cm-3 until ca. 12,600 cal yr BP (Fig. 5).
In the third zone (SZA-3; 1071–1056 cm; ca. 14,365–13,230 cal yr BP), M. pedellus-type disappeared, and the zone was dominated by D. nervosus-type and T. mendax-type. Additionally, Ablabesmyia and Pseudochironomus appeared for the first time in the assemblage. The first remains of ceratopogonids appeared and increased in abundance in SZA-3 (Fig. 3). Organic matter content increased from ~11 to 29.7% (Fig. 5), and chironomid concentration and taxonomic richness increased further.
The dominance of D. nervosus-type was continuous in the fourth zone (SZA-4; 1056–1025 cm; ca. 13,230–11,230 cal yr BP), where the taxon reached its highest abundance (~70%). The most important differences from SZA-3 were the first appearance of Cladotanytarsus mancus-type and the sudden decrease of Ablabesmyia and T. mendax-types. Chironomid concentration showed a slight decrease, while taxonomic richness remained relatively stable in this zone (Fig. 3). Mean organic matter content in SZA-4 was ~32.9%, with a small drop to ~28.5% (Fig. 5) between ca. 12,960–12,275 cal yr BP (~1047–1033 cm), and coincided with decreasing relative abundance of ceratopogonids (Fig. 3). Also, the concentration of Sphagnum leaves started to increase gradually at ca. 12,790 cal yr BP (at ~1041-cm sediment depth) and after the end of this zone (at ca. 12,400 cal yr BP; or ~1034-cm sediment depth), on average, more than 2000 Sphagnum leaves were counted from 10-cm3 sediment subsamples (Fig. 5).
In the fifth zone (SZA-5; 1025–1000 cm; ca. 11,230–9120 cal yr BP), the earlier dominant D. nervosus-type disappeared suddenly. For better presentation of results, we divided this zone into two nonsignificant parts, SZA-5a and SZA-5b. In SZA-5a (1025–1014 cm; ca. 11,230–9855 cal yr BP), C. anthracinus-type became dominant together with Procladius and Tanytarsus pallidicornis-type, while relative abundance of Ceratopogonidae decreased (Fig. 3). Organic matter content showed a further increase (~56%; Fig. 5). In SZA-5b (1014–1000 cm; ca. 9855–9120 cal yr BP), relative abundance of C. anthracinus-type decreased notably from ~35–40% to 5%, while P. sordidellus-type became dominant and reached ~35–40%. At the same time, Procladius and T. pallidicornis-type did not show changes. Additionally, Pseudorthocladius appeared for the first time in SZA-5b, and the number of Ceratopogonidae remains increased again (Fig. 3). Chironomid concentration decreased noticeably in SZA-5b despite continuously increasing organic matter content (up to ~80.4%; Figs 3, 5); while concentration of Sphagnum leaves increased distinctly in SZA-5b (after ca. 10,095 cal yr BP; ~1016-cm sediment depth) and exceeded 6000 leaves per 10-cm-3 concentration (Fig. 5).
Ordination of the Lake Saint Anne chironomid record
The first two DCA axes showed similar gradient length (2.92 and 2.81 SD units, respectively) and explained 46.9% of the variance in the chironomid record (35.6% and 11.3%, respectively).
Along the first DCA axis, the most important change of about 2.0 SD units occurred at the zone boundary from SZA-2 to SZA-3 (at ca. 14,365 cal yr BP; Fig. 3). In zones SZA-3 and SZA-4, first DCA axis scores fluctuated between 0.1 SD units and 0.4 SD units, followed by a slight increase by 0.5–0.6 SD units at the zone boundary from SZA-4 to SZA-5 (at ca. 11,230 cal yr BP; Fig. 3).
On the second DCA axis, chironomid stratigraphy zone SZA-1 was separated clearly from the other zones. This separation manifested in a change of about 1.7–1.8 SD units close to the zone boundary from SZA-1 to SZA-2 (at ca. 16,335 cal yr BP; Fig. 3). After ca. 16,335 cal yr BP, the second DCA axis scores fluctuated between 0.4 SD units and 1.1 SD units (Fig. 3).
Chironomid-inferred summer air-temperature changes
The reconstructed July air temperatures (TVII) ranged between 7.1°C and 15.5°C and showed a RMSEP of 1.39°C based on the merged Norway-Swiss transfer function (NS-TF; Fig. 4). The DCA 2 axis scores and the chironomid-inferred summer air temperatures showed very similar tendencies (Fig. 5).
The most prominent change in summer air temperatures was noted at ca. 16,300 cal yr BP by an ~4.9–5.0°C increase and likely was associated with the transition from chironomid stratigraphy zone SZA-1 to SZA-2 (Fig. 4). In parallel, the most important assemblage change was detected at ca. 16,200–16,400 cal yr BP on DCA axis 2 (Fig. 3). The first temperature increase was followed by a second slight warming at ca. 14,700 cal yr BP by ~1.0°C. Then, between ca. 14,700 and 11,700 cal yr BP, chironomid-inferred mean temperatures fluctuated between ~13.3°C and 14.9°C. Finally, after ca. 11,700 cal yr BP, summer air temperatures showed an unexpected slight decreasing tendency by ~1.0–1.5°C (Fig. 4).
In the fossil chironomid assemblages, no rare taxa (Hill's N2 < 5) were found. The squared chi-square distance to the closest modern analogue showed “no close” analogue situation in 20.7% of the samples. Generally, analogue problems occurred in the samples between 16,300 and 11,700 cal yr BP, but it was the most expressed between ca. 13,100 and 11,500 cal yr BP (Fig. 4). Goodness-of-fit statistics showed “poor fit” and “very poor fit” with temperature in 10.9% and 5.4% of the fossil samples, respectively (Fig. 4).
DISCUSSION
Chironomid-inferred temperatures and related assemblage changes
This study provides the first chironomid-based temperature reconstruction from the Late Pleniglacial to the Early Holocene (between ca. 16,800 and 9100 cal yr BP) from the Eastern Carpathians. The reconstructed summer air temperatures showed some alterations likely associated with the major late glacial climatic events. At the same time, we registered a relatively minor but unexpected decrease in inferred temperature values at the onset of the Early Holocene (at ca. 11,700 cal yr BP), a period when other environmental factors than summer air temperature (pH and water depth) may also have had a major influence the chironomid fauna of Lake Saint Anne.
In general, five time intervals were separated in the chironomid record, which are in good agreement with pollen and plant macrofossil-based vegetation changes reported from the same sediment core (Magyari et al., Reference Magyari, Veres, Wennrich, Wagner, Braun, Jakab and Karátson2014b). The most prominent change appeared at ca. 16,350 cal yr BP (at ~1102-cm sediment depth) both in the composition of the midge assemblage and in the reconstructed summer air temperatures (Figs. 3, 4). Prior to ca. 16,350 cal yr BP, the chironomid assemblage was characterized by only 2–3 taxa, with dominance of Tanytarsus lugens-type and Procladius (Fig. 3). High relative abundance of T. lugens-type likely indicated nutrient-poor and cool lake conditions (e.g., Brooks et al., Reference Brooks, Langdon and Heiri2007; Heiri et al., Reference Heiri, Brooks, Birks and Lotter2011); however, both T. lugens-type and Procladius may inhabit deep water as well (Luoto, Reference Luoto2010; Engels and Cwynar, Reference Engels and Cwynar2011). Low nutrient levels are supported by the very low (< 6%) organic matter content of the sediment (expressed in loss-on-ignition; LOI). Additionally, high relative abundances of Juniperus and Poaceae pollen types agree with a cold and dry climate between ca. 17,300–16,780 cal yr BP (~1139–1116-cm sediment depth, Fig. 5; Magyari et al., Reference Magyari, Veres, Wennrich, Wagner, Braun, Jakab and Karátson2014b), possibly associated with the Heinrich stadial 1 in time or GS-2.1a in Greenland ice core records (Rasmussen et al., Reference Rasmussen, Bigler, Blockley, Blunier, Buchardt, Clausen and Cvijanovic2014).
Between ca. 16,350 and 14,450 cal yr BP (~1102–1072-cm sediment depth), taxon richness of chironomids started to increase, and the composition of midge assemblages also changed notably (Fig. 3). Microtendipes pedellus- and Chironomus anthracinus-type became dominant, suggesting increased temperatures and nutrient availability compared with the time interval before 16,350 cal yr BP (~1102-cm sediment depth). Additionally, Glyptotendipes, a taxon which is restricted to warmer lakes in European calibration datasets (e.g., Luoto, Reference Luoto2009; Heiri and Lotter, Reference Heiri and Lotter2001; Heiri et al., Reference Heiri, Brooks, Birks and Lotter2011) appeared in the record. Accordingly, at ca. 16,350 cal yr BP, chironomid-inferred summer air temperatures showed sharp increase by ~5.0°C (Figs. 4, 5). However, the estimated summer air-temperature increase was in contrast with relatively high relative abundance of T. lugens-type, a taxon that is usually restricted to relatively cool climate conditions (Brooks et al., Reference Brooks, Langdon and Heiri2007; Heiri et al., Reference Heiri, Brooks, Birks and Lotter2011), However, T. lugens-type can be found in small lakes with July air temperatures up to ~15–16°C, and can also persist in warm climates in deep, stratified lakes (Engels and Cwynar, Reference Engels and Cwynar2011). The presence of this taxon, together with Glyptotendipes, could therefore also be explained by increasing water depth, which would allow the coexistence of a warm-adapted littoral taxa such as Glyptotendipes, and a taxon that can survive in deep, cool water, such as Tanytarsus lugens-type. Pollen analysis of core SZA-2010 (Magyari et al., Reference Magyari, Veres, Wennrich, Wagner, Braun, Jakab and Karátson2014b) showed that at ca. 16,390 cal yr BP (at ~1103-cm sediment depth), relative abundances of Juniperus and Poaceae pollen types decreased, while boreal woodland cover (represented by Betula, Pinus, Larix, and Picea pollen) increased in the vicinity of the lake (Fig. 5). Additionally, increasing aquatic macrophyte and green algae (Potamogeton, Pediastrum, and Scenedesmus) relative abundances were detected (Magyari et al., Reference Magyari, Veres, Wennrich, Wagner, Braun, Jakab and Karátson2014b), while diatom diversity decreased and pointed to a gradual decrease in pH from slightly alkaline to neutral (Buczkó et al., Reference Buczkó, Máthé, Jakab, Tóth, Braun, Korponai, Ács, Karátson and Magyariin press). These proxy changes overall suggest relatively deep lacustrine conditions and increasing nutrient availability (note increasing LOI values from ~5–6% to 11%; Fig. 5). Increasing nutrient input was likely connected to intensifying chemical weathering and increased terrestrial nutrient input into the lake.
The following important change appeared at ca. 14,450 cal yr BP (at ~1072-cm sediment depth), likely associated with the beginning of the Late Glacial Interstadial (or Bølling/Allerød) as defined in Central Europe (e.g., Lotter et al., Reference Lotter, Eicher, Siegenthaler and Birks1992) or the GS-2/GI-1 transition apparent in the Greenland ice core records (Björck et al., Reference Björck, Walker, Cwynar, Johnsen, Knudsen, Lowe and Wohlfarth1998). At ca. 14,450 cal yr BP (~1072–1055-cm sediment depth) taxon richness of chironomids remained stable, but the composition of the assemblage changed notably and Dicrotendipes nervosus- and Tanytarsus mendax-type became dominant, replacing taxa such as Microtendipes pedellus-, Chironomus anthracinus-, and Tanytarsus lugens-type (Fig. 3). These changes would agree with increasing summer air temperatures and increasing nutrient availability in the lake (Brooks et al., Reference Brooks, Langdon and Heiri2007; Heiri et al., Reference Heiri, Brooks, Birks and Lotter2011) coinciding with increased LOI values (from ~11% to 29–30%). However, the chironomid-inferred summer air temperature increased only slightly by ~1.0°C at ca. 14,450 cal yr BP (Figs. 4, 5), partly because the warm-indicator Glyptotendipes disappeared from the record at this transition. In parallel, pollen data indicated afforestation in the vicinity of Lake Saint Anne between ca. 14,450 cal yr BP and 12,990 cal yr BP (~1072–1048-cm sediment depth), with an abrupt increase of Pinus and gradual increase of Betula, Larix, and Picea pollen percentages. Moreover, decreasing relative abundance of green algae together with the increasing organic matter may indicate decreasing water depth (Magyari et al., Reference Magyari, Veres, Wennrich, Wagner, Braun, Jakab and Karátson2014b) and/or decreasing pH as suggested by the diatom community changes (Buczkó et al., Reference Buczkó, Máthé, Jakab, Tóth, Braun, Korponai, Ács, Karátson and Magyariin press) in the period after ca. 14,450 cal yr BP. Dominant chironomid taxa in this part of the record (e.g., Tanytarsus pallidicornis-type, Dicrotendipes nervosus -type, Pseudochironomus) and ceratopogonids also prefer to live in shallow lakes or lakes with intermediate water depth (Engels and Cwynar, Reference Engels and Cwynar2011; Hájková et al., Reference Hájková, Pařil, Petr, Chattová, Grygar and Heiri2016), therefore changes in the dipteran assemblages are consistent with decreased water-depth during the late glacial interstadial at Lake Saint Anne.
Between ca. 13,125 and 11,290 cal yr BP (~1053–1025-cm sediment depth), changes in the chironomid assemblage were not as prominent as compositional changes of the pollen record within the same time interval (Fig. 5). One possible explanation of the weak faunal changes is that the small amplitude of the summer temperature change did not result in the crossing of ecological thresholds. Relative abundance of Artemisia and Poaceae increased between ca. 12,990 and 12,275 cal yr BP (~1048–1033-cm sediment depth), while arboreal pollen types decreased notably (Fig. 5; Magyari et al., Reference Magyari, Veres, Wennrich, Wagner, Braun, Jakab and Karátson2014b). This reexpansion of the xerophytic steppe elements possibly marked decreasing level of available moisture likely associated with the Younger Dryas cooling or GS-1 in the Greenland ice core records (Björck et al., Reference Björck, Walker, Cwynar, Johnsen, Knudsen, Lowe and Wohlfarth1998); however, its timing slightly differs from the GS-1 cooling event. This bias could be caused by the chronological uncertainty of the late glacial section of SZA-2010 sediment core probably due to the volcanic setting of Lake Saint Anne and by the very slow sediment accumulation during the late glacial that showed frequent changes on the basis of the pollen concentration record (Magyari et al., Reference Magyari, Veres, Wennrich, Wagner, Braun, Jakab and Karátson2014b). Despite the chronological uncertainties, LOI and high-resolution X-ray fluorescence scanning; (XRF, see Magyari et al., Reference Magyari, Veres, Wennrich, Wagner, Braun, Jakab and Karátson2014b) results also supported that the sediment section between ~1048 cm and 1033 cm possibly agreed with the Younger Dryas cooling. Generally, the Younger Dryas cooling was not visible in the chironomid-inferred summer air-temperature reconstruction. However, some taxa (e.g., T. mendax-type, Ablabesmyia, and Pseudochironomus) in the chironomid record and Ceratopogonidae also showed decreasing relative abundances between ca. 13,125 and 11,290 cal yr BP (between 1053–1025-cm sediment depth; Fig. 3), in accordance with vegetation changes. Later, at ca. 12,620 cal yr BP (at 1037-cm sediment depth), magnetic susceptibility values showed a decrease that likely corresponds with a dilution effect of increased in-lake and terrestrial productivity (Fig. 5; Veres et al., Reference Veres, Lallier-Vergès, Wohlfarth, Lacourse, Kéravis, Björck, Preusser, Andrieu-Ponel and Ampel2009). Moreover, organic matter content also started to increase again (from ~25–29% to 48%) just after ca. 12,530 cal yr BP (at 1035-cm sediment depth; Fig. 5). Based on the pollen record, a further afforestation started at ca. 12,275 cal yr BP (at 1033-cm sediment depth) indicated by a rapid increase of Ulmus and Betula relative abundances (Magyari et al., Reference Magyari, Veres, Wennrich, Wagner, Braun, Jakab and Karátson2014b), while increasing green algae abundances (Scenedesmus and Botryococcus) indicated warmer and shallower lake conditions (Magyari et al., Reference Magyari, Veres, Wennrich, Wagner, Braun, Jakab and Karátson2014b). All of these results indicate that the Younger Dryas cooling likely terminated at a point represented at ~1035–1033-cm sediment depth at ca. 12,530–12,275 cal yr BP based on our age-depth model in Lake Saint Anne, although the dating of this sediment section is uncertain, possibly due to very low sediment accumulation rates.
At the onset of the Early Holocene (at ca. 11,290 cal yr BP and ~1025-cm sediment depth), Procladius became dominant (between ca. 11,290 and 9120 cal yr BP or ~1025–1000-cm sediment depth) together with Chironomus anthracinus-type (between ca. 11,290 and 9960 cal yr BP or ~1025–1015-cm sediment depth) and Psectrocladius sordidellus-type (between ca. 9960 and 9120 cal yr BP or ~1015–1000-cm sediment depth) (Fig. 3). In parallel with the compositional change of the midge assemblage, summer air temperatures declined slightly by ~0.8–1.5°C at ca. 11,290 cal yr BP. The chironomid-based summer air-temperature decrease is in contrast with the obvious spread of deciduous trees indicated by the dominance of Ulmus, Fraxinus, Quercus, Tilia, and Corylus pollen types (Magyari et al., Reference Magyari, Veres, Wennrich, Wagner, Braun, Jakab and Karátson2014b), and globally increasing temperatures at the onset of the Early Holocene (e.g., Walker, Reference Walker1995; Birks and Amman, Reference Birks and Amman2000; Brooks and Birks, Reference Brooks and Birks2001). At the same time, clear indications of expansion of a Sphagnum bog, based on the Sphagnum-leaves concentration curve and increasing LOI values from 60 to 80% at ca. 11,290 cal yr BP, suggested a very organic-rich environment and peat accumulation in bog hollows with low pH.
Generally, the chironomid assemblage of Lake Saint Anne changed remarkably between 16,800 and 9120 cal yr BP, and some clear temperature changes were reconstructed at ca. 16,350 and at ca. 14,450 cal yr BP. However, the role of summer air temperature as a driving factor in the chironomid assemblage changes was not always evident. Between ca. 16,800 and 16,300 cal yr BP (~1117–1100-cm sediment depth) Procladius coexisted in the chironomid assemblage along with T. lugens-type, a taxon characterized by broad thermal tolerance and widespread occurrence along depth gradients (Brooks et al., Reference Brooks, Langdon and Heiri2007; Luoto, Reference Luoto2009, Heiri and Lotter, Reference Heiri and Lotter2001). At ca. 16,300 cal yr BP, Procladius was replaced by C. anthracinus-type, which is also known as an inhabitant of the profundal zone of low-elevation forested lakes (e.g., Walker et al., Reference Walker, Smol, Engstrom and Birks1991; Il'yashuk and Il'yashuk, Reference Il'yashuk and Il'yashuk2007; Engels and Cwynar, Reference Engels and Cwynar2011). However, presence of this taxon could also indicate increasing nutrient availability and increasing summer air temperature (Brooks et al., Reference Brooks, Langdon and Heiri2007; Heiri et al., Reference Heiri, Brooks, Birks and Lotter2011). At ca. 14,450 cal yr BP (at ~1072-cm sediment depth), deep-water inhabitants were replaced by other chironomids (e.g., M. pedellus-, D. nervosus-, and Ablabesmyia), which could indicate increasing nutrient availability and summer air temperature. These chironomids are abundant in shallow lakes in the littoral zone and are often associated with macrophytes (e.g., Brodersen et al., Reference Brodersen, Odgaard, Vestergaard and Anderson2001; Brooks et al., Reference Brooks, Langdon and Heiri2007; Engels and Cwynar, Reference Engels and Cwynar2011). Additionally, at ca. 14,100 cal yr BP (at ~1068-cm sediment depth), Sphagnum leaves appeared for the first time in constant numbers in the sediment (Fig. 5). This assemblage compositional change coincided in time with the most prominent change of DCA axis 1 scores by ~1.8–2.0 SD units (Fig. 3). Furthermore, DCA axis 1 scores show a continuous, gradual increase from ca. 12,840 cal yr BP (~1043-cm sediment depth), coinciding with gradually increasing Sphagnum leaf concentration (Fig. 5), possibly indicating a slightly decreasing pH of the lake water. In addition, proxy evidence (Magyari et al., Reference Magyari, Veres, Wennrich, Wagner, Braun, Jakab and Karátson2014b), as well as the ancient shorelines along Lake Saint Anna indicate that the lake experienced significant changes in water depth. Accordingly, water depth and pH changes from ca. 12,840 cal yr BP onwards may have influenced the chironomid assemblage changes in the lake during the late glacial. The dominant chironomids at the onset of the Early Holocene (C. anthracinus- and P. sordidellus-type) are able to tolerate low pH (e.g., Tátosová et al., Reference Tátosová, Veselỷ and Stuchlík2006; Brooks et al., Reference Brooks, Langdon and Heiri2007). This observation and the increasing Sphagnum dominance in shallow hollows and pools since ca. 11,415 cal yr BP (~1026-cm sediment depth) (Magyari et al., Reference Magyari, Veres, Wennrich, Wagner, Braun, Jakab and Karátson2014b) likely indicate further pH decrease during the Early Holocene in the lake. Additionally, the relatively low but stable presence of semi-terrestrial chironomids (e.g., Pseudorthocladius, Pseudosmittia, and Limnophyes) in this sediment section could indicate decreasing water depth. Therefore, lake-level changes together with Sphagnum-indicated decreasing pH, and hence decreasing nutrient level (Sphagnum moss acidifies its surroundings by cation exchange), could have overridden the effect of summer air-temperature changes on our chironomid assemblage in parts of our record, particularly during the Early Holocene, which may have caused a bias in the chironomid-inferred summer air-temperature reconstruction in the Early Holocene section (e.g., Velle et al., Reference Velle, Brodersen, Birks and Willassen2010). The diatom record also supports a dramatic pH decrease in the Early Holocene (Buczkó et al., Reference Buczkó, Máthé, Jakab, Tóth, Braun, Korponai, Ács, Karátson and Magyariin press)
Temperature changes in a regional context
The time period between ca. 16,800 and 14,450 cal yr BP corresponds broadly with the GS-2.1a stadial in the Greenland ice core records (Rasmussen et al., Reference Rasmussen, Bigler, Blockley, Blunier, Buchardt, Clausen and Cvijanovic2014), and covers the period with Heinrich event 1 (H1) as well as the period of warming after the event that has been reported from other parts of Europe (e.g., Samartin et al., Reference Samartin, Heiri, Lotter and Tinner2012; Bolland et al., Reference Bolland, Rey, Gobet, Tinner and Heiri2020). Heinrich events are defined by the existence of layers of ice-rafted debris (IRD) of mainly Laurentide origin in North Atlantic sediment cores (Hemming, Reference Hemming2004; Stanford et al., Reference Stanford, Rohling, Bacon, Roberts, Grousset and Bolshaw2011; Rasmussen et al., Reference Rasmussen, Bigler, Blockley, Blunier, Buchardt, Clausen and Cvijanovic2014). Generally, only a few records exist in Central-Eastern Europe that are older than 14,700 cal yr BP (e.g., Willis et al., Reference Willis, Rudner and Sümegi2000; Kuneš et al., Reference Kuneš, Pelánková, Chytrý, Jankovská, Pokorný and Petr2008; Andrič et al., Reference Andrič, Massaferro, Eicher, Ammann, Leuenberger, Martinčič, Marinova and Brancelj2009; Horsák et al., Reference Horsák, Chytrý, Pokryszko, Danihelka, Ermakov, Hájek and Hájkova2010; Sümegi et al., Reference Sümegi, Magyari, Dániel, Molnár and Törőcsik2013; Feurdean et al., Reference Feurdean, Perşoiu, Tanţău, Stevens, Magyari, Onac and Marković2014; Magyari et al., Reference Magyari, Kunes, Jakab, Sümegi, Pelánková, Schäbitz, Braun and Chytrý2014a, Reference Magyari, Pál, Vincze, Veres, Jakab, Braun, Szalai, Szabó and Korponai2019). However, available data suggests that the Carpathians were likely covered by open forest mixed with steppe-tundra vegetation between ca. 20,000 and 14,700 cal yr BP (Willis et al., Reference Willis, Rudner and Sümegi2000; Kuneš et al., Reference Kuneš, Pelánková, Chytrý, Jankovská, Pokorný and Petr2008; Andrič et al., Reference Andrič, Massaferro, Eicher, Ammann, Leuenberger, Martinčič, Marinova and Brancelj2009; Feurdean and Tanţău, Reference Feurdean, Tanţău, Rădoane and Vespremeanu-Stroe2017). This interpretation generally agrees with pollen and plant macrofossil records of Lake Saint Anne, with clear dominance of Juniperus pollen type between ca. 17,800–16,800 cal yr BP, indicating a cool and dry climate at the lake (Magyari et al., Reference Magyari, Veres, Wennrich, Wagner, Braun, Jakab and Karátson2014b; present study). One of the few other chironomid-inferred quantitative summer air-temperature reconstructions covering the same time period as the SZA record comes from the Southern Alps at Lago di Origlio (Samartin et al., Reference Samartin, Heiri, Lotter and Tinner2012). At Lago di Origlio (situated at 416 m asl, modern TVII: 20.7°C), the chironomid-inferred July air temperature was estimated around 10°C prior to 16,000 cal yr BP with Poaceae, Artemisia, and Juniperus dominating the vegetation in the vicinity of the lake (Tinner et al., Reference Tinner, Hubschmid, Wehrli, Ammann and Conedera1999; Samartin et al., Reference Samartin, Heiri, Lotter and Tinner2012). At Lake Saint Anne (at 946 m asl, modern TVII: 15°C), the chironomid-inferred summer air-temperature reconstruction is estimated at ~8–10°C between ca. 16,800 and 16,350 cal yr BP, with very similar vegetation as has been reported for Lago di Origlio (Magyari et al., Reference Magyari, Veres, Wennrich, Wagner, Braun, Jakab and Karátson2014b). Even though the modern climate of the southerly alpine site is considerably warmer, the similar vegetation and inferred July mean temperatures between 16,000 and 16,800 cal yr BP suggest that the amplitude of the LGM cooling was likely less in the more continental Eastern Carpathians than in the Southern Alps. After ca. 16,000 cal yr BP at Lago di Origlio, and after ca. 16,350 cal yr BP at Lake Saint Anne, a sharp temperature increase was detected in both records; however, the amplitude of this temperature rise differed at the two locations. At Lake Saint Anne (46°N; 25°S), summer air temperature increased by ~4.9–5.0°C, while at Lago di Origlio (46°N; 8°S), located southwest and at ~500 m lower elevation than Lake Saint Anne, temperature increased by ~2.5°C. Moreover, pollen-based summer temperature reconstructions from the Great Hungarian Plain also support these early warming inferences with the amplitude of warming after H1 being ~2oC at this lowland location (Magyari et al., Reference Magyari, Pál, Vincze, Veres, Jakab, Braun, Szalai, Szabó and Korponai2019). Recently, a chironomid-based temperature reconstruction covering the interval from 18,000 cal yr BP to 14,000 cal yr BP has been interpreted from northern Switzerland (Bolland et al., Reference Bolland, Rey, Gobet, Tinner and Heiri2020). In this sequence, July air temperatures around 9°C again have been inferred for the earliest part of the record. Around 16,000 cal yr BP, chironomid assemblages indicated a warming trend, with inferred July air temperatures reaching ~12°C just before the transition to the Bølling period ca. 14,700 cal yr BP. Although this trend also reveals a transition to warmer temperatures, the temperature increase has been inferred to be more gradual in northern Switzerland than in southern Switzerland or at Lake Saint Anne. Vegetation records from south of the Alps, and, more recently, several pollen records from the lowlands north of the Alps, indicated important changes in local vegetation (reforestation in the south, shift from tundra to tree-tundra in the north) that support a warming of European summer temperatures during this time interval (Vescovi et al., Reference Vescovi, Ravazzi, Arpenti, Finsinger, Pini, Valsecchi, Wick, Ammann and Tinner2007; Rey et al., Reference Rey, Gobet, van Leeuwen, Gilli, van Raden, Hafner, Wey, Rhiner, Schmocker, Zünd and Tinner2017, Reference Rey, Gobet, Schwörer, Hafner, Szidat and Tinner2020).
At ca. 14,450 cal yr BP, at around the Oldest Dryas/Bølling transition in Europe (note age-depth model uncertainties in the Lake Saint Anne record), or at the GS-2/GI-1 transition in Greenland ice core records (Björck et al., Reference Björck, Walker, Cwynar, Johnsen, Knudsen, Lowe and Wohlfarth1998), we estimated a slight temperature increase by ~1.0°C at Lake Saint Anne. This temperature increase showed very small change in comparison with other chironomid-inferred temperature reconstruction from the Southern Carpathians by ~2.8°C (Tóth et al., Reference Tóth, Magyari, Brooks, Braun, Buczkó, Bálint and Heiri2012) and many other European reconstructions by ~3–4°C (see Heiri et al., Reference Heiri, Brooks, Renssen, Bedford, Hazekamp, Il'yashuk and Jeffers2014). This small-amplitude temperature increase also falls short of expectations when compared to general circulation-model-based TVII estimates of Renssen and Isarin (Reference Renssen and Isarin2001) and Renssen et al. (Reference Renssen, Isarin and Vandenberghe2002) for the Eastern Carpathians, where model simulation suggests 2.0–4.0°C increase in TVII and also shows that continental Europe was few degrees warmer than present during the Bølling interstadial under influence of relatively high summer insolation. At the same time, validation statistics of our temperature reconstruction showed increasing analogue problems after ca. 14,450 cal yr BP (~1072-cm sediment depth); and therefore, the estimated weak chironomid-inferred temperature increase could be the result of progressively poorer modern analogies in the transfer function applied to the Lake Saint Anne record (Fig. 4). As previously discussed above, water level- and pH changes likely have also had an important influence on chironomid assemblage changes in this lake together with changes in temperature conditions.
During the late glacial interstadial, or GI-1 interstadial in Greenland ice core records (Björck et al., Reference Björck, Walker, Cwynar, Johnsen, Knudsen, Lowe and Wohlfarth1998), from ca. 14,450 cal yr BP onwards, chironomid-inferred temperatures fluctuated strongly between ~13.4–15.5°C at Lake Saint Anne. These estimated mean July air temperatures coincide with other chironomid-inferred summer air temperatures from the Southern Carpathians (Tóth et al., Reference Tóth, Magyari, Brooks, Braun, Buczkó, Bálint and Heiri2012) and from Western Europe (e.g., Heiri and Millet, Reference Heiri and Millet2005; Heiri et al., Reference Heiri, Cremer, Engels, Hoek, Peeters and Lotter2007), assuming a 0.6°C lapse rate per 100 m (Micu et al., Reference Micu, Dumitrescu, Cheval, Birsan, Micu, Dumitrescu, Cheval and Birsan2015; estimated to ~12.5–15.8°C if corrected to the altitude of Lake Saint Anne). The maximum chironomid-inferred July mean temperatures of GI-1 at Lake Saint Anne exceed the modern value (15°C) by about 0.5°C, but only for a short period between 16.3–16 ka and at 13.4 ka (Fig. 4). This result partially supports the model-simulation-based inference of Renssen et al. (Reference Renssen, Isarin and Vandenberghe2002) that continental Europe summer temperature was slightly warmer during the Bølling interstadial (~(GI-1e) than modern July temperatures. Otherwise, most of the GI-1 chironomid-inferred July mean temperature results were similar or cooler than of the modern value. Following the late glacial interstadial, the Younger Dryas cold phase, or GS-1 stadial in Greenland ice core records (Björck et al., Reference Björck, Walker, Cwynar, Johnsen, Knudsen, Lowe and Wohlfarth1998), is detectable based on the pollen record; however, it is dated between ca. 13,300 and 12,300 cal yr BP at Lake Saint Anne, although the dating of this sediment section is uncertain possibly due to very low sediment accumulation rates. Chironomid-inferred summer air temperatures do not show any distinct change at this time that could indicate a cooling event. This resembles patterns in other chironomid-based summer temperature estimates from the region (see Płóciennik et al., Reference Płóciennik, Self, Birks and Brooks2011; Tóth et al., Reference Tóth, Magyari, Brooks, Braun, Buczkó, Bálint and Heiri2012), where only slight temperature decreases were noted during GS-1 stadial. However, the chironomid-based temperature reconstruction from Lake Saint Anne is potentially significantly biased because of analogue problems (Fig. 4) and water table/pH changes in this sediment section. In addition, because the lake is located between different mountain chains (Fig. 1), the location may also be characterized by unusual local climate conditions that may not represent the larger-scale regional climate development in other parts of Europe.
In the Early Holocene (at ca. 11,300 cal yr BP or ~1025-cm sediment depth), a slight temperature decrease was reconstructed based on chironomids at Lake Saint Anne. This temperature change is unusual when compared with other chironomid-based paleotemperature records from Europe, which mostly show a pronounced increase in inferred temperature at the beginning of the Holocene (e.g., Heiri and Millett, Reference Heiri and Millet2005; Il'yashuk et al., Reference Il'yashuk, Gobet, Heiri, Lotter, van Leeuwen, van der Knaap, Il'yashuk, Oberli and Ammann2009; Tóth et al., Reference Tóth, Magyari, Buczkó, Braun, Panagiotopoulos and Heiri2015). However, some records from Eastern Europe show very minor increases in inferred temperature at this transition (Płóciennik et al., Reference Płóciennik, Self, Birks and Brooks2011; Tóth et al., Reference Tóth, Magyari, Brooks, Braun, Buczkó, Bálint and Heiri2012). At the same time, based on our study, environmental factors other than summer air temperature may have had a major effect on chironomid assemblages in the lake during this period. Based on autecological requirements of the chironomids that were found in the sediment representing this time period (ca. 11,500–9090 cal yr BP), decreasing water depth and Sphagnum-indicated decreasing pH could be the most relevant environmental changes that may have affected chironomid assemblage change, and led to unusual inferred temperature values in this section of the record. This interpretation is also supported by the fact that diffuse CO2 emissions continue from the crater at present (Frunzeti and Baciu, Reference Frunzeti and Baciu2012). We cannot exclude that the Early Holocene acidic environment was linked to intensified CO2 upwellings that, via dissolution, contributed to acidification of the lake.
CONCLUSIONS
In this study, we tested two hypotheses. According to our first hypothesis, the amplitude of the Younger Dryas summer mean temperatures decrease was less in continental CEE due to the diminishing impact of the North Atlantic meridional overturning circulation changes. Our chironomid-based July mean-temperature reconstruction shows no significant change during this time period, suggesting that for the Eastern Carpathians, this assumption is valid, with the chironomid-based temperature record from Lake Saint Anne being the second record to support this assumption. We also demonstrate that the terrestrial vegetation in this region clearly pointed to steppe expansion; therefore, available moisture likely decreased during the Younger Dryas. According to our second hypothesis, the amplitude of warming after H1 reached the amplitude of the late glacial warming due to polar circulation intensity decrease at this time, while an AMOC intensity increase, together with high summer insolation, was the driver of the observed July temperature increase at 14,700 cal yr BP (Stanford et al., Reference Stanford, Rohling, Bacon, Roberts, Grousset and Bolshaw2011). Our chironomid-based July mean-temperature reconstruction indicates that the most prominent July mean temperature changes are apparent at ca. 16,350 and ca. 14,450 cal yr BP, and the change at ca. 16,350 cal yr BP was associated with a ~5.0°C increase, suggesting significant summer warming similar to warming that has been reported from other terrestrial records in central and southern Europe. In contrast, the assemblage change at ca. 14,450 cal yr BP was associated with only a slight increase in chironomid-inferred July air temperatures by ~1.0°C. In this regard, our reconstruction demonstrated a lower amplitude warming that disagrees with other regional records (e.g. Lake Brazi, Fig. 1; Tóth et al., Reference Tóth, Magyari, Brooks, Braun, Buczkó, Bálint and Heiri2012). Finally, in the Early Holocene (dated to ca. 11,300 cal yr BP), we noted an unexpected minor decrease in July mean temperatures by ~0.8–1.5°C, although analogue statistics and increased signs of paludification (i.e., Sphagnum remains) indicate that temperature inferences in this part of the record are problematic.
We conclude that the Lake Saint Anne chironomid record was affected by several environmental changes, such as major water-depth fluctuations and paludification, that likely influenced our paleotemperature reconstruction. In addition, with the exception of the temperature increase at ca. 16,350 cal yr BP, most changes were within the error of the applied transfer function. Independent paleotemperature records from the region that would allow an assessment of which features of the temperature record are supported by independent paleoclimate records and which features may represent the influence of non-climatic factors on the chironomid assemblages are not available at present. Such a comparison would be particularly important for Lake Saint Anne because the lake is situated in an unusual orographic position within the Carpathian arch, with mountain chains potentially isolating it from larger-scale circulation patterns (Fig. 1). Deviations in the temperature reconstruction from expected patterns could therefore be explained by influences other than temperature (i.e., local limnological changes or even local microclimatic conditions) biasing the inferred temperature record.
Financial Support
This study was supported by the Hungarian Scientific Research Fund (OTKA NF101362, K83999, K129167) and by the GINOP-2.3.2-15-2016-00019 project. MT acknowledges the support of the János Bolyai Research Scholarship of the Hungarian Academy of Sciences and the support of NTP NFTÖ (NTP-NFTÖ-18-B-0149).


 Open access