




I. INTRODUCTION
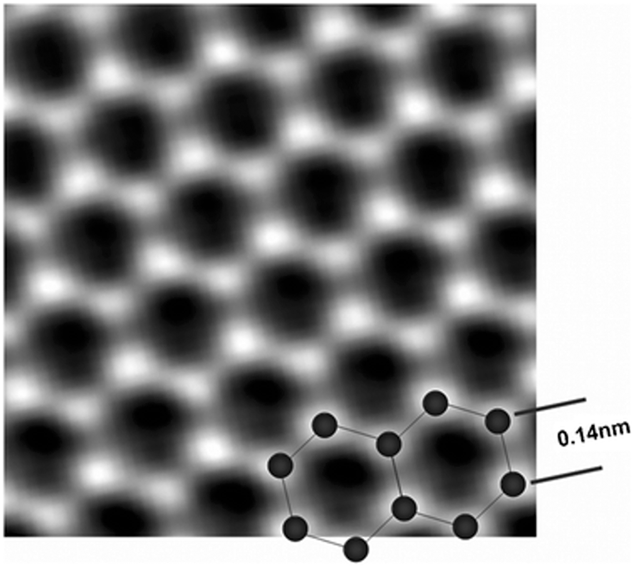
Graphene is a single layer of sp 2-bonded carbon atoms arranged in a honeycomb structure (Fig. 1). A pristine graphene sheet has a Young’s modulus of 1000 GPaReference Lee, Wei, Kysar and Hone1,Reference Liu, Ming and Li2 and an ultimate tensile strength of 130 GPa.Reference Lee, Wei, Kysar and Hone1 For comparison, A36 steel exhibits a Young’s modulus of 200 GPaReference Celentano, Cabezas, García and Monsalve3 and an ultimate tensile strength of 0.4 GPa.Reference Celentano, Cabezas, García and Monsalve3,Reference Murty, Mathew, Wang, Shah and Haggag4 The thermal conductivity of the two-dimensional material is greater than 3000 W/(m K) near room temperature,Reference Ghosh, Calizo, Teweldebrhan, Pokatilov, Nika, Balandin, Bao, Miao and Lau5,Reference Shahil and Balandin6 and the electron mobility of suspended graphene sheets is as high as 200,000 cm2/(V s) at low temperatures.Reference Du, Skachko, Barker and Andrei7,Reference Bolotin, Sikes, Jiang, Klima, Fudenberg, Hone, Kim and Stormer8
An atomic resolution image of a clean and structurally perfect graphene sheet synthesized in an atmospheric plasma. Individual carbon atoms appear white in the image. The image was obtained through the reconstruction of the electron exit wave function from 15 lattice images using MacTempas Version 2 software. Reproduced from Ref. Reference Dato, Lee, Jeon, Erni, Radmilovic, Richardson and Frenklach36 with permission from the Royal Society of Chemistry. MacTempas is developed by Total Resolution LLC, Berkeley, CA, USA.
Graphene powder has numerous applications. For example, multifunctional polymer-matrix nanocomposites with enhanced mechanical,Reference Young, Kinloch, Gong and Novoselov9 electrical,Reference Wang, Yu, Dai, Song, Wang, Zeng and Jiang10,Reference Li, Kuan, Chen, Kuan, Yip, Chiu and Chiang11 and thermalReference Shtein, Nadiv, Buzaglo, Kahil and Regev12 properties have been fabricated using graphene powder as a filler. Friction tests have revealed that lubricant oils containing graphene powder have significantly lower wear and coefficient of friction than oils containing graphite or carbon black.Reference Dou, Koltonow, He, Jang, Wang, Chung and Huang13 Flexible displaysReference Huang, Huang, Liang, Wan and Chen14 and chemical sensorsReference Dua, Surwade, Ammu, Agnihotra, Jain, Roberts, Park, Ruoff and Manohar15 can be created using electrically conductive inks containing graphene powder.Reference Secor, Ahn, Gao, Lewis and Hersam16–Reference Torrisi, Hasan, Wu, Sun, Lombardo, Kulmala, Hsieh, Jung, Bonaccorso, Paul, Chu and Ferrari18 Additionally, extensive research has been conducted on the use of graphene powder in energy storage applications,Reference Raccichini, Varzi, Passerini and Scrosati19,Reference Zhu, Yang, Yin, Yan and Zhang20 such as lithium-ion batteriesReference Zhu, Yang, Yin, Yan and Zhang20–Reference Hassoun, Bonaccorso, Agostini, Angelucci, Betti, Cingolani, Gemmi, Mariani, Panero, Pellegrini and Scrosati22 and capacitors.Reference Zhu, Murali, Stoller, Ganesh, Cai, Ferreira, Pirkle, Wallace, Cychosz, Thommes, Su, Stach and Ruoff23,Reference Stoller, Park, Zhu, An and Ruoff24
Pure and highly ordered graphene powder can be continuously synthesized in the gas phase using atmospheric plasmas. This single-step process occurs at ambient conditions, without the use of substrates, catalysts, solvents, or acids. The objective of this review is to increase the awareness and understanding of gas phase–synthesized graphene (GSG). This article will present the research conducted on GSG and the current understanding of the mechanisms of GSG formation in atmospheric plasmas. This paper will also discuss the challenge of low GSG production rate and will anticipate future research that could potentially overcome this challenge. Furthermore, the structure, composition, features, and applications of GSG will be highlighted. The production of GSG will then be compared with other methods of obtaining graphene, including plasma-enhanced chemical vapor deposition (PECVD), micromechanical cleavage, the reduction of graphene oxide, and the liquid-phase exfoliation of graphite.
II. ATMOSPHERIC PLASMA SYNTHESIS OF GRAPHENE
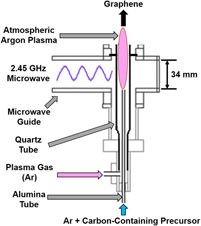
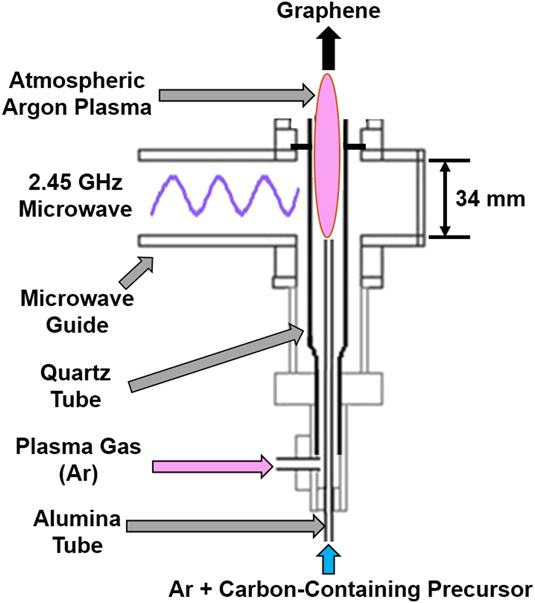
The production of GSG involves the delivery of a carbon-containing precursor, such as ethanol, into an atmospheric pressure microwave-generated Ar plasmaReference Dato, Radmilovic, Lee, Phillips and Frenklach25,Reference Dato and Frenklach26 (Fig. 2). Precursors enter the region of the plasma where microwave power is absorbed by the plasma electrons (this region is hereafter referred to as the coupler region). Plasma electrons transfer energy to heavy particles (ions and neutral atoms) through elastic and inelastic collisions in the coupler region, which is an environment that has an electron density ≥1013 cm−3 and gas temperatures as high as 3000 K.Reference Melero, Rincón, Muñoz, Zhang, Sun, Perez, Royuela, González-Gago and Calzada27–Reference Tsyganov, Bundaleska, Tatarova, Dias, Henriques, Rego, Ferraria, Abrashev, Dias, Luhrs and Phillips29 Precursors that enter the coupler region are decomposed into smaller reactive fragments, such as C, H, H2, C2, C2H2, and CO.Reference Melero, Rincón, Muñoz, Zhang, Sun, Perez, Royuela, González-Gago and Calzada27–Reference Tatarova, Henriques, Luhrs, Dias, Phillips, Abrashev and Ferreira31 These reactive fragments then flow out of the coupler region and into the plasma afterglow, where they react to form nuclei that rapidly grow into GSG.Reference Dato and Frenklach26,Reference Tsyganov, Bundaleska, Tatarova, Dias, Henriques, Rego, Ferraria, Abrashev, Dias, Luhrs and Phillips29 The entire process of precursor delivery, decomposition, and GSG formation takes place over a time period on the order of 10−1 s.Reference Dato, Radmilovic, Lee, Phillips and Frenklach25,Reference Tatarova, Dias, Henriques, Rego, Ferraria, Abrashev, Luhrs, Phillips, Dias and Ferreira28 GSG sheets exit the plasma afterglow and are typically collected downstream from the plasma on filters.Reference Dato, Radmilovic, Lee, Phillips and Frenklach25,Reference Tatarova, Dias, Henriques, Rego, Ferraria, Abrashev, Luhrs, Phillips, Dias and Ferreira28
Schematic of an atmospheric pressure microwave plasma reactor used to produce GSG.
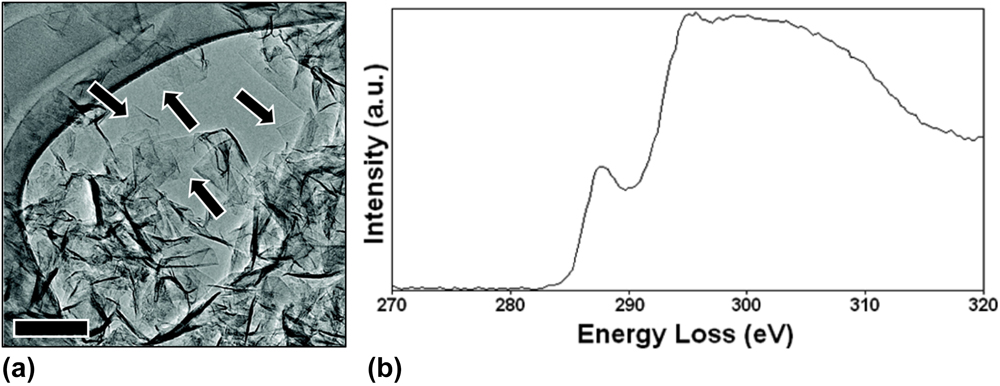
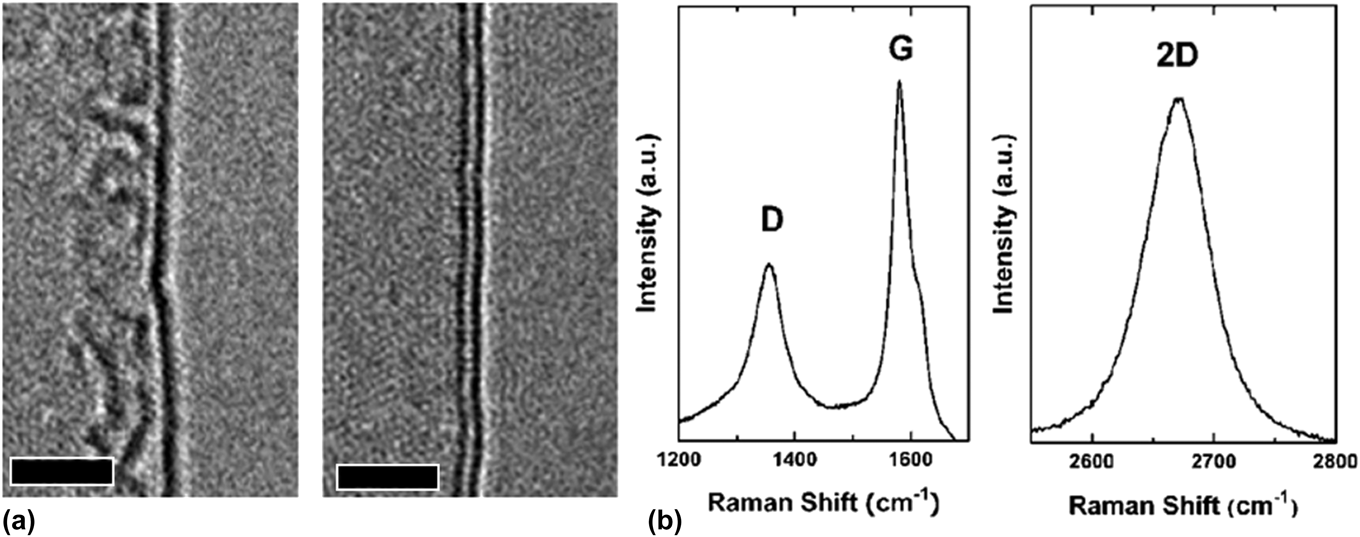
A number of materials characterization techniques have shown that GSG powder is highly ordered and pure. Low-magnification transmission electron microscopy (TEM) images have revealed that the synthesized powder consists of crumpled and randomly oriented sheets [Fig. 3(a)]. Results from the electron energy loss spectroscopy (EELS) characterization of GSG show a peak at 285 eV that corresponds to transitions from the 1 s to the π* states and a peak at 291 eV that corresponds to transitions from the 1 s to the σ* states [Fig. 3(b)].Reference Berger, McKenzie and Martin32–Reference Münzer, Xiao, Sehlleier, Schulz and Wiggers35 These peaks are characteristic of graphite and graphene. High-magnification TEM images of GSG have shown that the synthesized powder consists of monolayer and few-layer sheets [Fig. 4(a)]. The aberration-corrected TEM image shown in Fig. 1 demonstrates that GSG has a highly ordered two-dimensional honeycomb lattice of carbon atoms, which is characteristic of pristine graphene.Reference Dato, Lee, Jeon, Erni, Radmilovic, Richardson and Frenklach36 The Raman spectrum of GSG shown in Fig. 4(b) exhibits peaks that are characteristic of graphene, such as a sharp, symmetric 2D peak at ∼2660 cm−1, which is the second order of zone-boundary phononsReference Ferrari, Meyer, Scardaci, Casiraghi, Lazzeri, Mauri, Piscanec, Jiang, Novoselov, Roth and Geim37; a G peak at ∼1580 cm−1, which is due to the doubly degenerate zone center E2g modeReference Ferrari, Meyer, Scardaci, Casiraghi, Lazzeri, Mauri, Piscanec, Jiang, Novoselov, Roth and Geim37,Reference Tuinstra and Koenig38 ; and a peak at ∼1350 cm−1 called the D peak,Reference Ferrari, Meyer, Scardaci, Casiraghi, Lazzeri, Mauri, Piscanec, Jiang, Novoselov, Roth and Geim37,Reference Tuinstra and Koenig38 which is caused when edges of GSG are captured in a Raman laser spot.Reference Malard, Pimenta, Dresselhaus and Dresselhaus39
(a) A typical low-magnification TEM image of crumpled and randomly oriented GSG sheets freely suspended on a lacey carbon TEM grid. Homogeneous and featureless regions (indicated by arrows) indicate regions of monolayer graphene. Scale bar represents 100 nm. (b) EELS spectrum of GSG. Reprinted (adapted) with permission from Dato et al.: Substrate-free gas-phase synthesis of graphene sheets. Nano Lett. 8, 2012 (2008). Copyright 2008 American Chemical Society.
(a) High-magnification image of single-layer and bilayer GSG. Scale bars represent 2 nm. (b) Raman spectrum of GSG. Reprinted with permission from Dato et al.: Substrate-free gas-phase synthesis of graphene sheets. Nano Lett. 8, 2012 (2008). Copyright 2008 American Chemical Society.
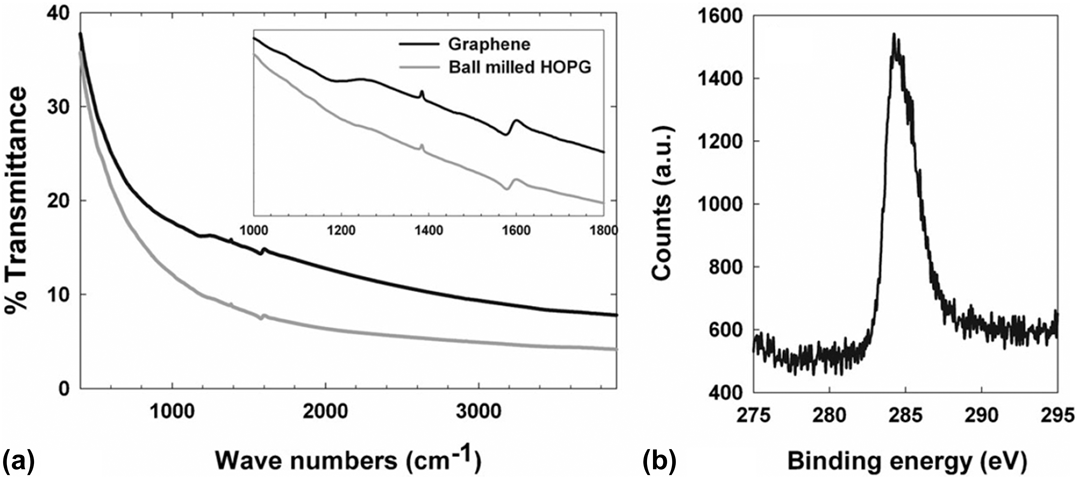
GSG has a mass composition of 98.9% C, 1.0% H, and 0.1% O, as determined by elemental analysis by combustion.Reference Dato, Lee, Jeon, Erni, Radmilovic, Richardson and Frenklach36 The Fourier transform infrared spectroscopy and X-ray photoelectron spectroscopy results shown in Fig. 5 provide additional evidence that the purity of GSG is similar to highly oriented pyrolytic graphite (HOPG), which is 99.9% C. Thus, GSG is similar to the high-quality graphene specimens obtained through the micromechanical cleavage of HOPG.Reference Ferrari, Meyer, Scardaci, Casiraghi, Lazzeri, Mauri, Piscanec, Jiang, Novoselov, Roth and Geim37,Reference Meyer, Geim, Katsnelson, Novoselov, Booth and Roth40
(a) A Fourier transform infrared spectroscopy spectra of GSG and HOPG. The similar features of the HOPG and GSG between 1000 and 1800 cm−1 are shown in the inset. (b) An X-ray photoelectron spectroscopy spectrum of GSG. Reproduced from Ref. Reference Dato, Lee, Jeon, Erni, Radmilovic, Richardson and Frenklach36 with permission from the Royal Society of Chemistry.
III. FACTORS THAT INFLUENCE GRAPHENE SYNTHESIS IN ATMOSPHERIC PLASMAS
A. Reactor design, pressure, and microwave forward power
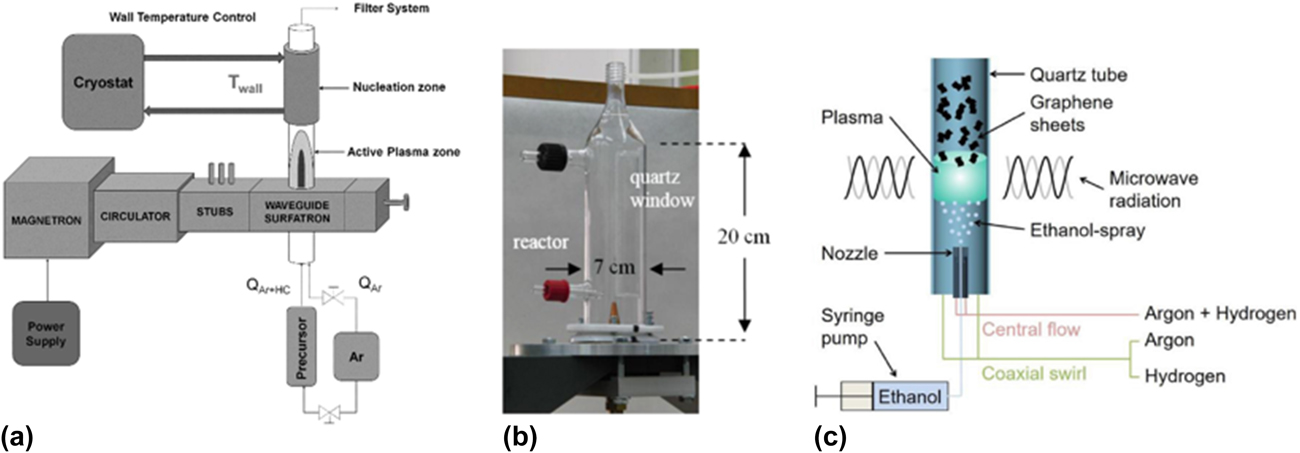
The production of GSG was first achieved using the atmospheric pressure microwave plasma torch shown in Fig. 2.Reference Dato, Radmilovic, Lee, Phillips and Frenklach25 Since this discovery, plasma reactors with different designs have been utilized to create GSG.Reference Melero, Rincón, Muñoz, Zhang, Sun, Perez, Royuela, González-Gago and Calzada27–Reference Tatarova, Henriques, Luhrs, Dias, Phillips, Abrashev and Ferreira31,Reference Münzer, Xiao, Sehlleier, Schulz and Wiggers35,Reference Jo, Chang, Kim, Choi, Park, Lee and Jang41–Reference Tatarova, Dias, Henriques, Abrashev, Bundaleska, Kovacevic, Bundaleski, Cvelbar, Valcheva, Arnaudov, do Rego, Ferraria, Berndt, Felizardo, Teodoro, Strunskus, Alves and Goncalves43 For example, GSG can be produced through the delivery of ethanol into surface wave–induced microwave plasmas at atmospheric conditionsReference Tatarova, Dias, Henriques, Rego, Ferraria, Abrashev, Luhrs, Phillips, Dias and Ferreira28,Reference Tsyganov, Bundaleska, Tatarova, Dias, Henriques, Rego, Ferraria, Abrashev, Dias, Luhrs and Phillips29,Reference Tatarova, Henriques, Luhrs, Dias, Phillips, Abrashev and Ferreira31 [Fig. 6(a)]. A Torche à Injection Axiale sur Guide d’Ondes (TIAGO)Reference Rincón, Marinas, Muñoz and Calzada44–Reference Moisan, Zakrzewski and Rostaing47 can also generate atmospheric pressure Ar plasmas that are capable of creating GSG.Reference Melero, Rincón, Muñoz, Zhang, Sun, Perez, Royuela, González-Gago and Calzada27 A TIAGO consists of a waveguide whose central section is reduced in height [Fig. 6(b)]. Ar plasmas are generated by flowing Ar gas through a hollow metallic rod placed perpendicular to the waveguide in this central section. The introduction of ethanol vapor into the TIAGO results in the deposition of GSG on the walls of the reactor. Another reactor design that is capable of producing GSG consists of a microwave slot antenna connected to a microwave generator [Fig. 6(c)]. Such a reactor can ignite and sustain atmospheric plasmas from an Ar/H2 gas mixture.Reference Münzer, Xiao, Sehlleier, Schulz and Wiggers35 GSG forms when an aerosol consisting of liquid ethanol and Ar/H2 is delivered into the reactor using a dual-flow nozzle system and a syringe pump.
(a) Schematic of a surface wave–induced microwave plasma reactor. Reproduced from Tatarova et al.: Microwave plasma based single step method for free standing graphene synthesis at atmospheric conditions. Appl. Phys. Lett. 103, 134, 101 (2013), with the permission of AIP Publishing. (b) A TIAGO reactor. Reprinted with permission from Ref. Reference Melero, Rincón, Muñoz, Zhang, Sun, Perez, Royuela, González-Gago and Calzada27. (c) Schematic of a microwave slot antenna system. Reprinted from Wiggers et al.: All gas-phase synthesis of graphene: Characterization and its utilization for silicon-based lithium-ion batteries. Electrochim. Acta 272, 52–59 (2018), with permission from Elsevier.
The production of GSG using different types of reactors demonstrates that atmospheric pressure plasmas sustained by 2.45 GHz microwave generators create an environment that is conducive to the synthesis of graphene. However, lower reactor pressures are not favorable to the formation of GSG.Reference Melero, Rincón, Muñoz, Zhang, Sun, Perez, Royuela, González-Gago and Calzada27 This is because atmospheric plasmas are collisional environments that can achieve the high gas temperatures (3000 K) required for the formation of carbon nanostructures. Collisions between electrons and heavy particles are reduced in sub-atmospheric microwave plasmas, which results in decreased temperatures that prevent the formation of GSG.Reference Melero, Rincón, Muñoz, Zhang, Sun, Perez, Royuela, González-Gago and Calzada27 On the other hand, a higher reactor pressure (1.5 atm) has been shown to increase production rates of GSG.Reference Münzer, Xiao, Sehlleier, Schulz and Wiggers35 Despite the increase in GSG formation at higher pressure, future research should concentrate on optimizing the synthesis of GSG in atmospheric pressure environments because production at ambient conditions will greatly facilitate the large-scale production of the material.
GSG can form over a broad microwave forward power (MFP) range between 250 and 1050 WReference Dato and Frenklach26 in the plasma torch design shown in Fig. 2. This indicates that the nucleation and growth of GSG do not occur in the coupler region of microwave-generated plasmas.Reference Dato and Frenklach26 Instead, the role of the coupler region in the synthesis process is the dissociation of ethanol into reactive fragments, such as C, C2, C2H2, and H. Indeed, the presence of these fragments in the coupler region has been detected using optical emission spectroscopy during GSG synthesis experiments.Reference Tsyganov, Bundaleska, Tatarova, Dias, Henriques, Rego, Ferraria, Abrashev, Dias, Luhrs and Phillips29 The afterglows of plasmas generated by atmospheric plasma torches have been characterized,Reference Chen and Phillips48 and studies have shown that gas temperatures in the afterglow region are not significantly affected by increases in MFP. These results indicate that the fragments created in the coupler region react to form GSG in the plasma afterglow.
However, MFP can have an effect on the synthesized structures in reactors of different design. GSG can be produced in the surface wave reactor shown in Fig. 6(a) at MFPs between 500 and 900 W. Reducing the MFP in this system to 400 W results in the formation of carbon nanoparticles when all other experimental parameters are held constant.Reference Tatarova, Henriques, Luhrs, Dias, Phillips, Abrashev and Ferreira31 In contrast, TIAGO torches [Fig. 6(b)] operate at lower MFPs than surface wave reactors during GSG production. Thus, the effect of MFP range on GSG formation can vary between reactors of different designs.
The carbon structures that deposit on the walls of various atmospheric plasma reactors provide additional evidence of the effect of reactor design on GSG production. In the surface wave reactor shown in Fig. 6(a), solid materials that deposit on the walls of the reactor are carbonaceous nanoparticles, whereas the materials that exit the reactor are GSG.Reference Tsyganov, Bundaleska, Tatarova, Dias, Henriques, Rego, Ferraria, Abrashev, Dias, Luhrs and Phillips29 In contrast, Fig. 7 shows that the materials that deposit on the walls of the atmospheric plasma torch shown in Fig. 2 are GSG sheets. These deposits are located between 0 and 100 mm above the coupler region of the reactor. Furthermore, GSG produced in TIAGO reactors [Fig. 6(b)] are collected from reactor walls, which are in close proximity to the Ar plasma.Reference Melero, Rincón, Muñoz, Zhang, Sun, Perez, Royuela, González-Gago and Calzada27 The role of the coupler region in atmospheric plasma reactors could be similar from system to system. However, the variation in MFP conditions and the difference in materials deposited on the walls of various reactors suggest that the mechanisms of GSG formation are dependent on reactor design.
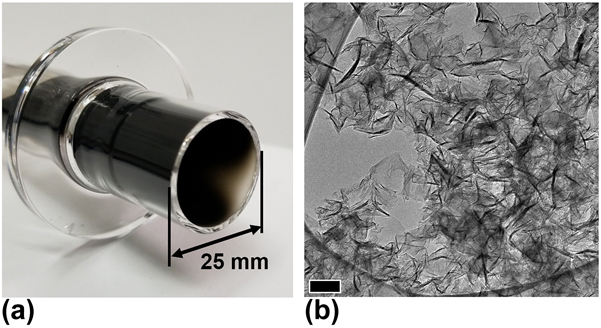
(a) Solid carbon deposits on the walls of the atmospheric plasma torch shown in Fig. 2. (b) TEM image that shows the deposits are GSG. Scale bar represents 100 nm.
B. Precursor composition
GSG forms when liquid ethanol dropletsReference Dato, Radmilovic, Lee, Phillips and Frenklach25,Reference Dato and Frenklach26,Reference Münzer, Xiao, Sehlleier, Schulz and Wiggers35,Reference Dato, Lee, Jeon, Erni, Radmilovic, Richardson and Frenklach36,Reference Jo, Chang, Kim, Choi, Park, Lee and Jang41 or ethanol vaporReference Melero, Rincón, Muñoz, Zhang, Sun, Perez, Royuela, González-Gago and Calzada27–Reference Tsyganov, Bundaleska, Tatarova, Dias, Henriques, Rego, Ferraria, Abrashev, Dias, Luhrs and Phillips29,Reference Tatarova, Henriques, Luhrs, Dias, Phillips, Abrashev and Ferreira31 are delivered into atmospheric Ar plasmas. It is currently unknown if the phase of ethanol has an effect on the rate of GSG formation. A study that compares GSG production rates when liquid-phase and vapor-phase ethanol are delivered into the same reactor under similar experimental conditions is needed. Initial research into the effects of precursor composition on the formation of GSG investigated the delivery of three precursors into atmospheric plasmas: liquid methanol (CH4O) droplets, dimethyl ether (C2H6O) vapor, and liquid isopropanol (C3H8O) droplets.Reference Dato and Frenklach26 Solid material cannot be obtained with methanol, while isopropanol results in the creation of soot particles instead of GSG. However, GSG can form through the use of dimethyl ether, which is an isomer of ethanol. Therefore, precursor composition has a significant effect on the formation of GSG.
Soot formation from isopropanol provides insight into the mechanisms of solid carbon production in atmospheric Ar plasmas. Soot has been the subject of a large amount of experimental and computational research for decades,Reference Frenklach49 and the prevailing theory of soot formation is that individual particles are formed from polycyclic aromatic hydrocarbon (PAH) nuclei. In both oxidative and non-oxidative environments, PAHs are formed from reactive species such as C2H2, C3H3, and H. PAHs then undergo abstraction by H and subsequently grow through the addition of acetylene molecules. Once formed, PAHs collide and stick to each other to form PAH dimers. The collision of PAH dimers with other PAHs then results in the formation of PAH trimers, PAH tetramers, and so on. As these collisions occur, individual PAH molecules within these clusters grow via chemical reactions at their edges. These processes continue until PAH clusters evolve into individual soot particles. Thus, soot formation in atmospheric plasmas is evidence that reactive fragments, such as C2H2, C, C2, and H, are produced in the gas-phase synthesis process.
The lack of solid materials formed through the delivery of methanol further supports this theory, since the compound consists of a single C atom, whereas ethanol, dimethyl ether, and isopropanol contain multiple C atoms. Relative to ethanol, dimethyl ether, and isopropanol, the formation of a C–C bond through the dissociation of methanol is much more of a challenge. The formation of a lower number of C–C bonds can result in less reactive fragments being created, which results in a decreased number of aromatic species. Furthermore, the limited amount of C2H2 also hinders the growth of any aromatic rings that do form. Therefore, the formation of a relatively smaller number of PAHs from the dissociation of methanol may prevent the nucleation of a sufficient number of aromatic species and their subsequent growth into solid carbon structures.
A graphene sheet can be thought of as a large PAH molecule. The formation of graphene from ethanol and dimethyl ether is possibly the result of the slow nucleation of a small number of initial aromatic rings followed by their fast growth into large 2D sheets in the high temperature environment created by an atmospheric plasma.Reference Dato and Frenklach26 Compared with ethanol, the dissociation of isopropanol creates an overabundance of PAHs that subsequently experience multiple collisions with other PAHs to form clusters. These clusters then grow, coagulate, and aggregate to form chains of soot particles.
The gaseous by-products of GSG production have been determined to be H2 and CO.Reference Tatarova, Dias, Henriques, Rego, Ferraria, Abrashev, Luhrs, Phillips, Dias and Ferreira28–Reference Rincón, Melero, Jiménez and Calzada30,Reference Rincón, Jiménez, Muñoz, Sáez and Calzada45,Reference Jiménez, Rincón, Marinas and Calzada50,Reference Jiménez, Yubero and Calzada51 Thus, the presence of O in alcohols may also affect the structures of the synthesized nanomaterials. GSG produced through the delivery of ethanol contains only 0.1% O.Reference Dato, Lee, Jeon, Erni, Radmilovic, Richardson and Frenklach36 This indicates that C and O atoms that are created from the decomposition of ethanol must be reacting to form CO during the gas-phase synthesis process. Methanol consists of a single C atom and a single O atom, and the formation of C–C bonds may compete with the formation of C–O bonds. CO is relatively unreactive, and its formation in the non-oxidative environment of atmospheric Ar plasmas may capture most of the C atoms present, which prevents the formation of C–C bonds and aromatic rings when methanol is used as a precursor. Ethanol and isopropanol each contain a single O atom per multiple C atoms. Even if each O atom bonds with a C atom to form CO, additional C atoms are still available to form C–C bonds.
The ratio of C to H molecules may also have an effect on GSG production. Dimethyl ether, ethanol, methanol, and isopropanol all contain a single O atom. However, GSG can be created through the delivery of ethanol and dimethyl ether, which have a C/H ratio of 0.333. Carbonaceous structures are not produced through the delivery of methanol, which has a C/H ratio of 0.250. Isopropanol, which has a C/H ratio of 0.375, results in soot particles. Therefore, these results indicate that a range of precursor C/H ratios that promote the formation of GSG may exist between the C/H ratios of methanol and isopropanol.
Further research into precursor composition should focus on determining a C/H ratio that maximizes GSG production, as well as elucidating the role of O in the production of GSG. Recently, the delivery of methane (CH4) into atmospheric Ar plasmas resulted in the production of relatively small amounts of GSG sheets among carbon nanoparticles.Reference Bundaleska, Tsyganov, Dias, Felizardo, Henriques, Dias, Abrashev, Kissovski and Tatarova52 This result suggests that O may not be required for the formation of GSG. A carbon-containing gas, such as acetylene (C2H2), could potentially be used to produce GSG since it is a precursor for the formation of aromatic nuclei and does not contain oxygen that results in the creation of CO. The synthesis of GSG through the use of dimethyl etherReference Dato and Frenklach26 or methaneReference Bundaleska, Tsyganov, Dias, Felizardo, Henriques, Dias, Abrashev, Kissovski and Tatarova52 demonstrates that ethanol is not the sole precursor for GSG formation. Future GSG studies should investigate the use of gaseous precursors that can facilitate the production of GSG, since the use of gases eliminates the additional time and energy required to atomize or vaporize ethanol.
C. Flow rates of gases and precursors
The residence times of precursors and reactive fragments in atmospheric plasma reactors are strongly affected by the flow rate of the gases used to generate the plasmas. Residence time has a significant influence on the materials produced in the gas-phase synthesis process. A longer residence time that results from a reduction in plasma gas flow rate can enable individual GSG sheets to stack with other sheets to form bulk graphite structures, as well as promote the formation of polyhedral graphitic particles with hollow centers.Reference Dato and Frenklach26
The formation of polyhedral graphitic particles in atmospheric plasmasReference Dato and Frenklach26 provides additional evidence of the presence of C, C2, and PAHs in the gas-phase synthesis process. Polyhedral graphitic particles produced by arc discharge have been speculated to originate from carbonaceous clusters that form due to the condensation of C vapor in inert gas atmospheres.Reference Ugarte53–Reference Ugarte56 These clusters resemble individual spherical soot particles.Reference Ugarte53,Reference Saito, Yoshikawa, Inagaki, Tomita and Hayashi54 The clusters grow into larger particles via coagulation and maintain a structural fluidity due to the high temperatures (3500 K) and the bombardment of ions and electrons in the arc discharge.Reference Saito, Yoshikawa, Inagaki, Tomita and Hayashi54 Because of this fluidity, the particles have been referred to as “liquid carbon droplets.”Reference Ugarte53 Graphitization of these droplets occurs during cooling, which proceeds from the surface of the particles to the center.Reference Ugarte53,Reference Saito, Yoshikawa, Inagaki, Tomita and Hayashi54 Graphite planes are initiated at the outer surface of a particle, and internal planes form and remain parallel to the outer layers as the particle cools.Reference Ugarte53,Reference Saito, Yoshikawa, Inagaki, Tomita and Hayashi54 The flat planes of the shells consist of hexagonal rings, and the corners of the particles are a result of pentagonal rings. This graphitization process results in polyhedral graphite particles with hollow centers, which form because the density of graphitized carbon (2.2 g/cm3) is higher than that of amorphous carbon (1.5 g/cm3).Reference Ugarte53,Reference Saito, Yoshikawa, Inagaki, Tomita and Hayashi54 The resulting structure minimizes dangling bonds and lowers the energy of the graphite particle.Reference Saito, Yoshikawa, Inagaki, Tomita and Hayashi54
The flow rate of ethanol can also affect the synthesis of GSG because this factor can increase the mass flux of carbon into atmospheric plasmas.Reference Tatarova, Dias, Henriques, Rego, Ferraria, Abrashev, Luhrs, Phillips, Dias and Ferreira28 Indeed, amorphous carbon structures can be produced instead of GSG in atmospheric plasma reactors by increasing the mass flow rate of ethanol by 600% with all other experimental parameters fixed. The effect of high ethanol flow rates is similar to the effect of using isopropanol as a precursor. Lower flow rates of ethanol result in the formation of a small amount of nuclei surpassing the critical size for nucleation and growth. Conditions in which no supersaturation of species is possible given the limited flux of carbon promotes the growth of existing nuclei into large GSG sheets rather than the creation of new nuclei.Reference Tatarova, Dias, Henriques, Rego, Ferraria, Abrashev, Luhrs, Phillips, Dias and Ferreira28 An increase in the flux of ethanol results in the creation of more nuclei, which leads to the formation of soot particles.
The current knowledge on the effects of precursor and plasma gas flow rates on GSG formation indicates that it may be possible to produce the material from carbon precursors with compositions that are different from ethanol by changing the residence time. Future studies can determine if GSG forms from isopropanol if the plasma gas flow rate is increased and the flow rate of isopropanol is decreased. Alternatively, an increase in methanol flow rate and decreased plasma gas flow rate could result in GSG formation. The flow rates of gases and precursors have a significant effect on the synthesis of graphene in plasmas and require further study.
IV. THE MAIN CHALLENGE OF GRAPHENE SYNTHESIS IN ATMOSPHERIC PLASMAS
The low rate of production is the main challenge in synthesizing graphene in atmospheric plasmas. GSG has been produced at rates ranging from 10−3 to 10−1 g/h from a single reactor. Milligram-scale quantities of GSG are sufficient for the research and development of applications in the laboratory. However, the production rate of GSG must be greatly increased for the industrial manufacturing of these applications. Future research into the mechanisms of GSG formation could uncover a plasma reactor design, precursor, and experimental condition that enable a single reactor to achieve a production rate that exceeds 101 g/h, which is a rate that has been reported for contemporary top-down processes.Reference Abdolhosseinzadeh, Asgharzadeh and Seop Kim57
A promising reactor design is the TIAGO torch because it allows for the generation of multiple atmospheric plasmas simultaneously from a single waveguide.Reference Melero, Rincón, Muñoz, Zhang, Sun, Perez, Royuela, González-Gago and Calzada27,Reference Moisan, Zakrzewski and Rostaing47 A TIAGO system capable of sustaining four atmospheric plasmas has been demonstrated,Reference Moisan, Zakrzewski and Rostaing47 and such a system can result in a 4-fold increase in GSG production. Therefore, an array of atmospheric plasmas operating from a single microwave power generator is a viable pathway to industrial GSG production. However, a bottleneck in the TIAGO synthesis process lies in the collection of GSG powder. The deposition of GSG on the walls of an array of TIAGO reactors would necessitate the termination of the production process to procure GSG from reactor walls. A reactor design that employs the parallel plasma generation of the TIAGO design and downstream GSG collection of the plasma torch design could enable the continuous large-scale synthesis of GSG.
To date, a statistical design of experiments (DoE)Reference Weissman and Anderson58 aimed at maximizing the production of GSG has not been reported in literature. Single variable tests to determine the effect of MFP, precursor composition, precursor flow rates, and plasma gas flow rates on GSG have been reported.Reference Dato and Frenklach26,Reference Tatarova, Dias, Henriques, Rego, Ferraria, Abrashev, Luhrs, Phillips, Dias and Ferreira28 However, DoE studies could elucidate the influences and interactions of numerous factors on the synthesis of GSG, which could result in the discovery of an experimental condition that maximizes production rate. Much has yet to be learned about the synthesis of graphene in atmospheric plasmas. As the number of researchers investigating GSG increases, so does the possibility of the development of an industrial-scale GSG production process.
V. FEATURES AND POTENTIAL APPLICATIONS OF GSG
A. Purity and structure for TEM imaging and optoelectronics
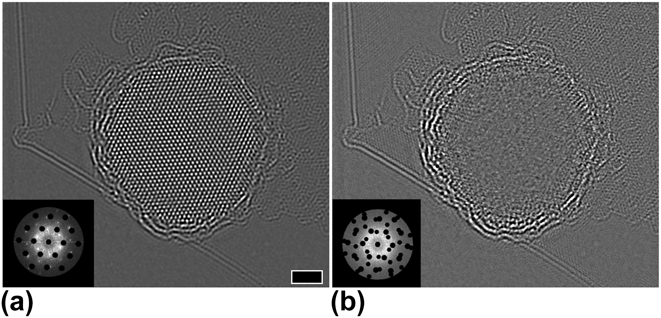
The pure and highly ordered nature of GSG make it an ideal support film for the TEM imaging of nanomaterials. Atomic resolution imaging of nanoparticles and the direct observation of the interfaces between soft and hard materials have been achieved using GSG as an atomically thin TEM support film.Reference Lee, Jeon, Dato, Erni, Richardson, Frenklach and Radmilovic59 For example, an enhanced-contrast filtered image of a gold nanoparticle and its surrounding citrate capping layer is shown in Fig. 8(a). This was achieved by blocking the reflections of the underlying GSG support film from the image’s digital diffractogram [Fig. 8(a), inset]. The subsequent subtraction of the gold nanoparticle’s reflection from the digital diffractogram [Fig. 8(b), inset] enabled the isolated imaging of citrate molecules for the first time [Fig. 8(b)]. In another study, the superior performance of GSG over conventional amorphous carbon support films was demonstrated when GSG was used to image Si nanocrystals and their capping ligands.Reference Panthani, Hessel, Reid, Casillas, José-Yacamán and Korgel60
Graphene-enabled isolation and imaging of citrate molecules. (a) An enhanced-contrast filtered image of the citrate-capped gold nanoparticle. Inset: The graphene reflections were subtracted in a digital diffractogram of the entire image. Scale bar represents 2 nm. (b) An image of the citrate molecules. Inset: The graphene and gold reflections were masked in the digital diffractogram to isolate and image citrate. Reprinted with permission from Lee et al.: Direct imaging of soft–hard interfaces enabled by graphene. Nano Lett. 9, 3365 (2009). Copyright 2009 American Chemical Society.
A challenge in using GSG as a TEM support film arises from its crumpled morphology, random orientation of sheets, and the presence of bilayer and few-layer graphene. For nanoparticles to be imaged on GSG, a monolayer region that contains a nanoparticle must be found. This procedure can take considerable time. In contrast, TEM support films fabricated from graphene prepared by the micromechanical cleavage methodReference Meyer, Kisielowski, Erni, Rossell, Crommie and Zettl61,Reference Meyer, Girit, Crommie and Zettl62 consist of high-quality monolayer regions with dimensions on the order of tens of micrometers.Reference Meyer, Girit, Crommie and Zettl62 Finding nanomaterials on monolayer graphene in these support films is relatively straightforward when compared with GSG.
The advantage of GSG support films over other graphene-coated TEM grids lies in preparation. GSG support films are prepared via a three-step process that involves dispersing GSG in a solvent, depositing a drop of solvent on a conventional TEM grid containing an amorphous support, and allowing the solvent to evaporate. Using this process, dozens of TEM grids can be coated with GSG in minutes. In comparison, it can take hours to micromechanically cleave HOPG, find monolayer graphene on a substrate using optical microscopy, and transfer the graphene to a TEM grid without contaminating it. TEM grids coated with graphene obtained by chemical vapor deposition methods can also take hours to produce, since individual sheets need to be removed from substrates and transferred to TEM grids without contamination.
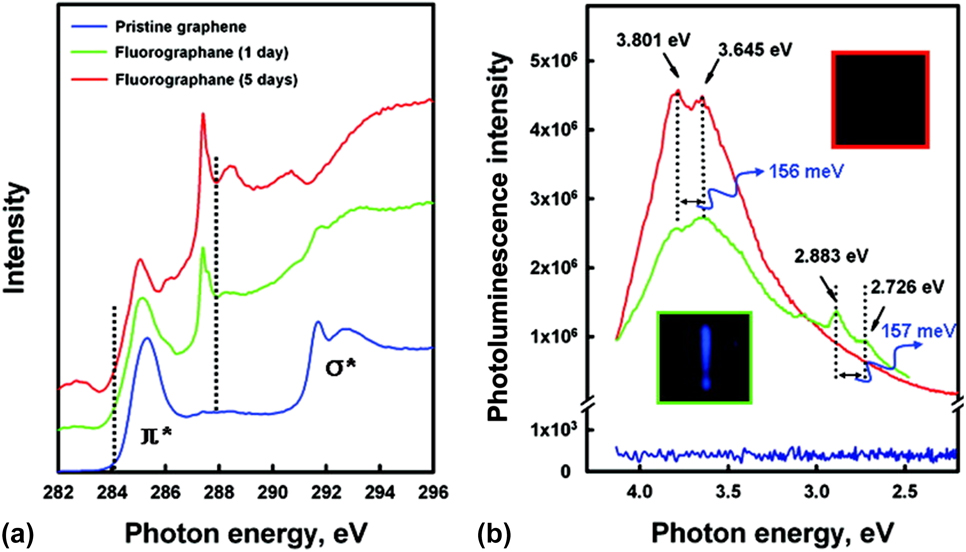
The purity and structure of GSG also enable the creation of partially fluorinated graphene that exhibits a band gap. For example, fluorographene was created by reacting GSG with xenon difluoride at 250 °C.Reference Jeon, Lee, Pollak, Moreschini, Bostwick, Park, Mendelsberg, Radmilovic, Kostecki, Richardson and Rotenberg63 Pristine graphene does not exhibit a band gap,Reference Geim and Novoselov64–Reference Novoselov, Geim, Morozov, Jiang, Zhang, Dubonos, Grigorieva and Firsov66 and near-edge X-ray absorption fine structure (NEXAFS) and photoluminescence (PL) spectroscopy have been used to show that GSG also does not exhibit a band gap.Reference Jeon, Lee, Pollak, Moreschini, Bostwick, Park, Mendelsberg, Radmilovic, Kostecki, Richardson and Rotenberg63 The fluorination of GSG changes the pure sp 2-carbon structure of graphene to a sp 3-derived carbon–fluorine structure, which results in the formation of a band gap. The NEXAFS and PL measurements shown in Fig. 9 indicate that the band gap of fluorographene is at least 3.8 eV. This band gap is wide enough for optoelectronic applications in the blue/UV spectrum, which means that fluorographene has the potential to be used in electronic, optoelectronic, and energy harvesting applications.Reference Jeon, Lee, Pollak, Moreschini, Bostwick, Park, Mendelsberg, Radmilovic, Kostecki, Richardson and Rotenberg63
Band gap opening of fluorographene. (a) NEXAFS spectra of GSG and fluorographene with two different contents of fluorine. The dashed lines at 284.1 and 287.9 eV mark the leading edges of the π* resonance for the pristine and fluorinated GSG sample, respectively. (b) Room temperature photoluminescence emission of the GSG/fluorographene dispersed in acetone using 290 nm (4.275 eV) excitation. The dotted lines are used for guiding eyes. The interval of dotted line is ∼156 meV. Optical images (top view) of the blue emission observed after the PL emission was recorded with the samples in 3.5 mL quartz cuvettes. The blue light persists ∼30 s after the excitation laser is turned off. Reprinted with permission from Jeon et al.: Fluorographene: a wide band gap semiconductor with ultraviolet luminescence. ACS Nano 5, 1042 (2011). Copyright 2011 American Chemical Society.
B. Nanoparticle dispersion for catalysis and energy storage
In addition to improving the TEM characterization of nanomaterials, a GSG sheet can prevent the aggregation of nanoparticles deposited on its surfaceReference Jeon and Lee67 and enhance their performance in catalysis and energy storage applications.Reference Münzer, Xiao, Sehlleier, Schulz and Wiggers35,Reference Jo, Chang, Kim, Choi, Park, Lee and Jang41 In a recent study, gold nanoparticles of increasing diameter were dispersed on GSG sheets.Reference Jeon and Lee67 It was discovered that nanoparticles with diameters below 10 nm did not aggregate on GSG and had a tendency to be located on the edges of the sheets [Fig. 10(a)]. This result shows that GSG sheets containing sub-10 nm nanoparticles could potentially be used in catalysis.Reference Planeix, Coustel, Coq, Brotons, Kumbhar, Dutartre, Geneste, Bernier and Ajayan68 A high reactive surface area of catalytic nanoparticles is crucial in catalysis, and the agglomeration of nanoparticles is a problem in this application. GSG can overcome this problem by dispersing sub-10 nm nanoparticles to maximize their surface area.Reference Jeon and Lee67
Nanoparticles supported by GSG. (a) 10 nm gold nanoparticles on GSG. Reprinted with permission from Ref. Reference Jeon and Lee67. (b) Platinum nanoparticles on GSG. Reprinted with permission from Ref. Reference Jo, Chang, Kim, Choi, Park, Lee and Jang41.
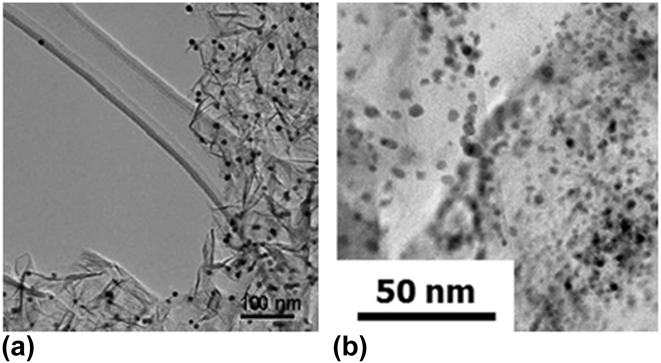
Indeed, the enhanced catalytic activity of GSG sheets decorated with sub-10 nm Pt nanoparticles has been demonstrated.Reference Jo, Chang, Kim, Choi, Park, Lee and Jang41 Pt/GSG composites [Fig. 10(b)] have been prepared and used as a direct methanol fuel cell electrocatalyst.Reference Jo, Chang, Kim, Choi, Park, Lee and Jang41 Cyclic voltammetry measurements showed that GSG sheets containing 20 wt% Pt nanoparticles exhibited superior catalytic activity toward the oxidation of methanol compared with commercially available Pt/C composites [Fig. 11(a)], which was attributed to the dispersion of Pt nanoparticles on GSG and the high conductivity of the GSG sheets. Furthermore, these Pt/GSG composites outperformed other composites consisting of Pt and graphene produced by the reduction of graphene oxide in the methanol oxidation reaction.Reference Jo, Chang, Kim, Choi, Park, Lee and Jang41
(a) Cyclic voltammetry measurements for methanol oxidation reaction catalyzed by commercial Pt/C (carbon black) and Pt/GSG composite in the mixture solution of 0.05 M H2SO4 + 1 M CH3OH within the potential range of 0–1.0 V. Reprinted with permission from Ref. Reference Jo, Chang, Kim, Choi, Park, Lee and Jang41. (b) Galvanostatic cycling performance of pristine Si, Si-GSG, and Si-RGO composites measured at 0.5 C charge/discharge. Delithiation/lithiation and the Coulombic efficiency of Si-GSG and Si-RGO composites are shown in comparison with pristine silicon nanoparticles. The first two cycles for all materials were carried out at 0.025 C for lithiation and 0.05 C for delithiation and 0.1 C (for all lithiation and delithiation), respectively. The inset shows the normalized data for Si-GSG and Si-RGO clearly indicating the superior long-term stability of the Si-GSG composite. Reprinted from Wiggers et al.: All gas-phase synthesis of graphene: Characterization and its utilization for silicon-based lithium-ion batteries. Electrochim. Acta 272, 52–59 (2018), with permission from Elsevier.
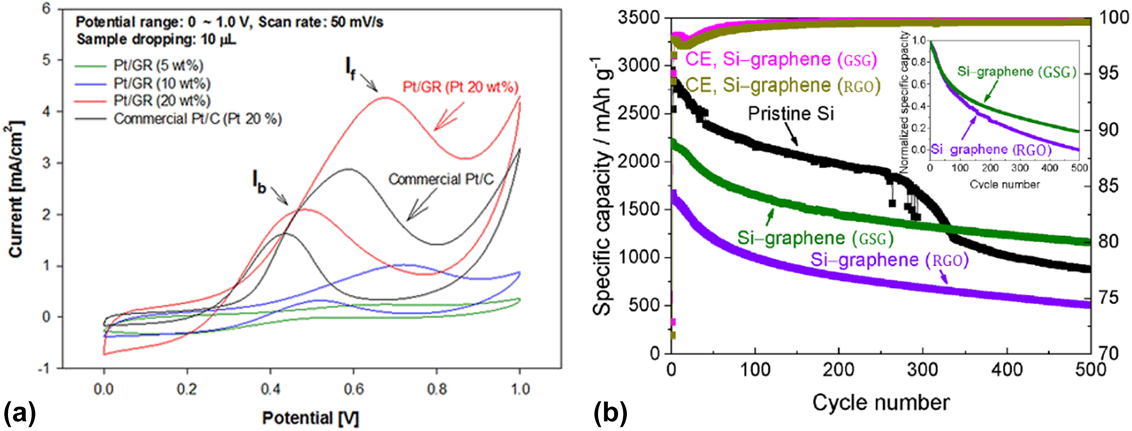
GSG sheets containing Si nanoparticles have been used as Li-ion battery anodes.Reference Münzer, Xiao, Sehlleier, Schulz and Wiggers35 Relative to anodes consisting of pristine Si nanoparticles and composite anodes consisting of Si nanoparticles and reduced graphene oxide (RGO), GSG can significantly enhance the long-term stability and Coulomb efficiency of anodes consisting of Si nanoparticles dispersed on GSG sheets [Fig. 11(b)].
Thus, GSG can disperse nanoparticles on its surface and can also have a synergistic effect with the nanomaterials. However, there is a size limit to the dispersive capability of GSG, since gold nanoparticles larger than 50 nm in diameter did not disperse in GSG but rather aggregated randomly throughout the sheets.Reference Jeon and Lee67 Additional research is needed to determine the limits of the dispersive capability of GSG. Furthermore, the performance of GSG in a number of graphene–nanoparticle composite applications is unknown. For example, GSG–copper nanoparticle composites could potentially be used in electrochemical sensing of carbohydratesReference Chen, Zhang and Chen69 and GSG sheets decorated with silver nanoparticles could be used in molecularly selective surface-enhanced Raman scattering.Reference Murphy, Huang and Kamat70
C. Graphitic nanocrystals for lubrication
The morphology of crumpled graphene has been compared with that of crumpled paper.Reference Tatarova, Dias, Henriques, Abrashev, Bundaleska, Kovacevic, Bundaleski, Cvelbar, Valcheva, Arnaudov, do Rego, Ferraria, Berndt, Felizardo, Teodoro, Strunskus, Alves and Goncalves43,Reference Bundaleska, Tsyganov, Dias, Felizardo, Henriques, Dias, Abrashev, Kissovski and Tatarova52 However, GSG may be crumpled because of the presence of graphitic nanocrystals in the synthesized sheets.Reference Lin, Yu, Dato, Krauss and Marks71 In situ TEM has revealed that graphitic nanocrystals provide GSG with additional mechanical stability, enable the material to reversibly deform, and prevent GSG from being flattened like paper.Reference Lin, Yu, Dato, Krauss and Marks71 Graphitic nanocrystals, such as the one circled in Fig. 12(a), are defined as features on a GSG sheet consisting of small, dark needle-like regions. These features are rigid and do not change structurally during the deformation of GSG.
Folding and unfolding of GSG. (a) A crumpled GSG sheet with a graphitic nanocrystal (circled) making contact with an AFM tip. (b and c) The GSG sheet was moving from left to right in this sequence, while the AFM tip was stationary. The GSG sheet with nanocrystal folded as it maintained contact with the AFM tip. The nanocrystal remained rigid and did not change structurally. (d) The GSG sheet rapidly reverted to its initial configuration as it detached from the AFM tip. (e–h) Graphical models showing the structural changes that occurred as the sheet was sliding against the tip. Scale bars: 50 nm. Reprinted from Marks et al.: In situ observations of graphitic staples in crumpled graphene. Carbon 132, 760 (2018), with permission from Elsevier.
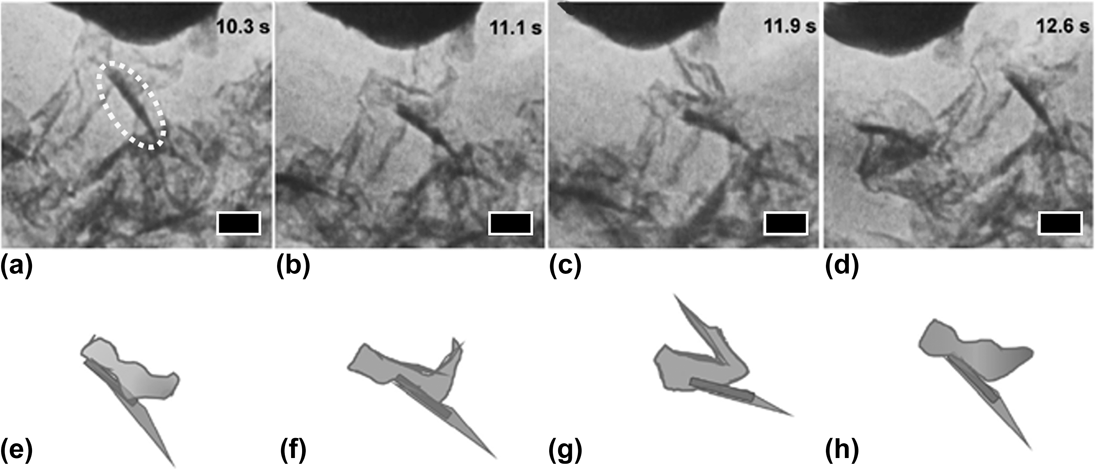
Figure 12 shows a series of in situ TEM images that demonstrate the reversible deformation of GSG. The initial form of a GSG sheet with a nanocrystal as it makes contact with an atomic force microscopy (AFM) tip is shown in Fig. 12(a). Figures 12(b) and 12(c) show how the sheet folds into itself as it slides past the AFM tip. However, the graphitic nanocrystal maintains the sheet’s structure during this process. As shown in Fig. 12(d), the rigid nanocrystal enables the GSG sheet to revert back to its original form when it detaches from the AFM tip. A graphical model of this process is shown in Figs. 12(e)–12(h). This phenomenon was reproducible, and the results demonstrate that the folding and unfolding of crumpled GSG is reversible.
The nanocrystals that maintain the morphology of GSG can make the sheets useful in lubrication applications, where a crumpled morphology has been shown to prevent aggregation and re-stacking in lubricant oils.Reference Dou, Koltonow, He, Jang, Wang, Chung and Huang13 Aggregation is a great challenge for ultrafine particle additives in lubricant oils because the phenomenon reduces effective particle concentrations, prevents particles from entering the working area of surfaces, and results in unstable tribological performance.Reference Dou, Koltonow, He, Jang, Wang, Chung and Huang13 Indeed, the deliberate crumpling of flat graphene into graphene balls causes the crumpled material to self-disperse in oils.Reference Dou, Koltonow, He, Jang, Wang, Chung and Huang13 Lubricants containing graphene balls exhibit lower coefficients of friction and reduced wear compared with oils containing flat graphene flakes, carbon black nanoparticles, or graphite powder.Reference Dou, Koltonow, He, Jang, Wang, Chung and Huang13 It is therefore possible that the use of crumpled GSG as an additive in lubricant oils will result in self-dispersion of the powder and enhancements in the tribological properties of the oil.
D. Rotational stacking for electrical applications
GSG sheets that consist of more than a single graphene layer can exhibit rotational stacking instead of Bernal stacking.Reference Ryu, Park, Kim and Lee72,Reference Lee, Dato, Jeon, Erni, Richardson, Frenklach and Radmilovic73 Aberration-corrected TEM images of bilayer and few-layer GSG have revealed unambiguous Moiré patterns in the sheets.Reference Ryu, Park, Kim and Lee72 These patterns are similar to the rotational stacking faults that have been observed in few-layer graphene obtained from graphite.Reference Warner, Rummeli, Gemming, Buchner and Briggs74
The rotational stacking of GSG layers is interesting for two reasons. First, bilayer and few-layer GSG sheets may not always be stacking in the standard AB Bernal packing of bulk graphite during synthesis. The number of layers and quality of GSG could be controlled through process conditions, such as residence time in the reactor. Multilayer graphite particles with standard AB stacking, with an interlayer distance of 0.335 nm, could be created by reducing the flow rate of the Ar gas used to generate atmospheric plasmas.Reference Dato and Frenklach26 Future studies on GSG should focus on determining process conditions that could control the stacking of few-layer sheets. Second, GSG powders consisting of single-, bi-, and few-layer graphene may exhibit enhanced properties when compared with graphene powders obtained from graphite. This is because bilayer and few-layer graphene with rotational stacking faults can have electrical properties similar to monolayer graphene,Reference Varchon, Mallet, Magaud and Veuillen75,Reference Hass, Varchon, Millan-Otoya, Sprinkle, Sharma, de Heer, Berger, First, Magaud and Conrad76 as well as distinct thermal properties.Reference Li, Ying, Chen, Nika, Cocemasov, Cai, Balandin and Chen77,Reference Nika, Cocemasov and Balandin78
It could therefore be possible that various electrical and thermal applications of graphene could be enhanced through the use of GSG because of the material’s purity, structure, and rotational disorder. This theory is supported by recent studies that showed that pellets consisting of GSG had an electrical conductivity of 4751 S/m, while pellets consisting of RGO had a lower conductivity of 3057 S/m.Reference Münzer, Xiao, Sehlleier, Schulz and Wiggers35 Currently, the effect of process conditions, such as plasma gas flow rate, on the electrical properties of GSG is currently unknown and should be studied. Future research into GSG should also investigate the performance of the material in electrical applications, such as electrically conductive inks and polymers.
VI. GSG PRODUCTION COMPARED WITH OTHER PLASMA-BASED METHODS
A. Free-standing graphene obtained through PECVD
Free-standing graphene sheets can be synthesized using PECVD techniques.Reference Wang, Zhu, Outlaw, Zhao, Manos and Holloway79–Reference French, Wang, Zhu and Holloway81 For example, graphene can form and grow vertically on various substrates (e.g., Si, W, Al2O3) using radio frequency (13.56 MHz) PECVD and methane as a precursor.Reference Wang, Zhu, Outlaw, Zhao, Manos and Holloway79,Reference Wang, Zhu, Outlaw, Zhao, Manos, Holloway and Mammana80 Low-pressure microwave reactors can also be utilized to produce vertically aligned “carbon nanowalls” with an average thickness of several nanometers using copper substrates and a precursor mixture of acetylene and ammonia.Reference Chuang, Boskovic and Robertson82
Vertically grown graphene sheets produced by PECVD have a similar appearance and Raman spectrum as GSG.Reference Wang, Zhu, Outlaw, Zhao, Manos and Holloway79 However, there are three major differences between PECVD-grown graphene and GSG. First, the production of GSG is a substrate-free process, while substrates are necessary in PECVD. Substrate temperature can also affect the structure of PECVD-grown sheets, and high-quality specimens require substrate temperatures above 630 °C.Reference Wang, Zhu, Outlaw, Zhao, Manos and Holloway79 Second, GSG is created under ambient conditions, while graphene growth by PECVD requires low reactor pressures (12 Pa for radio frequency PECVDReference Wang, Zhu, Outlaw, Zhao, Manos and Holloway79,Reference Wang, Zhu, Outlaw, Zhao, Manos, Holloway and Mammana80 and 1300 Pa for microwave PECVDReference Chuang, Boskovic and Robertson82). Third, the synthesis of GSG is a continuous process that proceeds indefinitely as long as a plasma is maintained and precursors are supplied. The environmental conditions of PECVD reactors require the synthesis processes to be stopped in order to return to ambient conditions to harvest the free-standing graphene. Despite the similarities in structure and quality, the synthesis of graphene in atmospheric plasmas has a number of advantages over the nucleation and growth of free-standing graphene sheets by PECVD.
B. Large-area graphene films created through PECVD
The formation of GSG in atmospheric plasmas proceeds via gas-phase reactions. In contrast, the large and flat graphene films deposited on substrates by PECVD depend on surface reactions. Graphene growth on a nickel substrate begins with the decomposition of a carbonaceous precursor, such as methane, in a low-pressure (0.12 Pa) plasma reactor.Reference Nandamuri, Roumimov and Solanki83 The free carbon that results from the decomposition process dissolves in nickel to form a solid solution.Reference De Arco, Yi, Kumar and Chongwu84–Reference Reina, Jia, Ho, Nezich, Son, Bulovic, Dresselhaus and Kong86 The cooling of the solid solution is a critical step because the solubility of carbon in nickel decreases as the temperature in the reactor is lowered. Cooling at a rate of 10 °C/sReference Kim, Zhao, Jang, Lee, Kim, Kim, Ahn, Kim, Choi and Hong85,Reference Yu, Lian, Siriponglert, Li, Chen and Pei87 causes carbon atoms to dissolve out of the solid solution and precipitate on the nickel surface to form large-area graphene films with lateral dimensions on the order of centimeters.Reference Nandamuri, Roumimov and Solanki83 The formation of graphene films on copper substrates can be achieved through the catalytic decomposition of methane on the copper surface, which is a self-limiting process.Reference Zhang, Zhang and Zhou88 Compared with nickel, copper has a much lower carbon solubility. Once a copper surface is covered with graphene, no further growth occurs because there is no longer any catalyst exposed to hydrocarbons in the plasma reactor and only a small amount of carbon dissolves in copper.Reference Zhang, Zhang and Zhou88
The differences between GSG and large-area graphene films deposited on substrates are similar to the disparities between GSG and PECVD-produced free-standing graphene flakes. Low pressures (<5 Pa) and high substrate temperatures (>300 °C) are required to create graphene films on copper and nickel. However, there are additional differences between the atmospheric plasma production of GSG and graphene films synthesized by PECVD. The nucleation and growth of graphene by PECVD involve surface reactions, and thus the quality of the underlying substrate can affect the quality of the synthesized films. The deposition of pure and highly ordered monolayer graphene requires high-quality substrates, which can lead to greatly increased production costs. Additionally, substrate treatments are required prior to deposition. The exposure of substrates to plasmas in order to remove surface contamination and increase grain size requires additional time and energy, which further increases the time and cost of PECVD synthesis.Reference Yamada, Kim, Ishihara and Hasegawa89
The main advantage of PECVD-grown graphene over GSG is size. GSG powder consists of randomly oriented and crumpled sheets with sizes ranging from hundreds of nanometers to micrometers, while PECVD-grown films can grow to centimeter scale. Continuous and highly ordered PECVD graphene films are suitable for the fabrication of electronic devices.Reference Papageorgiou, Kinloch and Young90 However, the use of graphene films in applications for graphene powder (e.g., nanocomposites, conductive inks, lubrication) can be costly and time-consuming, since additional steps are needed to extract graphene films from substrates. These steps can include coating the graphene with a polymer support, chemical etching of the underlying nickel or copper substrate, removing the polymer support, and transferring the graphene to a desired application.Reference Li, Cai, An, Kim, Nah, Yang, Piner, Velamakanni, Jung, Tutuc, Banerjee, Colombo and Ruoff91,Reference Bae, Kim, Lee, Xu, Park, Zheng, Balakrishnan, Lei, Kim, Song, Kim, Kim, Ozyilmaz, Ahn, Hong and Iijima92 These transfer processes are time-consuming and can contaminate and generate defects on graphene films, which diminish the properties of the material.Reference Papageorgiou, Kinloch and Young90 In comparison, pure and highly ordered GSG can be used immediately after synthesis for graphene powder applications.
VII. GSG COMPARED WITH GRAPHENE PRODUCED BY TOP-DOWN TECHNIQUES
A. Creating graphene from graphite
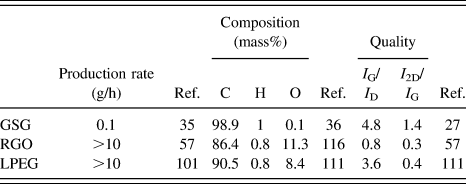
Graphene was first isolated and studied through the micromechanical cleavage method.Reference Novoselov, Geim, Morozov, Jiang, Zhang, Dubonos, Grigorieva and Firsov66 This process produces pristine graphene flakes that are not contaminated with oxygen. However, micromechanical cleavage is time-consuming and the yield of monolayer flakes is extremely small, which makes the technique only suitable for fundamental research purposes.Reference Wang, Narita and Müllen93 Two widely used methods that have been developed for the production of bulk quantities of graphene powder are the reduction of graphene oxideReference Dreyer, Park, Bielawski and Ruoff94–Reference Park and Ruoff98 and liquid-phase exfoliation.Reference Raccichini, Varzi, Passerini and Scrosati19,Reference Cai, Thorpe, Adamson and Schniepp99–Reference Leon, Rodriguez, Prieto, Prato and Vazquez108 This section will compare the production and quality of GSG with those of RGO and liquid-phase exfoliated graphene (LPEG). The differences between GSG, RGO, and LPEG are summarized in Table I.
Comparison of the production rates, composition, and quality of GSG, RGO, and LPEG.
B. Comparison of production rates, requirements, and by-products
Production rate is the main advantage of RGO and LPEG over GSG. As shown in Table I, rates of production greater than 101 g/h have been reported for graphene obtained through top-down methods.Reference Abdolhosseinzadeh, Asgharzadeh and Seop Kim57 In comparison, 10−1 g/h is the maximum production rate that has been reported for graphene produced in atmospheric plasmas.Reference Münzer, Xiao, Sehlleier, Schulz and Wiggers35 Furthermore, the production of LPEG and RGO is scalable, and kilogram quantities of RGO flakes are now commercially available.
The synthesis of GSG in atmospheric plasmas has the advantages of lower production requirements and reduced environmental impact. For instance, the creation of RGO involves multiple steps and large volumes of hazardous chemicals that can negatively impact the environment. The oxidation of graphite and the subsequent reduction of graphene oxide requires chemicals such as nitric acid, sulfuric acid, sodium hydroxide, hydrazine, dimethylhydrazine, and sodium borohydride.Reference Dreyer, Park, Bielawski and Ruoff94,Reference Park and Ruoff98,Reference Pei, Wei, Huang, Cheng and Ren109 These chemicals can produce hazardous gases and pose a risk of explosion.Reference Pei, Wei, Huang, Cheng and Ren109 Large volumes of purified water are also required throughout the production of RGO, and wastewater from the process can contain mixed acids and heavy metal ions.Reference Pei, Wei, Huang, Cheng and Ren109 Even the most recent studies reporting the rapid synthesis of graphene oxide and RGO utilize acids and large volumes of water to produce the materials.Reference Abdolhosseinzadeh, Asgharzadeh and Seop Kim57,Reference Pei, Wei, Huang, Cheng and Ren109
Similarly, the LPEG production process requires multiple steps, significant water, and hazardous chemicals. A number of liquid-phase exfoliation techniques use chemicals such as sulfuric acid,Reference Dimiev, Ceriotti, Metzger, Kim and Tour110,Reference Dong, Chen, Zhao, Ma, Lin, Li, Bao, Chu, Leng, Lu and Loh111 nitric acid,Reference Chiu, Mastrogiovanni, Wei, Louis, Jeong, Yu, Saad, Flach, Mendelsohn, Garfunkel and He106 chlorohydric acid,Reference Lin, Dong, Zhang and Lu101 and CrO3Reference Lin, Dong, Zhang and Lu101 to prepare graphite for exfoliation. Significant quantities of solvent are then needed to exfoliate expanded graphite and to purify and disperse LPEG.Reference Dong, Chen, Zhao, Ma, Lin, Li, Bao, Chu, Leng, Lu and Loh111 Current liquid-phase exfoliation techniques require at least 1 ton of solvent to disperse 1 kg of graphene,Reference Dong, Chen, Zhao, Ma, Lin, Li, Bao, Chu, Leng, Lu and Loh111 which is neither beneficial to the environment nor economically feasible. Reducing the amount of solvent used in LPEG production results in the re-stacking of monolayer flakes by van der Waals interactions. A non-dispersion strategy was recently developed to enable the mass production of graphene slurries, but even this method requires multiple steps, hazardous chemicals, and large amounts of water just to produce gram-scale quantities of graphene.Reference Dong, Chen, Zhao, Ma, Lin, Li, Bao, Chu, Leng, Lu and Loh111 Once produced, LPEG is typically stored in a solvent or water,Reference Dong, Chen, Zhao, Ma, Lin, Li, Bao, Chu, Leng, Lu and Loh111 and the use of LPEG powder in a number of graphene applications requires techniques to separate flakes from solvents, such as filtration.Reference Lin, Dong, Zhang and Lu101,Reference Chiu, Mastrogiovanni, Wei, Louis, Jeong, Yu, Saad, Flach, Mendelsohn, Garfunkel and He106,Reference Leon, Rodriguez, Prieto, Prato and Vazquez108,Reference Dong, Chen, Zhao, Ma, Lin, Li, Bao, Chu, Leng, Lu and Loh111 Once separated from solvent, LPEG powder must be washed with purified water to remove any residual chemicals from the flakes.Reference Lin, Dong, Zhang and Lu101,Reference Nuvoli, Valentini, Alzari, Scognamillo, Bon, Piccinini, Illescas and Mariani103,Reference Chiu, Mastrogiovanni, Wei, Louis, Jeong, Yu, Saad, Flach, Mendelsohn, Garfunkel and He106,Reference Dimiev, Ceriotti, Metzger, Kim and Tour110
In contrast to top-down methods of graphene production, the synthesis of graphene in atmospheric plasmas only requires a microwave plasma reactor, Ar gas, and a carbon-containing precursor. GSG is highly stable at ambient conditions,Reference Münzer, Xiao, Sehlleier, Schulz and Wiggers35 can be stored indefinitely in its dry as-synthesized state, and can be used immediately for graphene applications. GSG can also be produced with a lower impact to the environment than RGO and LPEG because plasma reactors can be powered using sustainable energy (e.g., wind and solar) and precursors for GSG formation (e.g., ethanol and dimethyl ether) can be obtained from renewable resources.Reference Kumar, Singh and Prasad112,Reference Semelsberger, Borup and Greene113
Unlike the liquid chemical waste that is generated during the production of RGO and LPEG, the by-products of the gas-phase synthesis process are H2 and CO. These gaseous by-products can be harvested and used in a number of useful applications. For instance, H2 is considered a nonpolluting and efficient energy carrier that has the potential to be used in future clean energy technologies, such as fuel cells for vehicles.Reference Jiménez, Rincón, Marinas and Calzada50,Reference Tatarova, Bundaleska, Sarrette and Ferreira114 Currently, the two primary technologies of producing H2 are the catalytic route through the water gas shift reaction and the electrolytic decomposition of water.Reference Jiménez, Rincón, Marinas and Calzada50 Indeed, the delivery of ethanol into atmospheric plasmas has been investigated as a method of H2 production.Reference Rincón, Marinas, Muñoz and Calzada44,Reference Rincón, Jiménez, Muñoz, Sáez and Calzada45 Thus, compared with RGO and LPEG production, the synthesis of GSG is safer and more environmentally friendly, and the by-products of the gas phase process can be useful in other applications.
C. Comparison of the structure and quality of GSG, RGO, and LPEG
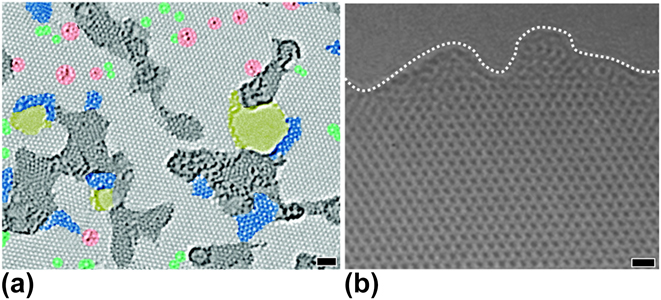
RGO is derived from graphite oxide, which is a highly defective form of graphite with a disrupted sp 2 bonding network.Reference Raccichini, Varzi, Passerini and Scrosati19 Therefore, RGO does not possess the mechanical, electrical, and thermal properties of graphene created by the micromechanical cleavage of HOPG. As shown in Fig. 13(a), the intrinsic structure of RGO exhibits contamination, topological defects, disordered networks, adatoms, and holes, which all significantly diminish the properties of graphene.Reference Gomez-Navarro, Meyer, Sundaram, Chuvilin, Kurasch, Burghard, Kern and Kaiser115 Figure 13(b) shows that the highly ordered arrangement of sp 2-bonded carbon atoms of GSG extends throughout the sheet, which does not have holes, disorder, and contamination.Reference Dato, Lee, Jeon, Erni, Radmilovic, Richardson and Frenklach36 Furthermore, the complete reduction of graphene oxide to pure graphene has not been accomplished. As shown in Table I, RGO sheets typically have a mass composition of 86.4% C, 0.8% H, and 11.3% O.Reference Schniepp, Li, McAllister, Sai, Herrera-Alonso, Adamson, Prud’homme, Car, Saville and Aksay116 In contrast, GSG sheets have a composition of 98.9% C, 1.0% H, and 0.1% O.Reference Dato, Lee, Jeon, Erni, Radmilovic, Richardson and Frenklach36 Side-by-side Raman spectroscopy characterization of RGO and GSG [Fig. 14(a)] shows that the I G/I D ratio of RGO is much lower compared to that of GSG, which further proves that the disorder in the structure of RGO is significantly higher than GSG.Reference Münzer, Xiao, Sehlleier, Schulz and Wiggers35 Raman peak ratios that can be used to compare the quality of GSG and RGO are summarized in Table I.
(a) TEM image of RGO with color added. Pristine areas and contaminated regions are light and dark gray, respectively. Blue regions are disordered networks or topological defects that are caused by the oxidation reduction process. Red areas are adatoms or substitutions. Green and yellow areas are isolated topological defects and holes, respectively. Scale bar: 1 nm. Reprinted with permission from Gomez-Navarro et al.: Atomic structure of RGO. Nano Lett. 10, 1144 (2010). Copyright 2010 American Chemical Society. (b) A TEM image of pure and highly ordered GSG. The dashed line indicates the edge of the sheet. Scale bar: 0.4 nm. Reproduced from Ref. Reference Dato, Lee, Jeon, Erni, Radmilovic, Richardson and Frenklach36 with permission from The Royal Society of Chemistry.
(a) Raman spectra of RGO and GSG. Reprinted from Wiggers et al.: All gas-phase synthesis of graphene: Characterization and its utilization for silicon-based lithium-ion batteries. Electrochim. Acta 272, 52–59 (2018), with permission from Elsevier. (b) Raman spectra of LPEG and GSG. Reprinted with permission from Ref. Reference Melero, Rincón, Muñoz, Zhang, Sun, Perez, Royuela, González-Gago and Calzada27.
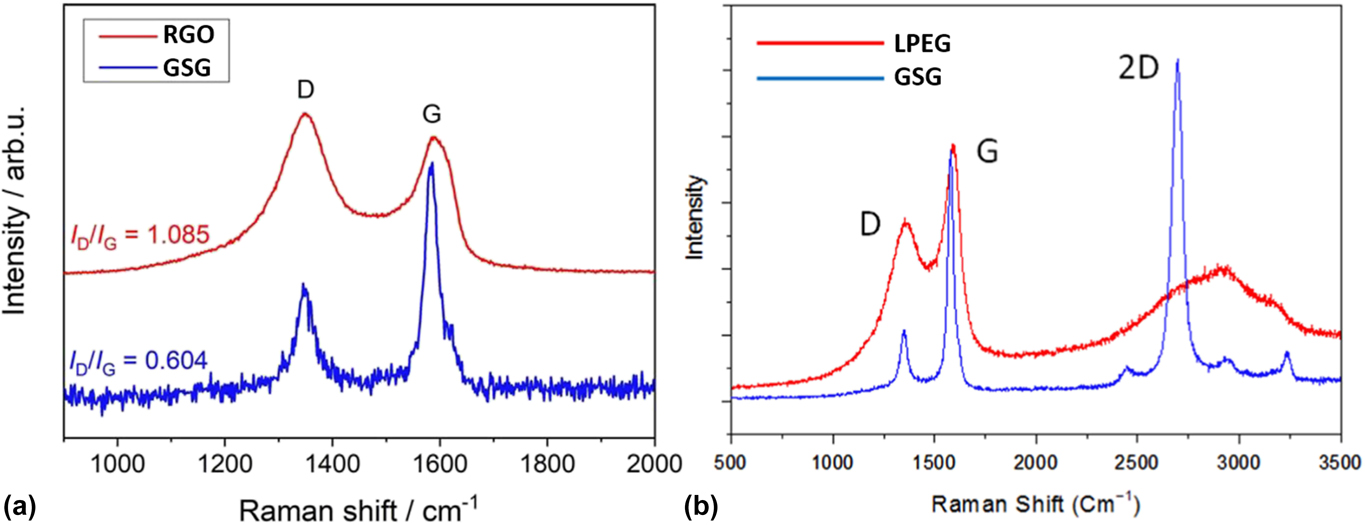
GSG also has the advantage of being higher in quality than LPEG. LPEG is produced from flake graphite,Reference Paton, Varrla, Backes, Smith, Khan, O’Neill, Boland, Lotya, Istrate, King, Higgins, Barwich, May, Puczkarski, Ahmed, Moebius, Pettersson, Long, Coelho, O’Brien, McGuire, Sanchez, Duesberg, McEvoy, Pennycook, Downing, Crossley, Nicolosi and Coleman105,Reference Dong, Chen, Zhao, Ma, Lin, Li, Bao, Chu, Leng, Lu and Loh111 which contains numerous localized defects in its structure.Reference Dreyer, Park, Bielawski and Ruoff94,Reference Wissler95 LPEG also contains a relatively high amount of oxygen. As shown in Table I, LPEG flakes have a mass composition of 90.5% C, 0.8% H, and 8.4% O.Reference Dong, Chen, Zhao, Ma, Lin, Li, Bao, Chu, Leng, Lu and Loh111 Furthermore, Table I shows that the peaks in the Raman spectra of LPEG typically have I 2D/I G ratios that are less than 0.5,Reference Paton, Varrla, Backes, Smith, Khan, O’Neill, Boland, Lotya, Istrate, King, Higgins, Barwich, May, Puczkarski, Ahmed, Moebius, Pettersson, Long, Coelho, O’Brien, McGuire, Sanchez, Duesberg, McEvoy, Pennycook, Downing, Crossley, Nicolosi and Coleman105,Reference Dong, Chen, Zhao, Ma, Lin, Li, Bao, Chu, Leng, Lu and Loh111 which is an indicator of multiple graphene layers. The multilayer nature of LPEG flakes is also evident in the side-by-side comparison of LPEG and GSG Raman spectra shown in Fig. 14(b). GSG has a sharp, symmetric 2D peak characteristic of graphene, while LPEG has a 2D peak shape that is an indicator of multilayer graphene.Reference Ferrari, Meyer, Scardaci, Casiraghi, Lazzeri, Mauri, Piscanec, Jiang, Novoselov, Roth and Geim37 Thus, GSG is closer in quality to pristine graphene than LPEG.
VIII. CONCLUSION
Graphene can be rapidly and continuously produced in atmospheric plasmas without the need for substrates, catalysts, or acids. The single-step gas-phase synthesis process involves the delivery of a carbon-containing precursor directly into a microwave-generated Ar plasma that can decompose organic compounds into their atomic elements due to the high average energies of its electrons and heavy particles. Reactive species combine in the high temperature environment of the plasma afterglow to form graphene, H2, and CO. The graphene that is produced by this process is pure, highly ordered, and stable under ambient conditions.
Future research should investigate the performance of GSG in applications for graphene powder. RGO has been used in a myriad of applications, such as high-strength nanocomposites,Reference Rafiee, Rafiee, Wang, Song, Yu and Koratkar117,Reference Potts, Dreyer, Bielawski and Ruoff118 energy storage,Reference Zhu, Yang, Yin, Yan and Zhang20,Reference Stoller, Park, Zhu, An and Ruoff24 water purification,Reference Chandra, Park, Chun, Lee, Hwang and Kim119,Reference Homaeigohar and Elbahri120 and drug delivery.Reference Kim, Lee, Kim, Kim and Kim121 However, it is currently unknown if the pure and highly ordered nature of GSG will enhance the mechanical properties of nanocomposites, increase the energy storage capabilities of batteries, or improve the tribological properties of lubricants. It is worth noting that the synthesis of graphene in atmospheric plasmas was first reported in 2008,Reference Dato, Radmilovic, Lee, Phillips and Frenklach25 but other research groups did not start producing and studying GSG until 2013.Reference Tatarova, Henriques, Luhrs, Dias, Phillips, Abrashev and Ferreira31 GSG research has gradually increased over the last five years. The initial studies into the properties and applications of GSG are promising. Laboratory-scale quantities of GSG are being produced by a growing number of research groups worldwide, and it is therefore likely that the performance of GSG in various applications will be reported in the foreseeable future.
The greatest challenge in producing GSG using atmospheric plasmas is the low rate of production. GSG production rates are miniscule compared with the industrial quantities of RGO and LPEG that are currently on the market. Therefore, future research into GSG should focus on increasing the yield of gas-phase synthesis methods. This will require further investigations into the nucleation and growth processes occurring in atmospheric plasmas. A better understanding of GSG synthesis mechanisms will enable the determination of an optimal reactor design for industrial production, process conditions that produce a higher percentage of single-layer graphene, and carbon-containing precursors that are both lower in cost and renewable.


 Open access

