


Non-technical Summary
The punctuational model of evolution asserts that established species evolve very little and that most evolution is confined to speciation events entailing small populations. The opposing view (gradualism) is that evolution occurs mainly within established species. This is known as “phyletic evolution.”
Evidence for the punctuational model is compelling. This is a matter of great importance. You might say that it is the essence of macroevolution. I have devised two tests that pit punctuationalism against gradualism and favor punctuationalism. The first is the Test of Adaptive Radiation, which I apply to families of middle Eocene Mammalia and Late Cretaceous Bivalvia. This test shows that species in both of these classes lasted much too long for the small amount of phyletic evolution they underwent to have produced new families within the brief intervals of time during which they arose. The Test of Living Fossils predicts that if the punctuational model is correct, long, slender clades, having experienced little speciation, should have undergone little evolution. With change largely confined to phyletic evolution, this was exactly what happened to them.
Several multivariate morphological studies have provided overwhelming support for the punctuational model, finding that huge numbers of fossil lineages exhibit little or no gradual evolution. Many other studies have shown that rapid speciation events occur frequently and some represent punctuational speciation.
Because the fossil record shows that sexual reproduction fails to accelerate phyletic evolution appreciably, its value must be in producing major evolutionary radiations via speciation, while asexual clones die out quickly.
Introduction
The punctuational model of evolution asserts that established species evolve very little and that most evolution is confined to episodes of speciation (branching events entailing small populations) (Eldredge Reference Eldredge1971; Eldredge and Gould Reference Eldredge, Gould and Schopf1972). The opposing view is that “gradualism” prevails, with evolution occurring mainly within established species. This is known as “phyletic evolution” or “anagenesis,” and segments of lineages that have experienced evolution are sometimes arbitrarily divided into what are known as “chronospecies.” The ancestral members of these pairs have experienced what is known as “pseudo-extinction.”
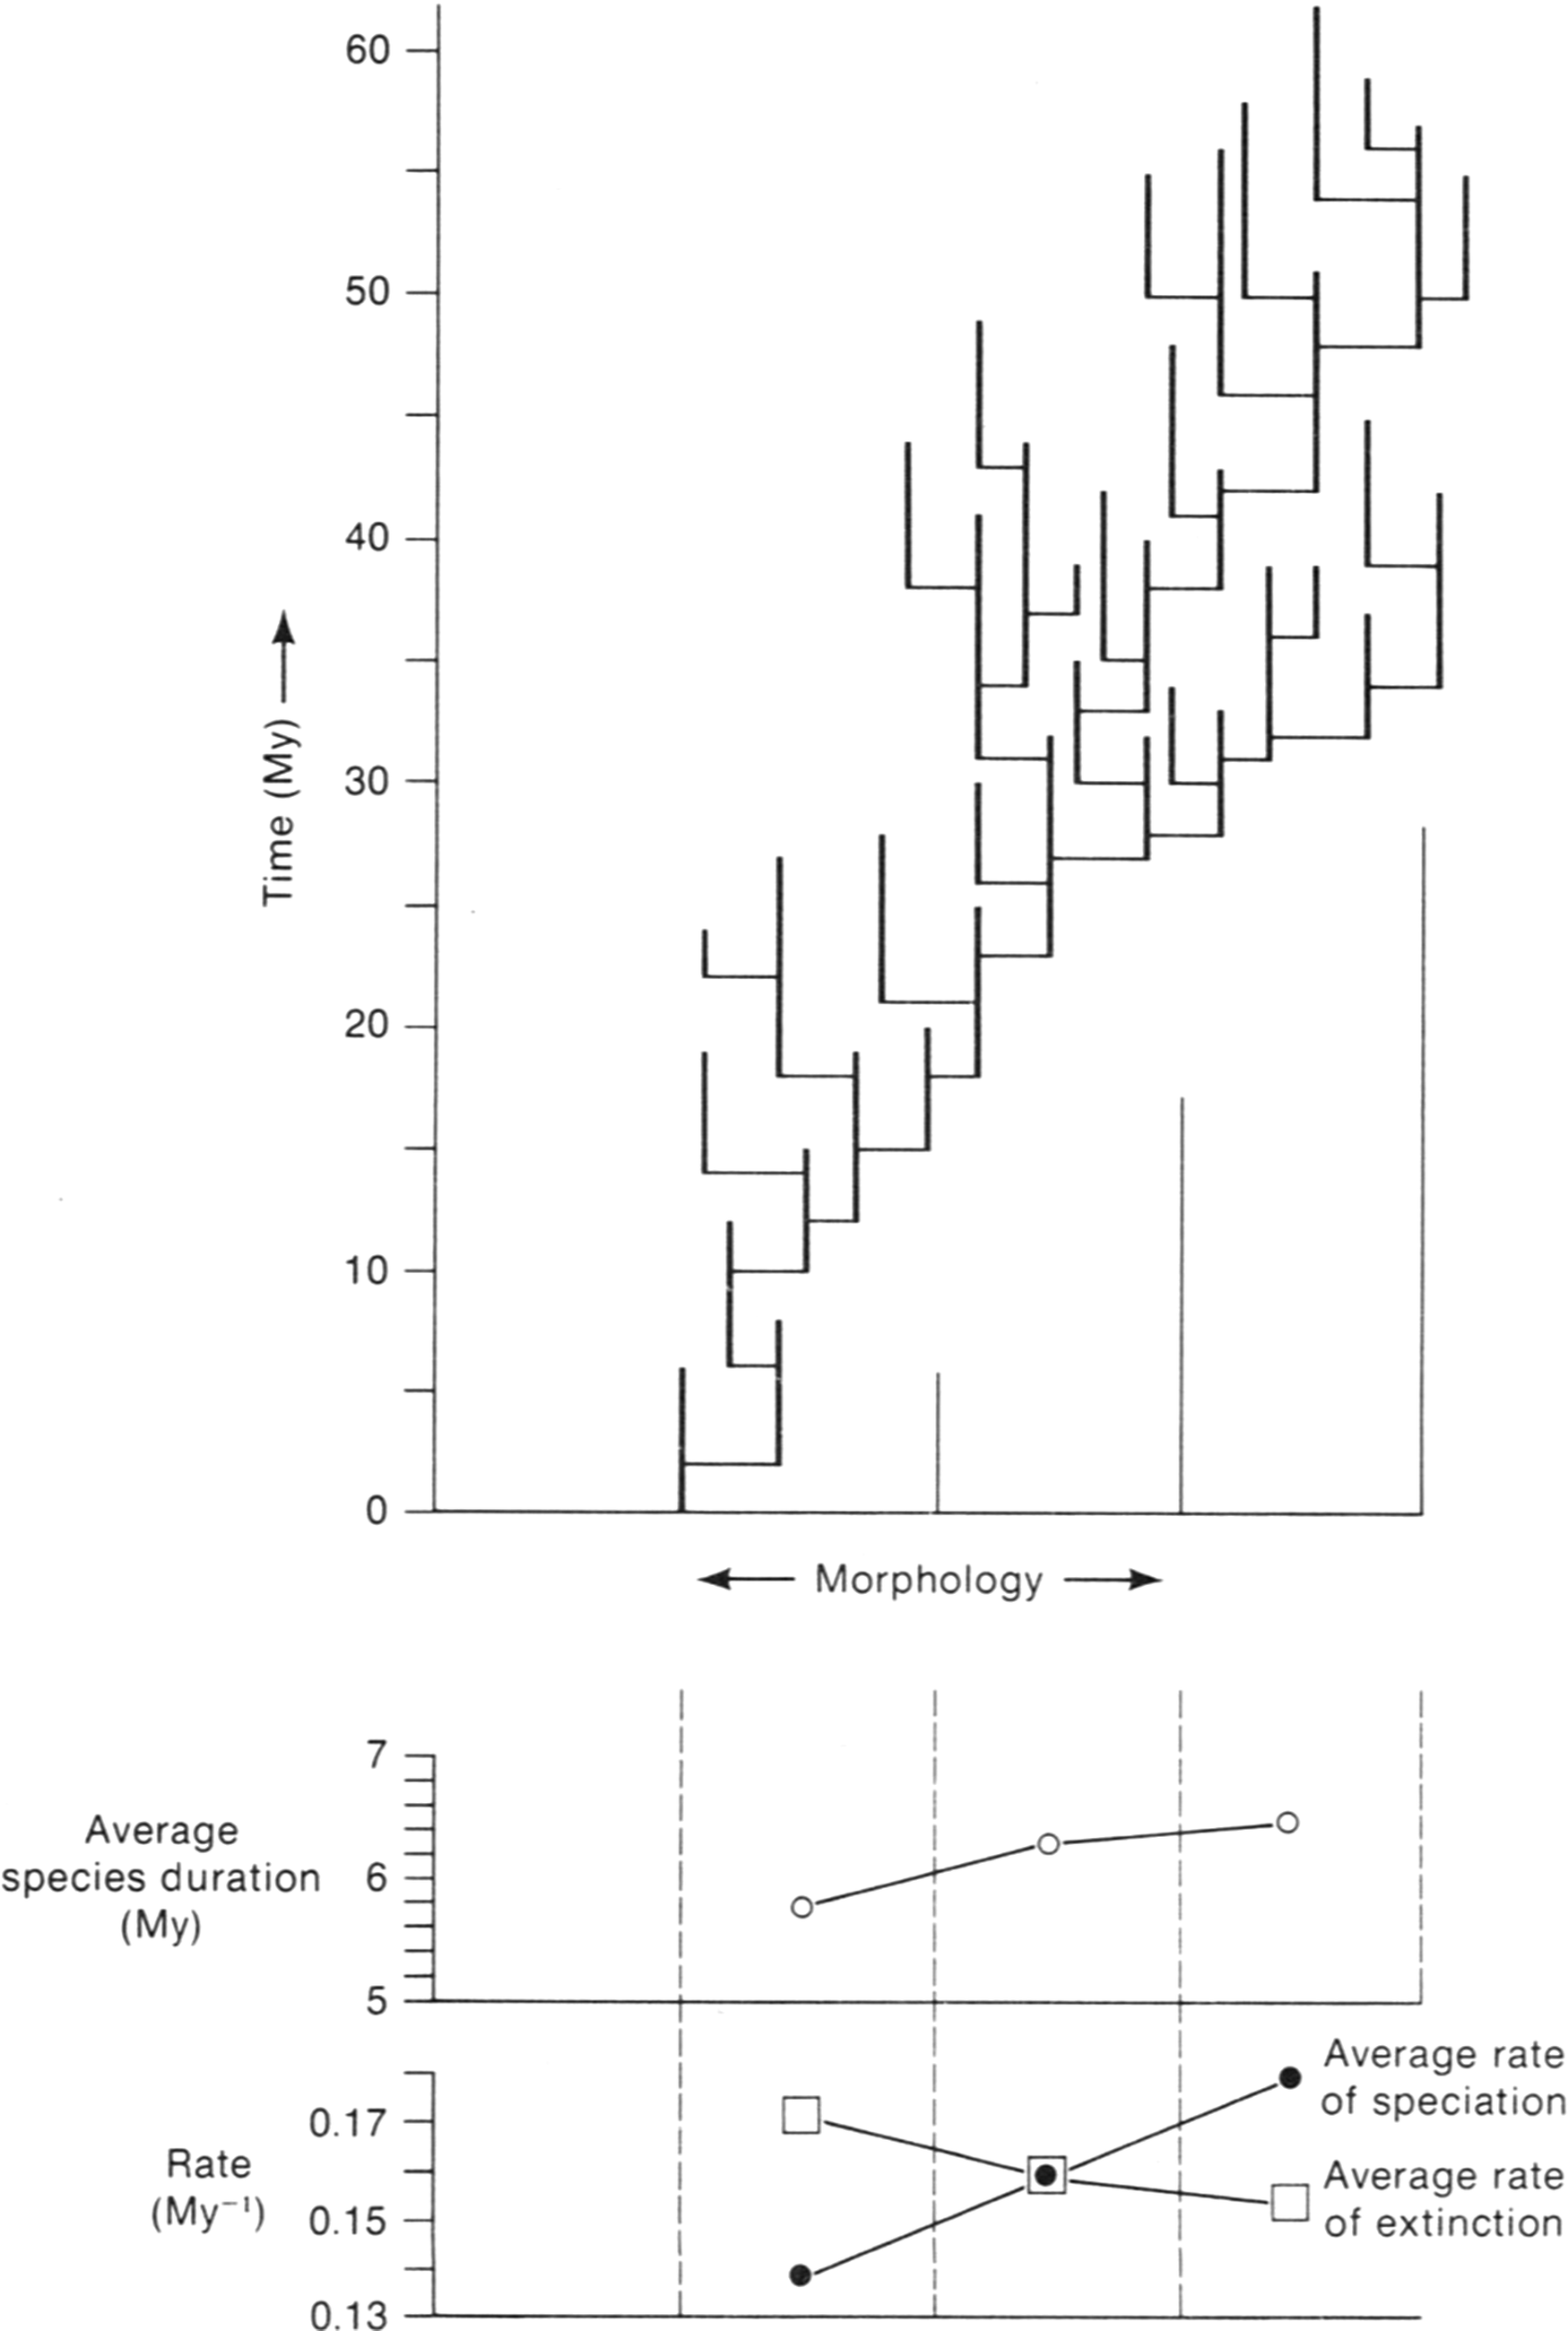
The evidence for the punctuational model of evolution is compelling, and I will explain why on the following pages. This is a matter of great importance, because it concerns the basic pattern of evolutionary phylogenies. You might say that it is the essence of macroevolution. Nonetheless, even after the punctuational model has existed for more than half a century, many biologists tend only to pay lip service to it, with no indication that they believe it to be valid. Obviously, part of the reason for this skepticism is that most biologists know little about the fossil record, where the critical evidence lies. Most doubters overlook the fundamental fact that, for a wide range of taxa, mean species durations have ranged from about 3 or 4 Myr to more than 20 Myr (Stanley Reference Stanley1979: p. 232, 1985). This means that lineages have not even undergone enough phyletic evolution during these long stretches of time for their representatives to be recognized as new species. I pen this article to present evidence that I hope will win over skeptics of the punctuational model.
We have needed two kinds of facts to demonstrate the prevalence of punctuational evolution. The first consists of data showing that established species have typically experienced very little evolution (phyletic evolution has been minor). This lies in the domain of paleontology. The second consists of evidence that punctuational speciation events do, in fact, occur. This lies largely in the domain of biology.
Eldredge proposed the punctuational model in 1971. Elaborating on it, Eldredge and Gould (Reference Eldredge, Gould and Schopf1972: p. 99) stated “that the data of paleontology cannot decide which picture [punctuationalism or gradualism] is more adequate … [but] that the picture of punctuational equilibria is more in accord with the process of speciation as understood by modern evolutionists.” This appraisal of the prevailing view of biologists turned out not to hold water: Many biologists immediately opposed punctuationalism, but they were largely unaware of the long durations of species.
Believing that the fossil record could, in fact, settle this issue, I devised tests that turned out to favor the punctuational model (Stanley Reference Stanley1975a, Reference Stanley1979). Two of these, the Test of Adaptive Radiation and the Test of Living Fossils, I still believe to be quite convincing and will discuss here. After this, I will describe four more recent pieces of research on fossil lineages that reveal very little phyletic evolution; two of these each examined many taxa and vast numbers of measured traits for lineages. Then I will provide a few examples of punctuational speciation. I will also review species selection, which must be the high-level process by which large-scale trends develop, and I will discuss the role of sexual reproduction for eukaryotes.
The Test of Adaptive Radiation
The Test of Adaptive Radiation makes use of the typically great longevity of species. Customarily, for lineages documented to have survived for millions of years, the oldest and youngest populations are so similar that they are assigned to the same species. This means that chronospecies are relatively rare. The Test of Adaptive Radiation compares the great lengths of known species durations within groups such as classes to the relatively brief intervals within which distinctive higher taxa, such as families, have evolved within these classes. Here I present a more precise version of this test than the original one (Stanley Reference Stanley1975a, Reference Stanley1979).
The middle Eocene was a time when mammals were still radiating at a high rate after the disappearance of the dinosaurs. The following are 9 mammalian families that arose during this interval and for which Prothero (Reference Prothero2014) has provided data for the longevities of a total of 126 species. Among the artiodactyls (even-toed ungulates) included here are the Anthracotheriidae, which resembled slim hippos; Helohyidae, which resembled slim pigs; Leptomerycidae, small deerlike animals related to modern chevrotains; Hypertragulidae, which resembled leptomerycids; and Antiacodontidae, sometimes assigned to the Tylopoda, the suborder of camels. Also included are perissodactyls (odd-toed ungulates): the Hyracodontidae (early members of the rhinoceros superfamily), Amynodontidae (also early members of the rhinoceros superfamily), and Tapiridae (primitive tapirs). And there is also a family of carnivores, the Amphicyonidae, later-evolving members of which were fierce creatures known as “beardogs.”
The mean duration for the 126 species that Prothero (Reference Prothero2014) listed as belonging to these 9 families was 3.5 Myr, which is longer than the entire middle Eocene, as currently dated! (See Table 1 for details.) The latter spanned only 3 Myr, from 41 Ma to 38 Ma (Geological Society of America 2023). The maximum mean species duration for a family here was 6.6 Myr for 12 species of the Hypertragulidae, and the minimum was 2.3 Myr for 15 species of the Anthracotheriidae. So, even this shortest mean species duration was more than three-quarters as long as the entire middle Eocene! These mean species durations are for the total histories of the families. Possibly the mean durations for the middle Eocene alone were slightly shorter, but if so, the general result would be the same. Furthermore, for most of the species, the listed durations must be at least slight underestimates because of the incompleteness of the fossil record. Even if we give gradualism more than its due and unrealistically assume that all of these middle Eocene mammal species actually represent chronospecies—and then assume that each of these would have evolved from a chronospecies of similar duration—phyletic evolution would have proceeded much too slowly to have produced the distinctive new mammalian families. On the other hand, there was plenty of time for numerous divergent speciation events to occur, and a series of these must have created each family.
Data for families of middle Eocene mammals and Late Cretaceous bivalves. *Data from Prothero (Reference Prothero2014). †Data from Moore (Reference Moore1969)

We can also apply the Test of Adaptive Radiation to marine invertebrates, most of which have much longer mean species durations than those of terrestrial mammals. Twelve new families arose within the Bivalvia (Mollusca) during the Late Cretaceous. (See Table 1 for details.) This interval spanned 33.5 Myr (Geological Society of America 2023). The mean duration for species of the Bivalvia throughout their history is estimated to have been between 11 and 14 Myr (Stanley Reference Stanley1985; and see Fig. 1 of the present paper). Even if we again make the assumption, which is overly generous to gradualism, that all the Late Cretaceous bivalve species were chronospecies within evolving lineages, there would typically have been an average of only about two and a half or three of these per lineage in the Late Cretaceous. Therefore, even for a lineage in which chronospecies were of somewhat shorter than average duration, there is no way that the small amount of total phyletic evolution they would have encompassed could have produced any of the 12 distinctive new bivalve families. Once again, punctuational speciation events would have been necessary.
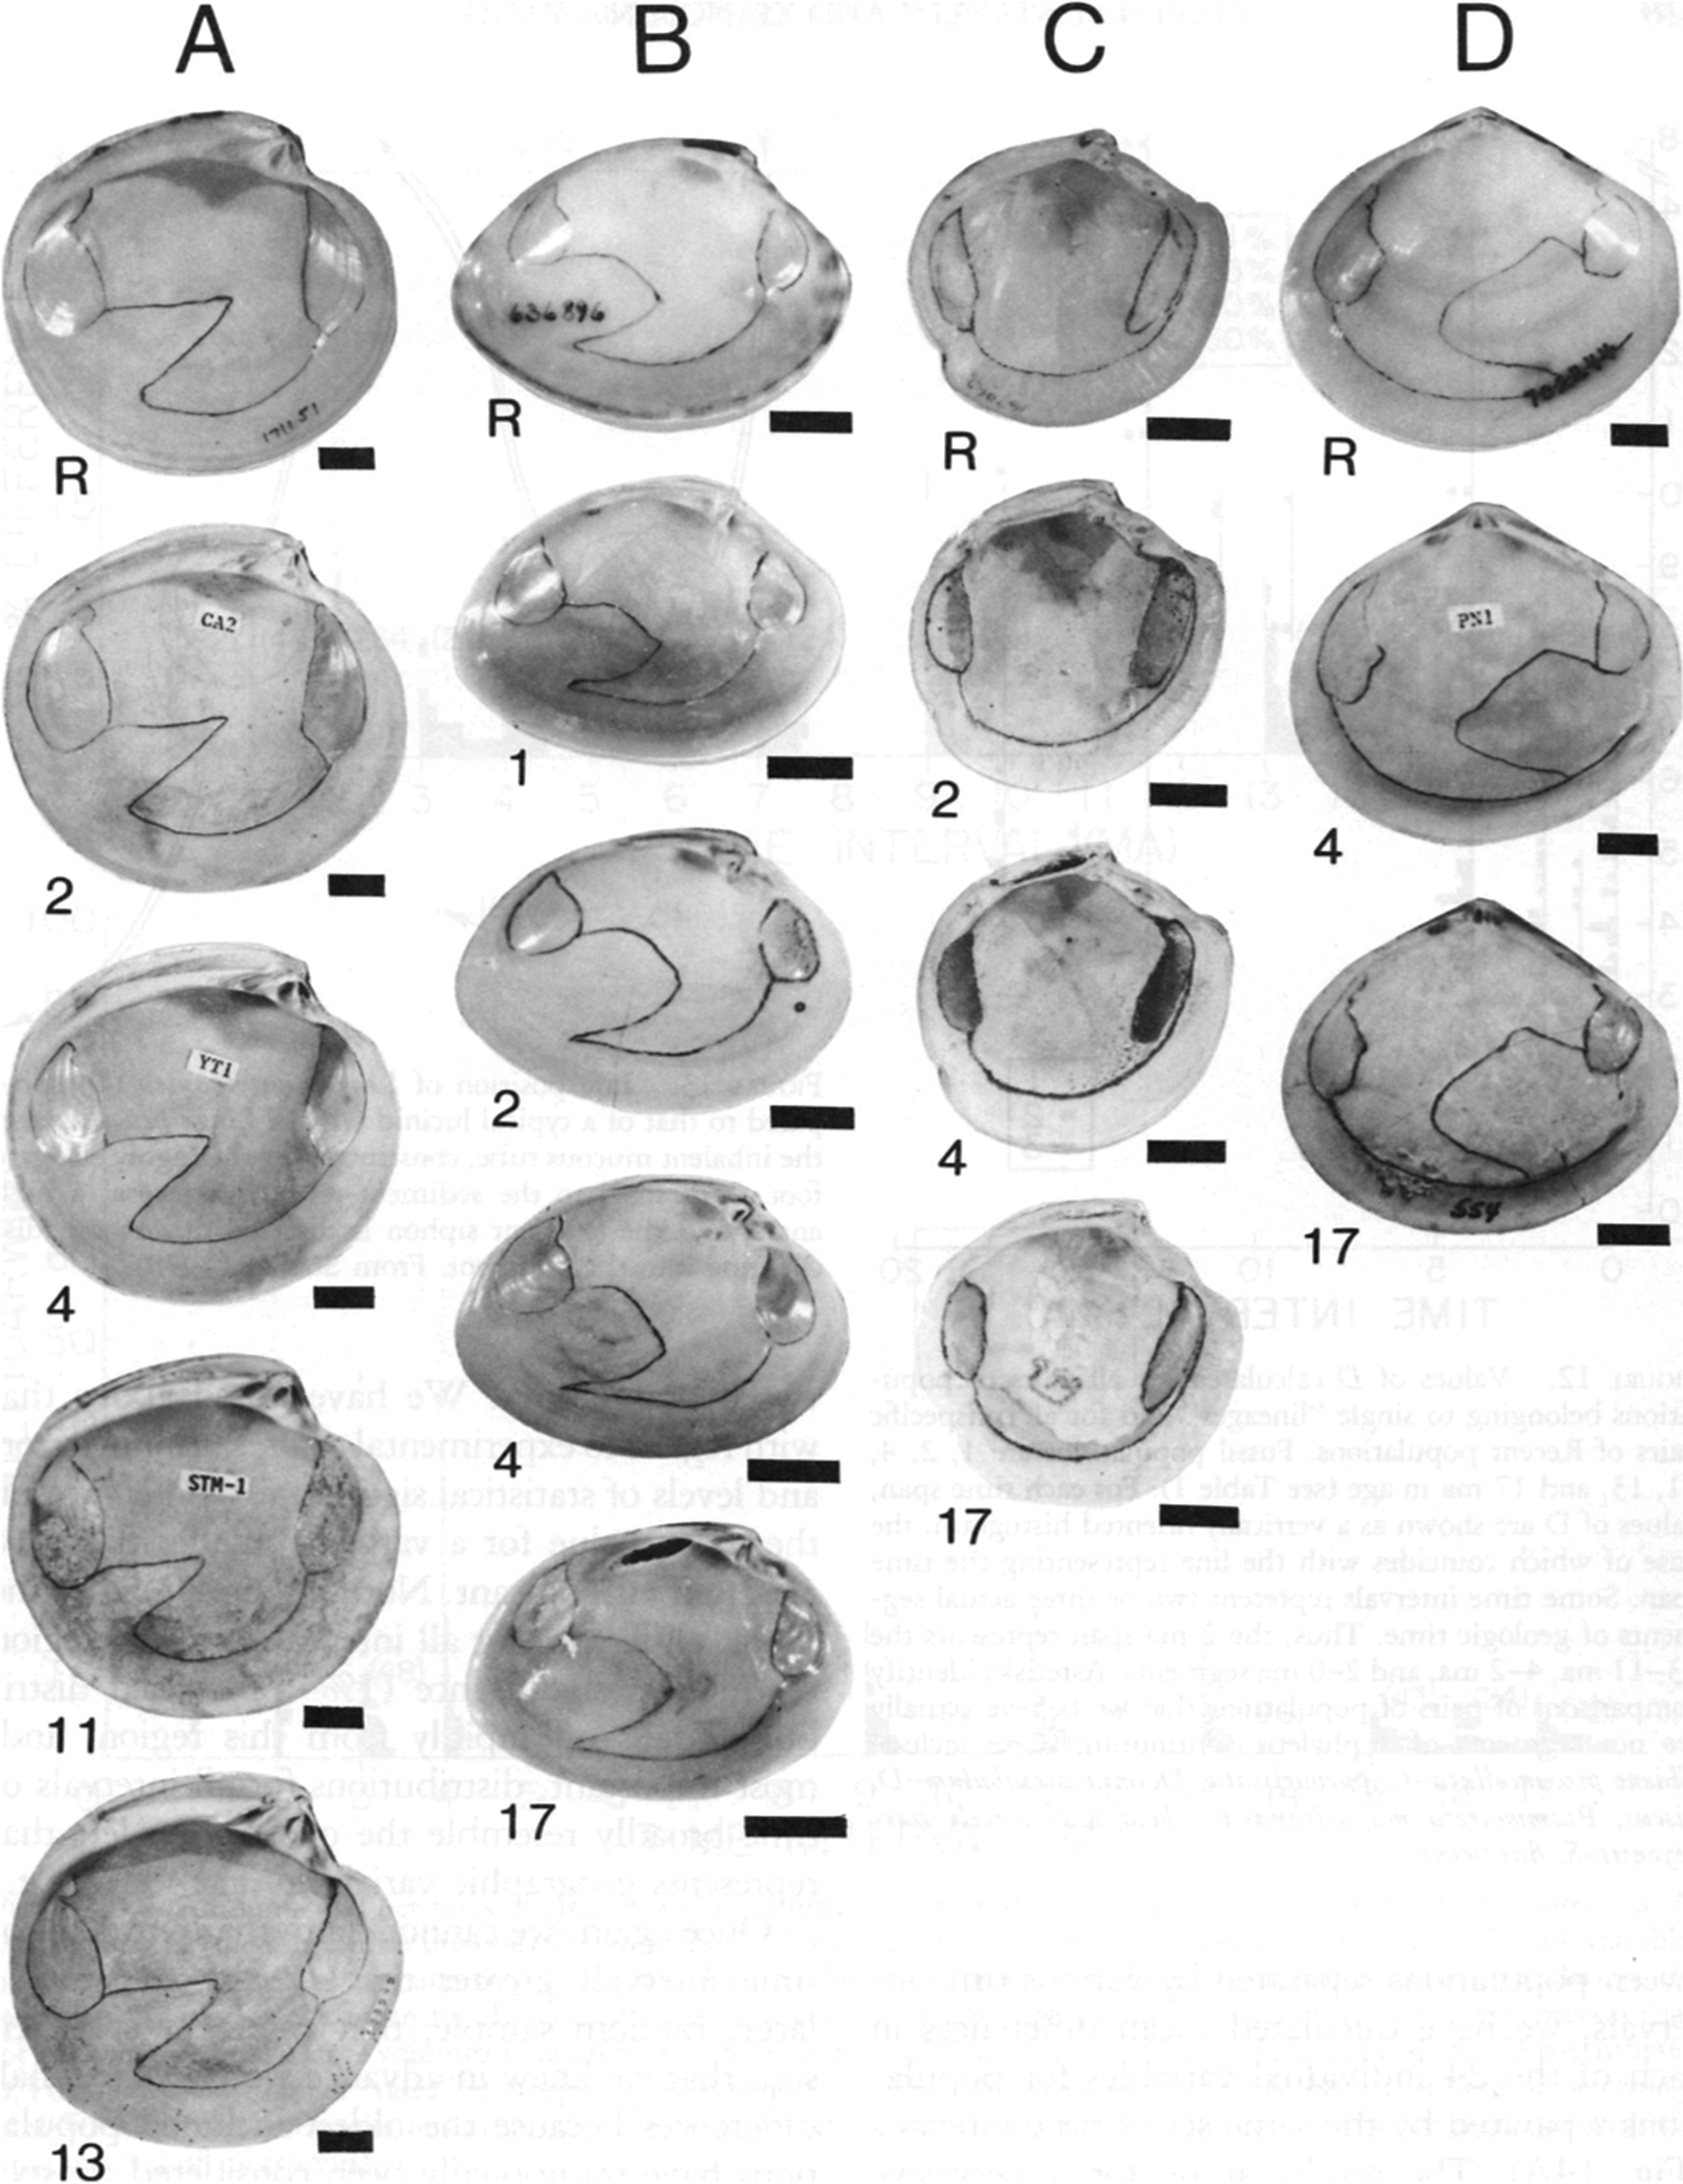
Lineages of western Atlantic bivalve mollusks extending back 13 or 17 Myr without exhibiting significant morphological changes. Scale bars, 1 cm. Numbers indicate durations. A, Dosinia discus (Recent–2 Myr), Dosinia acetabulum (3–13 Myr). B, Macrocallista maculata (Recent–17 Myr). C, Lucina pensylvanica (Recent–17 Myr). D, Arcopagia fausta (Recent–17 Myr). (From Stanley and Yang Reference Stanley and Yang1987.)

I have provided just two examples of the Test of Adaptive Radiation, but given the universality of great species longevities, application of this test to other taxa would yield the same result.
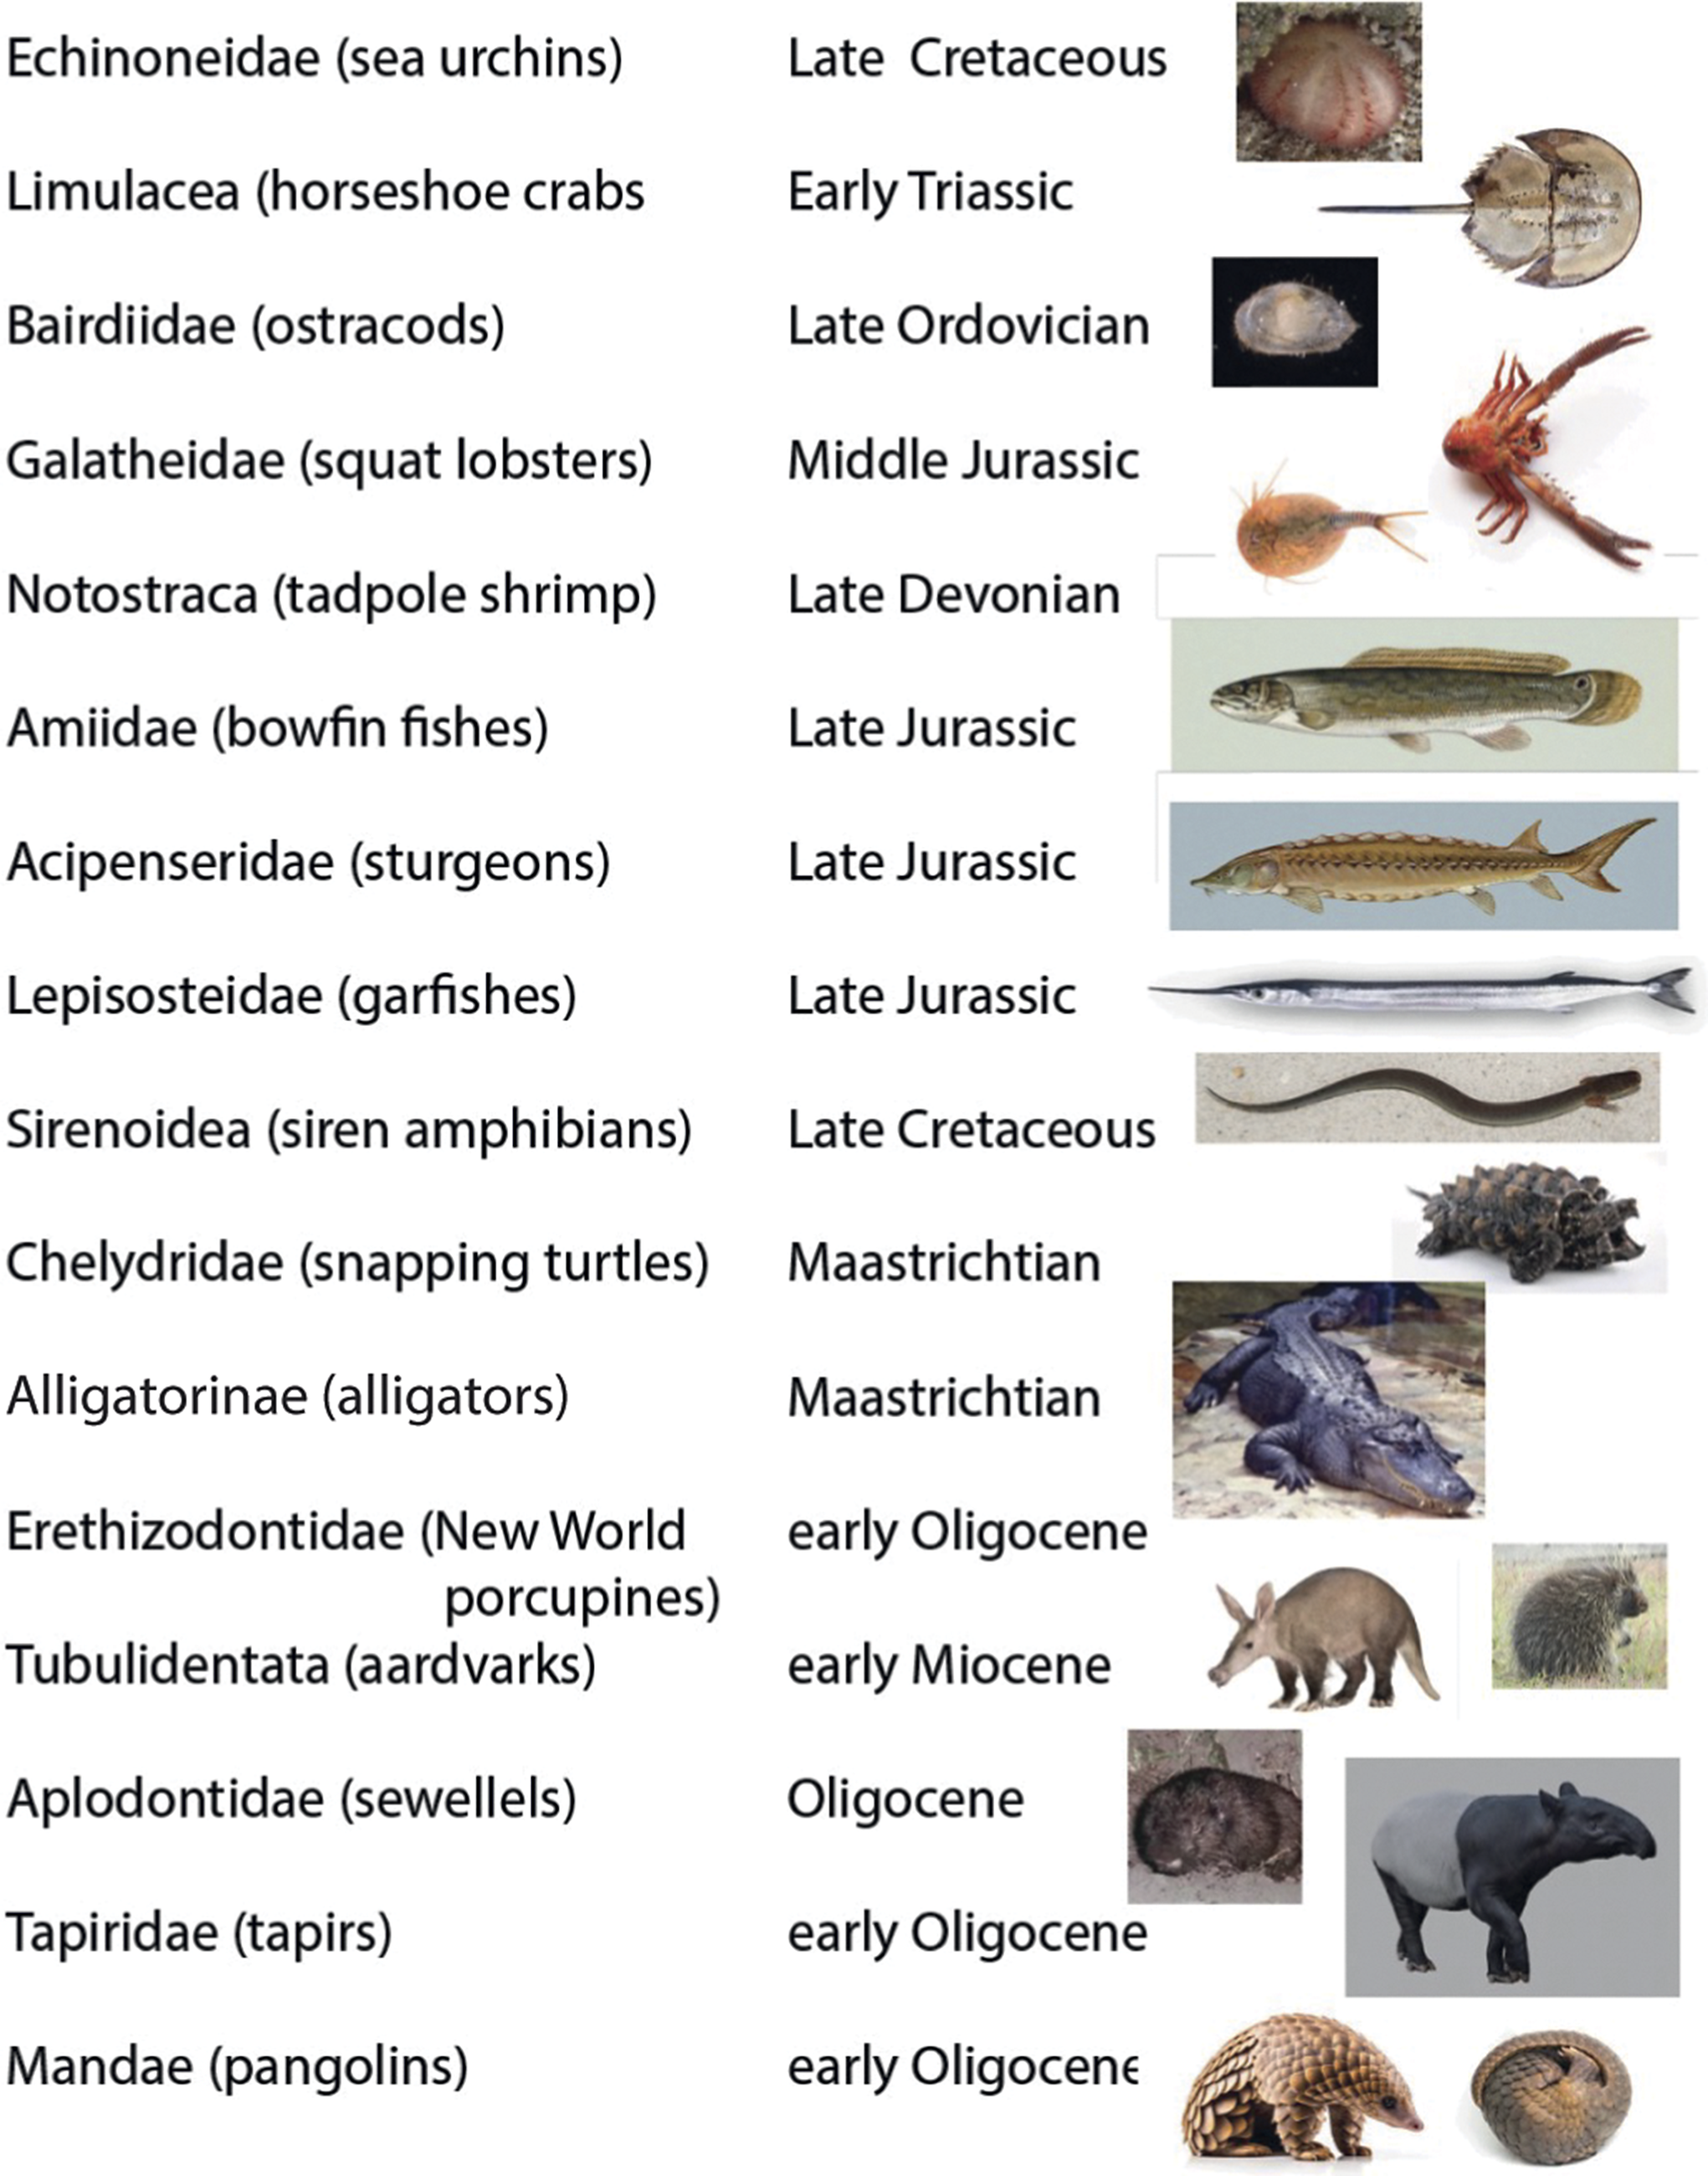
The Test of Living Fossils
By asserting that most evolutionary change is concentrated in speciation events, the punctuational model implies that long, slender clades (ones exhibiting few speciation events) should usually have experienced only small amounts of evolution. The Test of Living Fossils investigates this prediction. (“Living fossils” have been defined in various ways [see Lidgard and Kitchen Reference Lidgard and Kitchen2023], but I am defining them simply as extant taxa that closely resemble ancient relatives.) In choosing clades for this test, it is essential to include only ones for which known fossil taxa are spread throughout their total temporal ranges. Including clades that have ancient representatives and living descendants closely resembling them with no known fossil records in between would bias the result, because clades with similarly poor fossil records that had undergone such substantial evolutionary transitions that their extant descendants are unrecognizable would be missing from the test. Here this test is undertaken for all extant taxa with long, slender clades having substantial fossil records that I could locate by way of a search of fixed duration. For every one of them, the living representatives turned out to closely resemble their ancient ancestors and deserve the “living fossil” label. Examples are shown in Figure 2.
Living fossil taxa with times of origin. (Credits: Galatheidae, iNaturalist; Sirenoidea, iNaturalist; pangolin, FreePik.)

Biases from Searches for Phyletic Evolution
Over the many years when paleontologists assumed that phyletic evolution prevailed, they often, in effect, connected the dots between two species of the same genus that were separated in time, assuming them to be a phyletic ancestor and descendant. However, given the absence of known intermediate populations, their assumptions that phyletic connections existed were indefensible and often wrong. By way of a small number of successive populations, a few studies uncovered phyletic evolution, but the problem was that these were being preferentially sought out. Numerous examples of evolutionary stasis were ignored because they were considered uninteresting. As a result, evidence was lacking as to whether stasis or gradualism prevailed. An example of this bias is the attention given the European coiled oyster genus Gryphaea. It can easily be seen that this large, abundant species evolved gradually toward larger size and a broader shell, so Hallam (Reference Hallam1968) focused on it to document its phyletic evolution. Subsequently, however, Hallam observed that not a single one of 329 other bivalve species of the European Jurassic exhibited any measurable phyletic shape change (Hallam Reference Hallam1978)!
Hallam (Reference Hallam1978) did note that phyletic size increase occurred for a number of European Jurassic bivalve species. In fact, size increase is the one kind of phyletic evolution that is common in the animal world (Kingsolver and Pfennig Reference Kingsolver and Pfennig2004), but it does not produce new species and is not relevant to the present paper.
Multivariate Morphological Studies Showing Phyletic Evolution to Be Insignificant
In this section, I describe rigorous, comprehensive studies of fossil lineages that have included large numbers of morphological variables and found phyletic evolution to be rare or lacking. I undertook one such study with former student Xiangning Yang (Stanley and Yang 1997). We examined the morphological histories of 19 lineages of Neogene bivalve mollusks over time intervals ranging from 2 Myr to 17 Myr. Our morphometric comparisons were based on 24 variables, for which we made more than 43,000 individual measurements.
We initially assessed evolutionary changes in shape for 19 early Pliocene species of bivalves 3 Myr old by comparing these forms to their closest living relatives, which in 12 cases have traditionally been assigned to the same species. We included all fossil species that met certain predetermined guidelines and that provided suitable material for measurements. We compared the early Pliocene and Recent populations using (1) all 24 variables treated separately, (2) multivariate (Mahalanobis’s D) distances based on the full set of variables, and (3) eigenshapes for shell outlines. As a yardstick for these comparisons, we applied the same measures of morphological distance to pairs of geographically separated Recent populations that belonged to eight populations of the living species to which the fossil populations were compared. As it turned out, with minor exceptions, the distribution of morphological distances between the ancient and Recent populations closely resembled the distribution of morphological distances between the various conspecific Recent populations. Thus, virtually no phyletic evolution had occurred for any of the original species. We also traced some living species back 13 or 17 Myr and detected almost no phyletic evolution (Fig. 1). We concluded that morphology has normally been highly stable for bivalves over millions of years, strongly supporting the punctuational model.
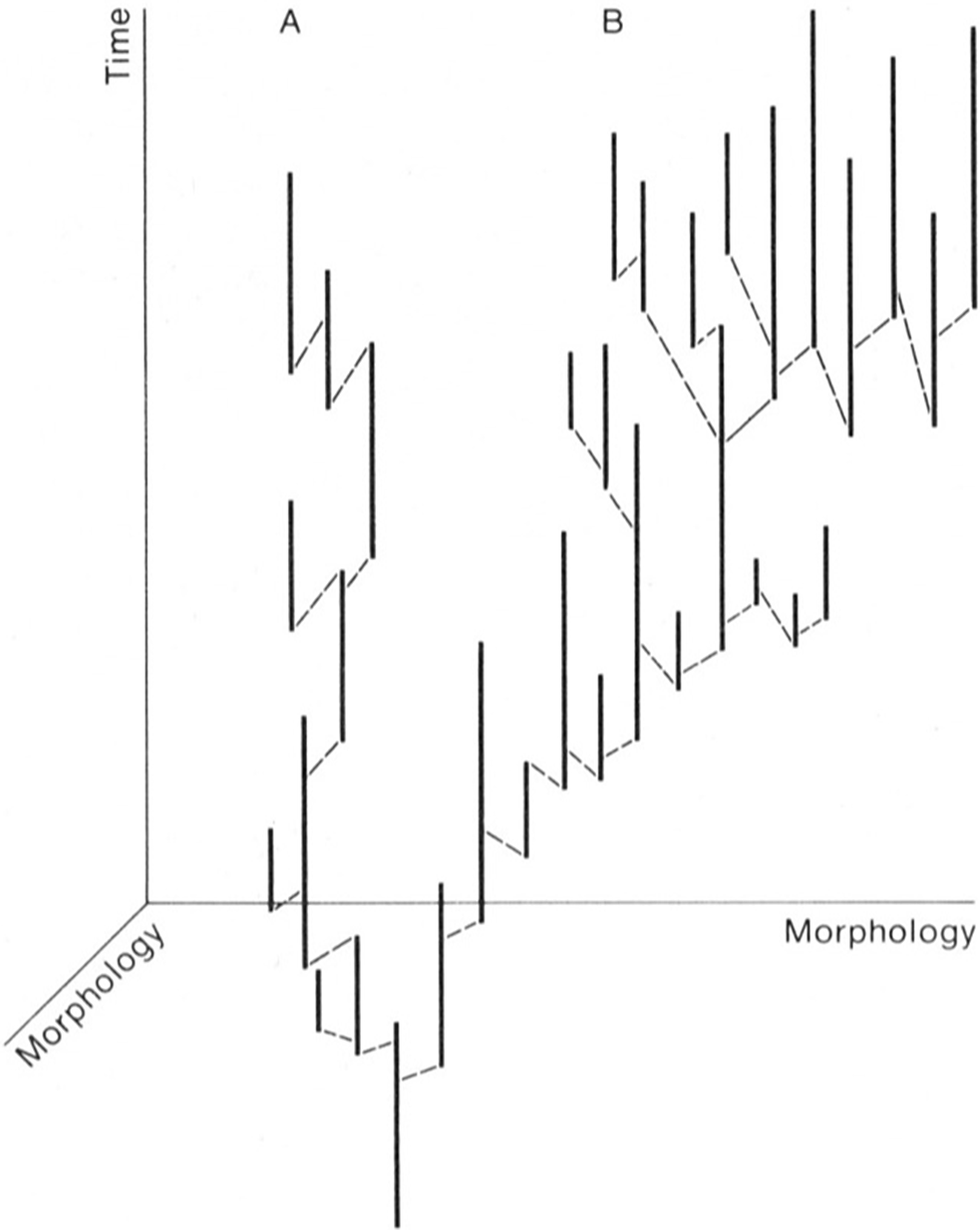
Another multivariate study focusing on the Caribbean bryozoan genus Metrarabdotos went further, not only assessing the amount of change in evolutionary lineages but also embedding these in a phylogeny (Cheetham and Hayek [Reference Cheetham and Hayek1988], based on Cheetham [Reference Cheetham1986]). This study featured 46 morphological traits. A stratophenetic tree for the genus turned out to be totally punctuational, with no lineage displaying any significant net change (Fig. 3). The species must have arisen by way of brief divergent speciation events, which presumably entailed the rapid evolution of small, localized, populations that could not be recognized in the fossil record.
A punctuational stratophenetic tree for Caribbean Neogene species of Metrarabdotos. (From Jackson and Cheetham [Reference Jackson and Cheetham1994]; adapted from Cheetham [Reference Cheetham1986].) Morphologic distances between inferred ancestor–descendant species are approximately to scale. Those between species of different groupings are not.
Two recent comprehensive studies have assessed what morphological changes occurred within huge numbers of lineages over geologic time. In one of these, Hunt (Reference Hunt2007) measured sequences of 250 traits for 138 protist, 71 invertebrate, and 42 vertebrate lineages. Only 13 (5%) of the lineage sequences displayed directional evolution, and this was considered to be an overestimate, because some of the data were taken from previous studies that had sought evidence for gradual change.
In a similar study, Hopkins and Lidgard (Reference Hopkins and Lidgard2012) investigated 635 sequences for 153 traits of species lineages. Their data represented brachiopods, bryozoans, echinoderms, mammals, fishes, mollusks, conodonts, ostracods, trilobites, planktonic and benthic foraminiferans, diatoms, and radiolarians. Only 6.4% of single traits and 5.7% of traits derived from multivariate analyses showed directional change. These results were very similar to those of Hunt (Reference Hunt2007), showing that phyletic evolution was very rare and thus strongly supporting the punctuational model.
Events of Rapid Speciation
Now for the other essential feature of punctuational evolution: rapid speciation events. These are significant, because they can entail just one or a few genetic changes that often have significant phenotypic effects. Probably the most storied study here is that for the annual plant genus Clarkia by Lewis (Reference Lewis1962), who wrote (p. 262):
Deviant marginal populations are so frequent that one often stumbles upon them without making a deliberate or systematic search. They may differ from the parent species in any one or more ways, including morphology, genetic compatibility, breeding structure, and chromosome arrangement. They all have, however, two features in common; they are ecologically marginal, and the discontinuity with the parent populations is abrupt … some have persisted and flourished as distinct species, and occasionally … a deviant may set the stage for a successful new phylad of species.
One new species of Clarkia, C. lingulata, consisted of just two colonies that existed at the periphery of the range of its parent species, C. biloba, and its origin entailed chromosomal alteration. Clarkia lingulata existed under more xeric conditions than C biloba and apparently arose during an extreme drought. Lewis (Reference Lewis1962) referred to this kind of speciation event as entailing “catastrophic selection.” It is also what now is termed “ecological speciation” because it involved habit separation. It is easy to imagine that some speciation events of this type have been highly punctuational.
Rapid speciation has been associated with changing climatic conditions during Earth’s emergence from the most recent Pleistocene glacial maximum. For example, via geographic isolation during this time, the sedge species Carex waponahkikensis, which is still restricted to two counties in Maine, originated from the widespread species C. scoparia (Escudero et al. Reference Escudero, Lovit, Brown and Hipp2019). The new species still retains little genetic variability, probably because of the founder effect.
Very recent speciation events have even occurred in open-sea environments. For example, the brown alga Fucus radicans recently evolved from Fucus vesiculosus in the Baltic Sea (Pereyra et al. Reference Pereyra, Bergström, Kautsky and Johannesson2009). It is distinct genetically from its ancestor and is smaller and bushier. A genetic clock indicates that this speciation event occurred less than 400 years ago. Also in the Baltic Sea, the flounder Platichthys flesus, which is a planktonic spawner, gave rise within less than 3000 generations to a new unnamed species that is a demersal spawner, unable to send its gametes up into the brackish water column; this is an example of ecological speciation because it entailed habitat separation (Momigliano et al. Reference Momigliano, Jokinen, Fraimout, Florin, Norkko and Merilä2017).
Cichlid fishes of African lakes have undergone the most famous large adaptive radiations entailing very rapid speciation. In Lake Victoria alone, more than 500 apparently valid species have originated within the past 14,000 years, but many of them much more recently (Johnson et al. Reference Johnson, Kelts and Odada2000). Numerous isolating mechanisms have been proposed for the speciation events in African lakes, for example, sexual selection, ecological speciation by way of habitat heterogeneity, and changes in the communication, morphology, or coloration of the fishes (Santos et al. Reference Santos, Lopes and Kratochwil2023).
Punctuational Speciation
Branching events entailing substantial biological shifts represent what Simpson (Reference Simpson1944) labeled “quantum evolution” and Grant (Reference Grant1963) more precisely termed “quantum speciation.” This is what in the present paper I am calling “punctuational speciation.” However, in viewing all genera as having arisen by way of phyletic evolution in attempting to measure rates of evolution, Simpson (Reference Simpson1953) was clearly a gradualist.
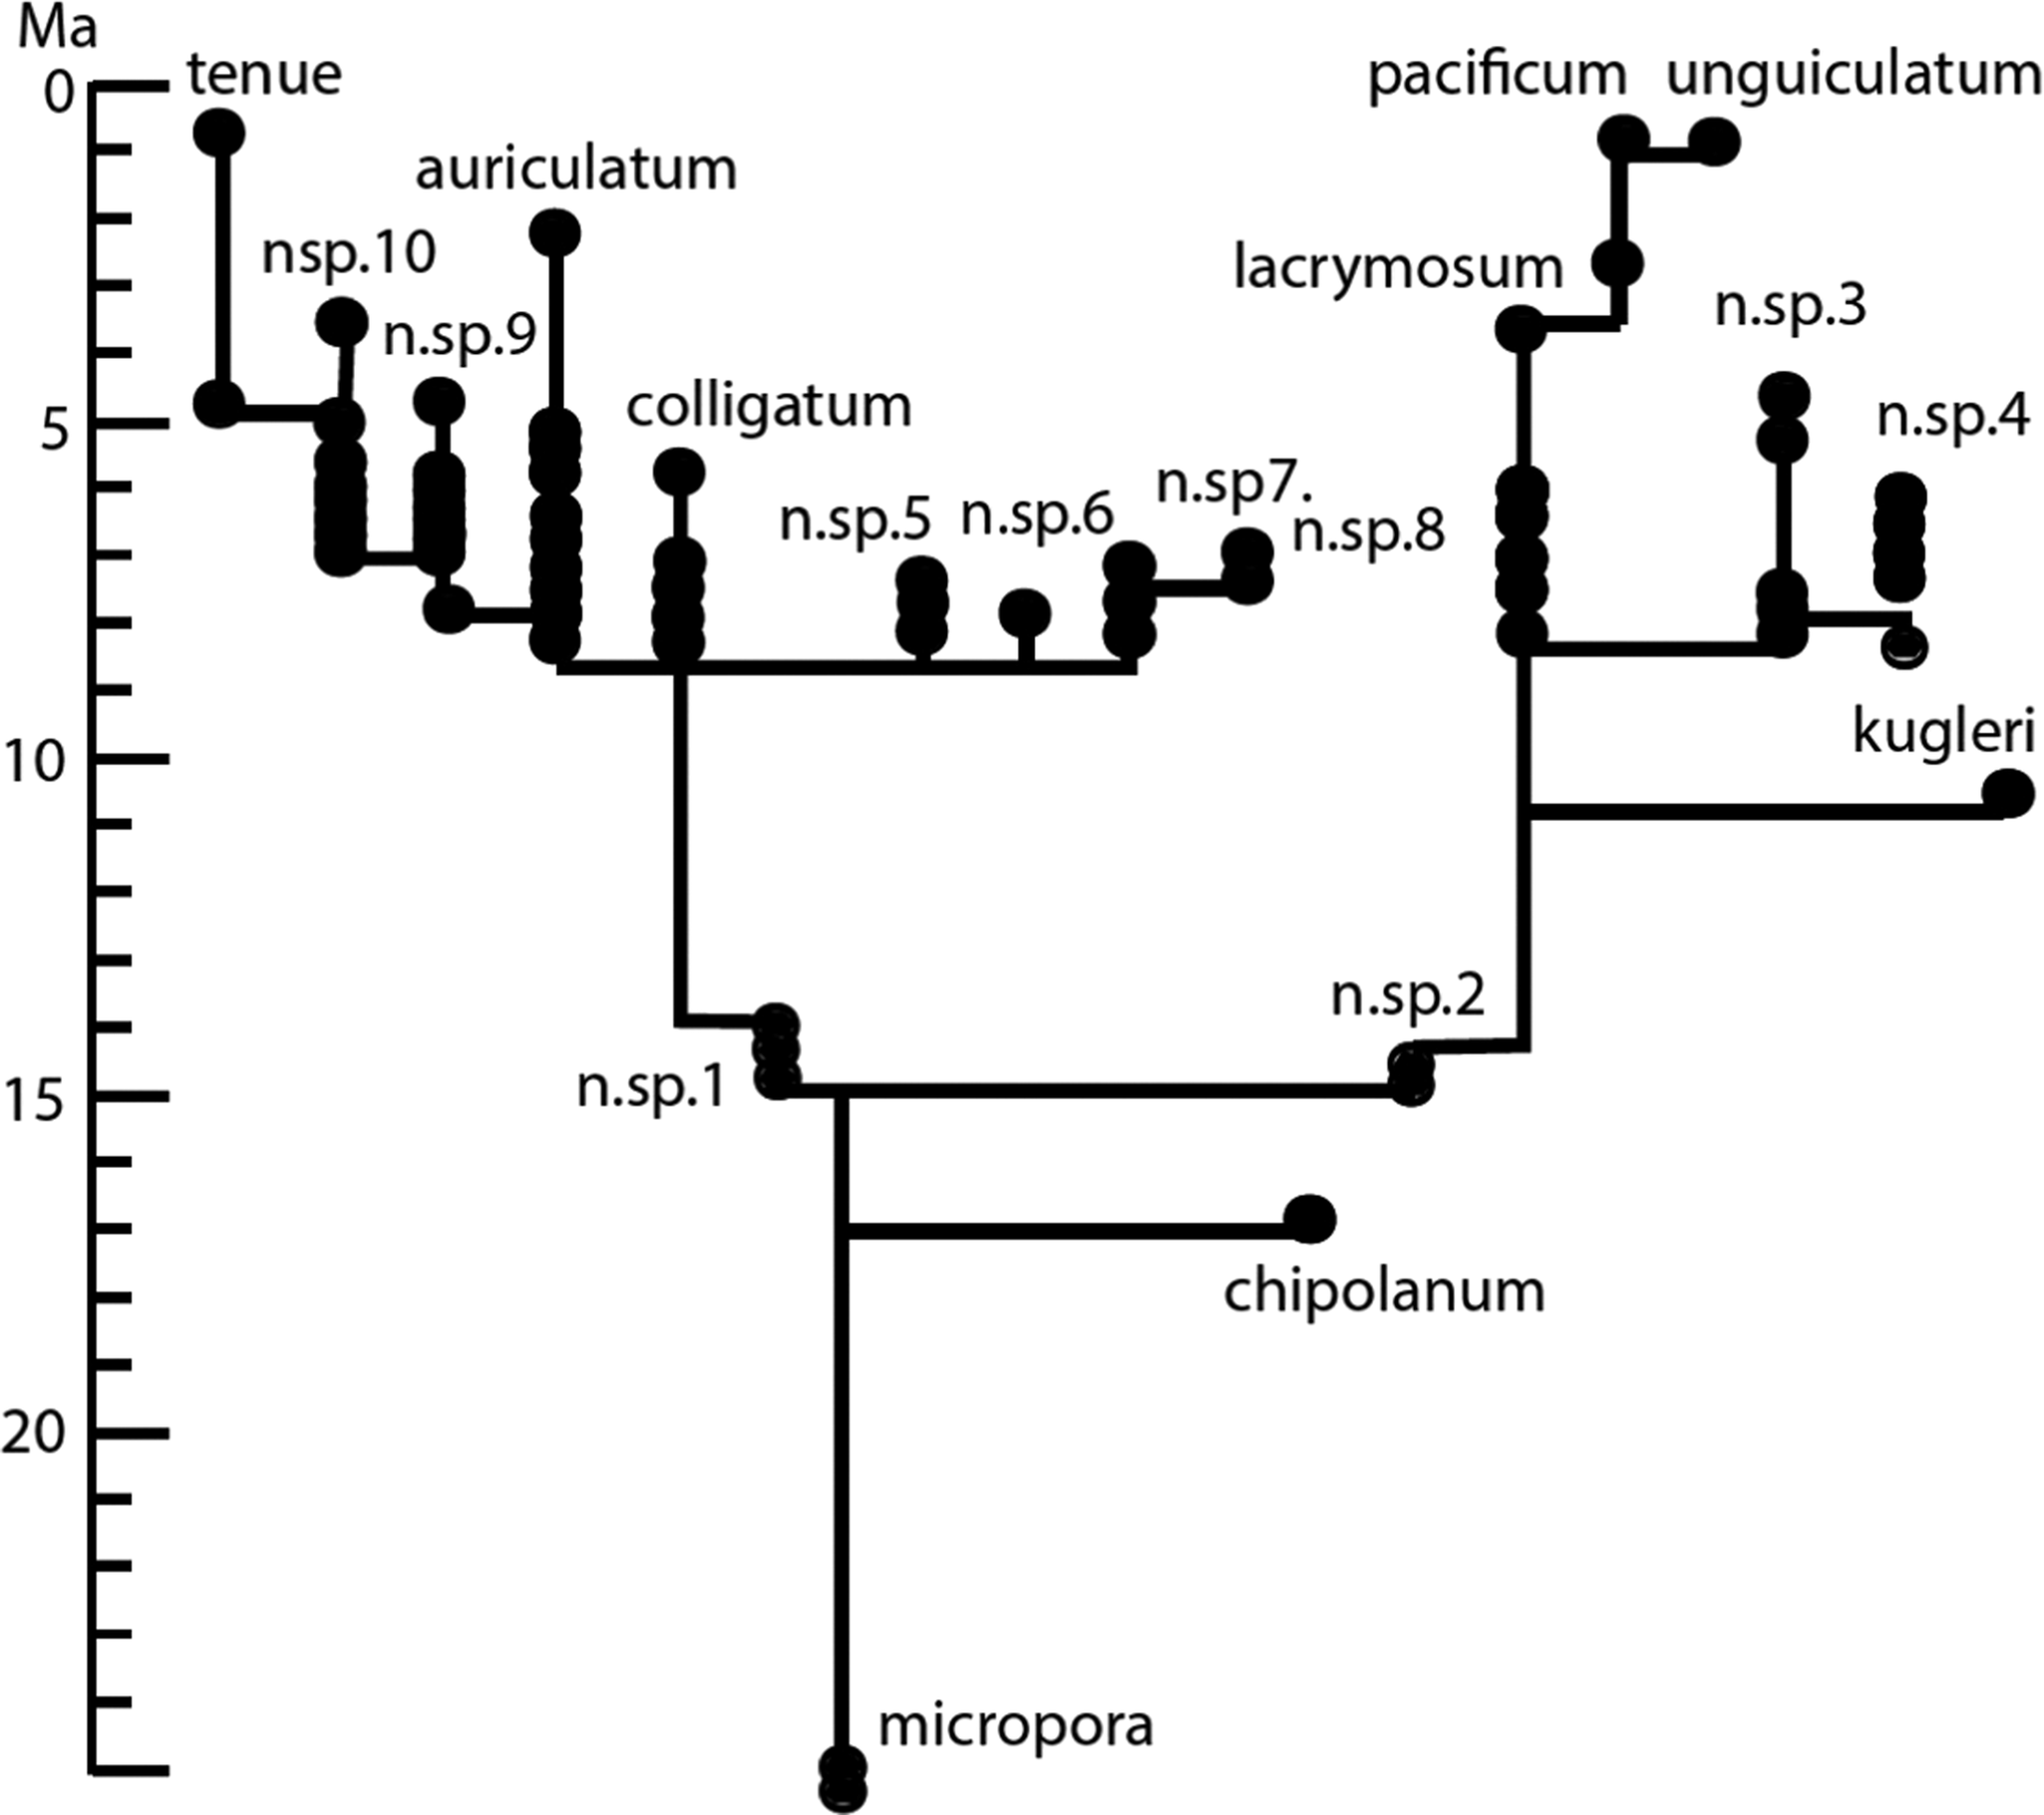
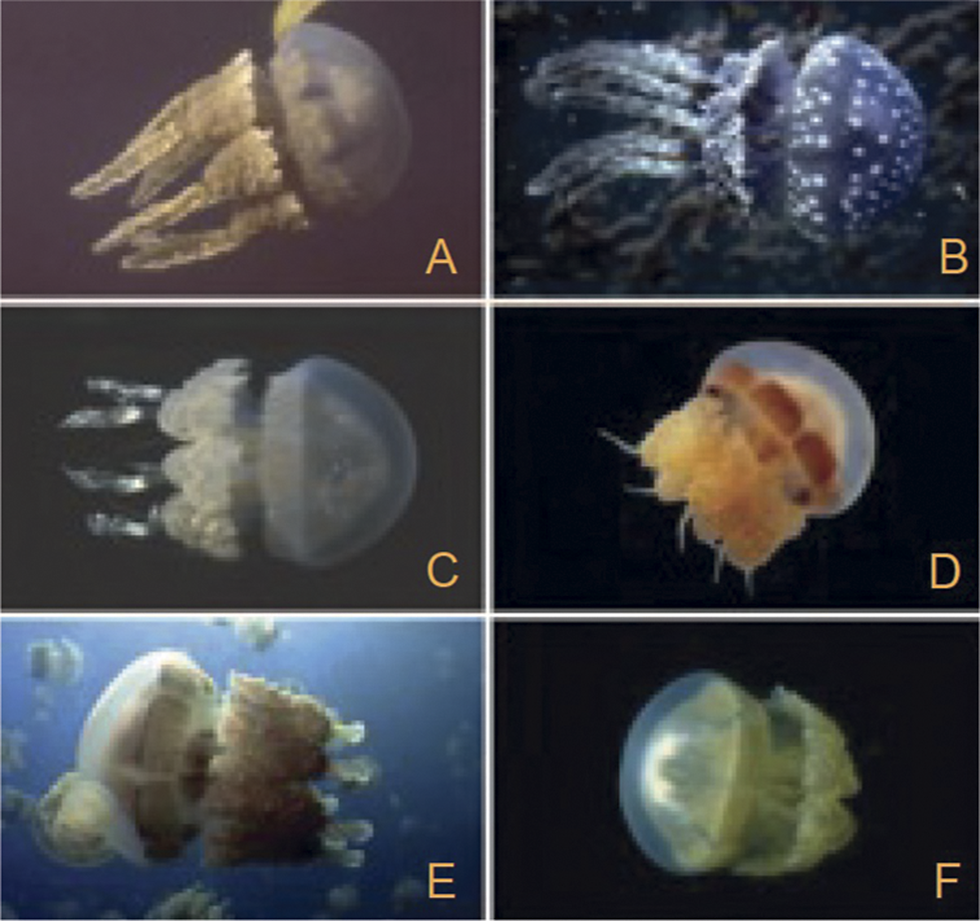
Probably the best examples of punctuational speciation are the origins of five unnamed jellyfish species, each of which has evolved in a different saltwater lake on the tropical Pacific island of Palau (Dawson et al. Reference Dawson and Hammer2005). This island consists of limestone that has been subject to dissolution by slightly acidic rainwater every time sea level has fallen during the Pleistocene as massive glaciers have built up on the land. As a result, deep passages have formed on the island. During times of deglaciation, ocean water has flowed into these passages and risen to form saltwater lakes at the level of the surrounding ocean (Fig. 4).
A marine lagoon and saltwater lake on the tropical Pacific island of Palau.

Larvae of a species of the jellyfish genus Mastigias made their way to six of the Palau lakes during the most recent sea-level rise, and their populations have evolved adults with strikingly different morphologies in five of the lakes. The parent species, which still occupies the sixth lake, is brown. Two of the new forms are beige, and each of the other ones is green, blue, or orange; in addition, these five forms have very different tentacle morphologies from one another and the parent species (Fig. 5). These new forms deserve recognition as new species but have not yet received this designation. The deeper lakes obviously began to form earlier than the shallower ones. The sea-level curve for the most recent deglaciation reveals that the first-formed Palau lake containing one of the new jellyfishes is about 15,000 years old, and the youngest one is about 5000 years old. The dates for the various lakes establish the earliest times when the new jellyfish could have begun to evolve, but they may have originated much more recently, and this is actually suggested by the fact that they display very few genetic differences from the ancestral species (Dawson et al. Reference Dawson and Hammer2005). In any event, the origins of the new forms must be considered to have been punctuational when we consider that an average marine species that has expanded to a substantial population size survives for something like 10 Myr. The new Palau forms’ parent species, which is very widespread in the modern ocean, is likely to live as long as this, more or less unchanged.
Jellyfishes of the genus Mastigias from different saltwater lakes on the island of Palau. (A) The parent species and (B–F) its descendants. (From Dawson and Hammer Reference Dawson and Hammer2005.)

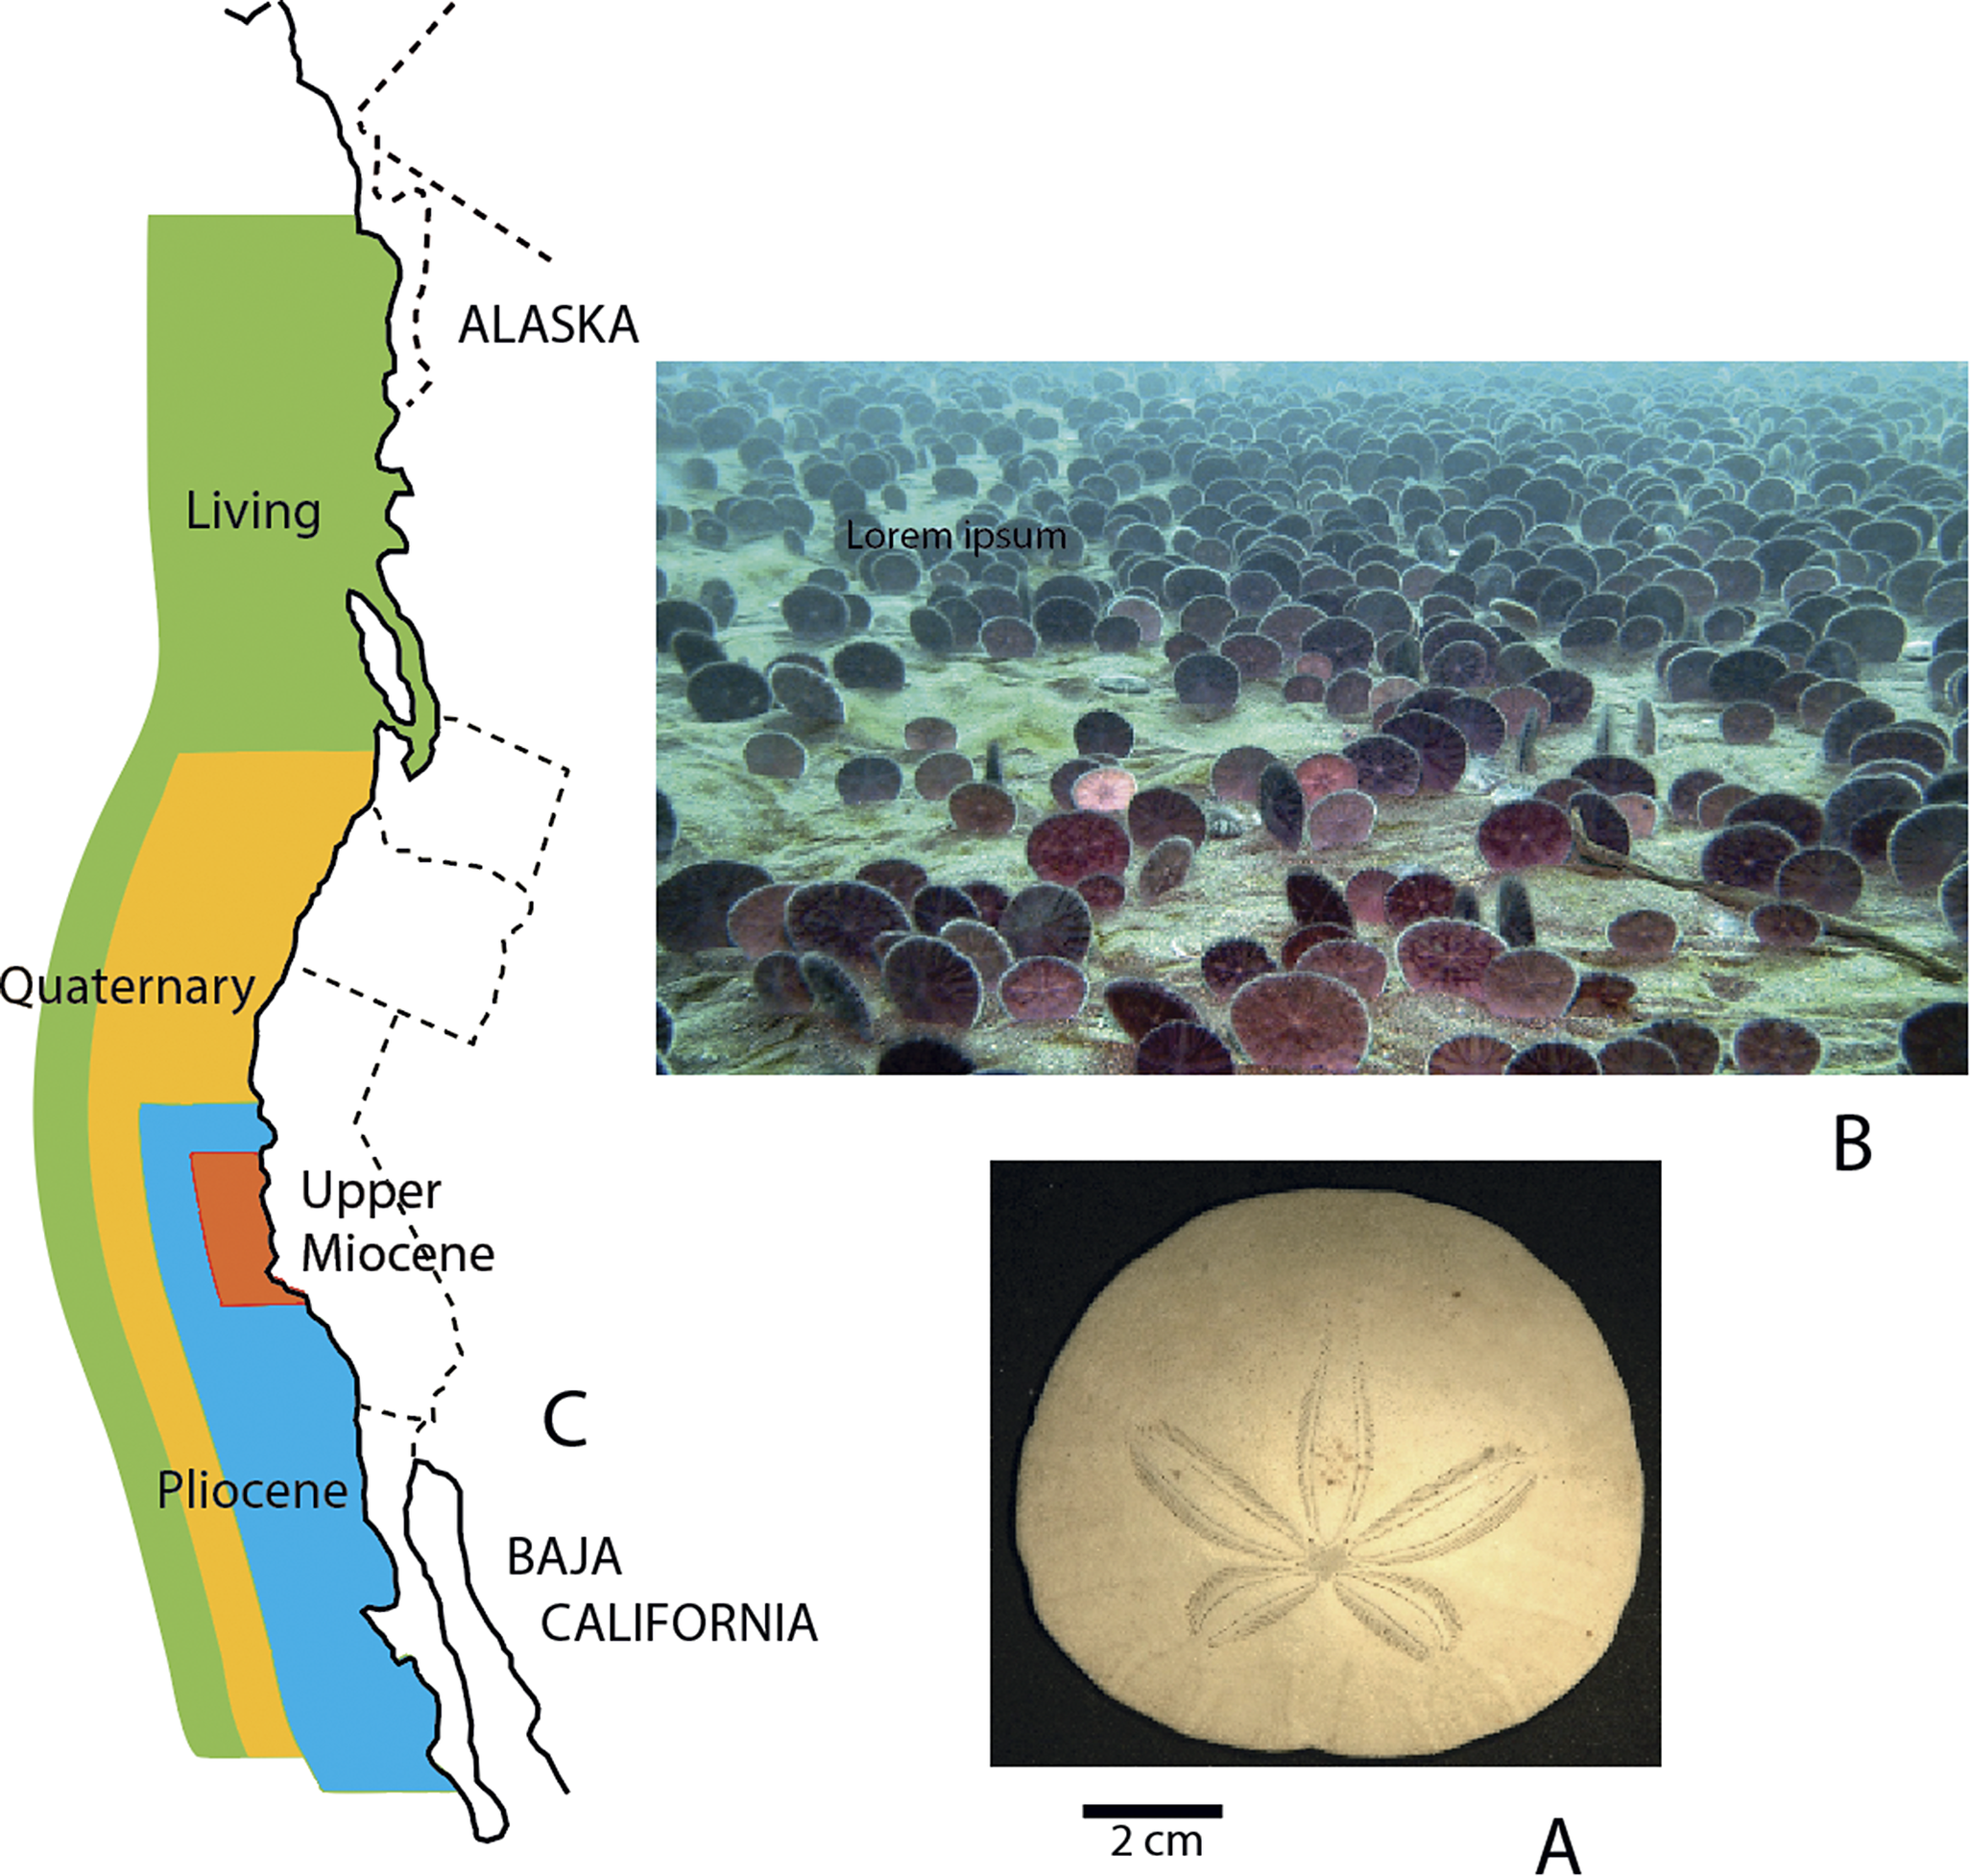
A spectacular example of punctuational speciation documented in the fossil record is the origin of the distinctive sand dollar Dendraster (Fig. 6A). It is so unusual as to not only have been recognized as a new genus but even as an eponymous new family, the Dendrasteridae. A typical sand dollar lies shallowly buried and flat in sand, feeding on interstitial organic particles. Dendraster is a unique sand dollar genus, standing upright, angled forward, with only its posterior region buried in the sand. In this posture, it collects particulate food as a suspension feeder, taking advantage of the high concentrations of organic matter in the waters of the Eastern Pacific that result from extensive upwelling. Herds of Dendraster are densely spread over large areas (Fig. 6B). The mouth of Dendraster is not located in the middle of the animal, as in a normal sand dollar, but toward the posterior, so that the feeding area is expanded.
The sand dollar Dendraster. A, The species D. excentricus, which lives offshore from California today. Its anus, like its mouth on the other side, is acentric. B, A large herd of members of this species sitting upright in their feeding position. C, A map showing the small area in which the genus originated in the latest Miocene and its subsequent ranges as it spread northward and southward (after Beadle Reference Beadle1991).

Beadle (Reference Beadle1989, Reference Beadle1991) provided a remarkable analysis of the origin of Dendraster, which has an excellent fossil record. The genus appears suddenly in sediments dating to somewhere between 6.5 and 6 Ma; now it ranges from Baja California to Alaska (Fig. 6C). Dendraster evolved from Echinarachnius, which, as an adult, is a typical sand dollar with a centrally positioned mouth and a shallow infaunal life position. It turns out, however, that as a juvenile, Echinarachnius has an acentric mouth. Dendraster evolved from it via neoteny, with the juvenile shape of the ancestral form persisting to adulthood.
The origin of Dendraster is a remarkable example of punctuational evolution. In effect, this event had a point source. In a small area and rapidly, on a geologic scale of time, a new family of animals arose that was unique in both morphology and mode of life.
The Importance of Regulatory Genes and Developmental Biology
In the past, many workers viewed evolution from the standpoint of what Ernst Mayr termed “beanbag genetics.” They assumed that evolution moved forward by way of sequences of genetic changes that had small phenotypic effects (Mayr Reference Mayr1970: p. 263). Darwin himself viewed evolution in this way (Darwin, Reference Darwin1859: pp. 84, 95). However, biologists now recognize that the mutation of a single gene has often produced a major successful morphological change. Some structural genes have been found to be genes of great effect. But changes in regulatory genes, which turn structural genes on and off, can suddenly wreak especially large changes for a phenotype. These genetic changes have especially pronounced effects when they come into play early in ontogeny and alter the course of development profoundly.
A classic example of a major developmental evolutionary shift via a simple genetic change is the origin of the axolotl, Ambystoma mexicanum, which was originally found in several lakes underlying what is now Mexico City but is now endangered (IUCN SSC Amphibian Specialist Group 2020). The axolotl is an amphibian that evolved by paedomorphosis: It fails to grow up but remains aquatic, never metamorphosing to become a terrestrial animal. The axolotl lacks the hormone that induces an amphibian’s thyroid to produce thyroxine, which causes metamorphosis. If provided with this hormone, the axolotl undergoes metamorphosis and moves onto the land to live like a salamander.
How Artificial Breeding Illuminates Punctuational Speciation
Darwin, of course, recognized that artificial selection is analogous to natural selection. He himself bred pigeons, but dog breeding is especially relevant to our understanding of punctuational evolution. It turns out that the numerous, highly varied dog breeds we have created from wolves are, quite remarkably, the products of very few genes of great effect (Conger Reference Conger2010). For example, just two mutations cause bradycephaly (a flat face) in dogs like pugs and bulldogs (Ekenstedt et al. Reference Ekenstedt, Crosse and Risselada2020), and a small founder population endowed the English bulldog with very low genetic diversity (Pedersen et al. Reference Pedersen, Pooch and Liu2016), suggesting that it originated within just a few years.
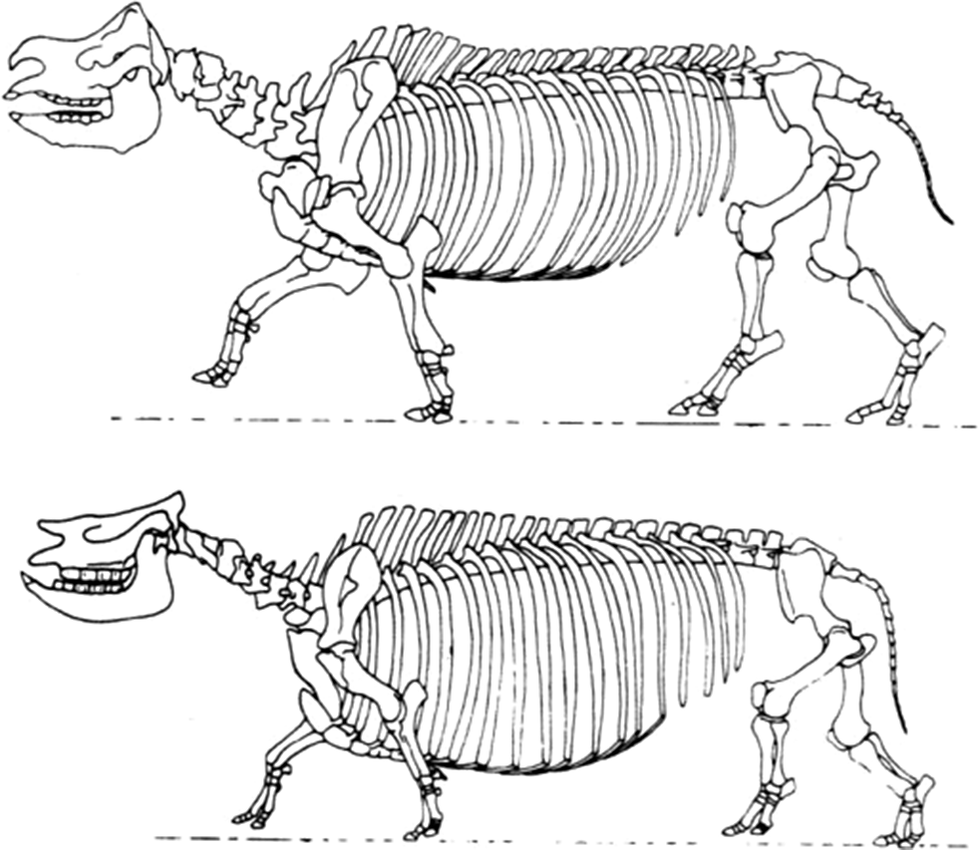
Achondroplastic (very short-legged) sheep have arisen twice accidentally by way of a single mutation. Similar dwarfs have arisen in numerous other domestic animals (Grüneberg Reference Grüneberg1963). The extinct achondroplastic, short-legged rhinoceros Teleoceros (Fig.7) illustrates how the mutation of a single gene can also play a major role in punctuational speciation—and in this case, the creation of a new genus. Apparently well adapted to its environment, Teleoceros arose and became widespread in North America during the Miocene (Wang and Secord Reference Wang and Secord2020).
Bottom, The skeleton of the dwarf Miocene rhinoceros Teleoceros fossiger showing the effects of achondroplasia. Top, The skeleton of the living Indian species Rhinoceros unicornis. (Drawings by Gregory S. Paul.)

Species Selection
Given that established species live very long without changing appreciably, it is inconceivable that phyletic evolution could have produced the large-scale evolutionary trends that have occurred in the history of life. There must be one or more other ways in which phylogenies have undergone major shifts. I believe that these large-scale trends must usually have been the result of selection at the level of the species, which I have termed “species selection” (Stanley, Reference Stanley1975a, Reference Stanley1979).
Natural selection at the individual level entails not only so-called survival of the fittest but also differences among individuals in fecundity. The best of both worlds in natural selection at the species level is to be inherently (for genetic reasons) the kind of individual that tends to live a long time through its reproductive interval and also tends to produce offspring at a high rate. Species selection is analogous, with extinction taking the place of death and speciation taking the place of reproduction. This does not deny the role of selection at the individual level, but simply has it operating primarily in speciation events: It is still the predominant process for the origin of species, which are then subject to species selection. Figure 8 depicts an artificial phylogeny created to show how species selection operates.
A diagram designed to illustrate species selection. The trend for the phylogeny moves to the right, because the average rate of speciation increases in this direction and the average rate of extinction, which is the inverse of mean species duration, declines in the same direction. The extinction rate on the left side of the phylogeny exceeds the speciation rate, so the left side of the phylogeny shrinks away. The speciation rate on the right side of the phylogeny exceeds the extinction rate, so the phylogeny expands to the right. (From Stanley Reference Stanley1979.)

Playing a lesser role in the production of phylogenetic trends is what I have termed “phylogenetic drift,” which is a matter of chance for small phylogenies that is analogous to genetic drift at the individual level; also playing a lesser role in producing phylogenetic trends is what I have termed “directed speciation,” which is a bias in the direction taken by speciation events (Stanley Reference Stanley1979). The latter is what produced the artificial phylogenetic trend that Eldredge and Gould (Reference Eldredge, Gould and Schopf1972) depicted (shown here as Fig. 9).
Diagram from Eldredge and Gould (Reference Eldredge, Gould and Schopf1972: figs. 5–10) showing that they believed macroevolutionary trends develop by way of a bias in the direction taken by speciation events. This is not species selection, but what I have termed “directed speciation” (Stanley Reference Stanley1979).
Even Darwin Recognized Species Selection
It has not been generally appreciated that Darwin himself recognized that selection occurs not only at the individual level but also at the species level. For example, using the tree metaphor for phylogeny, with twigs representing species, on page 129 of the chapter of The Origin of Species entitled “Natural Selection” he wrote (italics added):
The green and budding twigs may represent existing species; and those produced during each former year may represent the long succession of extinct species. At each period of growth all the growing twigs have tried to branch out on all sides, and to overtop and kill the surrounding twigs and branches … Of the many twigs which flourished when the tree was a mere bush, only two or three, now grown into great branches, yet survive and bear all the other branches.
In other words, Darwin believed that differences in rates of speciation and extinction resulting from interactions among species reshape phylogeny. This is species selection.
Why Darwin Was a Gradualist
Darwin was a gradualist, and he was right that species selection could have operated in a world in which evolution was predominantly gradual. Many segments of The Origin illustrate Darwin’s gradualism, which he apparently emphasized at least in part to explain to people why they did not see evolution going on all around them. He wrote these gradualistic passages:
It may be said that natural selection is daily and hourly scrutinizing, throughout the world, every variation, even the slightest, rejecting that which is bad, preserving and adding up all that is good; silently and insensibly working, whenever and wherever opportunity offers … We see nothing of these slow changes in progress until the hand of time has marked the long lapse of ages. (p. 84)
Natural selection can act only by the preservation and accumulation of infinitely small inherited modifications. (p. 95)
Darwin could not have portrayed evolution as being punctuational. Skeptics would have claimed that he was talking about a process that operated in a way that made it impossible to document. Why would anyone believe him? They would also have insisted that he was observing evidence for special creation.
The Shape of Phylogeny
What is often called “the tree of life” is not actually shaped like a tree, as often depicted, with lineages having V-shaped connections. It is also not shaped like a cladogram that has the configuration of a bunch of tuning forks attached to one another. New species seldom form by the splitting in half of an existing species that disappears in the process. Instead, as illustrated here in Figure 8, a new species usually forms by branching rapidly from its parent species, and the parent species lives on without significant change.
Figure 8, however, must be slightly exaggerated in being perfectly rectangular. Some lines depicting speciation events and lineages should presumably be slightly angled or curved. Even so, the speciation events should generally be represented by nearly horizontal lines. For example, even if one of these spans 5000 years, this will only be one-tenth of 1% as long as the continued existence of its parent species if that species survives for another 5 Myr. Furthermore, many speciation events must be much more rapid than this.
The Punctuational Model and the Role of Sexual Reproduction
In the Modern Synthesis of Evolution sexual reproduction was seen as providing two benefits. One was the shuffling of genes to provide useful new combinations. The other was spreading new mutations and gene combinations throughout populations. Both of these were seen as functioning to accelerate phyletic evolution.
The punctuational model has required a revised interpretation of the role of sexual reproduction that has nothing to do with phyletic evolution because its role is so minor. The evidence that evolution occurs predominantly within speciation events indicates that this is where we should look for an explanation, and here I describe the one I provided soon after my original paper on punctuational evolution and later presented in greater detail (Stanley Reference Stanley1975b, Reference Stanley1979).
Bacteria are asexual but exchange genetic material by conjugation and other means. Asexual eukaryotes, however, must evolve only by way of mutations. Therefore, they cannot evolve and diversify nearly as rapidly as sexual eukaryotes can by way of speciation. Stebbins (Reference Stebbins1950: pp. 41, 417) recognized this. He observed that plant groups that begin engaging in clonal reproduction cannot evolve rapidly, have a poor capacity for diversification, and tend to die out soon after arising.
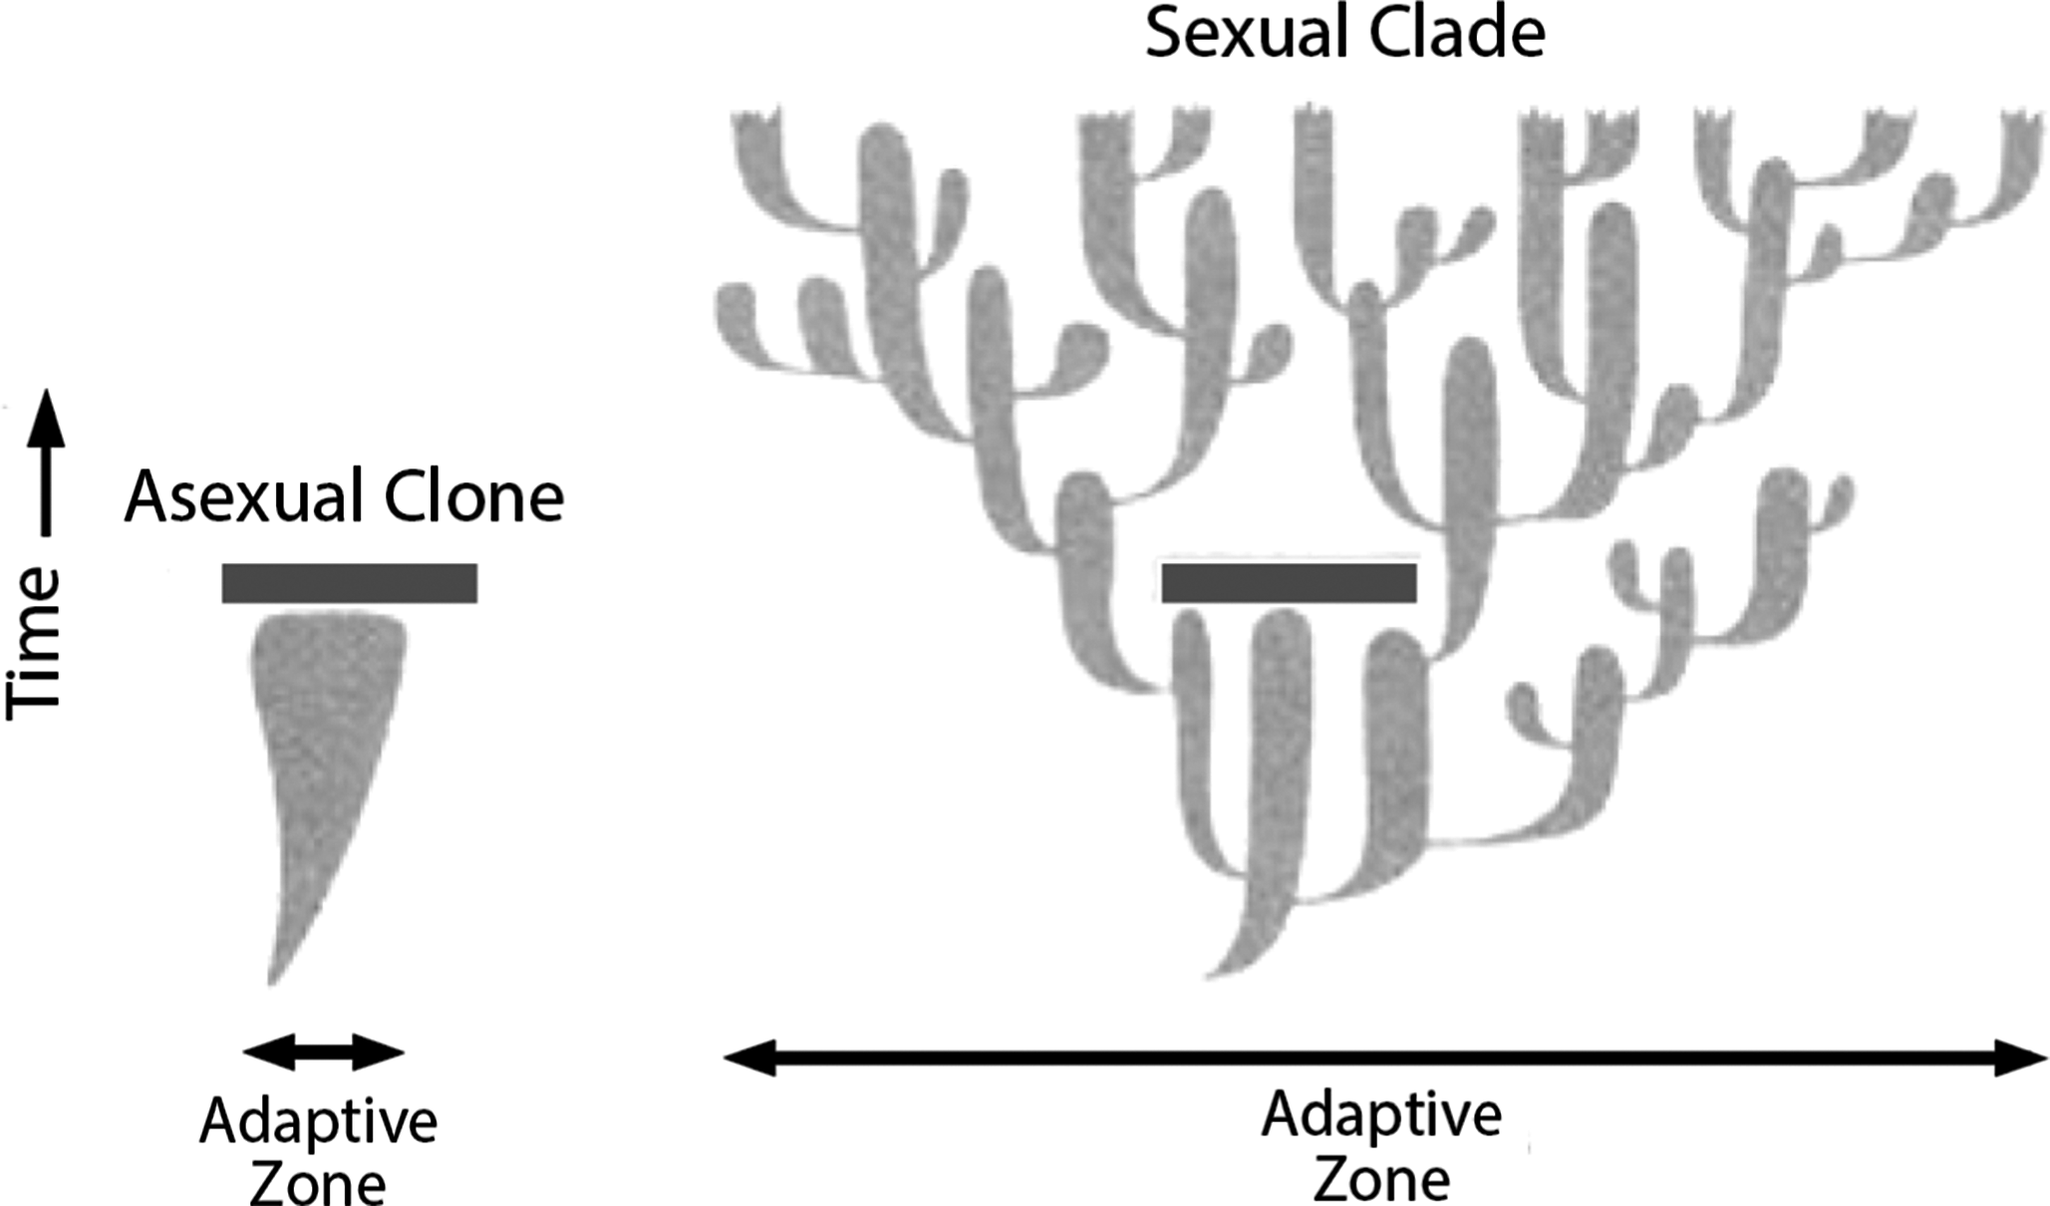
I have argued that the inability of asexual eukaryotes to speciate because they lack genetic recombination and cannot spread useful genetic traits explains why they are so rare. Figure 10 illustrates their problem diagrammatically by way of two imaginary taxa that arise at the same time and are identical, except that one is asexual and the other is sexual. Via speciation, the sexual taxon soon has a much broader adaptive zone than the asexual one, and when a negative perturbation of the environment occurs, it wipes out the entire asexual clone. The sexual clade, having expanded greatly, survives and continues to radiate.
A diagram illustrating the value of sexual reproduction by contrasting the histories of diversification of two species that are identical, except that the one on the left reproduces asexually and the one on the right reproduces sexually. The clone that the asexual species gives rise to expands its adaptive zone very slowly, while the speciating clade that the sexual species gives rise to expands its adaptive zone very rapidly. An environmental perturbation (solid bar) causes the extinction of the clone, while the clade survives the same kind of perturbation and continues to expand. (After Stanley Reference Stanley1975b, Reference Stanley1979.)

The Bdelloida (a group of tiny rotifers) offers strong support for the above conclusion. This appears to be the most diverse living asexual metazoan taxon. About 450 “species” of bdelloids have been described (Hendrik Reference Hendrik2007), and DNA studies indicate that the actual number is likely to be twice this high (Kaya et al. Reference Kaya, Herniou, Barraclough and Fontaneto2009). Molecular genetics studies have estimated the bdelloids’ time of origin to have been about 40 Ma (Welch and Meselson Reference Welch and Meselson2000).
How have the bdelloid rotifers been able to radiate like sexual animals without exchanging genetic material? This is clearly because, unlike other asexual eukaryotes, bdelloids are almost indestructible. They can be totally desiccated, and if you add water, they come back to life; they have also survived heavy bombardment with X-rays and other kinds of radiation in the laboratory that would kill other animals (Hespeels et al. Reference Hespeels, Penninckx, Cornet, Bruneau, Bopp, Baumlé and Redivo2020). They can also be frozen and then thawed without harm. In fact, ones that had been frozen in Siberian ice for the past 24,000 years were brought back to life, and a culture was established from one of their single thawed individuals (Shmakova Reference Shmakova, Malavin, Iakovenko, Vishnivetskaya, Shain, Plewka and Rivkina2021)! The fact that the bdelloids are all parthenogenetic indicates that they are a monophyletic clone. Unlike the clone depicted in Figure 9, however, they have been essentially immune to environmental perturbations, so they have been able to diversify persistently by way of mutations. Being essentially extinction-proof, they represent an exception that would seem to prove (or at least strongly support) the rule that asexual eukaryotes are rare because they nearly always suffer rapid extinction.
Biologic Communities Have Not Coevolved by Way of Gradualism
The punctuational model opposes a traditional idea as to how organisms relate to their environment. It has commonly been thought that communities of species are coadapted groups molded by phyletic evolution, for example: “The biosphere is thus itself a complex adaptive system whose composition changes evolutionarily … Unquestionably, the primary units of selection are at the level of individuals” (Levin Reference Levin1998, p.434).
The latitudinally arranged forest biomes in eastern North America represent a striking exception to this idea. Fossil pollen in lakes has revealed that during Pleistocene climatic shifts, various tree species constituting particular modern biomes have been shuffled about, responding differently to complexly changing climatic conditions and forming unique communities (e.g., Williams et al. Reference Williams, Shuman, Webb, Bartlein and Leduc2004). Rather than evolving, they have migrated independently. So-called non-analogue communities of mammals have also resulted from Pleistocene climatic fluctuations (Stewart Reference Stewart2008). For example, hippopotamuses actually migrated to join a community in England during the Pleistocene (Adams et al. Reference Adams, Candy and Schreve2022). So none of these terrestrial communities represent coadapted groups of species produced by phyletic evolution over vast stretches of time. They are temporary assemblages of species that happen to have similar environmental requirements.
The transitory nature of communities is also seen in the marine realm. Buzas and Culver (Reference Buzas and Culver1998), for example, showed that every time there was a marine transgression along the North American Atlantic Coastal Plain between Eocene and Pliocene times, a unique group of benthic foraminiferan species invaded shallow embayments from farther offshore. Then, during regressions, emigrants dispersed offshore across broad geographic areas, and about a quarter never returned to the same shallow embayments during subsequent transgressions. The geographic distribution of each species was unique in space and time.
Conclusions
-
1. The fact that the fossil record shows species customarily to have survived for millions of years without evolving enough to be recognized as new species is the simplest form of evidence supporting the punctuational model of evolution.
-
2. The Test of Adaptive Radiation makes use of the great longevity of species. For example, it shows that 9 mammalian families arose in the middle Eocene, which spanned only 3 Myr, while the mean longevity for species within these families was 3.5 Myr. Thus, phyletic evolution could not have created the new families. Similarly, 12 new families of bivalve mollusks arose in the Late Cretaceous, which spanned 33.5 Myr, whereas mean species duration for bivalves has been between 11 and 14 Myr, which was also too long for phyletic evolution to have created the new families. A series of divergent speciation events must have produced the new mammalian and bivalve families, providing strong support for the punctuational model. If this test were applied more broadly, the result would be the same, because all mean species durations that have been measured for numerous taxa are quite lengthy.
-
3. The Test of Living Fossils also favors the punctuational model. It shows that the extant members of long, slender clades, which have included only a few speciation events and depended on phyletic evolution for change, are very similar to their most ancient ancestors. This is why they are known as “living fossils.”
-
4. Several multivariate morphological studies of populations within animal lineages have all found phyletic evolution to have been quite rare or absent. One was a multivariate study of 19 species of late Cenozoic bivalve mollusks. Two others evaluated 153 and 250 traits of species lineages, respectively, representing a wide variety of taxa. A third produced a stratophenetic phylogeny for a bryozoan genus that was totally punctuational.
-
5. A number of biological studies have identified examples of rapid speciation, and some have recognized punctuational speciation events.
-
6. Regulatory genes have played a major role in punctuational speciation. Some of these have yielded sudden paedomorphic transformations.
-
7. Artificial breeding has revealed that one or two mutations can produce a substantial morphological change. The diverse morphologies of our many dog breeds are controlled by very few genes.
-
8. Most large-scale evolutionary trends are the result of species selection, which is analogous to natural selection at the individual level, with speciation taking the place of birth and extinction taking the place of death. Natural selection at the level of the individual is the primary agent for the origin of species, which are then subject to species selection.
-
9. Darwin himself recognized selection at the level of the species as well as at the level of the individual, but in the context of gradualism, because he had no choice but to be a gradualist. Punctuational evolution would have looked like special creationism to his contemporaries.
-
10. The punctuational model provides an explanation for the predominance of sexual reproduction among eukaryotes. Asexual eukaryotes, lacking genetic recombination and the ability to spread useful genetic traits, are unable to speciate. As a result, they diversify very slowly by way of mutations and tend to suffer rapid extinction. In contrast, sexual taxa can diversify rapidly by way of speciation events and thus avoid early extinction. Thus, the reason that eukaryotic taxa require sexual reproduction is that they could not survive long without speciating. Bdelloid rotifers are exceptional asexual animals in having diversified successfully, but this is because they are almost immune to extinction.
-
11. The punctuational model debunks the traditional idea that over long stretches of time phyletic evolution has produced communities of species that have been coadapted to live together in harmony. This notion is belied by the fossil record’s demonstration that species have recently been shuffled about independently by environmental changes so that modern communities are simply temporary assemblages.
Acknowledgments
I thank J. Kastigar for all of her help.
Competing Interests
The author declares no competing interests.


 Open access