


INTRODUCTION
As polarization reaches historic levels across American legislative landscapes, researchers and pundits have placed renewed attention on the relationship between candidate extremity and campaign contributions. One common claim is that donors disproportionately favor more extreme candidates and, as a result, that campaign finance contributes to the extraordinary polarization of American politics. Yet donors’ preferences could also act as a moderating filter in American elections, just as voters prefer moderates at the general-election ballot box. Do donors advantage relative moderate or extremist candidates?
Despite its far-reaching electoral import, obtaining direct empirical evidence on this question is challenging, because candidates may strategically select into running based on their fundraising prospects, and traditional measures of candidates’ ideological positioning are endogenous to their fundraising outcomes. As a result of these measurement and design problems, or their focus on a limited sample of elections, existing research reaches widely conflicting conclusions—from a fundraising advantage for more extreme candidates (Ensley Reference Ensley2009; Oklobdzija Reference Oklobdzija2017; Stone and Simas Reference Stone and Simas2010) to a penalty imposed by access-seeking donors (Barber Reference Barber2016b; Hall Reference Hall2015; Meisels Reference Meisels2025).Footnote 1 Resolving this discrepancy is central to understanding the forces shaping the ideological composition of American legislatures, because fundraising plays a critical role in determining who runs for office (Carnes Reference Carnes2018; Fowler and McClure Reference Fowler and McClure1990; Thomsen Reference Thomsen2014; Reference Thomsen2017), whether candidates persist across election cycles (Bonica Reference Bonica2017; Thomsen Reference Thomsen2025), and which candidates ultimately prevail (Avis et al. Reference Avis, Ferraz, Finan and Varjão2022; Erikson and Palfrey Reference Erikson and Palfrey2000; Fouirnaies Reference Fouirnaies2021; Gerber Reference Gerber1998; Green and Krasno Reference Green and Krasno1988).
To overcome these challenges, this article pairs a new candidate ideology scaling and a massive dataset of primary-election vote returns with a regression discontinuity (RD) design originated by Hall (Reference Hall2015) to evaluate whether general-election donors punish extremist primary nominees in Congress, 1980–2022, and state legislatures, 1996–2022. This new ideology scaling is trained exclusively on primary-election contributions made by individual donors, allowing me to capture candidates’ ideological positioning without contamination from general-election fundraising and strategic donors, and correlates highly within party with standard measures of roll-call voting (
 $ r=0.74 $
for Democrats and
$ r=0.74 $
for Democrats and
 $ r=0.70 $
for Republicans). Further, by incorporating state legislative elections alongside congressional races, I expand my sample 15-fold and gain leverage to examine heterogeneity across dimensions of press coverage, election salience, and the timing of elections.Footnote 2 Taken together, this central design identifies the effect of nominating a relative extremist candidate in the primary election on their party’s share of general-election contributions, holding fixed all district-level confounders. I complement this approach with a panel-based identification strategy that extends the analysis to the universe of contested general elections.
$ r=0.70 $
for Republicans). Further, by incorporating state legislative elections alongside congressional races, I expand my sample 15-fold and gain leverage to examine heterogeneity across dimensions of press coverage, election salience, and the timing of elections.Footnote 2 Taken together, this central design identifies the effect of nominating a relative extremist candidate in the primary election on their party’s share of general-election contributions, holding fixed all district-level confounders. I complement this approach with a panel-based identification strategy that extends the analysis to the universe of contested general elections.
Combining the RD design with my primary-specific ideology scaling, I find that the “coin-flip” primary nomination of an extremist over a more moderate opponent decreases their party’s share of general-election contributions by 7 percentage points in the median election in my sample. This financial penalty increases to 18–19 percentage points when the contrast between candidates is most pronounced and is largest in highly-consequential open-seat elections. Disaggregating by donor type, I further show that corporate PACs punish extremist nominees at nearly three times the rate of individual donors and that this penalty is driven symmetrically by donors withdrawing support from the extremist’s party and rallying behind their opponent.
To assess the robustness of these central results, I replicate my baseline analyses using a panel-based identification strategy from Ansolabehere, Snyder, and Stewart (Reference Ansolabehere, Snyder and Stewart2001) that compares changes in candidates’ general-election fundraising as the midpoint between Democratic and Republican general-election candidates varies. This design uses district-by-regime fixed effects to hold district-level confounders constant and allows me to study the universe of contested general elections. My estimates using this method are very similar in magnitude to the RD, yet substantially more precise, suggesting that the financial penalty to extremists extends beyond the set of districts that feature close contested primary elections. Leveraging the statistical power that this design provides, I also show that my results are robust to an alternative measure of candidate ideology based entirely on the roll-call voting records of candidates who have served, currently serve, or will serve in legislative office.
Building on these central findings, I adapt my panel-based identification strategy to examine how the financial penalty to extremist primary nominees has evolved over time. Using this design, I document that the financial penalty to extremist nominees has declined by nearly 50% since 2000, both among corporate PACs and individual donors.
Finally, I harness the rich institutional heterogeneity within and between state legislatures to help account for this decline and better understand where the financial penalty to extremist nominees is largest. Pairing a difference-in-differences design from Fouirnaies (Reference Fouirnaies2018) with models of electoral selection, I present evidence that corporate PACs have strategically reallocated funds to extremists because these candidates are increasingly electorally viable, rather than due to differential changes in the expected tenure or value of access through moderates versus extremists.Footnote 3 Additional analyses reveal that the financial penalty to extremist nominees is larger when press coverage is stronger or elections are more salient—suggesting that structural changes in the media environment and the increasing importance of top-of-the-ballot elections also help explain the decline of the financial penalty.
Collectively, these results temper claims that donors’ first-order preferences for extremist candidates fuel legislative polarization, at least in general elections. My findings indicate that general-election donors instead act as a moderating filter in American elections when parties run extremist candidates, but one that has faded in recent years.Footnote 4
The remainder of this article is organized as follows. In the next section, I outline theoretical and empirical perspectives on individual and corporate donors’ support for more extreme candidates. Then I introduce my empirical strategy, including the primary-election data, RD design, and new ideological scaling. Drawing on this design, the following section examines the aggregate effect of extremist nominees on campaign contributions. Next, I disaggregate the overall effect by donor type. I then replicate my main results using an observational panel method that allows me to generalize beyond districts featuring close contested primary elections and evaluate how the penalty has changed over time. The following section leverages the institutional heterogeneity within and between state legislatures to help understand where the financial penalty to extremists is largest and why it may have declined. Finally, I discuss key implications and conclude.
THEORETICAL AND EMPIRICAL PERSPECTIVES ON DONOR SUPPORT FOR MORE MODERATE AND EXTREME CANDIDATES
Campaign contributions in American elections are the product of a combination of strategic and expressive motivations. To interpret the financial consequences of nominating a relative extremist over a moderate, it is important to consider how these distinct motives might influence donors’ support for more moderate versus more extreme candidates. In particular, I focus on corporate PACs and individual contributors, which are two of the largest sources of direct campaign funds in American elections. As I outline below, corporate PACs are typically understood as strategic, access-seeking actors, while individual donors are thought to contribute expressively to candidates who align with their ideological preferences. Yet, as I discuss below, these motivations generate competing expectations about whether each group systematically favors relative moderate or extremist candidates. Ultimately, resolving this tension is a key empirical contribution of this article.
Corporate PACs
Corporate PACs are widely viewed as strategic, instrumental contributors, but theories of the type of influence they pursue have shifted over time. Early theories of corporate PAC behavior often modeled campaign contributions as instruments exchanged in a competitive market for immediate private benefits (e.g., Baron Reference Baron1989; Denzau and Munger Reference Denzau and Munger1986; Grossclose Reference Grossclose1996; Grossman Reference Grossman1994; Grossman and Helpman Reference Grossman and Helpman1996; Reference Grossman and Helpman2001; Lessig Reference Lessig2011). In these models, donors “bid” to maximize expected policy returns, and candidates adjust their representation to match donors’ preferences. Even beyond important identification concerns, however, empirical tests of these models have produced inconsistent and often null results.Footnote 5 In a review of 36 prior studies, Ansolabehere, de Figueiredo, and Snyder (Reference Ansolabehere, de Figueiredo and Snyder2003) find that three in four estimates linking contributions to favorable roll-call votes are either statistically insignificant or reach opposite conclusions. Moreover, as Tullock (Reference Tullock1972) first observed, the sheer scale of potential policy rents vastly exceeds observed contribution levels, raising questions about whether donations directly purchase favorable legislative outcomes at all.Footnote 6
In response to these limitations, more recent work suggests that corporate PACs primarily contribute to gain access to policy markers and influence which issues receive attention, rather than directly affect legislative outcomes (Hall and Wayman Reference Hall and Wayman1990; Snyder Reference Snyder1992).Footnote 7 Consistent with this view, empirical work finds that corporate PACs target powerful legislators and committee members (Fouirnaies Reference Fouirnaies2018; Fouirnaies and Hall Reference Fouirnaies and Hall2018; Reference Fouirnaies and Hall2022; Grier and Munger Reference Grier and Munger1991; Powell and Grimmer Reference Powell and Grimmer2016; Romer and Snyder Reference Romer and Snyder1994), incumbents (Fouirnaies and Hall Reference Fouirnaies and Hall2014), and members of the majority party (Cox and Magar Reference Cox and Magar1999). While the ultimate policy value of this access remains unclear (Fowler, Garro, and Spenkuch Reference Fowler, Garro and Spenkuch2020; Fouirnaies and Fowler Reference Fouirnaies and Fowler2022), experimental evidence suggests that revealed donors are substantially more likely to gain access to members of Congress than those who do not identify themselves as donors (Kalla and Brockman Reference Kalla and Brockman2016).
Although initially developed to model the market for private policy benefits, canonical theories of investor-contributors can also be adapted to characterize access-seeking corporate PACs’ allocation problem, as Baron (Reference Baron1989) suggests. Generally, these models imply that corporate PACs contribute to a candidate based on three key considerations: the probability the recipient wins, the recipient’s expected tenure in office, and the value of access through that recipient if elected (Baron Reference Baron1989; Palda Reference Palda1980; Snyder Reference Snyder1990; Reference Snyder1992; Reference Snyder1993; Welch Reference Welch1980). Candidates who are likely to win, remain in office, and/or hold influential positions should thus attract greater contributions from corporate PACs.
In practice, however, these three strategic considerations generate ambiguous predictions about whether corporate PACs favor relative moderate or extremist candidates. On the one hand, moderates may be more electorally viable (Ansolabehere, Snyder, and Stewart Reference Ansolabehere, Snyder and Stewart2001; Canes-Wrone, Brady, and Cogan Reference Canes-Wrone, Brady and Cogan2002; Hall Reference Hall2015; Hall and Snyder Reference Hall and Snyder2015; Handan-Nader, Myers, and Hall Reference Handan-Nader, Myers and Hall2025) and offer more stable, long-term access than more extreme candidates, causing corporate PACs to favor moderates. Alternatively, if the value of access through extremists is greater—whether because they are more likely to hold leadership positions, be a member of the majority, or simply get more done—corporate PACs may instead favor relative extremists.
Individual Contributors
Individual contributors, in contrast to corporate PACs, are theorized to support ideologically proximate candidates, primarily as a form of political expression (Ansolabehere, de Figueiredo, and Snyder Reference Ansolabehere, de Figueiredo and Snyder2003; Austen-Smith Reference Austen-Smith1987; Cameron and Enelow Reference Cameron and Enelow1992; Magee, Brock, and Young Reference Magee, Brock and Young1989; Morton and Cameron Reference Morton and Cameron1992). Consistent with these predictions, both survey and administrative data show that donors are more likely to contribute to candidates whose roll-call records or stated positions align with their own policy preferences (Barber Reference Barber2016a; Reference Barber2016c; Barber, Canes-Wrone, and Thrower Reference Barber, Canes-Wrone and Thrower2017; Gimpel, Lee, and Pearson-Merkowitz Reference Gimpel, Lee and Pearson-Merkowitz2008; Hill and Huber Reference Hill and Huber2017).
Yet despite their well-documented motivations, it remains uncertain whether individual donors favor relative moderates or extremists on average. One possibility is that individual donors may allocate general-election contributions in ways that mirror general-election voters’ revealed preference for moderation at the ballot box (e.g., Ansolabehere, Snyder, and Stewart Reference Ansolabehere, Snyder and Stewart2001; Canes-Wrone, Brady, and Cogan Reference Canes-Wrone, Brady and Cogan2002; Hall Reference Hall2015; Hall and Snyder Reference Hall and Snyder2015). But it is not immediately clear whether these electoral preferences translate into financial support, because donors are highly unrepresentative of the overall electorate. For example, prior research indicates that donors are disproportionately wealthy and well-educated (Verba, Schlozman, and Brady Reference Verba, Schlozman and Brady1995) and that they hold more ideologically extreme views than the average voter (Bafumi and Herron Reference Bafumi and Herron2010; Hill and Huber Reference Hill and Huber2017; La Raja and Schaffner Reference La Raja and Schaffner2015).Footnote 8 As a result, while general-election voters clearly reward relative moderates, the American donorate may be sufficiently skewed toward ideologues that individual contributors favor extremists on balance.
Prior Research on Moderate and Extremist Candidates’ Fundraising Prospects
A small number of important studies have used causal designs to identify whether donors advantage moderate or extremist candidates. Using an RD design in U.S. House elections, Meisels (Reference Meisels2025) finds that moderate primary-election nominees raise more contributions from corporate PACs than extremist nominees, while individual donors contribute similar amounts to moderates and extremists. My analysis complements, yet substantially improves upon, this research in scope, data, and design. First, while Meisels focuses on U.S. House elections, I study fundraising in all 49 partisan state legislatures and the U.S. Senate, in addition to the U.S. House. Including these additional contests increases my sample size 15-fold and substantially augments my statistical power. As I describe in the penultimate section, the rich heterogeneity across state legislatures also allows me to study how press coverage, election timing, and the salience of elections might moderate the financial penalty to extremist nominees all of which would be impossible using only data on U.S. House elections. Second, where Meisels differentiates moderate and extremist candidates using CFscores—which have low within-party correlations with roll-call voting records and include post-treatment contributions—I introduce and validate a new ideology scaling that uses only contributions received during the primary election from individual donors to scale candidates.Footnote 9 In subsequent sections, I show that failing to make this adjustment would cause the researcher to over-estimate the treatment effect by at least 35%.Footnote 10 Finally, in addition to an RD design, I apply a complementary panel-based identification strategy that allows me to generalize beyond the small set of districts featuring close contested primaries. This design also allows me to replicate my analyses using a measure of candidate ideology that is entirely distinct from campaign contributions.
Similarly, Hall (Reference Hall2015) finds tentative evidence in U.S. House races that the narrow primary nomination of an extremist candidate substantially decreases their party’s share of general-election contributions from all types of PACs. While these results are foundational, they do not speak to the donating behavior of individuals—the single largest source of campaign funds—or corporate PACs, nor do they capture how this financial penalty has evolved over time. As the subsequent analyses illustrate, studying the decline of the financial penalty to extremist candidates offers new insight into the motivations of corporate PACs and individual donors, in addition to establishing a highly consequential trend in American elections.
Finally, two important studies leverage state-level changes in campaign finance laws in a difference-in-differences framework to identify whether limits on corporate and individual donors (Barber Reference Barber2016b) or parties (La Raja and Schaffner Reference La Raja and Schaffner2015) increase legislative polarization. While valuable, these studies face the critical design challenge that states experiencing rising polarization may also be more likely to adopt new campaign finance restrictions, making it difficult to disentangle the effects of the policies from underlying political trends. The RD design I adopt holds fixed the underlying political environments, offering stronger identification of causal effects.
EMPIRICAL STRATEGY
Despite widespread interest in whether donors advantage relative moderates or extremists, obtaining causal evidence on this question is challenging because candidates may strategically select into running based on their fundraising prospects, and campaign contributions are also commonly used to estimate candidates’ ideology. This section addresses these two empirical challenges in turn. I begin by describing a research design that, drawing on Hall (Reference Hall2015) and Meisels (Reference Meisels2025), allows me to estimate the causal effect of nominating the extremist candidate in the primary election on their party’s fundraising outcomes in the general election. Given this research design, I then introduce a new purpose-built ideology scaling that addresses concerns about strategic donating and post-treatment bias while briefly documenting the breadth and importance of these concerns.
Regression Discontinuity Design in Primary Elections
To evaluate whether donors advantage moderates or extremists, I harness the “as-if” random variation in close primary elections between a relative moderate and extremist candidate. This RD design was first introduced by Hall (Reference Hall2015) to study U.S. House candidates’ general-election vote shares. More recently, Meisels (Reference Meisels2025) extends this design to fundraising in the U.S. House. In this section, I introduce the RD, and in the next section, I describe my procedure for identifying relative moderate and extremist primary candidates.
For the main results, I estimate equations of the form:
 $$ \begin{array}{l}{Y}_{dpt}={\beta}_0+{\beta}_1{Extremist\hskip0.3em Primary\hskip0.3em Win}_{dpt}\\ {}\hskip3em +f(ExtremistPrimaryWinMargi{n}_{dpt})+{\varepsilon}_{dpt,}\end{array} $$
where Extremist Primary Win
 $ {}_{dpt} $
is an indicator for the extremist candidate winning party p’s primary election in district d and year t, and
$ {}_{dpt} $
is an indicator for the extremist candidate winning party p’s primary election in district d and year t, and
 $ {Y}_{dpt} $
is the party’s share of a general-election financial outcome. The term
$ {Y}_{dpt} $
is the party’s share of a general-election financial outcome. The term
 $ f(ExtremistPrimaryWinMargi{n}_{dpt}) $
is a flexible function of the extremist candidate’s primary win margin (i.e., the running variable). This design facilitates direct counterfactual comparisons of parties’ general-election fundraising outcomes between districts that narrowly nominate the relative moderate and extremist primary-election candidate.
$ f(ExtremistPrimaryWinMargi{n}_{dpt}) $
is a flexible function of the extremist candidate’s primary win margin (i.e., the running variable). This design facilitates direct counterfactual comparisons of parties’ general-election fundraising outcomes between districts that narrowly nominate the relative moderate and extremist primary-election candidate.
For information on candidates’ primary-election vote shares in state legislatures, I draw on a massive original dataset of primary-election returns collected in collaboration with Fouirnaies and Hall (Reference Fouirnaies and Hall2020), Handan-Nader, Myers, and Hall (Reference Handan-Nader, Myers and Hall2025), and Rogers (Reference Rogers2023). Partial data on congressional primary elections comes from Ansolabehere et al. (Reference Ansolabehere, Hansen, Hirano and Snyder2010) and was extended through 2022 by the author.Footnote 11 For information on campaign contributions, I assemble a dataset containing all general-election contributions from the Federal Election Commission (FEC; used for Congress) and National Institute on Money in Politics (NIMSP; used for state legislatures). This dataset includes both itemized and unitemized contributions made after the date of the primary election but before the general election.Footnote 12 Collectively, these datasets cover the years 1980–2022 for the U.S. Senate and U.S. House and 1996–2022 for all 49 partisan U.S. state legislatures (Myers Reference Myers2025b).Footnote 13
The key identifying assumption underlying this design is that districts that narrowly nominate a relative moderate candidate are, in the limit, identical to districts that narrowly nominate the extremist candidate (Imbens and Lemieux Reference Imbens and Lemieux2008; Lee and Lemieux Reference Lee and Lemieux2010). In other words, there must be no district-level sorting at the discontinuity. As Eggers et al. (Reference Eggers, Fowler, Hainmueller, Hall and Snyder2015) note, this assumption is highly plausible because it is extremely unlikely that primary-election candidates would be able to manipulate vote totals in close elections, or even have the ability to identify their location relative to the discontinuity absent vote modification. Nevertheless, in Appendix B of the Supplementary Material, I test for any chance imbalances in my sample by reestimating Equation 1 where the outcome is the party’s share of fundraising in the previous election cycle or its lagged presidential or legislative vote share. If the “no sorting” assumption holds, these estimates should be null, indicating that, in districts where the moderate candidate barely wins, the party did no better in the prior election than in districts where the extremist candidate was nominated. The coefficients in Tables B.1 and B.2 in the Supplementary Material are all small in magnitude, indicating that there is no evidence of such bias.
Under this identification assumption, the RD estimates the effect of narrowly nominating the extremist candidate on their party’s general-election fundraising relative to a moderate. While observers may be most interested in districts featuring close primary elections because these contests are many of the settings where the estimated effects are likely to be most meaningful, the results are inherently local to a small subset of districts. To evaluate whether these estimates generalize to a broader array of electoral contexts, I replicate my main analyses using an observational panel method that is intended to hold district attributes constant. In addition to identifying a more general estimand than the RD, the panel method is more powerful, reducing the standard errors, and allows me to evaluate variation in the effects over time.
Finally, as Marshall (Reference Marshall2022) notes, my RD design identifies the aggregate effect of candidate ideology and all other candidate-level characteristics that differ between the two types of barely-winning candidates (i.e., compensating differentials). As Hall (Reference Hall2015) observes in the context of the electoral penalty to extremists, studying this bundled treatment is appropriate for evaluating the consequences of primary voters’ electoral selection and their implications for polarization, where all differences between candidate types matter. To understand the underlying mechanisms, however, it is important to examine whether moderate and extremist candidates differ on observable nonideological characteristics. In Appendix C of the Supplementary Material, I test whether barely-winning moderate and extremist candidates systematically differ in terms of incumbency status, prior office-holding experience, gender, and race. I find no significant differences across these characteristics.
Having described my empirical design, I proceed to outline how I identify relative moderate and extremist candidates. I begin by briefly discussing empirical challenges with existing ideology scalings before introducing a new scaling that addresses these concerns.
Measuring Ideological Positioning Using Primary-Election Contributions from Individual Donors
As the previous section suggests, consistently measuring the ideological positions of both successful and unsuccessful candidates is challenging, particularly when the outcome of interest is also campaign contributions. Traditionally, scholars have used campaign contributions to infer candidates’ ideological positioning (Bonica Reference Bonica2014; Reference Bonica2018), but, in the present study, this approach is liable to bias candidates’ estimated ideological positions because campaign contributions (i.e., the outcome) are partially determined by primary-election outcomes (i.e., the treatment). Specifically, using primary- and general-election contributions to scale candidates, and then studying general-election financial outcomes, may introduce endogeneity in two ways. For brevity, I outline these two concerns briefly below and refer the reader to Appendix A of the Supplementary Material for a more detailed discussion.
The first challenge posed by jointly scaling candidates based on the contributions they receive both before and after the primary election is that candidates’ positions in the associated scaling could be partially a function of their primary-election outcome. For example, some donors may prefer to contribute to candidates who run in the general election or weight ideological proximity differently in higher-salience general elections. This possibility would be problematic because it may cause bare-primary winners and bare-primary losers to appear systematically different, or even for their classification as relative moderates and extremists to be flipped.Footnote 14 A second concern is that candidates who experience more fundraising success may appear artificially moderate if donors contribute on the basis of candidates’ nonideological characteristics. For example, access-seeking corporate PACs may funnel contributions to candidates who are most likely to be elected, causing them—and the candidates to which they contribute—to appear artificially moderate (Hall and Snyder Reference Hall and Snyder2015).
To address these concerns, I restrict the data used to infer candidates’ ideological positions in two ways. First, due to concerns about post-treatment bias and the fact that primary-election winners will receive additional contributions in the general election that primary-election losers will not, I restrict the set of training contributions to those received in primary elections. This restriction matches the training procedures of Hall and Snyder (Reference Hall and Snyder2015). And second, because contributions made on the basis of nonideological candidate characteristics may cause candidates who are more successful fundraisers to appear artificially moderate, I further restrict the set of contributions that I use to scale candidates to donations made by individual donors, which are thought to contribute largely on the basis of ideological or partisan congruence.Footnote 15 This restriction matches the training procedures of Bonica (Reference Bonica2014; Reference Bonica2018). In sum, I impute candidates’ ideological positions using only contributions made by individual donors during the primary election.Footnote 16
The restrictions I impose are quite meaningful. In Appendix A of the Supplementary Material, I show that using post-treatment or nonideologically motivated contributions to scale candidates would cause the researcher to “flip” 17% of primary-election candidates’ designations as moderates and extremists, leading them to over-estimate the treatment effect by roughly 35%. I also present evidence in Appendix A of the Supplementary Material that these restrictions have their intended effect. Specifically, using a candidate-level RD, I show in Figure A.2 in the Supplementary Material that winning a primary election does not affect a candidate’s estimated ideology after making these restrictions. And, based on a series of simulations, I show in Figure A.3 in the Supplementary Material that altering a candidate’s primary-election fundraising success does not affect their estimated ideological positions.
With this prediction set in hand, I follow Bonica (Reference Bonica2018) and Hall and Snyder (Reference Hall and Snyder2015) and impute candidates’ ideology as the contribution-weighted average roll-call voting score of the incumbents to which a candidate’s donors also contributed.Footnote 17, Footnote 18 This estimation procedure proceeds in two stages and is conducted separately for members of Congress and state legislators. First, I estimate the ideology of all donors as the average contribution-weighted ideology of the incumbents to which a donor contributes. More formally, let
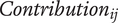 $ Contributio{n}_{ij} $
be the donation amount from donor j to candidate i and
$ Contributio{n}_{ij} $
be the donation amount from donor j to candidate i and
 $ Roll\hbox{-} CallVotin{g}_i $
be incumbent i’s roll-call voting scaling given by DW-NOMINATE for members of Congress (Lewis et al. Reference Lewis, Poole, Rosenthal, Boche, Rudkin and Sonnet2024) or their NP-Score for state legislators (Shor and McCarty Reference Shor and McCarty2011; Reference Shor and McCarty2025).Footnote 19, Footnote 20 Then, donor j’s revealed ideological preference is given by
$ Roll\hbox{-} CallVotin{g}_i $
be incumbent i’s roll-call voting scaling given by DW-NOMINATE for members of Congress (Lewis et al. Reference Lewis, Poole, Rosenthal, Boche, Rudkin and Sonnet2024) or their NP-Score for state legislators (Shor and McCarty Reference Shor and McCarty2011; Reference Shor and McCarty2025).Footnote 19, Footnote 20 Then, donor j’s revealed ideological preference is given by
 $$ DonorIdeolog{y}_{-i,\hskip0.1em j}=\frac{\sum_{w\ne i}Roll\hbox{-} CallVotin{g}_wContributio{n}_{wj}}{\sum_{w\ne i}Contributio{n}_{wj}}, $$
where I leave out candidate i when estimating donor j’s ideology to avoid a feedback loop.Footnote 21 Subsequently, I estimate each candidate’s ideology as
 $$ \begin{array}{rl}Cand\hskip0.35em Ideolog{y}_i=\frac{{\displaystyle \sum_j}DonorIdeolog{y}_{-i,j}Contributio{n}_{ij}}{{\displaystyle \sum_j}Contributio{n}_{ij}}.& \end{array} $$
For the remainder of this article, I refer to this scaling as a candidate’s Primary-Specific Scaling.
Using this Primary-Specific Scaling, I tentatively identify a primary election as occurring between a relative moderate and extremist when the ideological distance between the two candidates with the top primary-election vote shares is at or above the median of the distribution of ideological distances across my sample. In subsequent sections, I show that my results grow as this treatment intensity threshold increases.
Validating Primary-Specific Ideology Scaling
For candidates who ultimately take office, it is possible to validate this primary-specific scaling by comparing it with legislators’ observed roll-call voting records. I conduct two empirical exercises to facilitate this comparison.
First, Figure 1 plots the relationship between legislators’ Primary-Specific Scaling and their roll-call voting scores, as measured by DW-NOMINATE and NP-Scores. As the figure shows, the overall correlation is
 $ 0.91 $
, while the within-party correlation is
$ 0.91 $
, while the within-party correlation is
 $ 0.74 $
for Democrats and
$ 0.74 $
for Democrats and
 $ 0.70 $
for Republicans.
$ 0.70 $
for Republicans.
Correlation Between Primary-Specific Scaling and Roll-Call Voting
Note: This figure plots the correlation between general-election winners’ contribution-based estimated ideology (i.e., Primary-Specific Scaling) and their roll-call voting in office (i.e., DW-NOMINATE or NP-Scores) for Democrats (circles) and Republicans (triangles). Diamonds represent equal-sample-size averages of the data.

Second, I use legislators’ Primary-Specific Scaling to predict the outcome of nearly 84 million roll-call votes cast in Congress and state legislatures during my period of study. To do so, I follow Bonica (Reference Bonica2014; Reference Bonica2018) and calculate the share of roll-call votes that can be correctly classified using an optimal cutting-point procedure described in Poole (Reference Poole2007).Footnote 22 I report these results, and the coverage of my sample of roll-call votes, in detail in Appendix L of the Supplementary Material. In short, I find that my Primary-Specific Scaling correctly predicts 89.5% of roll-call votes in my sample (
 $ APRE=0.716 $
), outperforming CFscores and an indicator for party, and closely behind DW-NOMINATE and NP-Scores themselves (91.1%;
$ APRE=0.716 $
), outperforming CFscores and an indicator for party, and closely behind DW-NOMINATE and NP-Scores themselves (91.1%;
 $ APRE=0.759 $
).Footnote 23
$ APRE=0.759 $
).Footnote 23
In sum, despite restricting the size of the training contribution matrix, I am still able to consistently predict candidates’ roll-call voting records.
Finally, to ensure that my results are not an artifact of this contribution-based scaling, I replicate my main panel-based results in Appendix E of the Supplementary Material using a measure of candidate ideology that is independent of campaign contributions. This measure draws on the state legislative roll-call voting records of prior, current, or future state legislators who face another candidate with a state legislative roll-call voting record, either in a congressional or state legislative election. The results using this strategy are highly similar to the findings reported in the body of this article, but are estimated less precisely due to the limited sample size.
EFFECT OF EXTREMIST NOMINEES ON GENERAL-ELECTION CAMPAIGN CONTRIBUTIONS
Having detailed my empirical strategy and outlined competing theoretical perspectives on whether donors, on average, advantage extremist candidates, I begin by presenting results that focus on candidates’ aggregate fundraising outcomes. Then, to better understand the sources underlying these patterns, I disaggregate these financial outcomes by donor type and institutional settings in subsequent sections.
General-Election Donors Punish Extremist Primary Nominees
Do general-election donors punish extremist primary nominees on average? Figure 2 plots the data across the discontinuity to answer that question. In this figure, I tentatively identify a race as occurring between a relative moderate and extremist when the ideological distance between the two candidates is at or above the median of the distribution of ideological distances in my sample. The running variable on the horizontal axis of Figure 2 is the extremist candidate’s primary-election winning margin, and the outcome on the vertical axis is their party’s share of all contributions made during the general election. When the horizontal axis is greater than zero, the extremist candidate wins the primary nomination and represents their party in the general election. When the horizontal axis is instead less than zero, the moderate candidate wins the primary nomination and runs in the general election. As the figure depicts, when a district shifts from barely nominating a moderate candidate to an extremist, the candidate’s party receives approximately 7 percentage points less of general-election contributions.Footnote 24
Effect of Nominating the Extremist Primary-Election Candidate on Their Party’s General-Election Contribution Share in Congress, 1980–2022, and State Legislatures, 1996–2022
Note: The close primary nomination of the extremist candidate reduces their party’s share of general-election contributions by 7 percentage points relative to a more moderate candidate. Black dots represent averages within equal-sample-sized bins of the running variable. Red lines plot fitted values from OLS regressions estimated separately on either side of the discontinuity using the underlying data.

Table 1 evaluates this relationship more formally. As is standard in RD analyses, I report estimates across a variety of specifications for
 $ f(ExtremistPrimaryWinMargi{n}_{dpt}) $
and varying bandwidths. In the first column, I use a 10% bandwidth and a local-linear specification of the running variable that allows for different slopes on either side of the discontinuity (i.e., a spline). In the second column, I fit a third-order polynomial with a spline. The third column reports the effect estimated by the method from Calonico, Cattaneo, and Titiunik (Reference Calonico, Cattaneo and Titiunik2014), which uses kernel regression with a triangular kernel and a bandwidth that minimizes the mean-squared error of the estimator.Footnote 25 Finally, column 4 reports the estimate from Imbens and Wager’s (Reference Imbens and Wager2019) optimized RD estimator, which obtains the finite-sample minimax estimator for the discontinuity.Footnote 26
$ f(ExtremistPrimaryWinMargi{n}_{dpt}) $
and varying bandwidths. In the first column, I use a 10% bandwidth and a local-linear specification of the running variable that allows for different slopes on either side of the discontinuity (i.e., a spline). In the second column, I fit a third-order polynomial with a spline. The third column reports the effect estimated by the method from Calonico, Cattaneo, and Titiunik (Reference Calonico, Cattaneo and Titiunik2014), which uses kernel regression with a triangular kernel and a bandwidth that minimizes the mean-squared error of the estimator.Footnote 25 Finally, column 4 reports the estimate from Imbens and Wager’s (Reference Imbens and Wager2019) optimized RD estimator, which obtains the finite-sample minimax estimator for the discontinuity.Footnote 26
Effect of Nominating Extremist Primary-Election Candidate on Their Party’s General-Election Contribution Share in Congress, 1980–2022, and State Legislatures, 1996–2022

Note: The close primary nomination of an extremist reduces their party’s share of general-election contributions by 7 percentage points. Robust standard errors clustered by district are reported in parentheses. The running variable is the extremist candidate’s win margin in the primary election. Spline indicates that the regression function was fit separately on either side of zero. Cubic refers to a third-order polynomial regression. CCT refers to the method from Calonico, Cattaneo, and Titiunik (Reference Calonico, Cattaneo and Titiunik2014). IW refers to the method from Imbens and Wager (Reference Imbens and Wager2019).
Across specifications, Table 1 reports consistent negative effects of nominating an extremist primary candidate on the party’s general-election contribution share. Consider the coefficient reported in column 2. Here, I estimate that nominating an extremist causes a 7 percentage point decrease in their party’s share of total general-election contributions relative to a moderate.Footnote 27 Looking across the table, I find uniform evidence that extremist nominees damage their party’s fundraising prospects.
The estimates reported in Table 1 aggregate over a variety of different primary-election contexts. To better understand these effects, I disaggregate my overall results by two key features of primary elections.
First, a vast literature finds that incumbents enjoy a substantial electoral and financial advantage over their opponents (e.g., Fouirnaies and Hall Reference Fouirnaies and Hall2014). If incumbency status is correlated with ideological moderation, my results might be explained by the absence of a financial incumbency advantage following an extremist’s nomination.Footnote 28 To evaluate this possibility, I examine open-seat races—a set of primary contests where neither the relative moderate nor extremist possesses an incumbency advantage. Open-seat races are also highly consequential contests in and of themselves; fully 77% of state legislators and 64% of members of Congress first enter office through an open-seat election in my sample.
A second trait of primary elections that is relevant for interpreting these overall effects is whether a district is safe for the party holding the primary. In districts that are strongly aligned for the primary-holding party, the general-election outcome is relatively predictable, and donors may need not worry about the viability of an extremist nominee. Hence, the financial penalty to extremists may be smaller in these safe primary elections. I test this prediction by identifying districts as “safe” if a party’s share of the two-party presidential election vote averaged over a redistricting cycle is greater than 60%. In my sample, almost exactly 50% of districts are classified as “safe.”
The findings from this analysis are reported in Table 2. In the first column of Table 2, I replicate my baseline estimate from column 2 of Table 1. Column 2 then reports my estimate of the effect of nominating an extremist on general-election contributions in open-seat races. The effect in open-seat races is larger in magnitude than in my overall sample (−7 vs. −9 percentage points). Clearly, this result is inconsistent with the hypothesis that the observed aggregate effect is due to the removal of a financial incumbency advantage. Finally, the third estimate in Table 2 studies only districts that are “safe” for a party. As expected, I find that the financial penalty to extremists is smaller in these uncompetitive districts, perhaps due to heightened partisan loyalty or a lack of viable alternatives.
Effect of Nominating the Extremist Primary-Election Candidate on Their Party’s General-Election Contribution Share by Primary Type in Congress, 1980–2022, and State Legislatures, 1996–2022

Note: The financial penalty imposed on extremist primary nominees is largest in open-seat elections and smaller in districts that are safe for the party. Robust standard errors clustered by district are reported in parentheses. The running variable is the extremist candidate’s win margin in the primary election. Spline indicates that the regression function was fit separately on either side of zero. Cubic refers to a third-order polynomial regression.
Overall, this section has shown that donors, on average, punish parties that nominate extremist primary candidates. The effect is estimated to be larger in open-seat elections, where the electoral stakes are particularly high, and smaller in districts with uncompetitive general elections.
Financial Penalty Increases with Ideological Contrast
In the results presented so far, I have identified a primary election as occurring between a relative moderate and extremist when the ideological distance between the two candidates is at or above the median of the distribution of ideological distances across my sample. Since candidates’ ideological positions are estimated with a degree of error, this cutoff is designed to ensure that I analyze only true contrasts between candidates’ platforms. This cutoff also ensures that the difference between candidates’ ideological positioning is meaningful and that voters are able to distinguish relative moderate and extremist candidates.
There is nothing particularly unique about the median of this distribution, however, and we can learn more about the financial penalty to extremists by studying the variation across candidate contrasts. As the value of the ideological distance cutoff increases, the treatment intensity grows, so an important robustness check is to evaluate whether the identified treatment effect grows in parallel with the ideological cutoff. Figure 3 tests this prediction by estimating Equation 1 across values of the ideological distance cutoff. The horizontal axis of Figure 3 plots the cutoff value, and the 5th, 25th, 50th, 75th, and 95th percentiles of this distribution are reported at the top of the figure. The top panel plots the estimates and 95% confidence intervals across values of the cutoff. The lower panel reports the sample size for each regression. For reference, the estimate reported in column 2 of Table 1 is plotted in grey with an accompanying arrow.
Effect of Nominating the Extremist Primary-Election Candidate on Their Party’s General-Election Contribution Share Across Possible Ideological Cutoffs in Congress, 1980–2022, and State Legislatures, 1996–2022
Note: The top panel plots estimates from Equation 1 across different values of the ideological distance cutoff (i.e., the distance between the top two primary-election candidates required to identify relative moderates and extremists). Estimates are based on a cubic specification of the running variable fit on all data. Vertical lines represent 95% confidence intervals. The bottom panel reports the sample size for each regression. As the contrast between relative moderate and extremist candidates is increased, the effect of nominating the extremist candidate on general-election contributions grows.

I find that the effect of nominating an extremist on general-election receipts grows substantially as the contrast between moderate and extremist candidates increases. These estimates increase from 2 percentage points at the 5th percentile of the cutoff distribution to 18 percentage points at the 95th percentile of the cutoff distribution.
To more formally explore this variation, I rescale the ideological Distance variable to run from 0 to 1, and interact it with Extremist Primary Win. Hence, the interaction term reports the estimated change in the causal effect of nominating the relative extremist between the smallest and largest between-candidate ideological contrasts. The results are reported in Table 3.Footnote 29 Summing the first and second rows, I find that the financial penalty to extremists is approximately 18–19 percentage points in races where the contrast between candidates is largest.
Effect of Nominating the Extremist Primary-Election Candidate Across Treatment Intensities in Congress, 1980–2022, and State Legislatures, 1996–2022

Note: The close primary nomination of the extremist candidate causes an 18–19 percentage point decline in their party’s share of general-election contributions in contests with the largest ideological contrast between primary-election candidates. Robust standard errors clustered by district are reported in parentheses. The running variable is the extremist candidate’s win margin in the primary election. Spline indicates that the regression function was fit separately on either side of zero. Cubic refers to a third-order polynomial regression. Lower-order Distance term is omitted from the table for brevity.
WHICH DONORS PUNISH EXTREMIST PRIMARY NOMINEES?
The results presented thus far indicate that general-election donors, in aggregate, punish extremist primary nominees. While these aggregate-level estimates are most consequential for election outcomes, they may obscure heterogeneity that is essential for interpreting the overall penalty and its underlying sources. For example, the “Theoretical and Empirical Perspectives on Donor Support for More Moderate and Extreme Candidates” section describes how canonical theories of donors’ motivations yield ambiguous predictions about whether individual contributors and corporate PACs favor relative moderates or extremists. This section evaluates these competing mechanisms. It also examines whether the financial penalty to extremist nominees is driven by donors withdrawing support from the extremist’s party, rallying around their opponent, or a combination of the two.
Individuals and Corporate PACs Punish Extremist Nominees
As discussed in the “Empirical Strategy” section, existing research disagrees on whether individual donors and corporate PACs favor relative moderate or extremist candidates. Individual donors, like general-election voters, may prefer relative moderates—or, if the donorate is heavily skewed toward ideologues, their contributions may instead favor extremists. Corporate PACs, likewise, may disproportionately value access to extremists, or they may prefer relative moderates who are more electorally viable. Ultimately, whether these sources of campaign finance advantage relative moderates or extremists is an empirical matter to which I now turn.
To answer this question, I disaggregate each party’s fundraising total into its various sources using donor-level industry classifications from the Center for Responsive Politics (CRP) and NIMSP.Footnote 30 For each donor type, I construct a new outcome variable containing the party’s share of general election-contributions originating from that source. These variables measure the extent to which a given contribution source advantages a party.
Using these source-specific contribution shares as the outcome, Figure 4 plots the discontinuity in the data separately for general-election contributions from individual donors (Panel a) and corporate PACs (Panel b). As a reminder, when the horizontal axis is greater than zero, the extremist candidate wins the primary nomination and represents their party in the general election. When the horizontal axis is instead less than zero, the moderate candidate wins the primary nomination and runs in the general election. In both plots, there appears to be a sharp decrease in contribution shares at the discontinuity, with a noticeably larger jump for corporate PACs than individual donors.
Effect of Nominating the Extremist Primary-Election Candidate on Their Party’s General-Election Contribution Share from Individual Donors and Corporate PACs in Congress, 1980–2022, and State Legislatures, 1996–2022
Note: The close primary nomination of the extremist candidate causes a significant decrease in their party’s share of general-election contributions from both individual donors and corporate PACs. Black dots represent averages within equal-sample-sized bins of the running variable. Red lines plot fitted values from OLS regressions estimated separately on either side of the discontinuity using the underlying data.

Figure 5 presents formal estimates of these discontinuities using a third-order polynomial specification of the running variable with a spline.Footnote 31 Horizontal lines in the plot represent 95% confidence intervals. For reference, the first estimate, labeled “Total Contributions,” corresponds to the estimate from column 2 of Table 1.
Effect of Nominating the Extremist Primary-Election Candidate on Their Party’s General-Election Contribution Share by Donor Type in Congress, 1980–2022, and State Legislatures, 1996–2022
Note: Corporate PACs impose a larger financial penalty on the extremist primary nominee in the general election than individual donors. This figure reports estimates using a cubic specification of the running variable.

The second estimate in Figure 5 focuses on contributions from individual donors. I find that, when a party narrowly nominates a relative extremist, its share of general-election contributions from individuals donors declines by 5 percentage points. The final estimate in Figure 5 aggregates contributions from corporate PACs. Here, I estimate that the financial penalty imposed by corporate PACs on extremist nominees is approximately 13 percentage points. The difference in penalties imposed by individual donors and corporate PACs is highly significant (
 $ t=5.43, $
 $ p<0.001; $
SEs clustered by district).
$ p<0.001; $
SEs clustered by district).
Overall, I find strong evidence that both individual donors and corporate PACs punish extremist nominees, but that this penalty rate is larger among corporate PACs than individual donors.Footnote 32 Broadly, these results suggest that individual donors’ ideological preferences in general elections are more closely aligned with those of general-election voters than previously assumed. They also indicate that corporate interests favor the combination of expected tenure, electoral viability, and access that more moderate candidates offer relative to more extreme candidates.
I also investigate heterogeneity in the financial penalty to extremists across corporate industries. Since the results do not change the substantive interpretation of this section, I refer interested readers to Appendix D of the Supplementary Material for complete results. In short, I find that the financial penalty to extremist nominees is remarkably stable across all ten corporate industries defined by the FEC and NIMSP.
Symmetric Effects among Extremist-Party and Opposing-Party Donors
Because fundraising relative to an opponent is likely more consequential than absolute dollar totals, the analysis so far has focused on candidates’ general-election contribution shares. However, studying contribution shares obscures whether the financial penalty to extremists is driven by donors abandoning the extremist party’s nominee, rallying around their opponent, or some combination of the two. To differentiate these pathways, I examine the financial penalty to extremist nominees in aggregate dollars.
Specifically, I reestimate Equation 1 with parties’ logged contribution totals as the outcome. Figure 6 presents estimates from this analysis using a third-order polynomial of the running variable. In the first row, I estimate that the “coin-flip” primary nomination of an extremist reduces their party’s general-election fundraising total by roughly $42,000 relative to a barely-winning moderate’s party. This estimate is consistent with a substantial penalty among extremist-party donors. The second row of Figure 6 focuses on contributions to the opposing party. Here, I find that close primary nomination of an extremist increases the opposing party’s general-election fundraising by $46,000. While the latter effect is estimated imprecisely, the difference between the estimates for extremist- and opposing-party donors is highly significant (
 $ t=5.39 $
,
$ t=5.39 $
,
 $ p<0.001 $
; SEs clustered by district).
$ p<0.001 $
; SEs clustered by district).
Effect of Nominating the Extremist Primary-Election Candidate on Their Party’s General-Election Contribution Totals in Congress, 1980–2022, and State Legislatures, 1996–2022
Note: The financial penalty to extremist primary nominees is driven symmetrically by donors abandoning the extremist party and rallying around their opponent. This figure reports estimates using a cubic specification of the running variable.

Taken together, these results indicate that the financial penalty to extremist nominees is driven in roughly equal proportion by withdrawal among extremist-party donors and increased mobilization among their opponents’ donors.
RD ESTIMATES GENERALIZE TO UNIVERSE OF CONTESTED GENERAL ELECTIONS
In the previous two sections, I leveraged the “as-if” random variation in primary-election outcomes to evaluate whether general-election donors punish extremist primary nominees. While observers may be most interested in districts featuring close primary elections because these contests are precisely the settings where the estimated effects are likely to be most meaningful, the results are inherently “local” to a small subset of elections. To evaluate whether these effects generalize to a broader array of electoral contexts, I replicate my main analyses using an observational panel-based identification strategy intended to hold district attributes constant. In addition to identifying a more general estimand than the RD, the panel method is more powerful and allows me to evaluate variation in the effects over time.
The Midpoint Method
Specifically, I replicate my main analyses using the “midpoint” method from Ansolabehere, Snyder, and Stewart (Reference Ansolabehere, Snyder and Stewart2001).Footnote 33 This method uses either district fixed effects or district presidential vote share to control for partisanship, and compares changes in the midpoint between Democratic and Republican general-election candidates. In the spatial model, when the midpoint between candidates moves to the right while the distance between the candidates remains the same, the Democratic candidate becomes unambiguously more moderate while the Republican becomes more extreme.
For district d in election t, I implement the midpoint method by estimating OLS regressions of the form:
 $$ \begin{array}{rl}{Y}_{dt}={\beta}_0+{\beta}_1Midpoin{t}_{dt}+{\beta}_2Distanc{e}_{dt}+{\delta}_t+{\gamma}_i+{\varepsilon}_{dt},& \end{array} $$
where
 $ Midpoin{t}_{dt}=\frac{Dem\hskip0.35em Ideolog{y}_{dt}\hskip0.35em +\hskip0.35em Rep\hskip0.35em Ideolog{y}_{dt}}{2} $
is the midpoint between the Democratic and Republican candidate’s Primary-Specific Scaling,
$ Midpoin{t}_{dt}=\frac{Dem\hskip0.35em Ideolog{y}_{dt}\hskip0.35em +\hskip0.35em Rep\hskip0.35em Ideolog{y}_{dt}}{2} $
is the midpoint between the Democratic and Republican candidate’s Primary-Specific Scaling,
 $ Distance=|Dem\hskip0.35em Ideolog{y}_{dt}-Rep\hskip0.35em Ideolog{y}_{dt}| $
is the distance between the two parties’ candidates, and
$ Distance=|Dem\hskip0.35em Ideolog{y}_{dt}-Rep\hskip0.35em Ideolog{y}_{dt}| $
is the distance between the two parties’ candidates, and
 $ {Y}_{dt} $
is one of the outcomes introduced in the previous sections. The term
$ {Y}_{dt} $
is one of the outcomes introduced in the previous sections. The term
 $ {\delta}_t $
stands in for year fixed effects, and
$ {\delta}_t $
stands in for year fixed effects, and
 $ {\gamma}_i $
represents either district-regime fixed effects or district presidential vote share.
$ {\gamma}_i $
represents either district-regime fixed effects or district presidential vote share.
The magnitude of the coefficient on Midpoint, however, is not immediately comparable to the RD estimates reported above.Footnote 34 To make these estimates comparable, I apply a simple linear transformation to the Midpoint coefficient. First, I estimate the average change in candidates’ Primary-Specific Scaling at the discontinuity and divide this quantity by two; this is the average change in the midpoint between candidates at the discontinuity.Footnote 35 I then multiply the Midpoint coefficient by this average change, yielding an estimate that is comparable to my RD estimates. Throughout the article, I present estimates from the midpoint method in terms of the RD scale.
RD and Midpoint Method Yield Consistent Results
Figure 7 compares my RD and midpoint method estimates. In this figure, estimates from the midpoint method are plotted with triangles and dashed 95% confidence interval bars, while the baseline RD estimates are reported with squares and solid error bars. I report estimates separately for total contributions (first pair) and contributions from individual donors and corporate PACs (second and third pairs, respectively). As the figure illustrates, the midpoint and RD estimates are highly consistent in magnitude, differing by 1 percentage point at most. However, because the midpoint regression incorporates all contested general elections, estimates from the midpoint method are substantially more precise than the RD.
Comparison of RD and Midpoint Estimates of the Effect of Extremist Candidates on Their Party’s Share of General-Election Fundraising in Congress, 1980–2022, and State Legislatures, 1996–2022
Note: This figure compares RD and midpoint estimates of the financial penalty imposed on extremist candidates after transforming the midpoint estimates to the same scale as the RD. Both methods yield highly similar point estimates.

Overall, the consistency between the RD and midpoint estimates indicates that my central results generalize beyond the set of districts featuring close contested primary elections. I now rely on this added statistical power to study over-time variation in the financial penalty to extremists.
Extremist Nominees Face a Shrinking Financial Penalty
The political and informational environment in which donors contribute has changed markedly over the past two decades. These shifts raise the possibility that donors’ responses to extremist nominees have evolved during the same period. Given sample size restrictions, it is challenging to comprehensively evaluate whether the financial penalty to extremists has changed over time using the RD. The midpoint regression, however, which leverages data across all contested general elections, provides the statistical power necessary to answer this question with confidence.Footnote 36
Using district presidential vote share to hold partisanship constant, I reestimate Equation 4 separately for every even-year election cycle in my sample since 2000. Again, to make these estimates comparable to the RD, I apply the same linear transformation to these coefficients as described in the previous section. Figure 8 plots the results, along with 95% confidence intervals, for total contributions, individual donors, and corporate PACs.
Financial Penalty to Extremist Nominees Over Time in Congress and State Legislatures, 2000–22
Note: The financial penalty to extremist nominees has declined by half since 2000. Points represent estimates of
 $ {\beta}_1 $
from Equation 4, after applying a linear transformation that aligns the scale of the Midpoint and RD estimates. Models are estimated using presidential vote share to hold the district median constant. Bars represent 95% confidence intervals. Green circles represent total contributions, red diamonds represent corporate PAC contributions, and blue triangles represent individual contributions.
$ {\beta}_1 $
from Equation 4, after applying a linear transformation that aligns the scale of the Midpoint and RD estimates. Models are estimated using presidential vote share to hold the district median constant. Bars represent 95% confidence intervals. Green circles represent total contributions, red diamonds represent corporate PAC contributions, and blue triangles represent individual contributions.

In addition to confirming that corporate PACs are more sensitive to extremist nominees than individual donors, I find that the financial penalty to extremists has declined steadily since 2000. For example, in 2000, I estimate that an extremist nominee could expect their share of total general-election contributions to be 7 percentage points less than a moderate candidate. However, by 2022, this penalty had declined to 3.5 percentage points. Overall, the decline in the financial penalty to extremists appears to be driven roughly equally by individual donors and corporate PACs, raising important questions about the source of this decline.
STATE-LEVEL HETEROGENEITY IN THE FINANCIAL PENALTY TO EXTREMIST NOMINEES
What factors help explain the decline in the financial penalty to extremist nominees? And where is the financial penalty to extremists particularly strong? While a comprehensive mediation analysis is beyond the scope of this article, in this section, I evaluate several of the most plausible and substantively important possibilities, guided in part by the theoretical perspectives introduced in the “Empirical Strategy” section. By investigating these patterns, we can also learn more about the underlying roots of the financial penalty to extremist nominees. To facilitate this analysis, I focus in this section on state legislatures, where rich heterogeneity within and between states offers valuable leverage to study variation in the financial penalty to extremist nominees.
Moderate Candidates’ Declining Electoral Success
One of the most striking results from the previous section is the sharp decline in the financial penalty imposed on extremist primary nominees by corporate PACs. This trend among individual donors is consistent with a broader increase in partisanship across the American public, as shown in Appendix J of the Supplementary Material, but corporate PACs are thought to prioritize strategic considerations over ideological alignment. Why have access-oriented corporate donors become increasingly likely to support relative extremists?
To evaluate a potential source of this decline, I return to the theoretical models of access-seeking contributions outlined in the “Empirical Strategy” section. These models suggest that access-seeking donors value three considerations when allocating funds: a candidate’s probability of winning, the expected value of access through that candidate, and the candidate’s anticipated tenure in office. Figure 9 examines how these three factors have evolved over time for more moderate and more extreme nominees.
Over-Time Change in Factors that Motivate Corporate PAC Contributions in State Legislatures, 2000–22
Note: This figure plots the expected tenure of, value of access to, and win-probability advantage of more moderate versus more extreme candidates in state legislatures, 2000–22. Panel (a) plots the average years of prior legislative experience for more moderate and more extreme candidates. Panel (b) reports the within-legislator difference-in-differences estimate of the revealed value of attaining leadership status in terms of corporate PAC contributions, as first studied by Fouirnaies (Reference Fouirnaies2018). Panel (c) plots the win-probability penalty to more extreme general-election candidates, as measured using the midpoint method and transformed to the RD scale.

First, in Panel a of Figure 9, I plot legislators’ expected tenure in office, as proxied by their average years of prior experience.Footnote 37, Footnote 38 For simplicity, I classify legislators in a binary fashion as more moderate or more extreme based on their roll-call voting record and the median member of their party. The black solid line in Panel a of Figure 9 plots the expected prior tenure for more moderate legislators, while the dashed gray line reports the same quantity for more extreme legislators. While more moderate legislators are, on average, slightly more experienced than more extreme legislators, this difference has remained remarkably constant across the period of study. Hence, differential changes in relative moderate versus extremist candidates’ expected tenure do not appear to explain corporate PACs’ increasing willingness to fund extremist nominees.
Using the same legislator classifications from Panel a of Figure 9, Panel b of Figure 9 studies the revealed value of access to more moderate and more extreme legislators. To do so, I focus on state legislative chamber leaders, whose positions make them particularly valuable targets for access-seeking contributors, and implement a difference-in-differences design that compares contributions from corporate PACs to more moderate and extreme legislators before and after attaining a leadership position.Footnote 39 This design was first studied by Fouirnaies (Reference Fouirnaies2018). Panel b of Figure 9 plots my estimates of the effect of becoming a leader on a legislator’s share of total chamber-level contributions from corporate PACs.Footnote 40 Clearly, the value of access to legislative leaders has increased over time, matching Fouirnaies (Reference Fouirnaies2018). However, this increase is highly similar for more moderate and more extreme leaders, suggesting that changes in the value of access to relative moderates and extremists do not explain corporate PACs’ increasing willingness to fund extremist primary nominees.
Finally, I study the probability that more extreme candidates are elected. To do so, I reestimate the midpoint regression from Equation 4 after substituting in an indicator for the Democratic candidate’s victory as the outcome.Footnote 41 As before, I transform the estimates to the RD scale so that larger values represent a greater advantage for more extreme candidates. The estimates are plotted in Panel c of Figure 9. As the figure depicts, I estimate that the win-probability penalty imposed on more extreme candidates by voters has declined by half since 2000. Hence, as more extreme candidates become increasingly likely to win office, it appears that access-seeking PACs have strategically shifted their contributions toward relative extremists.
An alternative explanation is that, rather than reallocating funds to increasingly competitive extremists, corporate PACs have become more partisan in their giving. Appendix J of the Supplementary Material shows that this possibility is highly unlikely. Specifically, Figure J.1 in the Supplementary Material plots the probability that corporate PACs and individual donors contribute to at least one Democrat and one Republican, conditional on making at least five contributions in an election cycle.Footnote 42 I find that the contribution-weighted probability that corporate PACs contribute to candidates from both parties has remained remarkably constant at roughly 94% during the period of study. The same probability for individual donors, however, has declined from 37% in 2000 to less than 5% in 2022. These results suggest that, while individual donors have become increasingly partisan over the past two decades, corporate donors have not.
To recapitulate, based on the theoretical perspectives introduced in the “Empirical Strategy” section, the results presented in this section suggest that the declining financial penalty to extremist nominees imposed by corporate PACs is not driven by differential changes in the expected tenure or relative value of access to more moderate versus more extreme legislators, nor have corporate PACs become more partisan in their giving. Instead, the results suggest that access-seeking contributors have responded to shifting electoral dynamics: as extremists have become increasingly viable general-election contenders, corporate PACs have adapted by reallocating funds to these candidates.
Donor Information, Election Timing, and Election Salience
Finally, to better understand the conditions under which donors punish extremist primary nominees, I examine how the size of the penalty varies across electoral contexts. In particular, I assess whether differences in the information environment, election timing, and election salience are associated with systematic variation in the financial penalty. Identifying these contextual sources of heterogeneity offers insight into the broader forces that shape the financial penalty to extremists and its recent decline.
To maximize statistical power, I use the midpoint regression (Equation 4) as the baseline specification in this section and transform the resulting estimates to the RD scale. With the exception of the estimates for election timing—where limited variation in off-cycle elections renders the RD too noisy to draw strong inferences—all subsequent results replicate using a heterogeneity-in-discontinuities framework that adapts Equation 1. Because these moderating variables are not randomly assigned—both in the midpoint method and RD approach—any causal interpretation in this section requires caution. For reference, column 1 of Table 4 estimates the baseline financial penalty to extremist nominees in state legislatures.Footnote 43
Variation in Financial Penalty to Extremist Nominees in State Legislatures, 1996–2022

Note: The financial penalty imposed on extremist nominees is greater in districts that receive stronger legislative press coverage, stronger in more-professionalized state legislatures, and (maybe) weaker in odd-year elections. New Congruence and Professionalization are scaled to run from 0 (lowest) to 1 (highest), and Midterm Year and Odd Year are indicator variables. This table reports estimates from the midpoint method that are transformed to the RD scale. Robust standard errors clustered by district are reported in parentheses. Lower-order terms are omitted from the table for brevity.
First, a key precondition for a financial penalty to extremists is that donors have information about candidates’ relative ideological positioning. In the absence of such information, donors may be unable to react to candidates’ ideological positioning. To test this prediction, I draw on a measure of congruence between state legislative districts and newspaper markets that I develop in prior work (Myers Reference Myers2025a). This measure provides quasi-exogenous variation in the amount of newspaper coverage that the public receives about their legislative election.Footnote 44 I scale this variable, News Coverage, to run from 0 (weakest news coverage) to 1 (strongest news coverage) in my sample. Column 2 of Table 4 interacts News Congruence with Midpoint. Here, I estimate that the financial penalty to extremists is 60% larger in magnitude in the most congruent districts in my sample in comparison to the least congruent districts. A more realistic one standard deviation increase in News Congruence (0.19) is associated with a 12% increase in the magnitude of the financial penalty to extremists. Broadly, these results suggest that the political information environment plays a meaningful role in the financial penalty to extremists. These findings also raise the possibility that the erosion of local press coverage (Hayes and Lawless Reference Hayes and Lawless2018; Martin and McCrain Reference Martin and McCrain2019; Napoli et al. Reference Napoli, Stonbely, McCollough and Renninger2017; Peterson Reference Peterson2021; Worden, Matsa, and Shearer Reference Worden, Matsa and Shearer2022) may help account for the reduced financial penalty to extremists, particularly among individual donors.
Next, in column 3, I interact Midpoint with Squire’s (Reference Squire2007; Reference Squire2017) measure of legislative professionalism, scaled to run from 0 (least professionalized) to 1 (most professionalized) in my sample. To the extent that professionalization makes legislative races more salient to donors, the financial penalty to extremists may be greater in more-professionalized states. Column 3 presents evidence in line with this prediction. I find that the penalty to extremist nominees is roughly 40% larger in magnitude in the most professionalized legislatures in comparison to the least professionalized legislatures. Since the standard deviation of legislative professionalism is 0.25, a one standard deviation increase in professionalism is associated with a 10% increase in the magnitude of the financial penalty. These results match Handan-Nader, Myers, and Hall (Reference Handan-Nader, Myers and Hall2025), which report suggestive evidence that the electoral return to moderation is greater in more-professionalized states.
Finally, in column 4, I test whether the financial penalty to extremists is smaller in midterm and odd-year elections. While election timing captures a bundle of potential treatments—including turnout and coattail effects—it nonetheless represents a substantively important contextual factor with clear electoral implications. I estimate in column 4 of Table 4 that the financial penalty to extremists is substantially smaller in odd-year elections but no different in midterm-year elections. However, as noted above, the corresponding estimates in the RD are highly imprecise.Footnote 45
Taken together, these results suggest that the financial penalty to extremist nominees is shaped by the broader electoral context in which candidates compete. Donors appear more responsive to ideological differences between candidates when information is readily available, elections are more salient, and (maybe) less when elections do not coincide with national contests.
DISCUSSION AND CONCLUSION
American legislatures are more polarized today than at any point in the past half century, and one prominent claim is that donors are partially responsible. By disproportionately contributing to more extreme candidates, observers contend, donors advantage extremists in elections and facilitate the extraordinary polarization of American politics. Yet obtaining systematic evidence on whether donors advantage relative moderate or extremist candidates is challenging, because candidates strategically select into running based on their fundraising prospects, and traditional measures of candidates’ ideological positions are endogenous to their fundraising outcomes. This article overcomes these empirical challenges by pairing an RD design in congressional and state legislative primary elections with an original candidate ideology scaling and panel-based models of electoral selection.
Leveraging the RD design, I document that the “coin-flip” primary nomination of an extremist candidate over a more moderate opponent decreases their party’s share of general-election contributions by 7 percentage points in the median primary. For the largest ideological contrasts, the financial penalty to extremist primary nominees grows to 18–19 percentage points. Critically, this financial penalty is not limited to districts featuring close primary elections. Studying a complementary panel-based identification strategy, I find that donors punish extremist nominees across the full set of contested congressional and state legislative general elections in my sample, on average.
Overall, these findings indicate that general-election donors act as a moderating filter in American politics in response to the nomination of extremist candidates. By penalizing extremist nominees, general-election donors may directly affect these candidates’ competitiveness and likelihood of winning office (Avis et al. Reference Avis, Ferraz, Finan and Varjão2022; Erikson and Palfrey Reference Erikson and Palfrey2000; Fouirnaies Reference Fouirnaies2021; Gerber Reference Gerber1998; Green and Krasno Reference Green and Krasno1988). In addition to directly influencing candidates’ fundraising totals, this financial penalty may also indirectly shape the composition of the pool of legislative office seekers and parties’ strategies; extremist candidates who anticipate fundraising challenges may opt to not run at all (Carnes Reference Carnes2018; Fowler and McClure Reference Fowler and McClure1990; Thomsen Reference Thomsen2025), while parties may allocate campaign resources toward more financially-viable moderates (La Raja and Schaffner Reference La Raja and Schaffner2015).
At the same time, this moderating filter has weakened substantially over the past two decades. In 2000, extremist nominees raised about 7 percentage points less in the general election than more moderate candidates; by 2022, that gap had narrowed to less than 3.5 percentage points. As the financial penalty to extremist nominees declines, candidates who were once deterred by limited donor support may now find more viable paths to office.
Taken together, this article reveals a previously under-recognized constraint on more extreme candidates: the preferences of general-election donors. While the penalty has fallen in recent decades, when voters nominate more extreme candidates, their party suffers financially in the general election.
SUPPLEMENTARY MATERIAL
To view supplementary material for this article, please visit https://doi.org/10.1017/S000305542510138X.
DATA AVAILABILITY STATEMENT
Research documentation and data that support the findings of this study are openly available at the American Political Science Review Dataverse: https://doi.org/10.7910/DVN/PCPPHI.
ACKNOWLEDGEMENTS
For comments and suggestions, the author thanks Avidit Acharya, Samuel Asher, Liam Bethlendy, Adam Bonica, David Broockman, Colin Case, Gary Cox, Alexander Fouirnaies, Anthony Fowler, Justin Grimmer, Jens Hainmueller, Andrew Hall, Cassandra Handan-Nader, Janet Malzahn, Mellissa Meisels, Daniel Moskowitz, Julia Payson, Abhinav Ramaswamy, Maria Silfa, Nicolas Studen, Daniel Thompson, and Chenoa Yorgason.
FUNDING STATEMENT
Some of the computing for this project was performed on the Sherlock cluster. The author would like to thank Stanford University and the Stanford Research Computing Center for providing computational resources and support that contributed to these research results. The author also acknowledges support for data collection from the Institute for Humane Studies under grant number IHS018998.
CONFLICT OF INTEREST
The author declares no ethical issues or conflicts of interest in this research.
ETHICAL STANDARDS
The author affirms this research did not involve human participants.


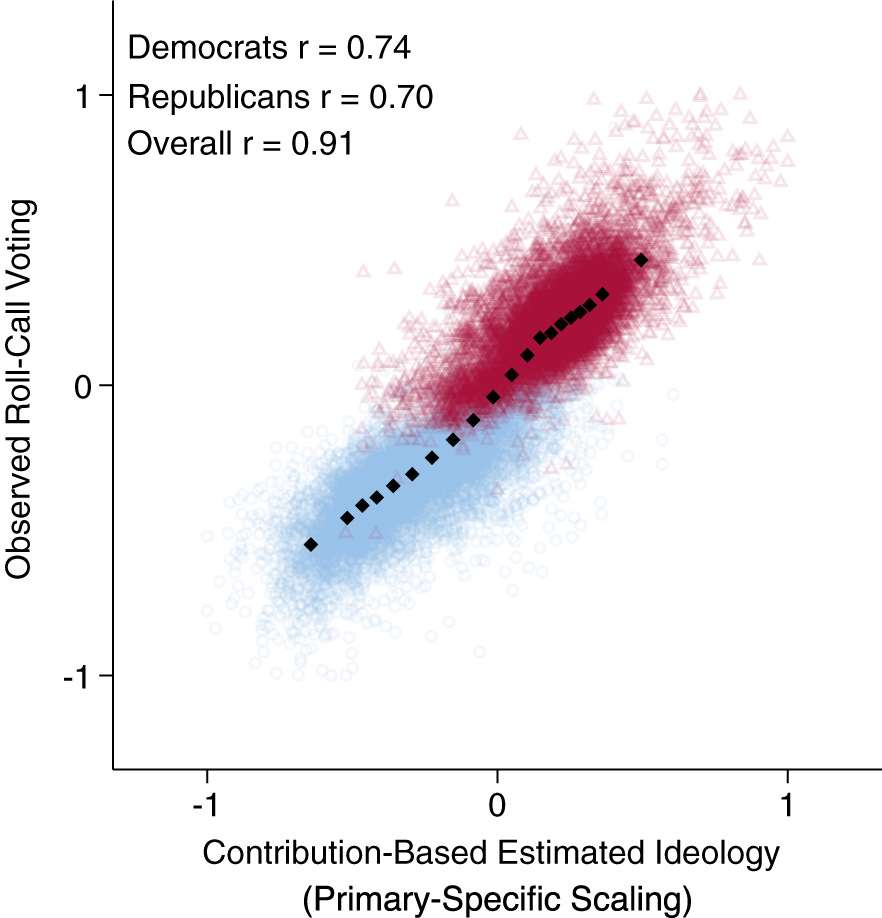
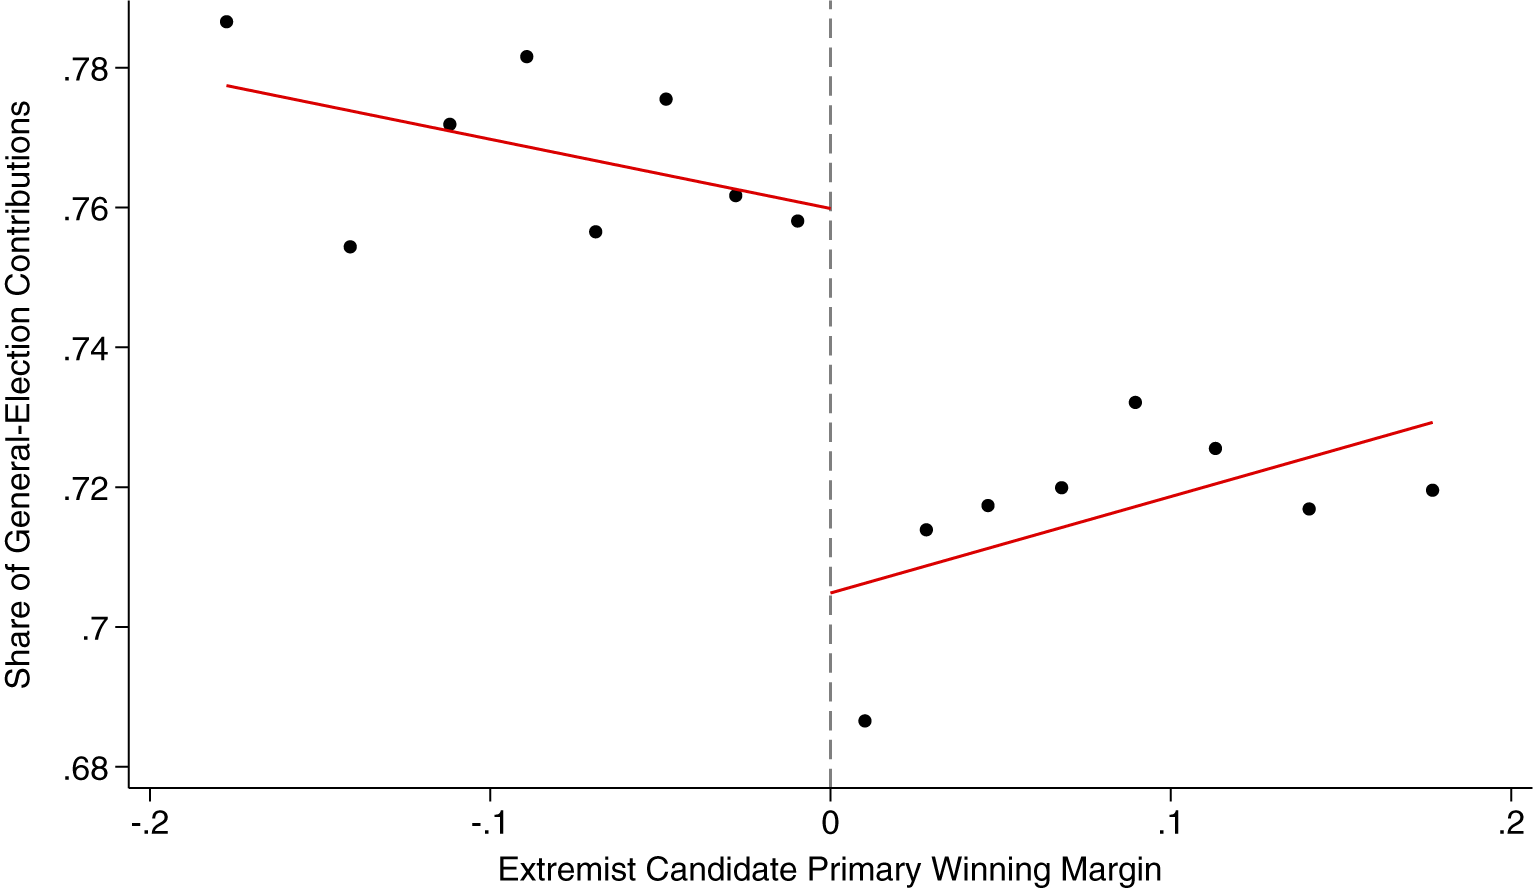
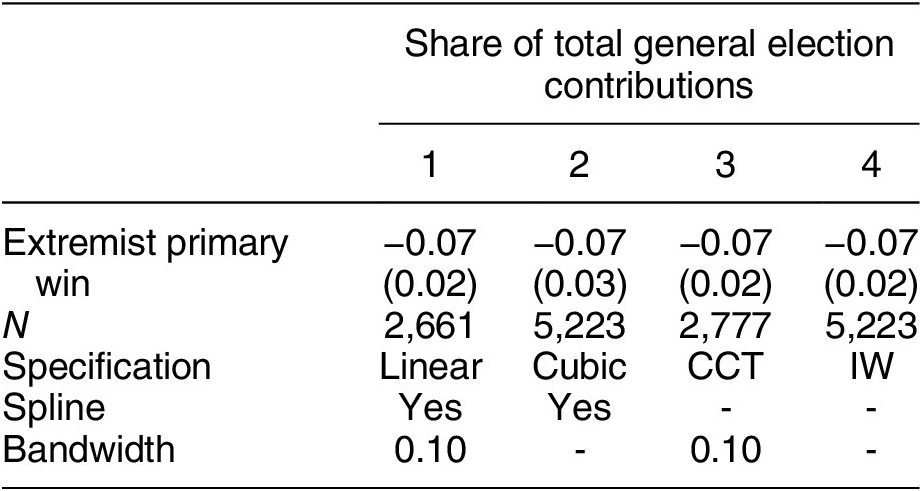
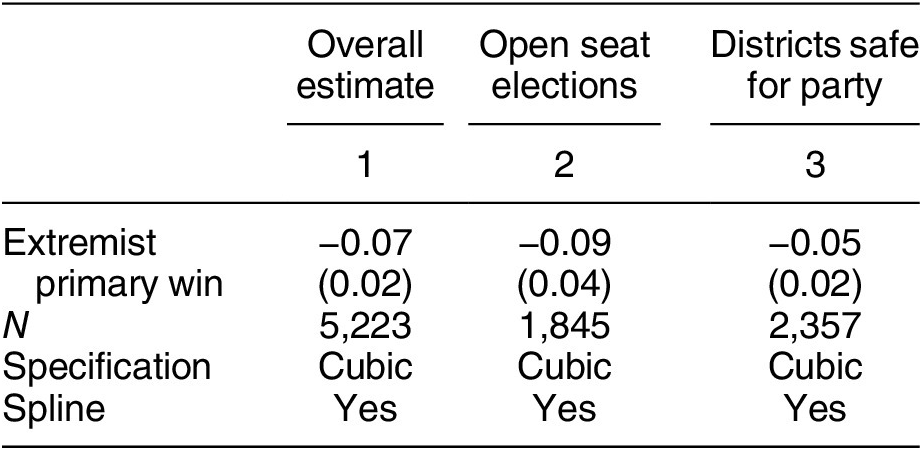
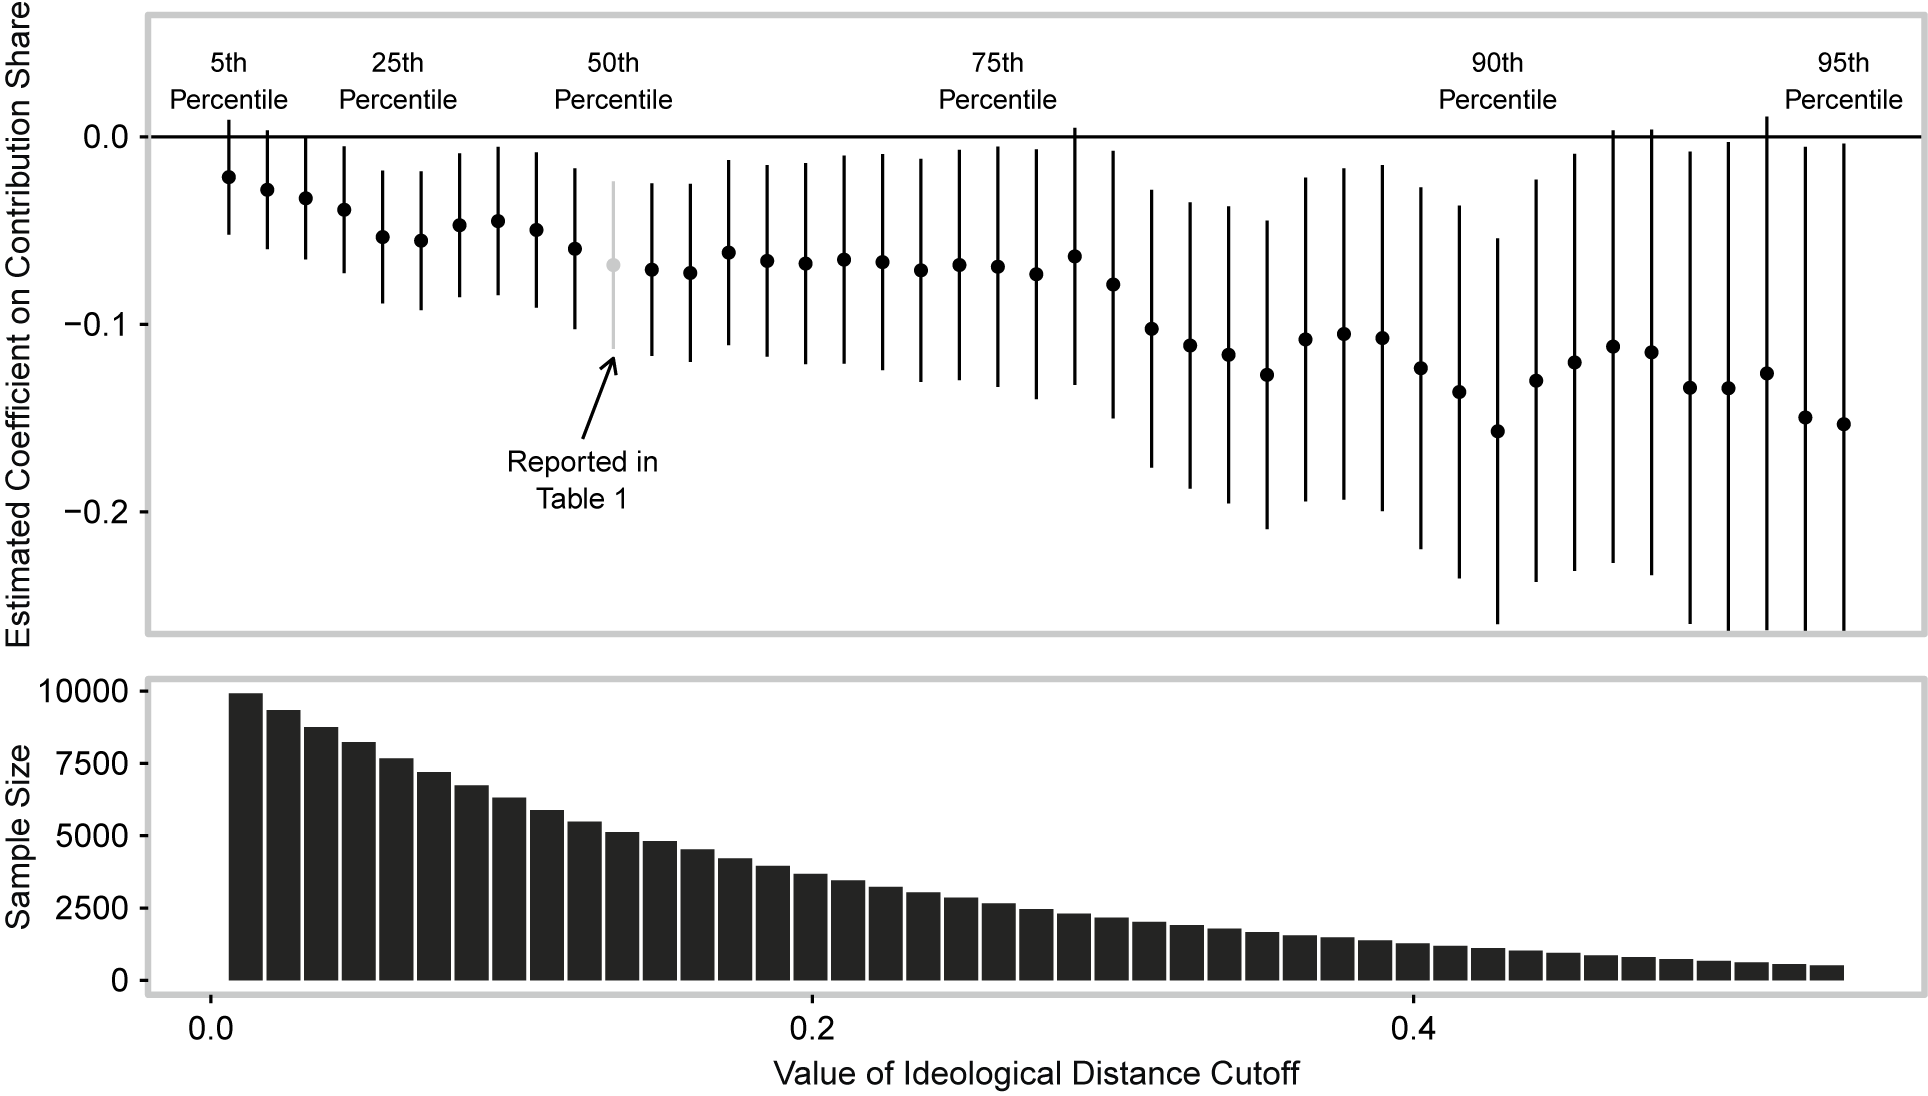
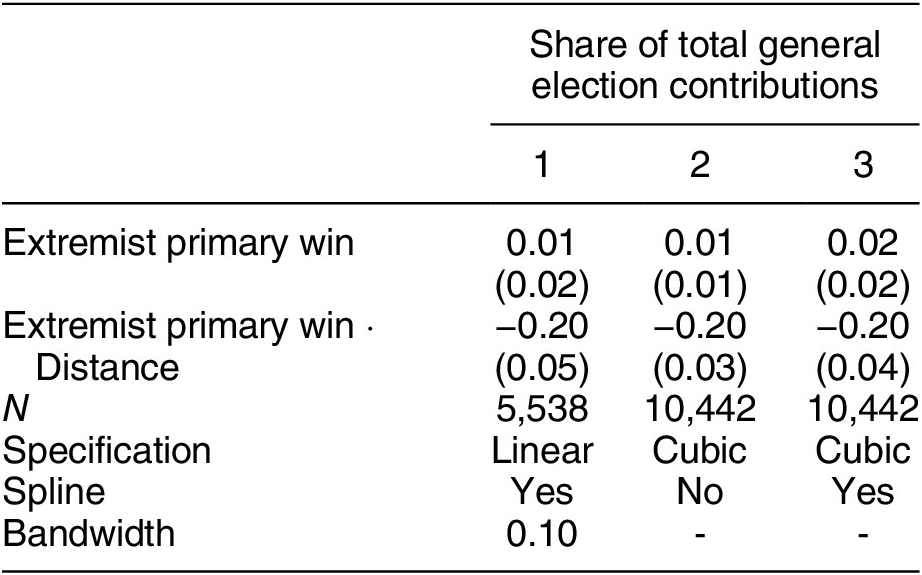
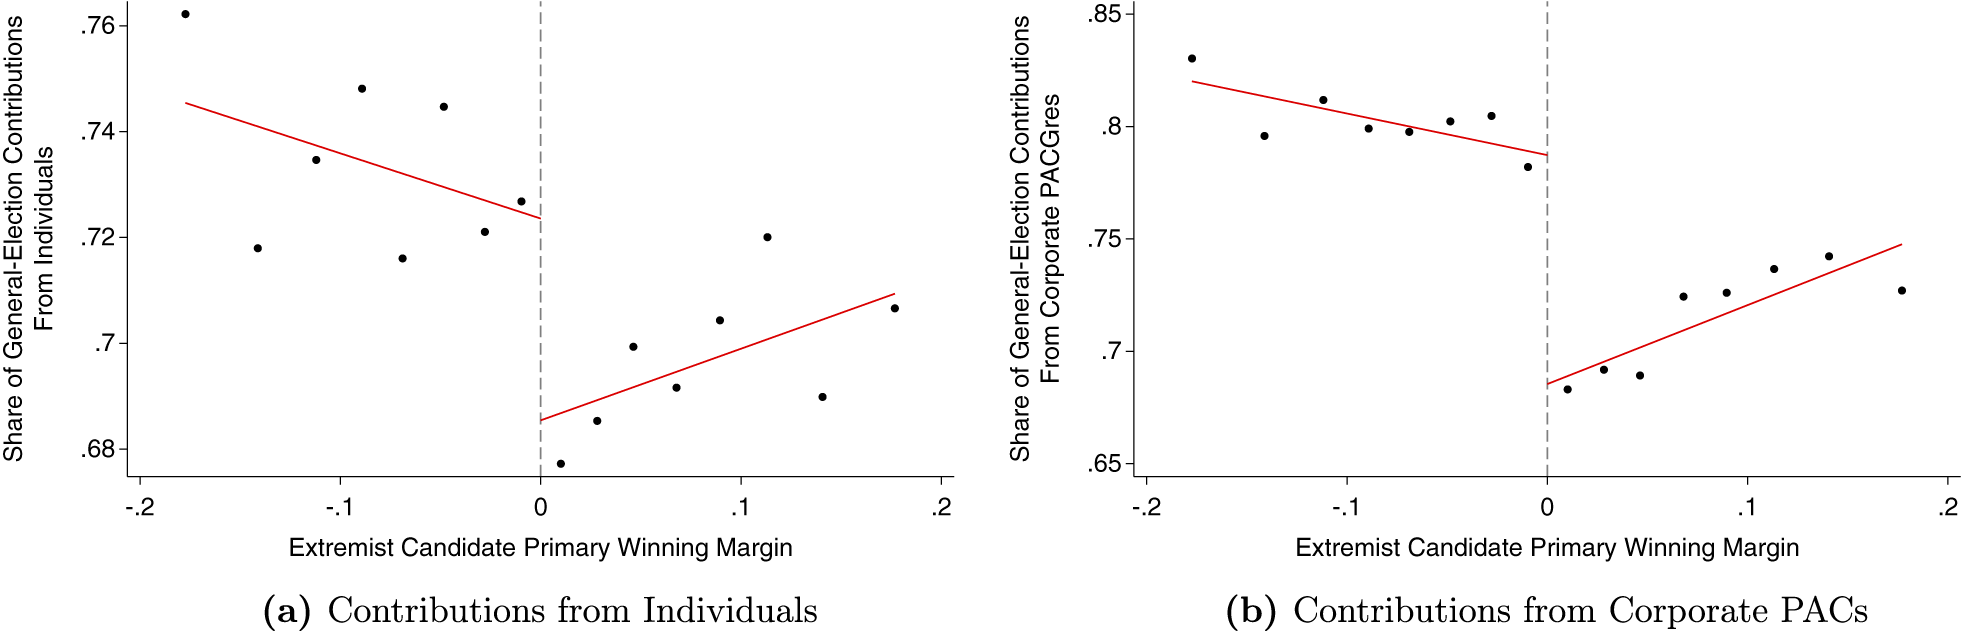
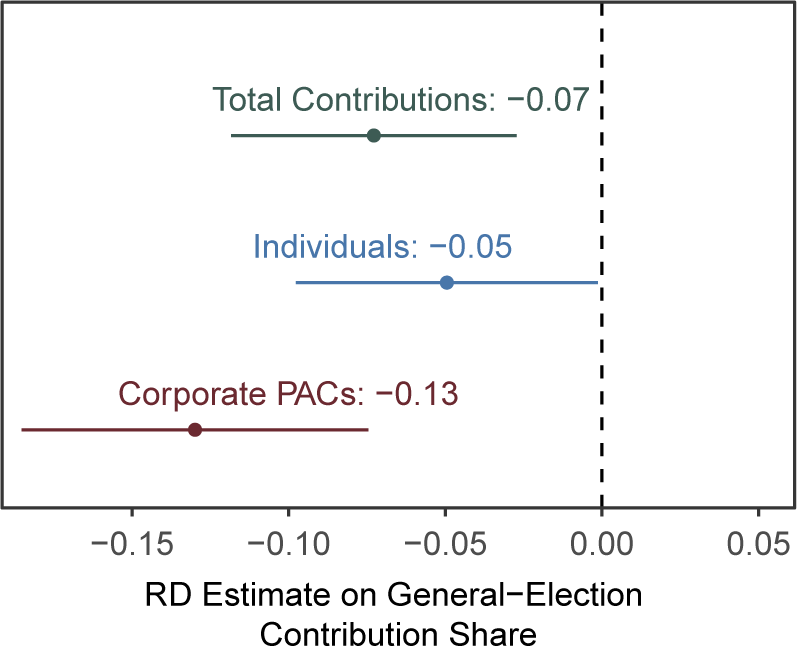
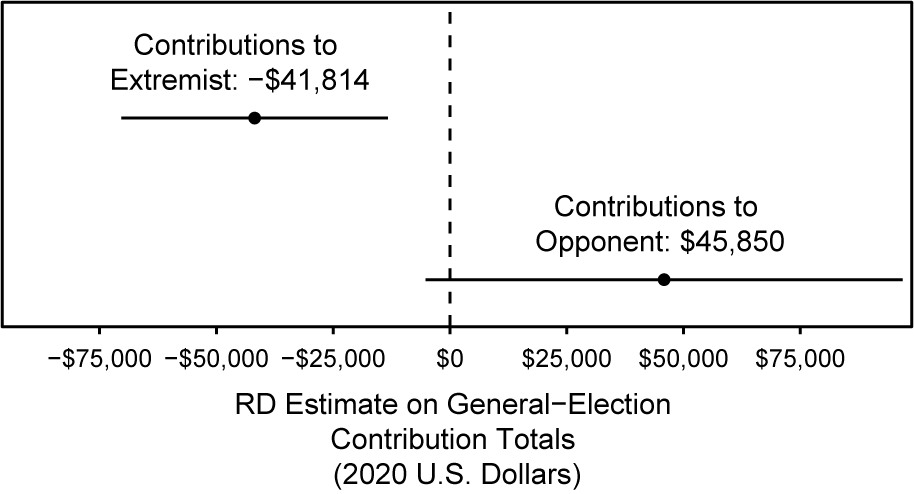
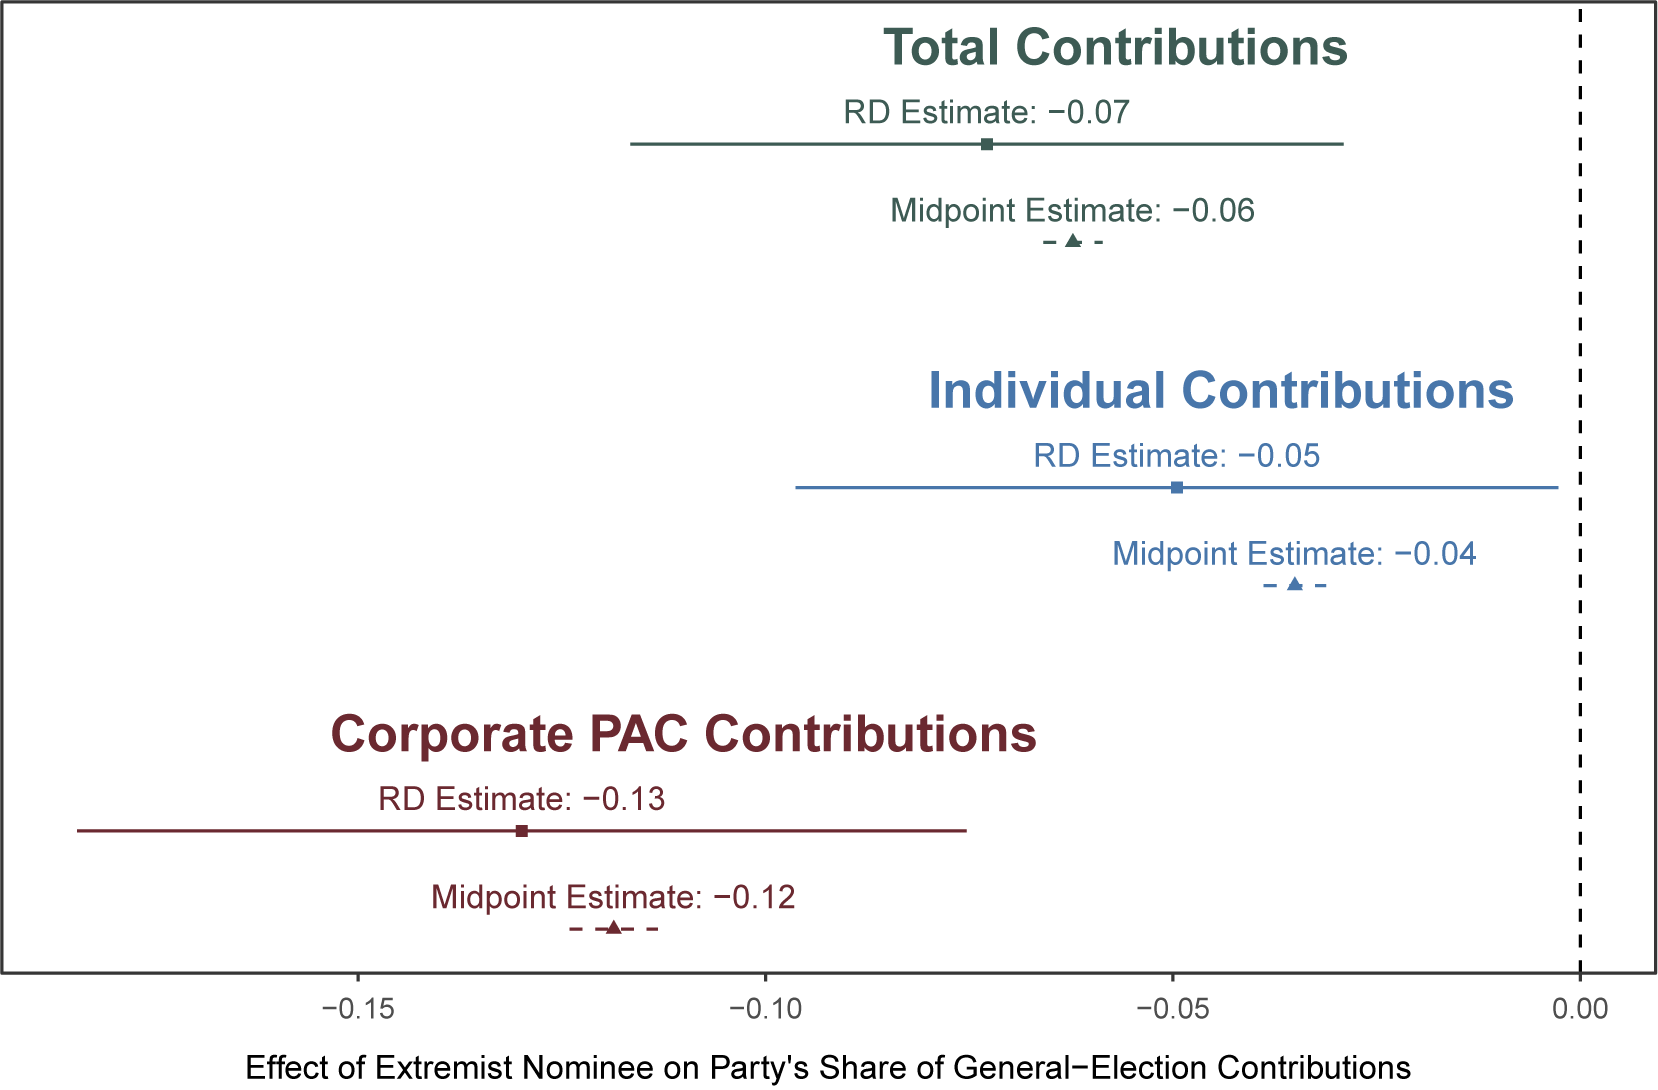
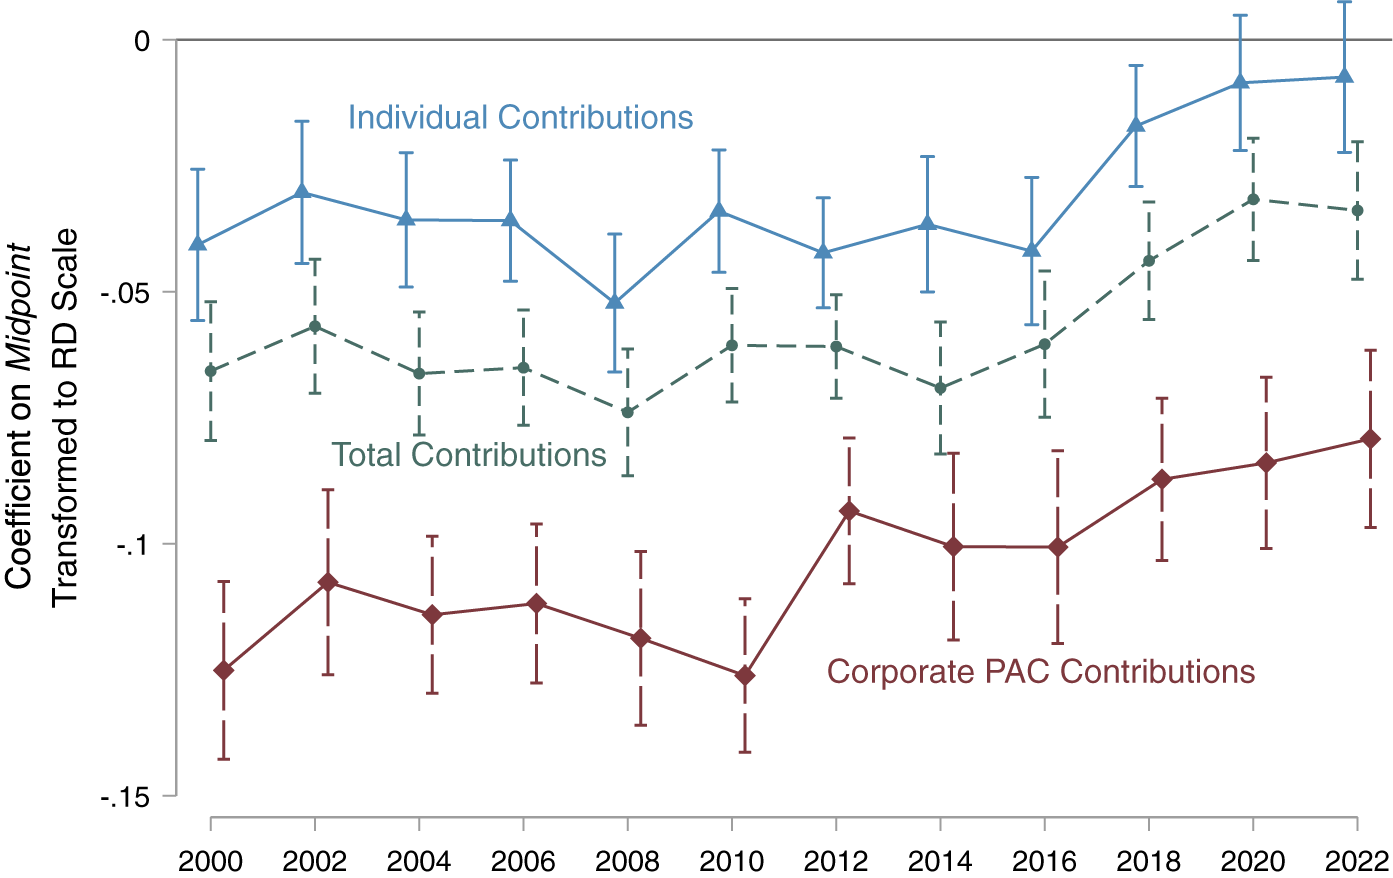

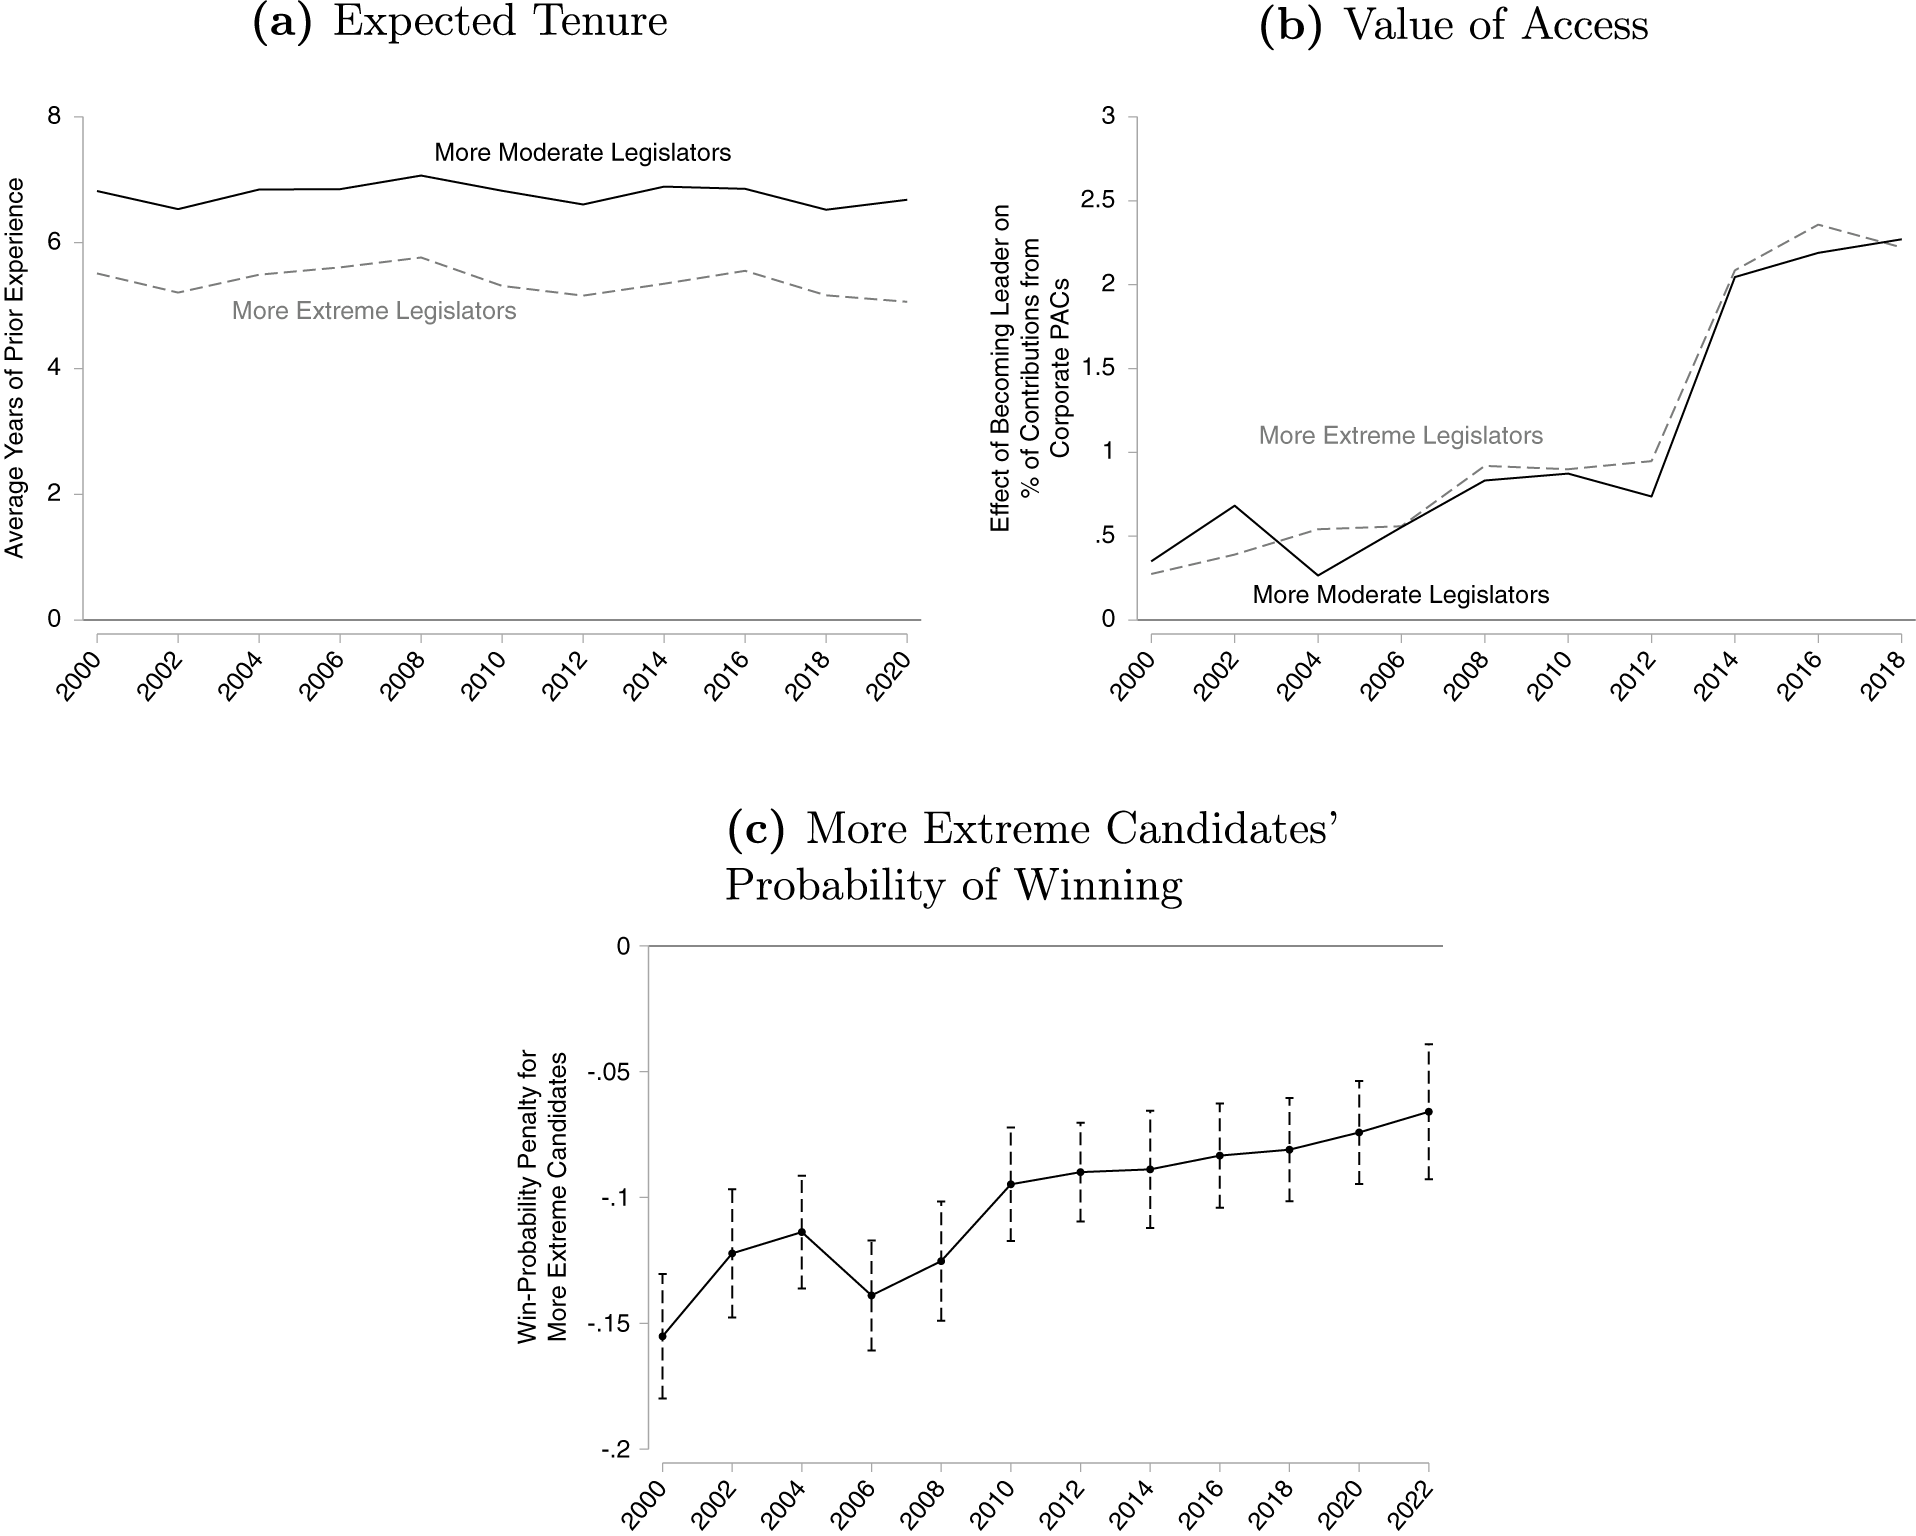
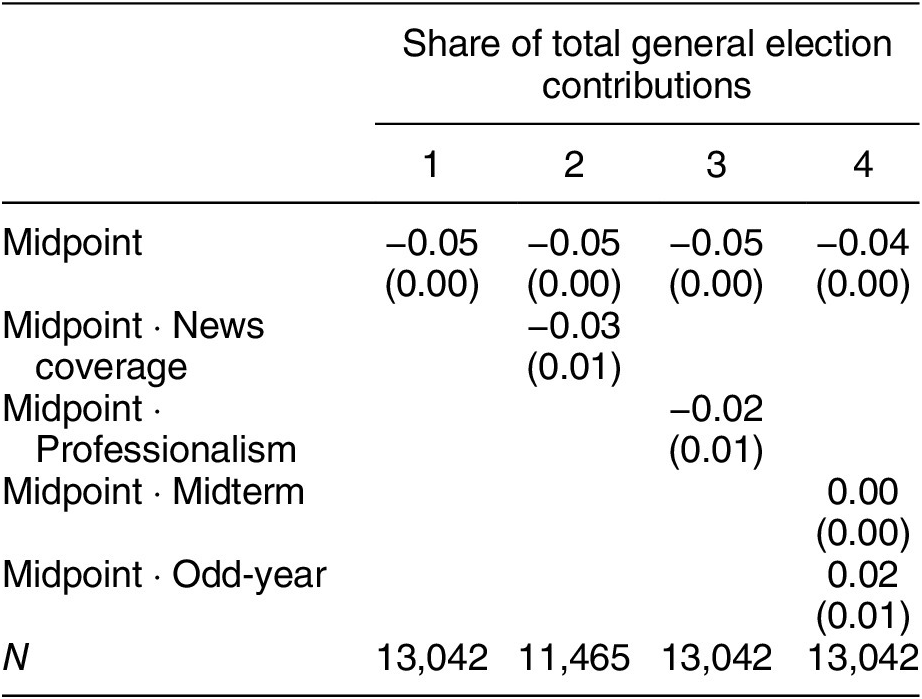


 Open access
Comments
No Comments have been published for this article.