


Non-alcoholic fatty liver disease (NAFLD), a chronic progressive liver disease, is the presence of fat in the liver not caused by alcohol consumption or chemicals. Nonalcoholic steatohepatitis (NASH) is a progressive form of NAFLD characterised by hepatic steatosis, portal and lobular inflammation and collagen deposition, and it may progress to irreversible cirrhosis and hepatocellular carcinoma(Reference Younossi, Tacke and Arrese1,Reference Sanches, Ramalho and Augusto2) . Nutrition and lifestyle, genetic determinants, metabolic disorders (e.g. lipid accumulation and insulin resistance), oxidative stress, inflammation and intestinal microbiota alterations have been implicated in the pathogenesis and progression of NAFLD(Reference Tilg and Moschen3).
To decrease the risk of chronic diseases, the dietary guidelines of many countries recommend a diet containing whole grain foods. Whole grain foods are beneficial in alleviating and preventing metabolic disorders and modulate proinflammatory responses and gut dysbiosis in NAFLD through multiple possible mechanisms(Reference George, Forsyth and Itsiopoulos4,Reference Portune, Benitez-Paez and Del Pulgar5) . Adlay (Coix lachrymal-jobi L. var. ma-yuen stapf) is a common dietary grain in Asia and is used as a traditional Chinese medicine for its antioxidative and anti-inflammatory properties(Reference Tsai, Yang and Li6). Previous studies demonstrated that adlay and its bran contains various kinds of bioactive compounds(Reference Chen, Chung and Chiang7,Reference Wang, Chen and Xie8) . Recent study also showed that adlay-derived coixol modulates lipopolysaccharide-induced inflammatory responses in RAW 264·7 cells through suppressing nuclear transcription factor-κB/mitogen-activated protein kinases pathway and decreasing NOD-like receptor protein 3 inflammasome expression(Reference Hu, Zhou and Liu9). Supplementation of fermented adlay significantly ameliorated dyslipidaemia and modulated the antioxidative status and gut microbiota of hamsters fed a high-cholesterol diet(Reference Wang, Lin and Wu10). In addition, rats with streptozotocin-induced diabetes fed dehulled adlay instead of corn starch decreased plasma glucose and lipid levels(Reference Yeh, Chiang and Chiang11). Adlay seed derived polysaccharides also improved blood lipid profiles and hyperglycaemia in streptozotocin-induced diabetic mice(Reference Chen, Fan and Wang12). In addition, a previous study also reported that consuming 60 g adlay per day showed beneficial effects in hyperlipidaemic male patients(Reference Yu, Chang and Liu13). However, no study has focused on the effects of partial replacement of dietary composition with dehulled adlay in rats with diet-induced NAFLD. Therefore, we investigated the effects of different amount of dietary dehulled adlay on metabolic disorders and hepatic inflammation in a NAFLD rat model and to explore the possible underlying mechanisms.
Materials and methods
Experimental design
Dehulled adlay (Taichung No. 3) powder was purchased from the Nantou County Tsao-Tun Production Association (Nantou County, Taiwan); it contains mainly carbohydrates (71·8 %), proteins (14·5 %), lipids (7 %) and dietary fibre (3·8 %). Forty male Wistar rats (weighing 200−250 g) were purchased from the National Laboratory Animal Breeding and Research Center (Taipei, Taiwan). Investigators followed the protocols described in the ‘Guide for the Care and Use of Laboratory Animals’, and all protocols were reviewed and approved by the Institutional Animal Care and Use Committee of I-Shou University (IACUC-ISU-100010). Animals were housed in individual cages in a room maintained at 23 ± 2°C with 55 % ± 5 % humidity and with a 12-h light–dark cycle. Rats were fed a standard rat chow diet (Rodent Laboratory Chow 5001, Purina Mills) for 1 week and then fed a control liquid diet for 1 week for adaptation. During the induction and experimental period, rats were pair-fed with different diets. For NAFLD induction, we fed rats as described previously study(Reference Lieber, Leo and Mak14), with some modifications using fructose instead of dextrin. Eight rats were fed a control liquid diet, and thirty-two rats were fed the NAFLD diet, which is a high-fat-high-fructose liquid diet (fat as 70 % of total energy) that is isoenergetic with the control diet to induce fatty liver and hepatic inflammation. After 16 weeks, the control rats and eight rats in the NAFLD group were sacrificed and their blood and liver were collected for analysis. The remaining twenty-four rats with NAFLD were further randomly divided three groups (n 8) fed different experimental diets for another 8 weeks (experimental period). The experimental diets were the NAFLD diet (NN group) and diet containing 44·9 or 89·8 g/l dehulled adlay powder (NA and NB groups) and to ensure the diets were isoenergetic and contained the same amount of macronutrients and dietary fibre, we adjusted casein, corn oil and fructose in the NA and NB diet as shown in Table 1. Food intake was recorded daily, and the animals were weighed each week. At the end of the experiment, all rats were killed, and blood, liver and adipose tissue samples were collected for analysis.
Diet composition (g/l)

NAFLD, non-alcoholic fatty liver disease.
Casein (high nitrogen), fructose, mineral mixture (AIN-93M mineral mixture), cellulose (non-nutritive bulk) and vitamin mixture (AIN-93M vitamin mixture) were obtained from MP Biomedicals (Santa Ana, CA, USA). Dextrin maltose was purchased from the Ingredion Incorporated (Westchester, IL, USA). Cholesterol, choline bitartrate, cholic acid and xanthan gum were obtained from Sigma. Pre-cooked dehulled adlay powder was purchased from the Nantou County Tsao-Tun Production Association (Nantou County, Taiwan).
Blood collection and analysis
In the last week of the experiment, blood glucose was determined using a commercial kit (Randox), and plasma insulin levels were determined using ELISA kit (Mercodia Rat Insulin ELISA). Homoeostasis model assessment of insulin resistance was as follows: fasting glucose (mmol/l) × fasting insulin (μU/ml)/22·5.
At the end of the study, the rats were starved for 12 h, and blood samples were collected from the abdominal vein into heparinised tubes. Plasma samples were collected after centrifugation (2000 g for 10 min at 4°C) and stored at –80°C to analyse total cholesterol, TAG, HDL-cholesterol, LDL-cholesterol, NEFA, aspartate aminotransferase and alanine aminotransferase concentrations. All analyses were conducted on a Hitachi 7170 Autoanalyzer (Hitachi) or using commercial kits (Randox). Plasma C-reactive protein and adipokine concentrations were determined using ELISA kits for the analysis of C-reactive protein, adiponectin (Assaypro) and leptin (BioVender).
Liver analysis
After perfusing the livers with saline, they were collected and stored at −80°C. Liver lipids were extracted using chloroform and methanol(Reference Folch, Lees and Sloane Stanley15). Total cholesterol, TAG and NEFA concentrations in the liver were determined using diagnostic kits (Randox Laboratories). To determine cytokine concentrations in the liver, samples were homogenised in buffer containing 50 mM Tris-base, 150 mM NaCl and 1 % Triton-X 100. After centrifugation, the supernatants were stored at −80°C. The liver tumor necrosis factor (TNF)-α, interleukin (IL)-1β, IL-6 and IL-10 levels were measured using an ELISA kit (rat TNF-α/TNFSF1A, IL-1β, IL-6 and IL-10, R&D Systems). To measure myeloperoxidase (MPO) activity, the liver was homogenised in buffer containing 0·5 % hexadecyl trimethyl ammonium bromide. The homogenate was analysed as described by Bradley et al.(Reference Bradley, Priebat and Christensen16).
For western blot analysis, liver samples were homogenised in a buffer containing 0·25 M sucrose, 10 mM Tri–HCl and 0·25 mM phenylmethylsulfonyl fluoride (pH 7·4). The homogenate was centrifuged at 10 000 g for 20 min at 4°C. The supernatant was transferred to a new tube and centrifuged at 105 000 g for 60 min at 4°C to separate the microsomes. The microsomal pellet was dissolved in 50 mM potassium phosphate buffer containing 1 mM EDTA and 1 mM DTT (pH 7·4) and used for CYP2E1 and CYP4A analysis. For PPARα, PPARγ and transforming growth factor-β analysis, we homogenised the liver in RIPA buffer containing 50 mM Tris–HCl, 150 mM NaCl, 0·1 % sodium dodecyl sulfate and 1 % NP-40 (pH 7·5) and then placed it in an ice bath for 30 min. After centrifugation, the supernatant was stored at –80°C. Western blotting was performed to evaluate the levels of CYP2E1, CYP4A, PPARα, PPARγ and transforming growth factor-β using appropriate antibodies, and then a horseradish peroxidase (HRP)-conjugated secondary antibody was used. Samples containing 50 μg of protein were separated on a 12·5 % sodium dodecyl sulfate-polyacrylamide gel and transferred onto a nitrocellulose membrane (Amersham Biosciences). Nonspecific binding sites were blocked through the overnight incubation of the membranes at 4°C in a 5 % nonfat milk solution. After being washed with PBS/Tween-20, membranes were incubated with a mouse CYP2E1 (mAb; 1:1000 dilution, Oxford PM32), a rabbit CYP4A (pAb; 1:1000 dilution, ABR PA3–033), a mouse PPARα (pAb; 1:500 dilution), a rabbit PPARγ (pAb; 1:500 dilution) or a rabbit transforming growth factor-β pAb (1:500 dilution) at room temperature for 2, 1 and 2 h, followed by incubation with an HRP-conjugated anti-mouse antibody (1:5000 dilution, Chemicon AP124P) or anti-rabbit antibody (1:5000 dilution, Little Chalfont) for CYP4A. Membranes were then washed, and the immune complex was developed using a chemiluminescence detection system (Western lighting Plus-ECL, PerkinElmer). Equal loading of the total protein was verified using a commercially available mAb against β-actin, and the results were expressed as the ratio of protein to β-actin.
For histological analysis, the dissected livers of the rats were fixed in formaldehyde. Samples were stained with hematoxylin and eosin. Biopsy samples were examined by a pathologist on a blinded basis. To evaluate the fatty change, the liver was observed at × 200 magnification. Degrees of hepatic fatty change were assessed and scored by a pathologist(Reference Kleiner, Brunt and Van Natta17).
Adipose tissue
Epididymal fat samples were homogenised in buffer containing 50 mM Tris-base, 150 mM NaCl and 1 % Triton-X 100. After centrifugation, the supernatants were collected for the analysis of leptin and adiponectin levels using the same method as previously described.
Fecal total lipid levels
Fecal samples of the experimental groups were collected at the end of the experimental period, dried for 48 h and stored at –80°C until analysis. Fecal lipids were extracted using chloroform and methanol. Total lipids were determined using commercial kits (Fortress Diagnostics).
Statistical analysis
Data are reported as mean ± standard error of the mean (sem). We followed the principles of 3Rs and calculated the number of rats for each group using G Power and regarding hepatic TG and TNF-α concentration as main parameters under a type I error of 5 % and statistical power reaching 80 %. Statistical analyses were performed using the SAS software (vers. 9.3; SAS Institute). Differences between the C and N groups at the end of NAFLD-induction were analysed by Student’s t test. Data at the end of the experimental period were analysed through a one-way analysis of variance and Fisher’s least significant difference test. Differences were considered significant at P < 0·05.
Results
Induction of non-alcoholic fatty liver disease
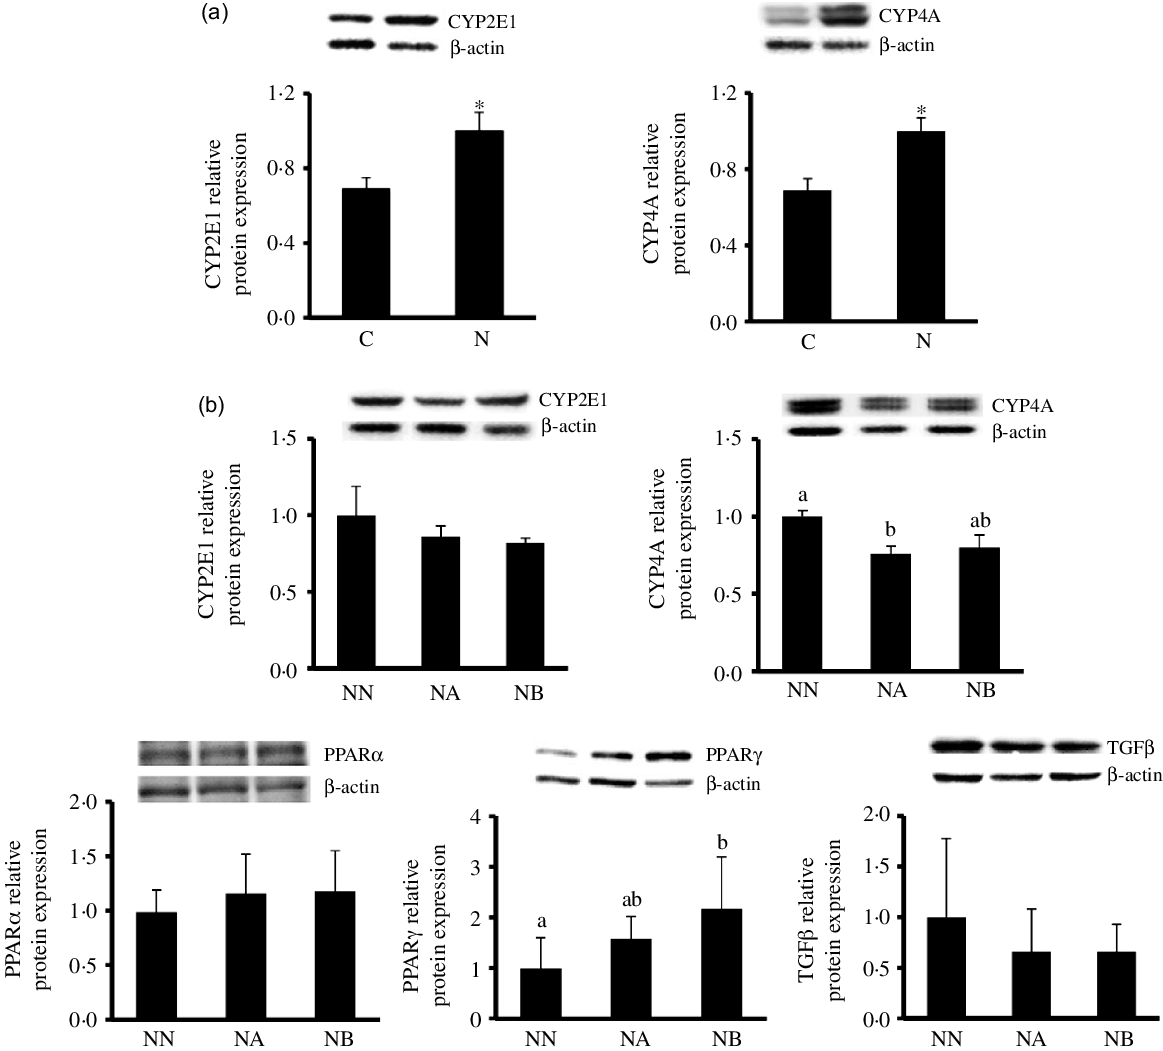
Body weight change, blood lipid profiles, glycaemic homoeostasis parameters and liver lipid and inflammatory parameters at the end of the induction period were shown in Table 2. Rats fed the NAFLD diet for 16 weeks exhibited significantly elevated of body weight and plasma aspartate aminotransferase, alanine aminotransferase and C-reactive protein levels compared with those pair-fed the isoenergetic control diet for the same duration. The N group exhibited higher hepatic lipid and inflammatory cytokine levels and MPO activities than did the C group (Table 2, Fig. 1). We also detected increases in CYP2E1 and CYP4A protein expression in the N group (Fig. 2(a)) after NAFLD induction.
Body weight change, blood and liver analysis of the C and N groups after non-alcoholic fatty liver disease (NAFLD) induction (Mean values and standard errors of the mean)
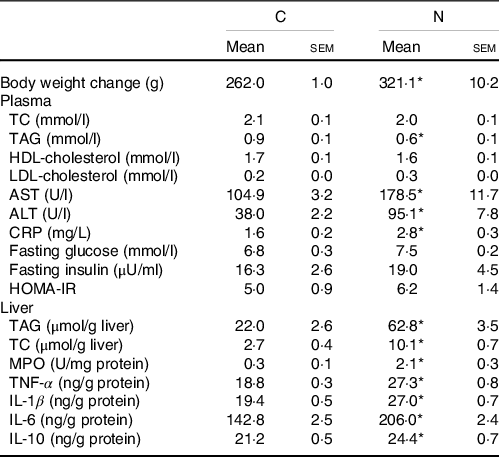
AST, aspartate aminotransferase; ALT alanine aminotransferase; CRP, C-reactive protein; HOMA-IR, homoeostasis model assessment-insulin resistance; TC, total cholesterol; MPO, myeloperoxidase.
Values are presented as the mean ± sem. C group, control diet (n 8); N group, NAFLD diet (n 8).
* Significantly different compared with the C group (P < 0·05).
Histopathology of hepatic fatty change (a) and score (b) after non-alcoholic fatty liver disease (NAFLD) induction for the C and N groups and at end of the experimental period for the NN, NA and NB groups. Representative images were taken at a magnification, ×200. Values are presented as mean values and standard errors of the mean. C group, control diet (n 8); N and NN groups, NAFLD diet (n 8); NA group: NA diet containing 44·9 g/l dehulled adlay powder (n 8); NB group, NB diet containing 89·8 g/l dehulled adlay powder (n 8). *P < 0·05 compared with the C group. Values with different superscript letters at the same time point differ significantly (P < 0·05). The scoring of fatty change was defined following previous study(16): 0, none (<5%); 1, mild (5–33%); 2, moderate (34–66%); 3, severe (>66%).

Hepatic CYP2E1 and CYP4A protein expression of the C and N groups after non-alcoholic fatty liver disease (NAFLD) induction (a) and hepatic CYP2E1, CYP4A, PPARα, PPARγ and TGFβ protein expression of the NN, NA and NB groups at the end of the experimental period. Values are presented as mean ± SEM. C group, control diet (n 8); N and NN group, NAFLD diet (n 8); NA group: NA diet containing 44·9 g/l dehulled adlay powder (n 8); NB group, NB diet containing 89·8 g/l(P < 0·05). CYP, cytochrome P450; PPAR, peroxisome proliferator-activated receptor; TGF, transforming growth factor.
Effects of dehulled adlay on lipid metabolism
After the 8-week experimental period, no differences were observed in final body weight and liver weight among the NN, NA and NB groups (Table 3). Average daily energy intake of the three experimental groups were 99·2 ± 2·6 kcal/d for NN, 97·3 ± 1·6 kcal/d for NA and 102·4 ± 3·5 kcal/d for NB, and the average consumption of dehulled adlay is 3·1 ± 0·1 g/kg-BW/d for NA and 6·8 ± 0·5 g/kg-BW/d for NB. The NB group had lower hepatic lipid and plasma NEFA levels than did the NN group. Histopathological analysis revealed that the NA and NB groups exhibited improvements in hepatic macrovesicular and microvesicular steatosis and significant reduction in hepatic fatty change score (Fig. 1). However, no difference was observed in fecal total lipid excretion (data not shown).
Body weight, plasma lipids, aspartate aminotransferase (AST), alanine aminotransferase (ALT), c-reactive protein (CRP) and hepatic fat accumulation and inflammatory biomarkers of the NN, NA and NB groups at the end of the experimental period (Mean values and standard errors of the mean)
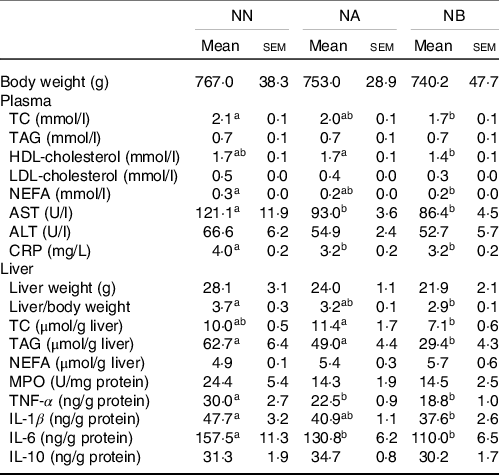
TC, total cholesterol; AST, aspartate aminotransferase; ALT, alanine aminotransferase; CRP, C-reactive protein; MPO, myeloperoxidase.
Values are presented as the mean ± sem. NN group, NAFLD diet (n 8); NA group: NA diet containing 44·9 g/l dehulled adlay powder (n 8); NB group, NB diet containing 89·8 g/l dehulled adlay powder (n 8). Values with different superscript letters at the same time point significantly differ (P < 0·05).
Effects of dehulled adlay on insulin resistance
Compared with the NN group, the NB group had a lower fasting glucose concentration and homoeostasis model assessment of insulin resistance score, lower adipose leptin levels, higher plasma and adipose adiponectin levels and a higher adiponectin/leptin (A/L) ratio (Table 4).
Homoeostasis model assessment-insulin resistance (HOMA-IR) and adipokine levels of the NN, NA and NB groups at the end of the experimental period (Mean values and standard errors of the mean)

NAFLD, non-alcoholic fatty liver disease; A/L, adiponectin/leptin.
Values are presented as the mean ± sem. NN group, NAFLD diet (n 8); NA group, NA diet containing 44·9 g/l dehulled adlay powder (n 8); NB group, NB diet containing 89·8 g/l dehulled adlay powder (n 8). Values with different superscript letters at the same time point significantly differ (P < 0·05)..
Effects of dehulled adlay on liver inflammation
The rats consuming dehulled adlay powder exhibited significantly lower aspartate aminotransferase and C-reactive protein levels at the end of the experimental period. Moreover, the NB group had significantly lower hepatic TNF-α, IL-1β and IL-6 levels than did the NN group (Table 3).
Western blotting
At the end of the experimental period, hepatic CYP2E1 was lower in the NA and NB groups than in the NN group though no significant difference was found (P = 0·08). CYP4A expression was lower in the NA group, and no difference between NA and NB groups was found. PPARγ protein expression was significantly elevated in the NB group. No between-group difference was noted in PPARα and transforming growth factor-β (Fig. 2(b)).
Discussion
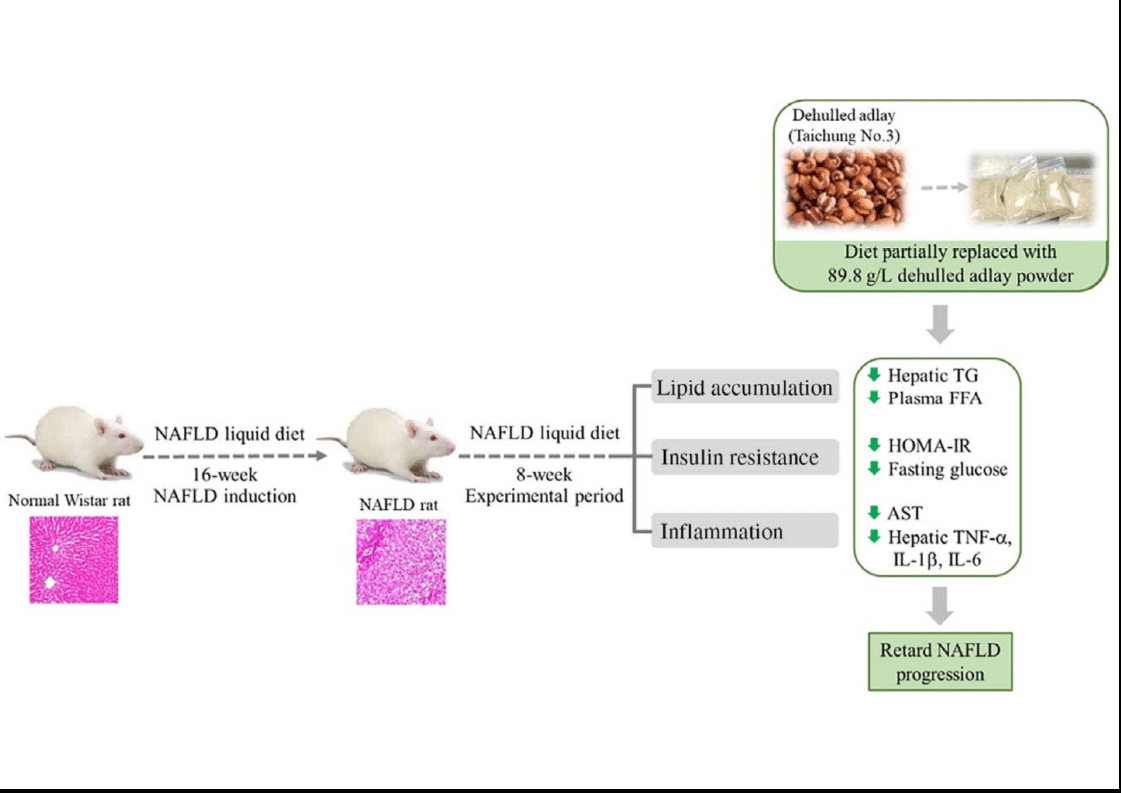
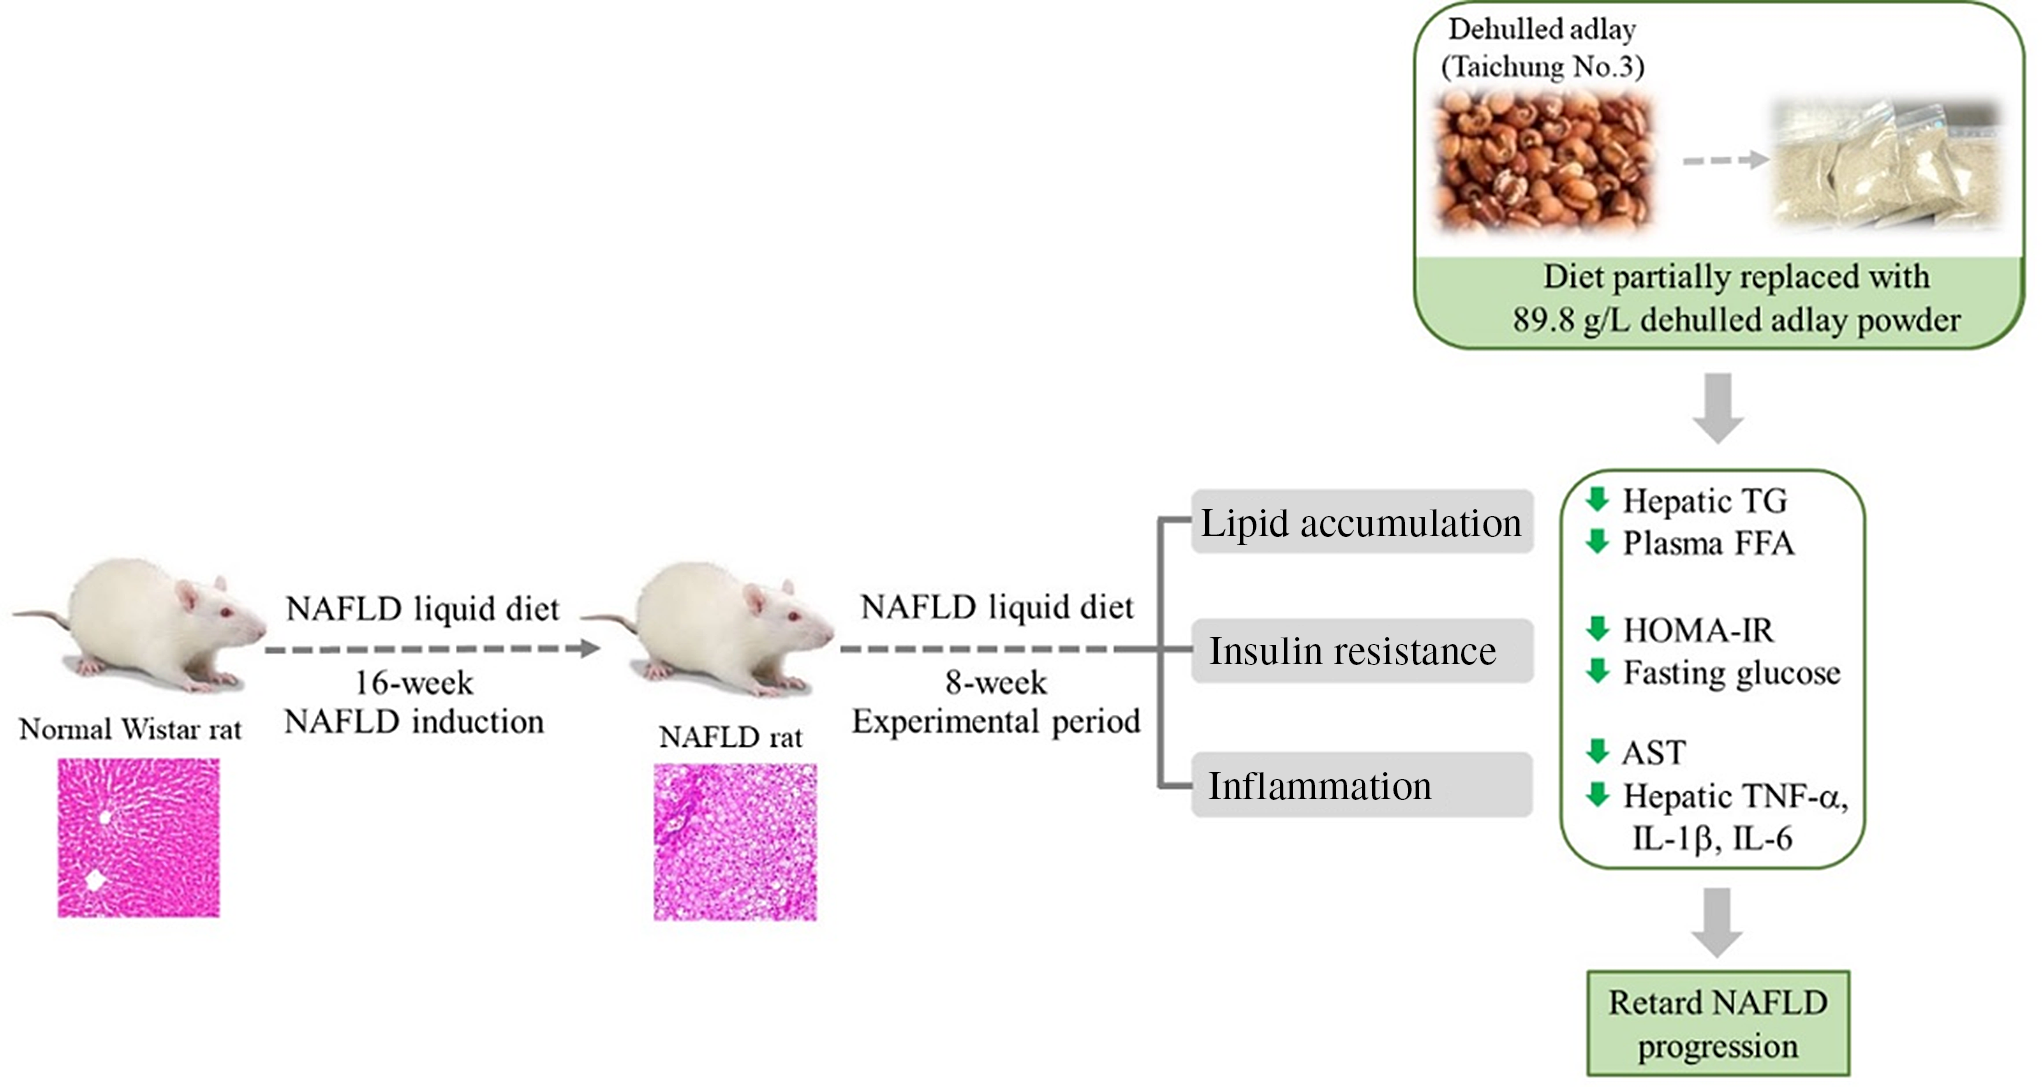
Adlay (Coix lachryma-jobi L. var. ma-yuen Stapf) is widely cultivated in Asia. Its seeds, also called Job’s tears, have been used as a cereal food or a medicinal agent for the traditional treatment of inflammatory diseases(Reference Tsai, Yang and Li18). Dietary supplementation of adlay may have antioxidative and anti-inflammatory effects and lower plasma lipid and glucose concentrations in vivo (Reference Wang, Lin and Wu10,Reference Yeh, Chiang and Chiang11) . Moreover, the ethanolic extract of adlay seed can prevent high-fat-diet-induced metabolic disorders(Reference Chiang, Lu and Chen19). In the present study, we found that diet containing dehulled adlay alleviated fatty liver and hepatic inflammation in a pre-induced NAFLD rodent model after an 8-week experimental period (Fig. 3). In addition, the average consumption of dehulled adlay is 3·1 ± 0·1 g/kg-BW/d for NA and 6·8 ± 0·5 g/kg-BW/d for NB. The dosage of dehulled adlay in this experiment is equal to a 60 kg human intake of about 60 g per day calculated based on body surface area(Reference Nair and Jacob20), which is an acceptable and practical range of Asian diets. To our knowledge, this is the first study to demonstrate that using dehulled adlay as part of diet composition may be beneficial for treating of NAFLD.
Diet containing dehulled adlay for 8-week attenuated the progression of non-alcoholic fatty liver disease (NAFLD) by inhibiting fat accumulation, improving insulin resistance and ameliorating inflammation.
A high-fat diet containing various amounts of fat and cholesterol is used to induce an experimental NAFLD rodent model to recapitulate the etiology of NAFLD. Lieber et al. first proposed using high-fat liquid diet, with 71 % of total energy from fat, to induce NASH(Reference Lieber, Leo and Mak14). However, this model only created mild steatosis with or without inflammation(Reference Sanches, Ramalho and Augusto2). Given that fructose intake is closely linked to metabolic disorders, experimental animals fed a high-fat, high-fructose diet are likely to develop dyslipidaemia, hepatic injury and impaired insulin sensitivity(Reference Nevzorova, Boyer-Diaz and Cubero21). Besides, a recent report also demonstrated that rats fed with high fat and cholesterol diet develops hepatic pathology changes of NASH within 9 weeks(Reference Ichimura, Kawase and Masuzumi22). In the present study, rats fed a high-fat, high-fructose and high-cholesterol diet for 16 weeks significantly elevated hepatic fat accumulation and inflammatory cytokine levels, indicating successful NAFLD induction. Impaired lipid metabolism is a feature of NAFLD; it lead to enhanced lipolysis and NEFA release from visceral adipose tissue and skeletal muscle, causing fat droplet accumulation in hepatocytes and thus affecting liver function(Reference Choi and Diehl23). We observed lower aspartate aminotransferase activity and relative liver weight in rats fed a dehulled adlay-based diet, and no difference in fecal lipid excretion was noted among the NN, NA and NB groups, which were given same amount of dietary fibre. Adlay seed contains not only energy producing-nutrients and dietary fibre but also various bioactive ingredients such as phenolic compounds and coixol(Reference Xu, Chen and Ali24). In diabetic mice, adlay seed-derived polysaccharides can ameliorate dyslipidaemia(Reference Chen, Fan and Wang12). In addition, supplementation of polyphenols extracted from adlay improved the lipid profile of rats fed a high-cholesterol diet(Reference Wang, Sun and Yi25). Administering aqueous or ethanolic extract of adlay can also help prevent high-fat-diet-induced hyperlipidaemia and hepatic steatosis(Reference Chiang, Lu and Chen19). These results suggest that consuming dehulled adlay as a part of diet composition may be beneficial for treating NAFLD due to its bioactive constituents.
Adipokines, especially leptin and adiponectin, may be associated with NAFLD pathogenesis through their effects on insulin resistance(Reference Polyzos, Kountouras and Zavos26). Circulatory leptin levels are higher in patients with NAFLD than in healthy people, and leptin concentration is positively correlated with steatosis severity(Reference Polyzos, Aronis and Kountouras27). By contrast, adiponectin improves insulin sensitivity and inhibits lipid accumulation in the liver by reducing the de novo synthesis of NEFA in hepatocytes(Reference You, Considine and Leone28). The A/L ratio was reported to be a non-invasive predictor of NAFLD(Reference Brunt29). In our study, high-dose dehulled adlay supplementation significantly decreased leptin levels in abdominal white adipose tissue and increased adiponectin and A/L ratio in blood and fat. Therefore, the dehulled adlay reduced insulin resistance at least partially by regulating leptin and adiponectin production. Insulin resistance may be the primary trigger for hepatic steatosis and lipid peroxidation, and it plays a critical role in NAFLD progression(Reference Choudhury and Sanyal30). Although no significant difference was observed in fasting insulin levels among all groups, high-dose dehulled adlay supplementation significantly reduced elevated fasting glucose levels and homoeostasis model assessment of insulin resistance scores. Peripheral insulin resistance is considered to promote fat mobilization, inhibit NEFA esterification and increase blood NEFA concentration(Reference Yin, Liu and Zheng31). We observed that high-dose dehulled adlay supplementation significantly decreased plasma NEFA, likely due to mitigation of insulin resistance. Taken together, the results indicate that dehulled adlay supplementation can improve insulin resistance in an animal model of NAFLD.
In the present study, the high-fat-diet-induced elevation of circulatory C-reactive protein levels and hepatic proinflammatory cytokine excretion was significantly reduced by dehulled adlay supplementation, thus demonstrating its anti-inflammatory effects against NAFLD. High-dose dehulled adlay also increased PPARγ protein expression in rats with established NAFLD. PPARγ is a transcription factor regulating lipid metabolism, inflammation, insulin resistance, cell differentiation and apoptosis(Reference Houseknecht, Cole and Steele32,Reference Zhong and Liu33) . Previous study demonstrated that 12 months of PPARγ agonist treatment significantly ameliorated hepatocellular injury and fibrosis in patients with NASH(Reference Aithal, Thomas and Kaye34). Moreover, PPARγ activation protects against NASH by reducing inflammation, possibly by inhibiting the production of inflammatory cytokines, such as TNF-α and IL-1β (Reference Singh, Khera and Allen35).
Upregulated hepatic CYP2E1 expression can often be observed in patients with NASH(Reference Weltman, Farrell and Hall36). CYP2E1-mediated lipid peroxidation, reactive oxygen species generation and consequent oxidative stress in the liver are strongly associated with NASH progression(Reference Leung and Nieto37). Similar to CYP2E1, CYP4A was reported to be an alternative initiator of oxidative stress in a murine model of NASH, and its ablation could attenuate hepatic steatosis and fibrosis(Reference Leclercq, Farrell and Field38). However, dehulled adlay supplementation only slightly reduced hepatic CYP2E1 and CYP4A protein expression in the present study. A longer intervention period may be required to clarify the effects of dehulled adlay intake on CYP2E1 and CYP4A expression. Recent studies have indicated that dietary bioactive compounds may also ameliorate NAFLD through the gut-liver axis(Reference Mokhtari, Gibson and Hekmatdoost39). Animal studies have indicated that phenolic compounds and polysaccharides derived from adlay seeds have the potential to modulate intestinal microbiota(Reference Chen, Fan and Wang12,Reference Wang, Sun and Yi25) . Further research is required evaluate the effects of dehulled adlay consumption on gut dysbiosis and hepatic inflammation to guide future interventions in modulating the dietary patterns for patients with NAFLD.
Dehulled adlay is consumed as one of the staple foods in Asian countries. In our study, we used dehulled adlay to replace the same amount of macronutrients in the NAFLD diet to mimic the involvement of this grain in our dietary pattern. Although the inconsistency in the amount of fructose among the experimental groups is indeed a limitation of the present experiment and may be partially responsible for the observed effects, our results still suggested that dehulled adlay can be used as a healthy diet option to improve the metabolic changes and ameliorate the progress of NAFLD. Future studies may extend the duration of the experimental period and keep a control group containing the same amount of macronutrients and dietary fibre throughout the experiment to further clarify the mechanisms and possibilities of consuming dehulled adlay as a healthy dietary whole grain choice in normalising metabolic and inflammatory parameters in NAFLD.
Conclusions
The current study demonstrated that dehulled adlay consumption, especially at higher dose, attenuated the progression of NAFLD by inhibiting fat accumulation, improving insulin resistance and ameliorating inflammation. Therefore, dehulled adlay may be useful therapeutic dietary modification choice for patients with NAFLD. The detailed mechanisms still require further investigation.
Acknowledgements
This research was funded by the Ministry of Science and Technology. The project number is NSC 101-2320-B-214 −002.
The contribution of each author was as follows: W-J. Y. and H-Y. Y.: conceptualization; W-J. Y., J. K., W-Y. C., H-Y.Y.: investigation; W-J. Y., J. K. and H-Y. Y.: Writing – original draft. Allauthors have seen and approved the contents of the submitted manuscript.
All authors stated that there were no conflicts of interest, and all authors adhered to the Committee on Publication Ethics guidelines on research and publication ethics.


