

Overweight (BMI≥25 kg/m2) and obesity (BMI≥30 kg/m2) are global health problems that concern over 50 % of western populations( 1 ). Excess adipose tissue with its array of metabolic disturbances increases the risk of chronic diseases, such as the metabolic syndrome, type 2 diabetes, CVD and cancer( Reference Lim, Vos and Flaxman 2 ). Therefore, even a small weight loss may lead to health benefits.
Effective permanent weight loss and weight maintenance depend largely on favourable changes in diet and physical activity. Furthermore, instead of focusing on single macronutrients (such as fat or sugar) one should focus on the healthiness of the whole diet( Reference Willett and Stampfer 3 , Reference Jacobs and Tapsell 4 ). Of the healthy dietary patterns, the Mediterranean diet has been the most extensively studied regarding obesity and weight gain. Studies have reported approximately 30 % lower risk of overweight or obesity and 10 % lower weight gain in participants with high adherence to the Mediterranean diet compared with those with low adherence( Reference Buckland, Bach and Serra-Majem 5 , Reference Romaguera, Norat and Vergnaud 6 ). A meta-analysis of randomised controlled trials showed that Mediterranean diet results in 1·75 kg larger weight loss compared with control diets( Reference Esposito, Kastorini and Panagiotakos 7 ). Despite these proven health effects of the Mediterranean diet, other populations may have difficulties in adopting this dietary pattern due to differences in food culture and resources.
In Nordic countries (Denmark, Finland, Iceland, Norway and Sweden), the concept of the healthy Nordic diet is increasingly studied( Reference Bere and Brug 8 ). The rationale behind the Nordic diet is to emphasis use of healthy foods that can be produced locally and are therefore easily available, affordable and culturally acceptable. The diet is rich in foods grown in Nordic countries, such as apples, and berries, roots and cabbages, rye, oats and barley, low-fat milk products, rapeseed oil and fish (e.g. salmon and Baltic herring). Furthermore, it is described to be low in red meat, processed meat products and alcohol. Many studies have indicated that this kind of diet may improve heart health( Reference Uusitupa, Hermansen and Savolainen 9 – Reference Kanerva, Kaartinen and Rissanen 13 ). However, its effects on weight loss and maintenance are less clear. In two randomised controlled trials, the healthy Nordic diet lowered weight significantly more compared with the control diet among obese individuals( Reference Adamsson, Reumark and Fredriksson 11 , Reference Poulsen, Due and Jordy 12 , Reference Poulsen, Crone and Astrup 14 ). Weight loss in the Nordic diet group was achieved by decreased energy intake, which was achieved possibly due to diet’s large fibre content( Reference Adamsson, Reumark and Fredriksson 11 , Reference Poulsen, Due and Jordy 12 ). In cross-sectional epidemiological studies, adherence to the healthy Nordic diet was associated with lower likelihood of excess waist circumference (WC)( Reference Kanerva, Kaartinen and Schwab 15 ), but no association between adherence to the diet and changes in body weight or WC was observed in a cohort followed over 12 years( Reference Li, Roswall and Strom 16 ). Furthermore, a case–control study reported no association between healthy Nordic diet, body weight and WC among participants from five European countries( Reference Roswall, Angquist and Ahluwalia 17 ). These longitudinal observations were based largely on self-reported data which may have attenuated the results.
The main aim was to examine the association between the healthy Nordic diet and 7-year changes in anthropometric measures (weight, BMI and WC) among the general population. Our study complements the previous studies which have mainly focused on short-term results on high-risk groups. Furthermore, we examined not only the baseline adherence to the diet, but also the changes occurred in the adherence during the follow-up. Lastly as a secondary aim, as some participants provided only self-reported anthropometrics at the follow-up, we examined the agreement between self-reported and nurse-measured anthropometrics among those participants from who both measurements were available in order to interpret our results.
Methods
Participants
The DIetary, Lifestyle and Genetic Determinants of Obesity and Metabolic syndrome (DILGOM) 2007( Reference Konttinen, Männistö and Sarlio-Lähteenkorva 18 ) study was an expansion in the framework of the National FINRISK Studies( Reference Vartiainen, Laatikainen and Peltonen 19 ) – the main health monitoring system on Finnish adults every 5 years since 1972 (online Supplementary Fig. S1). In brief, the FINRISK 2007 is a population-based, random sample of 10 000 Finns aged 25–75 years from five large geographical regions of Finland. The FINRISK 2007 participants (n 6258, participation rate 63 %) who went through clinical examination between January and March were invited to the DILGOM baseline study with more specific measurements regarding obesity and the metabolic syndrome between April and June 2007. Of the invited, 5024 (2325 men and 2699 women; participation rate 80 %) participated in the examination.
The follow-up of DILGOM study was conducted 7 years after baseline between April and June 2014 similar than the baseline study (online Supplementary Fig. S1). After excluding those who died during the follow-up, who had moved outside Finland, and those whose contact information was not available (n 434), 4581 participants were invited to the follow-up. Of the invited, 3735 individuals participated (participation rate 82 %). The follow-up was carried out in two groups:
(1) a health questionnaire and clinical examination for participants who lived in the capital area (Helsinki, Vantaa and Espoo) and southwestern Finland, (n 1312, participation rate 74 %); and
(2) questionnaires and measuring tape for those who lived in North Karelia, Northern Savo and Ostrobothnia (n 2423, participation rate 87 %).
Of the 1312 participants who attended the clinical examination in 2014, both measured and self-reported height were obtained from 557 men and 719 women, whereas measured and self-reported weight were obtained from 520 men and 672 women. Furthermore, to validate self-measured WC, a randomly selected subset that was stratified according to participants’ age, sex and living area was drawn from the Group 1. Within this subset, both nurse- and self-measured WC values were obtained from 140 men and 141 women.
The DILGOM and FINRISK studies have been conducted according to the guidelines laid down in the Declaration of Helsinki, and all procedures involving human subjects were approved by the Ethics Committee of the Hospital District of Helsinki and Uusimaa. Written informed consent was obtained from all participants.
Questionnaires and measurements
Participants’ age and sex were originally derived from Population Information System. Along with the invitation letters, both Groups 1 and 2 received standardised questionnaires via mail. The main health questionnaire included questions on socioeconomic position, smoking, physical activity, medical history, psychosocial factors and sleep. Leisure-time physical activity was assessed by asking the participants to define their activity outside work using four categories: inactive (mainly reading, watching television or other light activities) moderately active (walking, cycling, gardening or other activity at least 4 h/week), active (brisk running, walking cross-country skiing, swimming or other physically demanding activities at least 3 h/week), and highly active (competition sports aiming and physically demanding exercising several times in week). Furthermore, the questionnaire queried on participants’ weight, and height as ‘What is Your current weight? (kg)’ and ‘What is Your current height? (cm)’. Self-reported BMI (kg/m2) was calculated based on answers to these questions. Those who were not invited to the health examination (Group 2) received also measuring tape and written instructions to measure their WC. The instructions are described below.
In addition to the main health questionnaire, a validated Finnish FFQ assessing dietary habits over 12 preceding months was sent to all participants( Reference Männistö, Virtanen and Mikkonen 20 , Reference Kaartinen, Tapanainen and Valsta 21 ). The average daily food, nutrient and energy intakes were calculated, using the Finnish National Food Composition Database (Fineli®) and in-house software( Reference Reinivuo, Hirvonen and Ovaskainen 22 ). Participants whose daily energy intake (cut-offs) corresponded to 0·5 % at both ends of the daily energy intake distributions were excluded from analyses( Reference Meltzer, Brantsaeter and Ydersbond 23 ).
In the clinical examination (Group 1), trained study nurses measured participants’ anthropometrics according to internationally standardised protocols( Reference Tolonen, Koponen and Aromaa 24 ). These included a request for the participant to remove shoes and heavy outer garments and to empty their pockets. During the visit, nurses also measured blood pressure and drew blood samples. Height was measured to the nearest 0·1 cm, using stadiometer, and weight to the nearest 0·1 kg, using balance scale. BMI based on nurse-measured values was calculated. Furthermore, participants’ body composition (e.g. fat mass) was measured, using electric bioimpedance scale (TANITA TBF-300MA; Tanita Corporation of America, Inc.).
During the health examination, participants belonging to the WC subset were asked to measure their WC using similar measurement tape and written instructions as was mailed for those who were not invited to the health examination (Group 2). Study nurses were neither allowed to assist nor to advise in the self-measurement.
The instructions advised participants to do the measurement on bare skin or wearing only light clothing, and standing in front of a mirror to facilitate correct placement of the measuring tape. Participants were advised to place the measuring tape around the waist to the mid-point between the lowest rib and iliac crest, then breathe normally and read the measuring tape during exhale.
Thereafter, study nurses measured WC to the nearest 0·5 cm by placing a soft measuring tape around the waist to the mid-point of lowest rib and iliac crest, and reading was done during light exhale( Reference Tolonen, Koponen and Aromaa 24 ).
Calculation of the dietary score
The development of the Baltic Sea Diet Score (BSDS) that illustrates adherence to the healthy Nordic diet has been described in detail elsewhere( Reference Kanerva, Kaartinen and Schwab 25 ). In brief, the BSDS includes nine dietary components: high intake of Nordic fruits (apples, pears and berries); Nordic vegetables (tomatoes, cucumber, leafy vegetables, roots, cabbages, peas); Nordic cereals (rye, oat and barley); low-fat and fat-free milk; Nordic fish (salmon and freshwater fishes); ratio of PUFA:SFA and trans-fatty acids; low intake of red and processed meat; and total fat (E%); and moderate or low intake of alcohol (ethanol).
All components, except alcohol, were scored according to sex-specific population consumption quartiles. Points were assigned according to the predictable health impact of the component. For fruits and berries, vegetables, cereals, low-fat and fat-free milk, fish and the fat ratio, the lowest quartile was coded as 0, the second lowest as 1, the third one as 2 and the highest quartile as 3. For meat products and total fat, the highest quartile was coded as 0, the second highest as 1, the next one as 2 and the lowest quartile as 3. For alcohol, the cut-offs were assigned according to the moderate consumption level recommended in Nordic countries. Men consuming 20 g or less and women consuming 10 g or less of alcohol per d received 1 point; otherwise, 0 points were given. The resulting BSDS ranged from 0 to 25 points, with higher score values representing greater adherence to the healthy Nordic diet. Category boundaries for BSDS fifths in men were: 1st fifth 0–9 points, 2nd fifth 10–12 points, 3rd fifth 13–14 points, 4th fifth 15–16 points and highest fifth 17–25 points. In women, boundaries were: 1st fifth 0–9 points, 2nd fifth 10–12 points, 3rd fifth 13–14 points, 4th fifth 15–16 points and highest fifth 18–25 points.
Statistical methods
We used R statistical software version 3.0.2( 26 ) and SAS statistical software version 9.3 (SAS Institute) to analyse the data. Regarding missing values, only complete cases were analysed. Descriptive statistics by sex, and by the BSDS fifths were calculated as means and standard deviations or percentages (%). Distribution of the main continuous variables was checked using QQ-plots and histograms. The original sample size for the DILGOM study was calculated on the estimation that a clinically significant 5 % increase in BMI would occur among 43 % of study participants during the 7-year follow-up. This gives a 90 % power for detecting an OR of 1·1 at the α level of 0·05 per 1 sd increase in cytokine concentration (e.g. IL-1ra).
In the validation of self-reported anthropometrics, intra-class correlations (ICC) between the self-reported and nurse-measured anthropometrics were calculated as the ratio of the subject variance and the sum of the subject variance, the rater variance and the residual (the agreement version). Furthermore, linear regression analysis was performed to investigate whether the difference in anthropometric measures ((self-report)−(nurse-measurement)) varied across the mean of estimates ((self-report+nurse-measurement)/2), as suggested by Bland & Altman( Reference Bland and Altman 27 ). The slope of the regression line was tested for a significant deviation from zero. The slopes significantly different from zero indicate a relationship between adiposity status and the measurement error in the self-report relative to the nurse-measurement.
In the main analysis, the association between BSDS and weight change was analysed keeping men and women together as strong evidence of interaction between the BSDS and sex did not emerge in the study population (P>0·05). Change in weight, BMI and WC during 7-years follow-up was calculated as: follow-up value−baseline value. Positive values for weight/BMI/WC change indicated that participant had gained weight during follow-up, whereas negative values indicated weight loss. The change values were then used as main outcome variables in linear regression analysis. Baseline adherence to the healthy Nordic diet, measured with the BSDS, was used as the main explanatory variable. Moreover, we calculated the change between follow-up BSDS and baseline BSDS, and these values were also used as explanatory variables to study the association between changes in dietary adherence and change in weight/BMI/WC.
Confounding variables used in the models were first selected based on the literature (age, sex, energy intake, physical activity, smoking, education, previous pregnancies, baseline weight and WC) and then confirmed with linear regression analysis( Reference Rothman 28 ). Based on this analysis, we adjusted Model 1 for age (years; continuous), sex (dichotomic) and energy intake (kJ; continuous); model 2 we additionally adjusted for smoking (never smoker, quit>6 months ago, quit<6 months ago, current smoker; categorical), leisure-time physical activity (low, moderate and high or very high; categorical). Model 3 was additionally adjusted for baseline weight/BMI/WC. When a change in WC was examined as the main outcome, the third model was also adjusted for change in BMI in order to control the distribution of fat. Furthermore, when a change in BSDS was examined as the main explanatory variable, baseline BSDS was added to the third model as confounding variable.
Sensitivity testing was done by excluding participants who reported myocardial infarction (follow-up, n 73) or stroke (follow-up, n 69) at follow-up, as well as participants reporting type 2 diabetes (baseline, n 61; follow-up, n 33), and cancer (baseline, n 156; follow-up, n 73) at baseline or during follow-up. Furthermore, we excluded those participants who had been pregnant between 2007 and 2014 (n 103).
Results
Validation of anthropometric measures
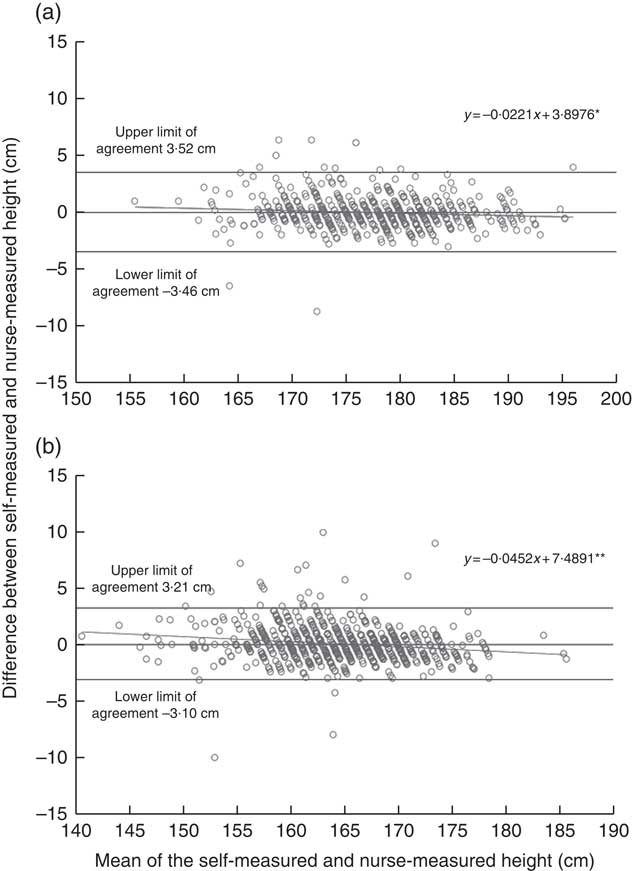
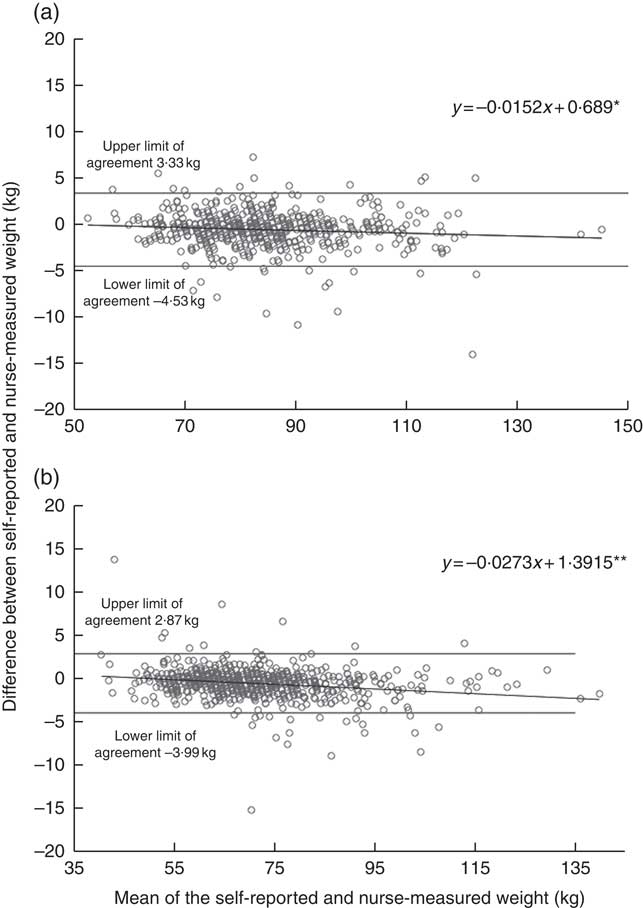
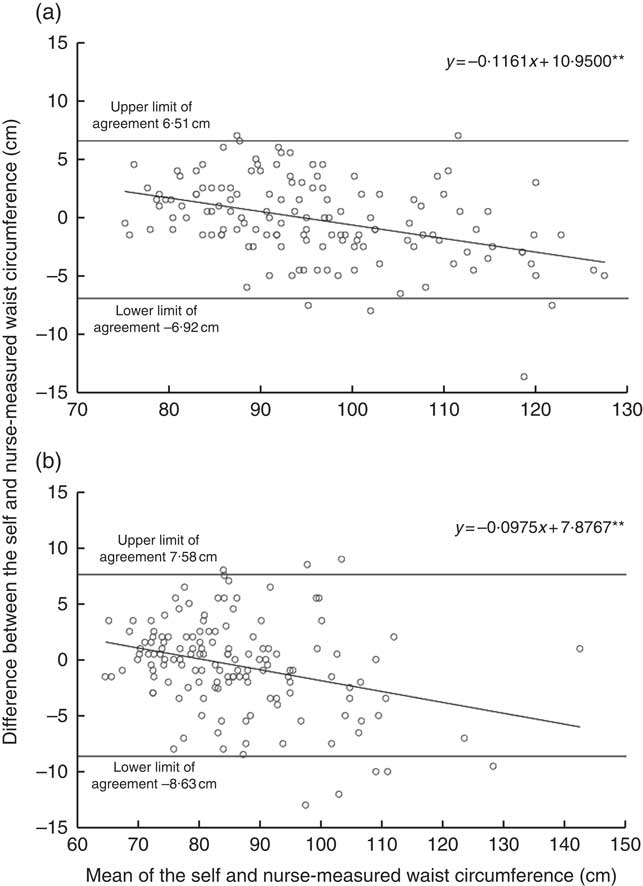
The online Supplementary Table S1 describes background characteristics and anthropometrics at the time of the follow-up study for those participants who were included in the validation. The measured height, weight and WC were on average similar to the self-reported values. This was also demonstrated by the high ICC agreement between self-reported and nurse-measured height (ICC coefficient 0·96 in men and 0·97 in women), weight (ICC coefficient 0·99 in men and women) and WC (ICC agreement 0·96 in men and 0·95 in women). Bland–Altman plots demonstrated a negative bias toward higher values (Figs. 1 and 2). In other words, the heavier or taller individual, the lower self-reported values were compared with the nurse-measured values. The mean difference between self-reports and measurements was <0·1 cm (sd 1·8 cm for men and 1·6 cm for women) for height and 0·6 kg (sd 2·0 kg for men and 1·8 kg for women) for weight. In WC, the negative bias toward higher WC values was more obvious than in height and weight measurements. However, the mean difference between self-measurement and nurse-measurement was 0·2 cm (sd 3·4 cm) for men and 0·4 cm (sd 4·1) for women (Fig. 3). These results imply that self-reported and measured height and weight could be used simultaneously without any correction coefficient in the main analyses of this study.
Agreement between self-reported and nurse-measured height in the DIetary, Lifestyle and Genetic Determinants of Obesity and Metabolic syndrome 2014 Study men (a) and women (b). Linear regression analysis was performed to investigate whether the difference in anthropometric measures ((self-report)−(nurse-measurement)) varied across the mean of estimates ((self-report+nurse-measurement)/2), as suggested by Bland & Altman( Reference Bland and Altman 27 ). The dots represent observation made on each participant. The solid line represents the slope of the regression line, which was tested for a significant deviation from zero. The slopes significantly different from zero indicate a relationship between height status and the measurement error in the self-report relative to the nurse-measurement. The analysis included 557 men and 719 women. * P<0·05, ** P<0·001.
Agreement between self-reported and nurse-measured weight in the DIetary, Lifestyle and Genetic Determinants of Obesity and Metabolic syndrome 2014 Study men (a) and women (b). Linear regression analysis was performed to investigate whether the difference in weight measures ((self-report)−(nurse-measurement)) varied across the mean of estimates ((self-report+nurse-measurement)/2), as suggested by Bland & Altman( Reference Bland and Altman 27 ). The dots represent observation made on each participant. The solid line represents the slope of the regression line, which was tested for a significant deviation from zero. The slopes significantly different from zero indicate a relationship between adiposity status and the measurement error in the self-report relative to the nurse-measurement. The analysis included 520 men and 672 women. * P<0·05, ** P <0·001.
Agreement between self-measured and nurse-measured waist circumference in the DIetary, Lifestyle and Genetic Determinants of Obesity and Metabolic syndrome 2014 Study men (a) and women (b). Linear regression analysis was performed to investigate whether the difference in waist circumference measures ((self-report)−(nurse-measurement)) varied across the mean of estimates ((self-report+nurse-measurement)/2), as suggested by Bland & Altman( Reference Bland and Altman 27 ). The dots represent observation made on each participant. The solid line represents the slope of the regression line, which was tested for a significant deviation from zero. The slopes significantly different from zero indicate a relationship between adiposity status and the measurement error in the self-report relative to the nurse-measurement. The analysis included 140 men and 141 women. ** P<0·001.
Association between Baltic Sea Diet Score and weight change
Mean age of men and women was approximately 53 years at baseline (Table 1). Most of the participants were never smokers and were physically moderately active in their spare time. During the 7-year follow-up, in general, the participants had gained weight, their BMI had risen and also their WC had increased. Furthermore, adherence to the healthy Nordic diet (BSDS) decreased approximately 1 point during the follow-up. Participants’ age, educational attainment as well as the proportion of participants in the most physically active group and never smokers increased along with the BSDS (Table 2). Moreover, participants in the highest BSDS fifth had improved their BSDS and maintained their weight, BMI and WC better compared with the lowest BSDS fifth. Intake of energy was on average largest in the highest BSDS fifth.
Characteristics of the DIetary, Lifestyle and Genetic Determinants of Obesity and Metabolic syndrome 2014 follow-up participants (Mean values and standard deviations; percentages)
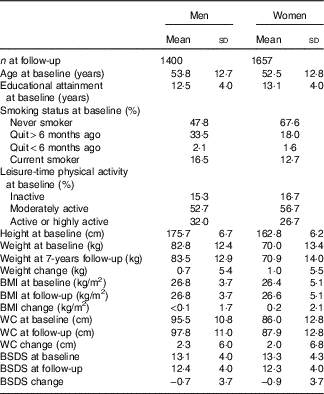
BSDS, Baltic Sea Diet Score; WC, waist circumference.
Characteristics of the DIetary, Lifestyle and Genetic Determinants of Obesity and Metabolic syndrome 2014 follow-up participants by adherence to the healthy Nordic diet (Mean values and standard deviations; percentages)
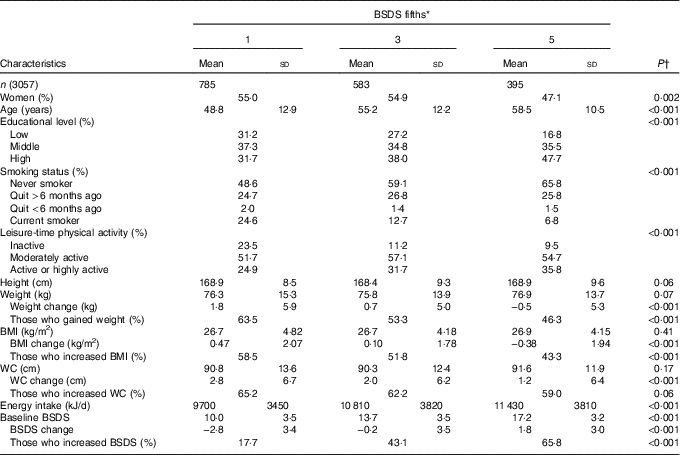
BSDS, Baltic Sea Diet Score; WC, waist circumference.
* Category boundaries for BSDS fifths in men were: 1st fifth 0–9 points, 2nd fifth 10–12 points, 3rd fifth 13–14 points, 4th fifth 15–16 points and highest fifth 17–25 points. In women, boundaries were: 1st fifth 0–9 points, 2nd fifth 10–12 points, 3rd fifth 13–14 points, 4th fifth 15–16 points and highest fifth 18–25 points.
† Unadjusted P values were derived from logistic regression for continuous variables and from χ 2 test for categorical variables.
In the main linear regression analyses, the baseline BSDS was inversely associated with change in weight, BMI and WC (Table 3). In other words, those with higher BSDS either maintained their weight better or lost weight during the follow-up. For weight and BMI, but not for WC, this association was statistically significant when participants’ leisure-time physical activity, smoking and anthropometric measures at baseline were taken into account as confounders (model 3). In the sensitivity analysis, when participants whose weight or diet may have changed due to illness or pregnancy during follow-up were excluded the inverse association between baseline BSDS and change in body weight and BMI remained statistically significant (model 4).
Linear association between Baltic Sea Diet Score (BSDS) and change in body anthropometrics during 7-years follow-upFootnote * (β-Coefficients with their standard errors)
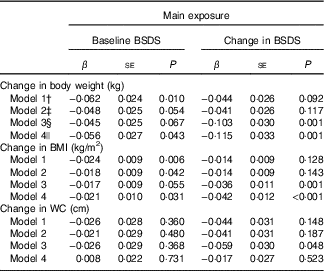
WC, waist circumference.
* Estimates and P values were derived from linear regression analysis, in which the baseline or change in BSDS was used as the main exposure and change in anthropometric measures (baseline−follow-up) as the outcome.
† Model 1 is adjusted for age, sex and baseline energy intake.
‡ Model 2 is model 1 further adjusted for baseline leisure-time physical activity and smoking.
§ Model 3 is model 2 further adjusted for baseline weight/BMI/WC depending on which of these measures was used as the main outcome. When weight was examined as the main outcome, the model was adjusted for baseline height. When the change in BSDS was examined as the main exposure, this model was also adjusted for baseline BSDS.
|| Model 4 is model 3, excluding participants who reported myocardial infarction or stroke during follow-up; participants reporting type 2 diabetes, and cancer at baseline or during follow-up; and women who had been pregnant during follow-up.
When the change in BSDS during follow-up was used as the main exposure, increasing BSDS during the follow-up associated with better-maintained or decreased weight and BMI (Table 3). This association became statistically significant after taking account baseline anthropometric measures and remained when participants whose weight or diet may had changed due to illness or pregnancy during follow-up.
Finally, we did analysis which combined the baseline values and changes during follow-up in both BSDS and body anthropometrics (Table 4). Among those participants who increased their BSDS during follow-up (n 1119; mean change 2·9 points, sd 1·9), the baseline BSDS was inversely associated with changes in weight and BMI when the baseline anthropometrics were adjusted for (P<0·01; model 1–3). These associations strengthened after excluding participants whose weight or diet may have changed due to illness or pregnancy during follow-up (model 4). No association was observed between BSDS and WC in these models. In participants who decreased or maintained their BSDS during follow-up, (n 1938; mean change −3·0 points, sd 2·5) no statistically significant associations between the baseline BSDS and anthropometric measures emerged (Table 4). As the results for those who increased and those who maintained or decreased their BSDS was different, we also analysed the interaction between change in BSDS and baseline BSDS. However, we did not find support for the hypothesis that change in BSDS during follow-up would modify the association between baseline BSDS and weight change (likelihood ratio test P=0·14).
Linear association between baseline Baltic Sea Diet Score (BSDS) and change in body anthropometrics by changes in BSDS during 7 years of follow-upFootnote * (β-Coefficients with their standard errors)
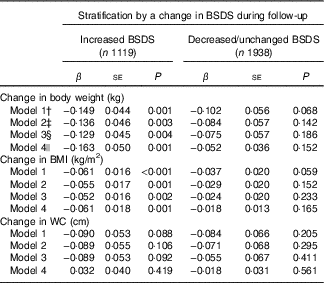
WC, waist circumference.
* Estimates and P values were derived from linear regression analysis, in which the baseline BSDS was used as the main exposure and change in anthropometric measures (baseline−follow-up) as the outcome.
† Model 1 is adjusted for age, sex and baseline energy intake.
‡ Model 2 is model 1 further adjusted for baseline leisure-time physical activity and smoking.
§ Model 3 is model 2 further adjusted for baseline weight/BMI/WC depending on which of the measures was used as the main outcome. When weight was examined as the main outcome, this model was adjusted for baseline height.
|| Model 4 is model 3 excluding participants who reported myocardial infarction or stroke during follow-up; participants reporting type 2 diabetes, and cancer at baseline or during follow-up; and women who had been pregnant during follow-up.
Discussion
The healthy Nordic diet associated with lower weight gain over 7 years of follow-up
In our prospective study, adherence to the healthy Nordic diet, measured with the BSDS, was associated with decreased weight and BMI in general Finnish population after 7 years of follow-up. Those with the highest adherence to the healthy Nordic diet at baseline had (on average) 0·3 kg higher weight loss over the follow-up compared with those in the lowest adherence to the diet. This may be interpreted as better weight maintenance achieved by the healthy Nordic diet. The association was found to be stronger among participants who increased their adherence to the diet during the follow-up. No association between adherence to the diet and change in WC was observed. Adjustment of participants’ leisure-time physical activity, smoking and anthropometric measures at baseline did not change the result markedly. Furthermore, the results were similar for the whole cohort and when participants whose weight may have been affected by illness or pregnancy were excluded.
Our results are generally in line with the literature indicating that dietary pattern (e.g. Mediterranean diet or Healthy Eating Index) which is rich in fruits and vegetables, wholegrain, fish, oils, nuts and dairy products as well as low in red and processed meat, sugar-sweetened beverages and high-fat foods may prevent from weight gain( Reference Romaguera, Norat and Vergnaud 6 , Reference Buckland, Bach and Serra-Majem 29 – Reference Mozaffarian, Hao and Rimm 33 ). Epidemiological studies on the potential of the healthy Nordic diet to prevent weight gain are still few. One longitudinal cohort study( Reference Li, Roswall and Strom 16 ) and one case–control( Reference Roswall, Angquist and Ahluwalia 17 ) have been previously published in this research area. In contrast to our findings, either of these studies found an association between the healthy Nordic diet and change in anthropometric measures. The study of Li et al.( Reference Li, Roswall and Strom 16 ) consisted of Swedish women and was based on self-reports. Moreover, dietary data were collected at baseline. Compared with Li et al.( Reference Li, Roswall and Strom 16 ), our study had most of the anthropometric data measured by trained nurses and dietary intake measured two times, which may have lowered information bias (e.g. measurement error) and allowed us to detect statistically significant differences. In the case–control study, participants were from five European countries, including one Nordic country. It is likely that adherence to the healthy Nordic diet was at a much lower level in the non-Nordic countries, which may have contributed to the null finding. The Mediterranean diet( Reference Trichopoulou, Kouris-Blazos and Wahlqvist 34 ) has been associated with weight loss and lower WC among Western populations( Reference Romaguera, Norat and Vergnaud 6 , Reference Esposito, Kastorini and Panagiotakos 7 , Reference Kastorini, Milionis and Esposito 35 ), but the association has been substantially stronger among Mediterranean populations than other Europeans, especially Nordic populations( Reference Romaguera, Norat and Vergnaud 6 ). Lastly, both of the previous epidemiological studies used the Nordic Diet Score( Reference Olsen, Egeberg and Halkjaer 10 ), which includes six food items to characterise the healthy Nordic diet. The BSDS used in our study is more comprehensive compared with the Nordic Diet Score. This may explain the difference in the findings to some extent.
Although not entirely comparable to our study, intervention studies have also reported an association between the healthy Nordic diet and decreased weight. In the Danish intervention, of those who completed the 26-week study, ninety-one participants in the intervention group had 3·2 kg greater weight loss than the fifty-eight controls( Reference Poulsen, Due and Jordy 12 ). The weight loss was followed by regaining towards pre-intervention level during the next 52 weeks( Reference Poulsen, Crone and Astrup 14 ). In the end, from screening to week 78 there was no difference in total weight loss between the diets. Adamsson et al.( Reference Adamsson, Reumark and Fredriksson 11 ) found a 4 % decrement in weight among forty-four participants following the healthy Nordic diet for 6 weeks compared with forty-two controls. In contrast to these trials, a multi-centre intervention reported no changes in body weight during 18–24 week intervention( Reference Uusitupa, Hermansen and Savolainen 9 ). However, this study aimed to isoenergetic design and not to weight loss( Reference Uusitupa, Hermansen and Savolainen 9 ).
Self-reported and -measured anthropometrics reached high agreement among adult Finns
Our results indicate that self-reports of height, weight and WC have a very high agreement with nurse-measured values among the adult population. These results support the rationale to use the subjective values solely or simultaneously with objective data in epidemiological analysis without correction equations.
The majority of studies have reported good consistency between self-reported and measured height and weight( Reference Kuczmarski, Kuczmarski and Najjar 36 ), but also poor consistency has been observed in some studies( Reference Shields, Connor Gorber and Tremblay 37 ). Generally, people tend to overrate their height or underrate their weight( Reference Connor Gorber, Tremblay and Moher 38 – Reference Park, Mitrou and Keogh 40 ). Furthermore, the degree of underrating of weight has been shown to be higher in individuals with overweight and obesity and in younger women whereas in men the results on weight misreporting have been more inconsistent( Reference Shields, Connor Gorber and Tremblay 37 , Reference Taylor, Dal Grande and Gill 41 – Reference Hattori and Sturm 43 ). Furthermore, overrating of height has been found to be to higher among older people and especially among older men( Reference Shields, Connor Gorber and Tremblay 37 ). Patterns of under- and overrating could be seen in our results, although our data generally showed good consistency between self-reported and measured height and weight, mean difference between these values being <1 cm for height and 0·6 kg for weight.
Thus far, few studies have validated self-measured WC against nurse-measured WC. Results have been conflicting as studies have reported either systematic over-( Reference Contardo Ayala, Nijpels and Lakerveld 44 ) or underrating( Reference Khunti, Taub and Webb 45 ) of self-measurements compared with nurse-measured values. A Dutch study (with fairly similar population characteristics to ours) found that the participants’ self-measurement overrated WC averagely by 6 cm compared with nurse-measurement( Reference Contardo Ayala, Nijpels and Lakerveld 44 ). In contrast, the largest validation study published so far that concerned the Norfolk cohort of the European Prospective Investigation into Cancer and Nutrition (EPIC) observed significant underestimation of self-reported WC compared with the measured values (mean difference 4–6 cm)( Reference Park, Mitrou and Keogh 40 ). A similar trend, but lower degree of underestimation (mean difference 2–3 cm) was reported in the Oxford cohort of the EPIC study( Reference Spencer, Roddam and Key 46 ). These are fairly similar results compared with our study, taking into account that our results showed an even lower degree of underestimation (mean difference 0·4 cm). However, this underestimation may have led to the non-significant finding between the BSDS and change in WC in our study.
Methodological considerations
The strengths of our data include high participation rate (82 %) and a population-based sampling. Because we had extensive data from the baseline, we were able to explore and then adjust the analyses for relevant variables. We had trained and experienced study nurses conducting the anthropometric measurements according to standardised procedures( Reference Tolonen, Koponen and Aromaa 24 ) whose work was monitored during the data collection.
There may have been some selection among those who came to the follow-up. Comparing the baseline characteristics to the whole DILGOM population, those who attended the follow-up where older, less often smokers and physically inactive at their leisure-time, and were more likely to have high education. This limits the generalisability of our results to adult Finns. Considering that those who did not participate had an unhealthier lifestyle, which makes them more likely to gain weight during the follow-up, our results may be an underestimation of the true association between the BSDS and weight change. However, taking account that we do not know about the possible changes in lifestyle that these participants have made during the follow-up, estimating the effect of selection bias to our results is at best speculative. It should also be pointed out that non-participation is a problem concerning all health surveys, thus our study is not unique in this sense.
Regarding weight and height measures, we did not define the validation sample of these measures similarly to WC, but we were able to compare the difference between height and weight reported on the health questionnaire with the ones measured by the study nurse. We do not know if the participants actually measured their weight before filling in the questionnaire. Thus, some participants may have reported values that they measured several weeks, months or even years ago. Considering the level of agreement between measured weight and self-reported weight, most of the participants had to have measured their anthropometrics quite recently.
Using a validated FFQ to assess baseline as well as changes in dietary habits is also a strength of our study( Reference Männistö, Virtanen and Mikkonen 20 , Reference Kaartinen, Tapanainen and Valsta 21 ). The same food composition database and nutrient intake calculation software were also used. Validation studies have revealed that our questionnaire has a good ability to rank subjects according to their relative nutrient and food intakes( Reference Männistö, Virtanen and Mikkonen 20 , Reference Kaartinen, Tapanainen and Valsta 21 , Reference Paalanen, Männistö and Virtanen 47 ). It also provides a fairly good reproducibility. The BSDS has been proven to be a valid measure of participants’ adherence to the healthy Nordic diet( Reference Kanerva, Kaartinen and Schwab 25 ), and it has been used in many epidemiological studies thus far in both adult and paediatric populations over the last 5 years( Reference Kanerva, Kaartinen and Rissanen 13 , Reference Männikkö, Komulainen and Schwab 48 – Reference Perälä, von Bonsdorff and Männistö 50 ).
As a limitation, nutrition research, including the FFQ, generally involves overestimation of healthy and underestimation of unhealthy food consumption. Health conscious people, women and overweight participants are especially prone to misreporting( Reference Paalanen, Männistö and Virtanen 47 ). This may have led to some misclassifications in the BSDS fifths or dragged the BSDS cut-off points higher, which may have weakened the observed associations. The BSDS also has its weaknesses. Although a predefined score, such as the BSDS, better enables the capture of cumulative dietary exposure, some confounding due to correlations in the intake of various dietary factors still remains.
Conclusions
Our study showed that high initial adherence to the healthy Nordic diet, as well as increase in the adherence, may promote long-term weight maintenance. We also found that self-reported/measured anthropometrics have high agreement with nurse-measured values among the adult population which adds the credibility of our results. Further longitudinal studies among Nordic populations are needed to confirm our results.
Acknowledgements
This study was funded by the Finnish Foundation for Cardiovascular Research (N. K.). The DILGOM 2014 study was funded by Juho Vainio Foundation (P. J.).
P. J., S. M., A. H., N. E. K. and N. K. participated in planning and conducting the baseline and follow-up studies. M. M. participated in data clearance and checking. K. H. and N. K. analysed the data. N. K. wrote the manuscript and had the primary responsibility of its final content. All authors have critically revised the manuscript for important intellectual content and approved the final version.
The authors declare that there are no conflicts of interest.
Supplementary material
For supplementary material/s referred to in this article, please visit https://doi.org/10.1017/S0007114518001344


