


Introduction
The Orchidaceae is one of the most biodiverse plant families, with more than 31,000 species (Plants of the World Online, 2024) distributed globally across a wide diversity of ecosystems. Nonetheless, orchids are amongst the most highly threatened plant groups, with complex and specialized life history traits (Fay, Reference Fay2018). The majority (c. 80%) of orchid species are epiphytic (Givnish et al., Reference Givnish, Spalink, Ames, Lyon, Hunter and Zuluaga2016). Whilst species are often confined to particular ecological niches within their tree-hosts (phorophytes; Ventre-Lespiaucq et al., Reference Ventre-Lespiaucq, Delgado, Ospina-Calderón, Otero, Escudero and Sánchez2017), few studies have examined how phorophyte architecture may influence demographic processes (Ramírez-Martínez et al., Reference Ramírez-Martínez, Ticktin and Mondragon2022; Ospina-Calderón et al., Reference Ospina-Calderón, Tremblay, Torres and Flanagan2023).
Orchid life cycles are renowned for very low rates of seedling recruitment and survival, and subsequent low fecundity (Zotz, Reference Zotz1998; Tremblay & Hutchings, Reference Tremblay and Hutchings2003; Mondragón et al., Reference Mondragón, Valverde and Hernández-Apolinar2015). Together with high levels of endemism these traits increase sensitivity to anthropogenic impacts (Heschel et al., Reference Heschel, Sultan, Glover and Sloan2004; Ehrlen et al., Reference Ehrlen, Morris, von Euler and Dahlgren2016), including habitat fragmentation, climate change (Fay, Reference Fay2018; Yudaputra et al., Reference Yudaputra, Munawaroh, Usmadi, Purnomo, Astuti and Puspitaningtyas2024) and unsustainable harvesting for trade (Ticktin et al., Reference Ticktin, Mondragón, Lopez-Toledo, Dutra-Elliott, Aguirre-León and Hernández-Apolinar2020). Understanding how these traits affect demographic processes and population persistence is essential for conservation management.
Colombia harbours the greatest diversity of orchids, with more than 4,600 species (ColPlanta, 2026), of which c. 37% are endemic (Ministerio de Ambiente y Desarrollo Sostenible (MADS) & Universidad Nacional de Colombia (UNAL), 2015). Yet, only c. 10% have been evaluated for their conservation status, mostly from geographical distribution data, with > 54% classified as threatened (MADS, 2024). Cattleya quadricolor B.S.Williams is a highly endemic species, restricted to c. 1,900 km2 in the upper Cauca River inter-Andean valley in south-west Colombia, and has been categorized as Endangered (EN) in national evaluations (Calderón-Sáenz, Reference Calderón-Sáenz2007). It inhabits a tropical dry forest ecosystem between 900 and 1,500 m altitude (Corporación Autónoma Regional del Valle del Cauca, 2011), an ecosystem that is amongst the most transformed globally (Siyum, Reference Siyum2020). In Colombia < 8% of the original extent remains (Pizano & García, Reference Pizano and García2014) and in the Cauca River valley only 3% of original habitat exists, in small fragments averaging just 6 ha (Alcázar et al., Reference Alcázar, Avella, Norden, García, García, Castellanos and González-M.2021). Despite national protection (MADS, 2024) and the inclusion of all orchids in CITES Appendix II (CITES, 2025), remaining populations of C. quadricolor face ongoing habitat loss and illegal collection of adults (Flanagan et al., Reference Flanagan, Mosquera-Espinosa, Ospina-Calderón, Torres-Torres, Ramirez-Bejarano and Ñuscua2022).
For threatened species with few subpopulations, demographic approaches are essential to identify the processes, such as low fecundity or high adult mortality, that elevate extinction risk, so that conservation actions can be targeted where they are most needed. Population projection matrices provide a framework to quantify life-stage-specific vital rates at the subpopulation level, describing how individuals transition amongst stages of growth, permanence within a life stage, mortality and fecundity (Caswell, Reference Caswell2001; Tremblay et al., Reference Tremblay, Raventos and Ackerman2015; Stott, Reference Stott2016). They also enable estimation of long-term population growth rates (λ), which are directly relevant to the IUCN Red List evaluations (IUCN, 2012).
Asymptotic analysis of population projection matrices provides the fundamental description of long-term deterministic population change (neutral, positive or negative) under constant demographic rates, density independence and a time-invariant environment. Populations grow or decline exponentially and the distribution of individuals amongst life stages eventually converges to a stable stage distribution. From this, the population growth rate (λ) and elasticities reveal the stages most influential for long-term persistence (Ellis & Crone, Reference Ellis and Crone2013; Raventós et al., Reference Raventós, García-González, Riverón-Giró and Damon2018). Convergence time, the number of generations needed to reach the stable stage distribution, and its related measure, the damping ratio, indicate how quickly populations recover from disturbances or altered stage structures (Caswell, Reference Caswell2001).
Real populations, however, rarely experience stable conditions, being subject to environmental and demographic stochasticity (Stott et al., Reference Stott, Townley and Hodgson2011). Transient analyses capture short- to medium-term dynamics, describing population responses to disturbance, stochasticity or deviations from stable stage structure. These can produce short-term increases (amplification) or decreases (attenuation) in population density, depending on the initial stage distribution relative to the stable distribution (Stott et al., Reference Stott, Townley and Hodgson2011; McDonald et al., Reference McDonald, Stott, Townley and Hodgson2016). Such dynamics often dominate real-world outcomes, particularly for small, disturbed or reintroduced populations. Since conservation management typically operates over finite timeframes, ignoring transient responses risks underestimating extinction risk or implementing misguided interventions (Stott et al., Reference Stott, Townley and Hodgson2011; Ellis & Crone, Reference Ellis and Crone2013; Tremblay et al., Reference Tremblay, Raventos and Ackerman2015). Integrating both perspectives provides stronger guidance: asymptotic analyses reveal the stages most critical for long-term persistence whilst transient analyses identify those most relevant to immediate management goals (Stott et al., Reference Stott, Townley and Hodgson2011; Ellis & Crone, Reference Ellis and Crone2013; Raventós et al., Reference Raventós, González, Mújica and Bonet2015; Tremblay et al., Reference Tremblay, Raventos and Ackerman2015).
Given the threatened status of the highly endemic epiphytic orchid species C. quadricolor, this study aimed to evaluate the population status and dynamics of remnant subpopulations in tropical dry forest fragments across its range. We conducted a structural analysis of the phorophytes and analysed asymptotic and transient dynamics to predict population persistence over the next 50 years. Ultimately, our goal was to identify the demographic parameters, such as survival, growth or fecundity, that most strongly influence persistence, providing guidance on which life stages or subpopulations should be prioritized for conservation management. Whilst focused on a single threatened orchid, this study illustrates how integrating asymptotic and transient analyses can inform broader conservation challenges in other plant taxa.
Study area
This study was undertaken in the departments of Valle del Cauca and Quindío in the upper watershed of the Cauca River valley, between the Western and Central Andean cordilleras in south-west Colombia. We located subpopulations of C. quadricolor in the transition between the floodplain of the Cauca River and the Andean foothills at altitudes of 900–1,400 m, with annual precipitation of 1,250–1,750 mm (Table 1). This region comprises small remnants of the original tropical dry forest ecosystem (Alcázar et al., Reference Alcázar, Avella, Norden, García, García, Castellanos and González-M.2021) in a mosaic landscape with cattle ranches and intensive sugar cane cultivation (Fig. 1).
Sampling localities for Cattleya quadricolor in the Cauca River valley, south-west Colombia, and ecosystem types according to Pizano & García (Reference Pizano and García2014) and Vreugdenhil et al. (Reference Vreugdenhil, Terborgh, Cleef, Sinitsyn, Boere, Archaga and Prins2003).

Study localities of subpopulations of Cattleya quadricolor in the Cauca River valley, south-west Colombia.

Methods
During 2018–2022, we actively searched for and censused natural populations of C. quadricolor (Plate 1), identifying eight subpopulations distributed over most of the species’ range: Bolívar, Caicedonia, Carreteable, Obando, Ocaso, Toro, Tuluá and Zarzal (Fig. 1; Table 1). Those subpopulations located in later years were subject to more limited evaluation.
Adult individual of Cattleya quadricolor in situ. Photo: Gabriela Torres.

We undertook population censuses during September–November, corresponding to the period of greatest precipitation in the region and the peak of flowering for this species. We maximized spatial coverage of field surveys within each forest fragment to locate as many plants as possible. As this species tends to form masses of pseudobulbs on a single branch, we defined a sampling unit as a plant separated by at least 1 m from its nearest neighbour. We photographed plants at higher vertical positions in each phorophyte tree using a Nikon d3100 camera with zoom lens (Nikon Corporation, Tokyo, Japan) for subsequent analysis. We gave each individual plant a unique identifier for monitoring across multiple censuses.
For each phorophyte of C. quadricolor, we recorded dendrometric parameters as follows: circumference at breast height, from which the diameter at breast height (DBH) was calculated; tree canopy diameter; total height of the phorophyte and height of the orchid in the tree measured with a Bosch laser distance meter GLM 40 (measuring accuracy ± 1.5 mm; Robert Bosch Power Tools GmbH, Germany). We also recorded the coordinates for each sampling unit using a handheld GPS.
Data analysis
We evaluated phorophyte dendrometric structure and vertical distribution of units of C. quadricolor across all eight subpopulations using a multivariate cluster analysis (Zelterman, Reference Zelterman2015). Although 293 phorophytes were recorded in this study, we could not record some dendrometric measurements because the phorophyte trees were difficult to access. We included 173 phorophytes in this analysis across the eight subpopulations: Bolívar 41 phorophytes; Caicedonia 13; Carreteable 17; Obando 9; Ocaso 18; Toro 11; Tuluá 55; and Zarzal 9. These trees hosted 68% (578) of the total number of orchids recorded.
We determined population structure and density of C. quadricolor in all eight subpopulations for 848 censused sampling units. We categorized individuals into four life stages: seedling, individuals lacking a pseudobulb; juveniles, individuals with pseudobulbs but lacking evidence of having attained reproductive maturity; adult stage 1, individuals with 4–40 pseudobulbs and evidence of reproductive structures, either a dry inflorescence perduring from a previous season or contemporary flowers or fruits; and adult stage 2, individuals with 41–200 pseudobulbs and evidence of reproductive structures (Torres-Torres et al., Reference Torres Torres2018). Adult stages 1 and 2 are those that contribute to the fecundity rate in the life cycle of the species (Fig. 2).
Life-cycle diagram of C. quadricolor constructed using hypothetical values derived from annual stage-transition probability matrices developed for the Tuluá subpopulation. Transition probabilities represent the mean value for each life-cycle transition calculated across the available matrices for this subpopulation, which provides the most complete demographic dataset for the species. Arrows indicate the demographic processes included in the model: growth (G), fecundity (F), permanence or stasis (P), and retrogression (R).

We also calculated orchid density in each forest fragment (individuals/ha) and orchid density in the phorophytes (the mean number of orchids per occupied phorophyte in the fragment; individuals/P). We calculated fruit set as the proportion of fruits per total number of flowers for adult stages 1 and 2 in each subpopulation.
For four subpopulations, Bolívar, Cacedonia, Toro and Zarzal, we constructed a single population projection matrix per subpopulation from data from annual censuses undertaken during 2020–2022 (three sampling periods). For Tuluá, census data were available from 2018–2022, from which we constructed three matrices and obtained a single averaged matrix. For the three remaining subpopulations, we conducted only a single subpopulation census: in Carreteable and Ocaso logistical difficulties hindered a second census, and in Obando in the second flowering season, in 2021, heavy rain caused 90% of the previously censused plants to fall into the river.
The nature of the life cycle of orchid species meant that not all transitions between life cycle stages were recorded in all populations (Tremblay & Hutchings, Reference Tremblay and Hutchings2003; Ospina-Calderón et al., Reference Ospina-Calderón, Tremblay, Torres and Flanagan2023). Therefore, we followed the methodology of Tremblay et al. (Reference Tremblay, Tyre, Pérez and Ackerman2021) to generate the initial population projection matrices. For this, we calculated an a priori matrix using data from the Tuluá subpopulation, as this was most extensively censused (four censuses) and did not present transitions gaps (Supplementary Table 1). We applied a Bayesian model analysis in the software raretrans (Tremblay et al., Reference Tremblay, Tyre, Pérez and Ackerman2019) in R 4.2.3 (R Core Team, 2019), with a priorweight of 0.5. We calculated the mean matrix over 15,000 simulations to obtain probabilities of permanence, transition and fertility rates for each time period with a 95% confidence limit.
We calculated the asymptotic dynamics in the software Popdemo (Stott et al., Reference Stott, Hodgson, Townley and Ellner2025) in R to describe the stable state for life stage distribution. We calculated the elasticity matrices for each subpopulation to determine the effect of alterations of the matrix elements (permanence, transition, fecundity) on the population’s rate of increase (García-González et al., Reference García-González, Damon, Raventós, Riverón-Giró, Mújica and Solís-Montero2017) and the finite rate of population growth, λ (Caswell, Reference Caswell2001). To determine the transitory subpopulation dynamics, we calculated convergence time, a measure of how quickly a population returns to stability after a disturbance; damping ratio, a measure of how quickly a population decays following disturbance; and population inertia, the response capacity following any disturbance or perturbation. Note that bounds on population inertia are the maximum amplification ${O_{\bar \rho {\rm{max}}}}$
and maximum attenuation
${O_{\bar \rho {\rm{max}}}}$
and maximum attenuation ${O^{\underline \rho \;min}}$
(Stott et al., Reference Stott, Franco, Carslake, Townley and Hodgson2010).
${O^{\underline \rho \;min}}$
(Stott et al., Reference Stott, Franco, Carslake, Townley and Hodgson2010).
Evaluation of conservation status
Subsequent to the analyses we assessed the conservation risk status of C. quadricolor following IUCN Guidelines for Using the IUCN Red List Categories and Criteria, version 15.1 (IUCN Standards and Petitions Committee, 2023), focusing on criterion C, which is directly informed by population demographic analyses.
Results
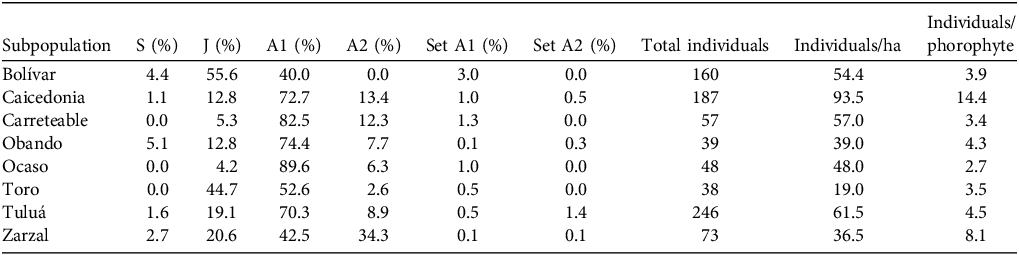
We located eight subpopulations of C. quadricolor across its range. The habitat fragments in which these orchid populations were found varied in size from 1 to 52 ha (Table 1). We recorded and uniquely identified 848 orchids growing on 293 phorophyte trees in our initial censuses. The number of individuals per subpopulation varied from 38 to 246 (Table 2).
Demographic structure and reproductive parameters of C. quadricolor in the initial census of each subpopulation. The table shows the percentage of individuals in each life stage: seedling (S), juvenile (J), adult stage 1 (A1) and adult stage 2 (A2); percentage fruit set in adult stages 1 (Set A1) and 2 (Set A2); total number of individuals in the subpopulation; and population density per ha and per phorophyte.

Phorophyte characteristics
We identified 22 tree species in 13 families as phorophytes across the eight subpopulations (Supplementary Table 2). The diversity of phorophyte species varied amongst survey sites from two (Caicedonia) to 14 (Tuluá); the mean was 6.0 ± SD 4.1 species per site. The most common phorophyte species were Anacardium excelsum and Ficus insipida, present in six and three populations, respectively.
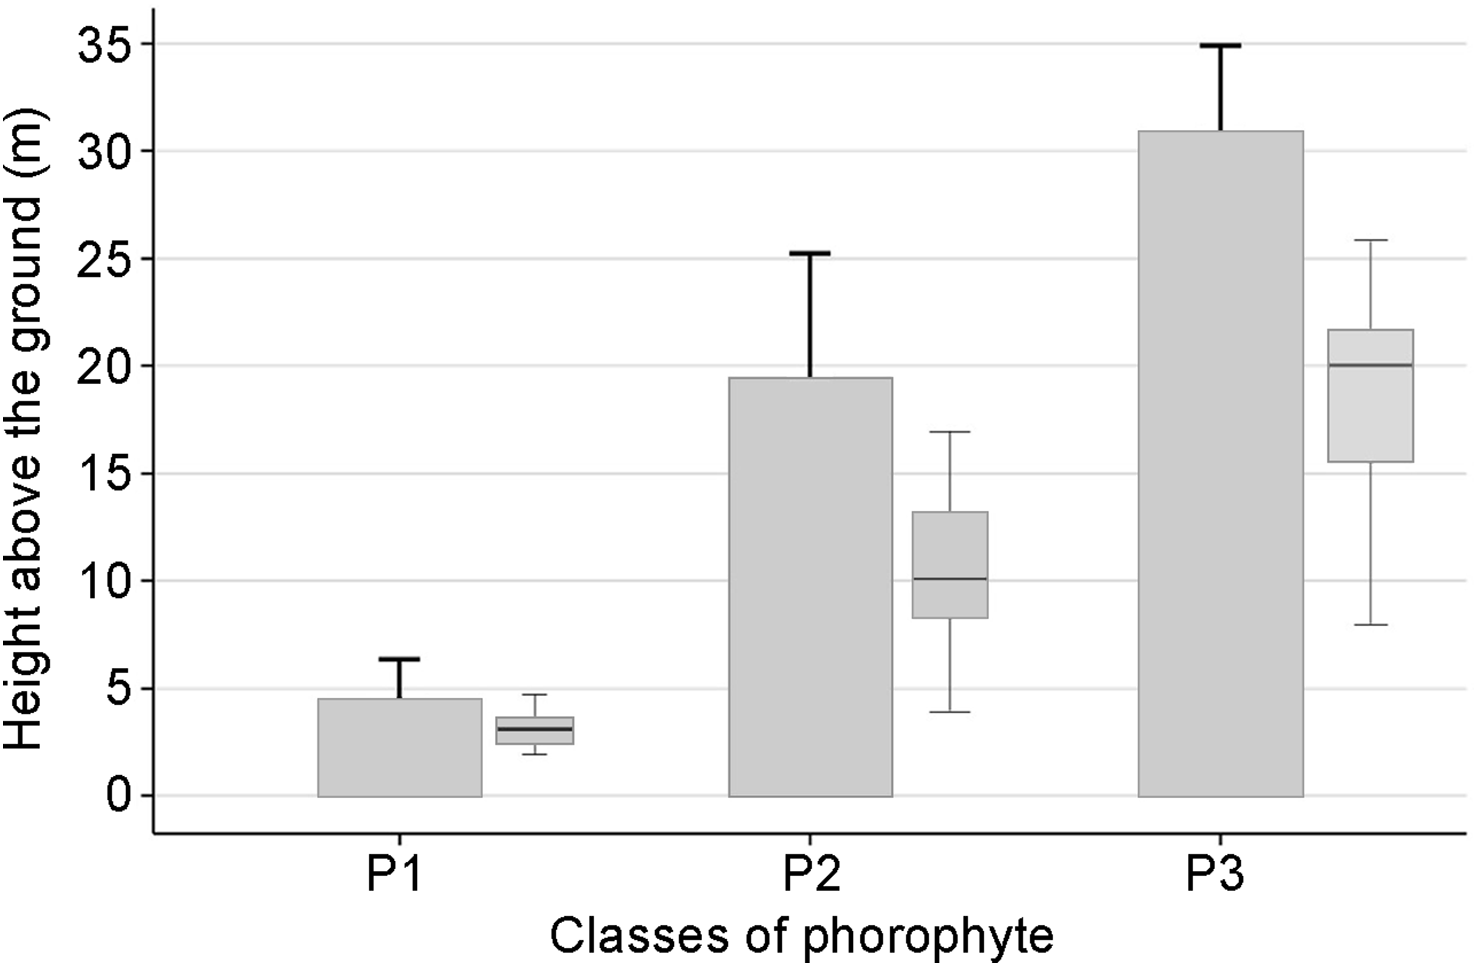
The multivariate cluster analysis of dendrometric values revealed significant (P < 0.05) structuring of phorophytes into three distinct classes based on size (Fig. 3; Supplementary Table 3). Class P1 were the smallest trees: mean tree height 4.50 ± SD 1.86 m; mean height of orchid plants 2.50 ± SD 1.41 m; DBH 0.47 ± SD 0.24 m; canopy diameter (CD) 2.20 ± SD 1.27 m. Trees in this class were mostly Erythroxylum ulei. Class P2 phorophytes were of intermediate size: mean tree height 19.50 ± SD 5.30 m; mean height of orchid plants 10.0 ± SD 4.1 m; DBH 0.79 ± SD 0.46 m; CD 9.51 ± SD 3.38 m. Finally, Class P3 phorophytes were the largest trees: mean tree height 31.00 ± SD 3.98 m; mean height of orchid plants 20.00 ± SD 5.19 m; DBH 1.20 ± SD 0.44 m; CD 13.30 ± SD 4.39 m. This class included species such as Anacardium excelsum and Ficus insipida. The orchid subpopulations at Caicedonia, Toro and Zarzal were associated with the greatest proportion of Class P3 phorophytes and a greater than average height of orchid plant. In contrast, the subpopulation in Bolívar in the foothills of the western Andean Cordillera associated exclusively with phorophytes in Class P1, principally Erythroxylum ulei (Supplementary Table 2).
Phorophyte height (bars) and the height of the orchid in the phorophytes (boxplot) for each phorophyte class (P1, P2, P3) for C. quadricolor across all populations. In the bar plot, bars represent the mean and error bars the maximum observed phorophyte height. Box plots represent orchid height above ground: boxes span the first (Q1) to third (Q3) quartiles (i.e. the central 50% of the data), the horizontal line shows the median, and whiskers indicate the minimum and maximum values.

Demographic structure and reproduction
The demographic structure and reproductive parameters of the orchids varied across populations (Table 2). The density of orchid individuals in each subpopulation varied between 1 (Obando) and 187 (Caicedonia) individuals per ha, and mean orchid density in the phorophyte varied between 2.7 (Ocaso) and 14.4 individuals per phorophyte (Caicedonia). The proportion of mature individuals (adult stages 1 and 2) was > 75%, except in Toro and Bolívar, where we recorded a higher proportion of juveniles. The proportion of seedlings varied between 3% (Tuluá) and 18% (Toro). We observed fruit set in both adult stages at ≤ 3% across all subpopulations.
Asymptotic population dynamics
We constructed population projection matrices for the five subpopulations with data from two or more annual censuses: Bolívar, Caicedonia, Toro, Tuluá and Zarzal. In all cases, the probability of permanence in the same stage was higher than that of transitioning to a different stage (Supplementary Table 4). The stable stage distributions showed strong heterogeneity in recruitment and survival dynamics amongst subpopulations. Some subpopulations were dominated by mature individuals and others sustained by early life stages, implying contrasting population trajectories and conservation needs (Supplementary Table 5). In Bolívar, the population was strongly skewed towards adult stage 2 (expected proportion of individuals 0.886), with very low representation of earlier stages. In contrast, Tuluá showed the opposite pattern, dominated by seedlings (0.414) and juveniles (0.166), whilst adults accounted for less than half of the distribution. Caicedonia and Toro exhibited intermediate profiles, with a predominance of adult stage 1 individuals (0.658 and 0.578, respectively), alongside some juveniles (0.187 and 0.343, respectively). There was a more balanced distribution across stages in Zarzal, although still with relatively high proportions of adults.
Elasticity matrices further showed that population dynamics of C. quadricolor are primarily driven by adult permanence represented by adult stage 2 in Bolívar and adult stage 1 in the remaining four populations (Supplementary Table 6). Seedling and juvenile transitions (Growth, G) had lower elasticities. Fecundity (F) contributed little overall, although its relative importance varied amongst sites. These contrasts highlight differences in demographic dependence on adult survival versus recruitment across subpopulations. Taken together, the two analyses underscore the central role of adult survival in maintaining four of the five populations, whilst in Tuluá the results instead point to the importance of sustaining recruitment through seedling establishment and pollination success.
Projected population growth rates (λ) over 50 years, estimated from the asymptotic analysis, indicated declining trajectories for all five subpopulations of C. quadricolor, with values ranging from 0.770 in Zarzal to 0.872 in Bolívar (Table 3). Bayesian mean estimates were slightly higher in most cases but generally confirmed the downward trend, with means from 0.779 (Zarzal) to 0.958 (Bolívar). Credible intervals revealed considerable uncertainty, particularly in Caicedonia and Toro, where lower bounds (0.753 and 0.698, respectively) suggested a strong risk of decline. In Tuluá, the asymptotic and Bayesian mean λ were nearly identical (0.865), indicating that the current demographic structure is already close to the stable stage distribution projected by the model. Overall, Bolívar appeared the least vulnerable, whereas Zarzal showed the lowest projected growth and highest extinction risk, highlighting subpopulation-specific conservation priorities.
Projected population growth rates (λ) over 50 years for five subpopulations of C. quadricolor, estimated from the asymptotic analysis (λ asymptotic; Caswell, Reference Caswell2001) and the Bayesian analysis (λ mean, λ lower, λ upper; Tremblay & MCarthy, Reference Tremblay and McCarthy2014).

Transient dynamics analysis
Transient dynamics varied across subpopulations (Table 4). Bolívar exhibited the longest convergence time (73 years to approach the stable stage distribution), and lowest damping ratio (1.154), or rate of return to stable structure after disturbance, indicating a population strongly dominated by adults and a slow return to stable stage structure. In contrast, Caicedonia and Toro had shorter convergence times (11–13 years) and higher damping ratios (1.427–1.525), reflecting faster recovery after disturbance. Population inertia highlighted short-term deviations from stable growth: Tuluá exhibited the highest inertia (1.492), consistent with substantial early-stage representation and potential for short-term amplification, whilst Bolívar showed minimal inertia (0.021) and was dominated by adults.
Transient dynamics indices for five subpopulations of C. quadricolor. The table shows the convergence time (number of years to approach the stable stage distribution), damping ratio (rate of return to stable structure after disturbance) and inertia (magnitude of short-term deviation from stable growth).

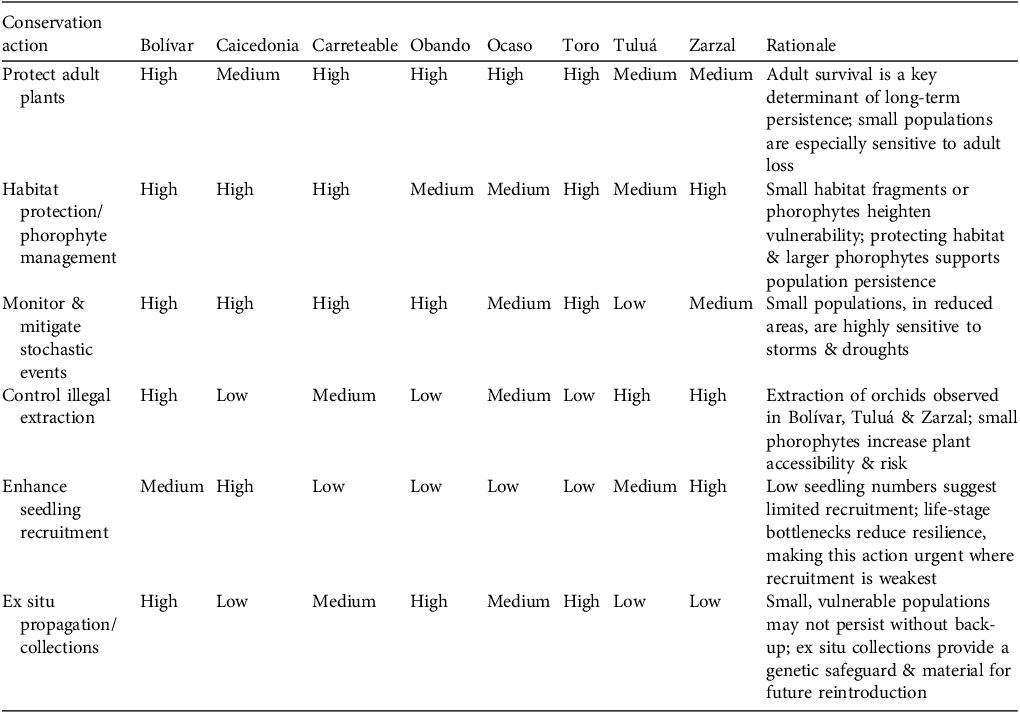
Priority matrix for targeted conservation actions in C. quadricolor subpopulations. Priority is ranked as high, medium or low per action based on vulnerability, population size and population projection matrices/transient demographic insights.

Variation in population density was projected over 50 years for each of the life stages in the five subpopulations (Fig. 4). The subpopulation densities at Caicedonia, Tuluá and Zarzal were greater than or equal to the stable state for life stage distribution in three life stages. In Caicedonia and Zarzal maximum attenuation ${O^{\underline \rho \;min}}$
was achieved for the adult stage 2, and at Tuluá for the seedling stage. In contrast, the subpopulation densities of Bolívar and Toro were inferior to the stable state for life stage distribution in three life stages, and showed a high probability of decline over only 15 years. In Bolívar, the maximum amplification,
${O^{\underline \rho \;min}}$
was achieved for the adult stage 2, and at Tuluá for the seedling stage. In contrast, the subpopulation densities of Bolívar and Toro were inferior to the stable state for life stage distribution in three life stages, and showed a high probability of decline over only 15 years. In Bolívar, the maximum amplification, ${O_{\bar \rho {\rm{max}}}}$
was predicted for adult stage 2, and
${O_{\bar \rho {\rm{max}}}}$
was predicted for adult stage 2, and ${O^{\underline \rho \;min}}$
for seedling, juvenile and adult stage 1. In Toro,
${O^{\underline \rho \;min}}$
for seedling, juvenile and adult stage 1. In Toro, ${O_{\bar \rho {\rm{max}}}}$
was predicted in adult stage 1 and
${O_{\bar \rho {\rm{max}}}}$
was predicted in adult stage 1 and ${O^{\underline \rho \;min}}$
in adult stage 2.
${O^{\underline \rho \;min}}$
in adult stage 2.
Transient dynamics of life stages (seedling, juvenile, adult stage 1, adult stage 2) in five subpopulations of C. quadricolor: (a) Bolívar, (b) Caicedonia, (c) Toro, (d) Tuluá, (e) Zarzal. The y-axis shows relative population density (ρ), defined as projected density relative to the density at the stable stage distribution (SSD); values are therefore dimensionless. The horizontal line indicates the SSD. Transient indices shown are reactivity ( ${\rm{\bar \rho}}$
), maximum amplification (
${\rm{\bar \rho}}$
), maximum amplification ( ${{{\rm{\bar \rho}}_{\rm{max}}}}$
), maximum attenuation (
${{{\rm{\bar \rho}}_{\rm{max}}}}$
), maximum attenuation ( ${{\rm{\rho}}_{\rm{min}}}$
), amplified inertia (
${{\rm{\rho}}_{\rm{min}}}$
), amplified inertia ( ${\rm{\bar \rho}}$
∞) and attenuated inertia (ρ∞).
${\rm{\bar \rho}}$
∞) and attenuated inertia (ρ∞).

Based on the results of our demographic study, we determined the conservation status (IUCN, 2023) of C. quadricolor as Endangered based on criteria C2a(i), i.e. with < 2,500 mature individuals (C) and with a projected continuing decline in numbers of mature individuals (2; Table 3) and < 250 mature individuals in each subpopulation (a(i); Table 2), supporting the previous evaluation.
Discussion
To prevent species extinction, we need to safeguard the component populations that make up a species’ range. Demographic studies using population projection matrices, integrating asymptotic and transient analyses, offer a powerful tool to identify the life stages and vital rates most critical for population persistence (Caswell, Reference Caswell2001; Stott et al., Reference Stott, Townley and Hodgson2011; Tremblay et al., Reference Tremblay, Raventos and Ackerman2015), which can be used to more effectively target conservation actions. We applied this framework to C. quadricolor, an endemic orchid of Colombia’s tropical dry forests, to identify which demographic parameters most strongly influence population persistence and to guide prioritization of life stages or subpopulations for conservation management. For epiphytic species, understanding the influence of phorophyte characteristics on demographic outcomes is also crucial. Our study illustrates the broader utility of population projection matrices for other orchids and plants with complex, stage-structured life histories, demonstrating how demographic models can inform both species-level conservation and site-specific management (Mondragón & Elliott, Reference Mondragón, Elliott, Lowman, Devy and Ganesh2013).
After extensive searching during the project timeframe we found only eight remnant subpopulations of C. quadricolor, which showed marked differences in habitat context (Table 1; Supplementary Tables 2, 3), population size and life stage composition (Table 2). Populations were small, reflecting both the forest fragment area (Table 1) and disturbance history (Alcázar et al., Reference Alcázar, Avella, Norden, García, García, Castellanos and González-M.2021). The small number of individuals per subpopulation, combined with projected population declines, supports a categorization of Endangered under the IUCN Criterion C (C2a(i); IUCN, 2023). In fact, several subpopulations had fewer than 50 individuals, making them highly sensitive to environmental stochasticity, as evidenced by a storm nearly extirpating the Obando population.
The demographic structure and low fruit set observed are similar to that seen in populations of other tropical orchid species (Tremblay et al., Reference Tremblay, Raventos and Ackerman2015; Lemus et al., Reference Lemus, Ávila-Díaz and Diego2021; Ospina-Calderón et al., Reference Ospina-Calderón, Tremblay, Torres and Flanagan2023). Most subpopulations were dominated by adults (stages 1 and 2), with few seedlings and low fruit set (Table 2), highlighting constraints on natural population replenishment. These stable stage distributions were reflected in population growth rates (λ) less than 1 (Table 3), indicating projected declines in population size over the next 50 years. Cattleya quadricolor is pollinated by Euglossine bees (orchid bees; Hincapie et al., Reference Hincapie, Ospina-Calderón, García and Aguirre-Vallejo2024), potentially via food-deceptive pollination, contributing to low fruit set (Caballero-Villalobos et al., Reference Caballero-Villalobos, Silva-Arias, Buzatto, Nervo and Singer2017). Euglossine bee abundance is affected by forest fragment size (Brosi, Reference Brosi2009) but further study is needed to determine how fragment size as well as phorophyte composition and architecture (Ramos et al., Reference Ramos, Romero and Gálvez2022) may impact pollinator abundance and consequently demographic parameters in C. quadricolor.
Bolívar was notably distinct to the other populations, with a higher juvenile fraction alongside few mature adults, indicating delayed or reduced reproductive output, potentially limiting fecundity and long-term population viability. Although λ was largest in this subpopulation, it remained below 1, signalling projected population decline. This pattern may reflect environmental constraints on plant growth (Francisco et al., Reference Francisco, Couto, Garbin, Misaki and Ruiz-Miranda2021), as Bolívar experiences drier conditions than other sites and has a distinctive phorophyte structure dominated by smaller host trees, primarily Erythroxylum ulei (Table 1; Supplementary Tables 2, 3). The smaller branches of this phorophyte species increase the risk of breakage for larger epiphytes (Petter et al., Reference Petter, Zotz, Kreft and Cabral2021). In addition, illegal extraction of the more accessible adult plants of C. quadricolor has been observed in the locality (Flanagan et al., Reference Flanagan, Mosquera-Espinosa, Ospina-Calderón, Torres-Torres, Ramirez-Bejarano and Ñuscua2022), further reducing the numbers of adults. Whilst causality cannot be fully disentangled here, our findings underscore the importance of habitat context when assessing population dynamics. More broadly, variation in life-stage composition and environmental context probably drives the differences we observed in asymptotic and transient population projection matrix analyses, shaping both long- and short-term subpopulation trajectories.
A primary factor underlying low projected growth rates across C. quadricolor subpopulations was the high elasticity of permanence in adult stages (Supplementary Table 6). This reflected a life-history strategy common in epiphytic plants, where adult survival provides a buffer against environmental stress such as drought (Winkler et al., Reference Winkler, Hülber and Hietz2007; Mondragón et al., Reference Mondragón, Valverde and Hernández-Apolinar2015; Crain et al., Reference Crain, Tremblay and Ferguson2019). Nonetheless, fecundity and life-stage transitions remain essential for population growth, and their low values highlight the vulnerability of these subpopulations to recruitment failure.
Whilst all subpopulations showed λ < 1, the transient analyses revealed differences in how quickly populations approach their stable stage distribution and their capacity to buffer short-term perturbations. Caicedonia, Tuluá and Zarzal, dominated by adult stage 1, exhibited low convergence times, a high damping ratio and high population inertia (Table 4), indicating rapid stabilization towards their expected stage distribution and a greater subpopulation tolerance to stress (Salguero-Gómez et al., Reference Salguero-Gómez, Jones, Jongejans, Blomberg, Hodgson and Mbeau-Ache2016). However, low seedling representation constrains reactivity, as seen in Tuluá, where transient projections approached the maximum attenuation limit, suggesting that this subpopulation will decline more slowly than predicted by stable growth alone (Mondragón et al., Reference Mondragón, Valverde and Hernández-Apolinar2015).
Bolívar presents a markedly different dynamic. Dominated by juveniles and adults stage 1, elasticity was highest in adult stage 2, with a high convergence time but lower damping ratio and population inertia, predicting an exponential decline if adult stages are lost. Here, transient analyses highlighted the limited short-term resilience of this subpopulation, a pattern observed in other neotropical orchids such as Oncidium poikilostalix, where any adult-stage disturbance triggers rapid decline (Raventós et al., Reference Raventós, García-González, Riverón-Giró and Damon2018). The Toro population, whilst having a more favourable demographic structure than Bolívar, showed low maximum amplification values as a result of its small population size, indicating limited capacity to rebound from declines and higher vulnerability, analogous to Bolívar.
Whilst our IUCN Red List evaluation categorized C. quadricolor as Endangered, this species-level assessment does not indicate which subpopulations require the most urgent attention. Elasticity analyses confirmed that adult survival is the primary driver of population persistence across most subpopulations, whereas seedling and juvenile transitions contribute minimally. Transient metrics revealed subpopulation-specific short-term responsiveness and buffering capacity, reflecting differences in recruitment and stage structure that influence short-term dynamics. Together, these analyses highlight how stage composition and vital rates shape both long-term growth potential and short-term dynamics, providing essential information to guide targeted conservation actions.
All subpopulations of C. quadricolor are projected to decline, indicating the need for urgent, population-wide conservation action. In general, landscape management actions should expand forest fragments and enhance connectivity, thereby supporting genetic diversity and the ecological community on which the orchid depends, including phorophytes, pollinators and mycorrhizal fungi (Fay, Reference Fay2018). We also recommend a programme of ex situ propagation as a safeguard, ensuring material from different localities is maintained separately to preserve genetic diversity and guaranteeing that reintroductions use locally adapted stock.
Nonetheless, effective conservation actions must also be refined at the scale of individual populations. We recommend tailored measures for each subpopulation (Table 5), grounded in observed life-stage distributions, phorophyte analyses, fruit set patterns and asymptotic and transient dynamics derived from population projection matrices. Collectively, these actions will ensure that strategies are evidence-based and targeted to maximize both short- and long-term population persistence.
The Bolívar population is the highest priority for conservation action. Despite its larger population, both phorophyte structure and population projection matrix analyses revealed a juvenile-dominated structure, fewer mature adults and distinctive phorophyte composition, as well as evidence of illegal extraction. This highlights the need for strict protection of adult plants, habitat protection and restoration, and enhanced seedling recruitment. Because of its vulnerability and ecological distinctiveness, Bolívar is also a priority for ex situ actions.
As small, spatially concentrated populations, Carreteable, Obando, Ocaso and Toro are most vulnerable to stochastic environmental events such as storms, as seen in Obando. Carreteable and Ocaso, with a higher proportion of phorophytes in classes P1 and P2, are also more exposed to illegal extraction. As adult survival is the main driver of long-term persistence, strict protection of adults is urgent. Larger phorophyte species support higher orchid densities and for populations in smaller forest fragments and with smaller phorophyte classes, actions should focus on habitat restoration and phorophyte management. We particularly recommend protecting and planting the tree species Anacardium excelsum and Ficus insipida, which offer optimal habitat for this orchid. Ex situ propagation could also provide material for population restoration.
Caicedonia, Tuluá and Zarzal support larger orchid populations but show limited recruitment. In these populations, interventions should aim to enhance seedling establishment, with adult plant protection remaining essential. In Tuluá and Zarzal illegal extraction of plants must also be controlled. And in Caicedonia, with the population concentrated in a very small fragment, habitat protection and restoration is needed.
Effective conservation requires coordination between stakeholders, including the regional environmental authorities (Corporación Autónoma Regional del Valle del Cauca and Corporación Autónoma Regional del Quindío), landowners, local communities and institutions such as botanical gardens. The Juan María Cespedes Botanical Garden (INCIVA) is well placed to develop a circa situm collection for the Tuluá population, whilst the Cali Botanical Garden is developing capacity for ex situ propagation of orchids. We recommend that an integrated conservation initiative (e.g. Flanagan & Mosquera-Espinosa, Reference Flanagan and Mosquera-Espinosa2016) be coordinated within the framework of the Departmental System for Protected Areas (SIDAP) in Colombia, which could also promote environmental education, reduce extraction of wild plants, and support the conservation and restoration of the remaining tropical dry forest fragments and native orchids, including C. quadricolor.
Supplementary material
The supplementary material for this article is available at doi.org/10.1017/S0030605325102512
Author contributions
Conceptualization, study design: all authors; data collection: GTT, NHO-C; data analysis, interpretation: GTT, NSF, NHO-C; writing, revision: all authors.
Acknowledgments
This work presents partial data from a Master’s degree in Biology (GTT) at the Universidad del Valle-Cali, with support from Convenio No. 129–2021 between Corporación Autónoma Regional del Valle del Cauca (CVC) – Pontificia Universidad Javeriana Cali (PUJ); Corporación Autónoma Regional del Quindío (CRQ); Universidad del Quindío; and Juan María Cespedes Botanical Garden. We thank the following for their support at various stages of the project: Fanny Torres Granda, Rodrigo Torres Bermudez, Yuli Marín, Juan Manuel Quintero, Édinson Moreno, Alejandro Torres, Gerardo Hernandez, Anne Ñuscua, Erika Ramirez, Santiago Garcia, Alejandro Castaño, Andrés Felipe Orozco and Sebastián Aguirre.
Conflicts of interest
None.
Ethical standards
No specimens were collected during this study. This research abided by the Oryx guidelines on ethical standards.
Data availability
All relevant data are available in the article and supplementary material.







 Open access

