


Introduction
Publicly funded primary and secondary education is a cornerstone of modern states. Such systems guarantee all children access to certain standards of education (Gingrich and Ansell, Reference Gingrich and Ansell2014). Parents who wish to acquire more education for their children may turn to other options, from private alternatives that substitute for public schools to supplementary programs such as tutoring and college preparatory courses that complement public education (Aurini, Davies and Dierkes, Reference Aurini, Davies and Dierkes2013). To the extent that investment in these substitutes and complements is highly structured by parent socio-economic background, such investments have important social and political implications, because they are thought to play a crucial role in transmitting advantage (and disadvantage) across generations (Kornrich and Furstenberg, Reference Kornrich and Furstenberg2013), and have the potential to undermine support for funding public education systems (Busemeyer and Iversen, Reference Busemeyer and Iversen2014).
In the United States, concerns about the presence of substantial class gaps in parents’ financial investments in children’s education are further reinforced by evidence that these gaps have widened over time (Kornrich and Furstenberg, Reference Kornrich and Furstenberg2013; Kornrich, Reference Kornrich2016). This finding has led some researchers to propose that growth in income inequality in recent decades may be behind such deepening disparities in class-based education investments. Researchers suggest that, in contemporary contexts of higher income inequality and labour market polarization, with job opportunities increasingly concentrated in high- and low-skilled occupations (Autor and Dorn, Reference Autor and Dorn2013; Green and Sand, Reference Green and Sand2015; Goos, Manning and Salomons, Reference Goos, Manning and Salomons2014), parents may feel greater pressure to invest in both substitutes and complements to the public education system to secure additional advantage for their children in labour markets where good jobs are perceived to be increasingly scarce (Grusky, Hall and Markus, Reference Grusky, Hall and Rose Markus2019; Kalil et al., Reference Kalil, Ziol-Guest, Ryan and Markowitz2016; Kornrich and Furstenberg, Reference Kornrich and Furstenberg2013; Lareau, Reference Lareau2003). Reflecting this argument, recent work by Schneider et al. (Reference Schneider, Hastings and LaBriola2018) has documented a relationship between rising income inequality in U.S. states and widening class gaps in parents’ investments in their children, suggesting that upper class parents, in particular, are summoning their greater financial resources to access exclusive opportunities for their children.
Despite the potential social, economic and political significance of class gaps in parents’ financial investments in their children’s education, we lack Canadian research documenting the scale or evolution of such gaps, both over time and in response to higher income inequality. Yet we contend that Canada presents a useful case for examining how hypotheses about class gaps in parent educational investments and their evolution, primarily elaborated in the U.S., apply in other contexts. In particular, in addition to Canada’s lower (but still significant) levels of income inequality as compared with the U.S., differences in the two countries’ education systems—most notably in the degree of stratification in post-secondary education—may induce different behavioural patterns among Canadian and American parents. As compared with the stratified post-secondary education system of the United States, Canada’s much flatter post-secondary education system in all provinces may reduce the competitive pressures parents feel to invest private resources in their children’s education in earlier years. By examining Canada, this study therefore provides insight into whether findings from the U.S., an outlier among high-income countries in terms of levels of income inequality and stratification in its education system, generalize to less extreme contexts.
To analyze class gaps in parent spending on education, we use data from Statistics Canada’s Survey of Household Spending (SHS) for the years 2006–2019.Footnote 1 We focus in particular on how two measures of parent social class—income and education—relate to parents’ financial investments in their children’s pre-postsecondary education. We examine the subnational level, given that primary and secondary education policies and programs are within provincial jurisdiction. We examine, first, how parent income and education relate to pre-postsecondary spending, including overall spending on education, tuition, lessons and other extracurricular activities, and other educational items such as tutoring. Second, we examine how changes in province-level income inequality influence parents’ spending on these categories. Finally, we examine whether spending has increased over time.
We find strong evidence that parents with higher levels of education invest more in their children’s education in Canada, beyond what their incomes would predict, suggesting that more educated parent groups place greater emphasis on educational spending than less educated groups. In contrast, while we also find that spending among higher-income parents increases in line with their higher incomes, we find little evidence that higher-income groups uniquely emphasize education spending as compared with lower-income groups. We suggest this may be because highly educated parents value other benefits of educational attainment, such as the accumulation of cultural capital and status signaling; alternatively, despite Canada’s less stratified postsecondary education system, highly educated parents may be more sensitive to other aspects of competition within the system, such as competition to secure postsecondary spots in the most lucrative fields of study. At the same time, we find limited evidence that parents from higher-income or more educated groups have, since 2006, changed their investment behaviour in response to higher levels of income inequality or over time. An important exception in our findings is for parent spending on lessons and courses; here we see some evidence that parents belonging to high-income groups, and highly educated parents even more so, do increase their spending in response to higher levels of income inequality. We conclude with a discussion of why the Canadian context may yield different findings than recent research focussed on the United States.
Social Class and Education Spending
Parent income, parent education and education spending
Parents seeking to shape their children’s education outside of the public system have two key resources at their disposal: time and money. A number of studies, primarily focussed on the U.S., demonstrate that parents from higher class backgrounds typically invest more of both resources in their children’s education than parents from lower class backgrounds (Cheadle and Amato, Reference Cheadle and Amato2011; Duncan and Murnane, Reference Duncan and Murnane2011; Guryan, Hurst and Kearney, Reference Guryan, Hurst and Kearney2008; Kaushal, Magnuson and Waldfogel, Reference Kaushal, Magnuson, Waldfogel, Duncan and Murnane2011). Class gaps in investment of time and money have been documented among both high-income and highly educated parents, even as the opportunity costs of time investment are often highest among this group of parents (Guryan, Hurst and Kearney, Reference Guryan, Hurst and Kearney2008).
Research examining parents’ spending patterns advances multiple explanations for why parents from higher socio-economic groups are likely to spend more on their children’s education. The most straightforward explanation relates to what we refer to in this article as a direct income effect. Education spending is often assumed to be a normal or superior good—that is, people will want more of it at higher levels of income (Busemeyer and Iversen, Reference Busemeyer and Iversen2014; Epple and Romano, Reference Epple and Romano1996). This explanation suggests that parents with higher class backgrounds—specifically, those with higher incomes—have more money to spend than other parents, and they spend some of it on education, as well as a range of other services such as after school and extracurricular programming; associated activities such as expensive sports and leisure activities; and family vacations.
However, research on the class gradient in parents’ investment in their children argues that the gradient is not simply the consequence of differences in available resources; it is also about fundamental class differences in values and visions of parenting (Bodovski and Farkas, Reference Bodovski and Farkas2008; Carolan and Wasserman, Reference Carolan and Wasserman2015; Lareau, Reference Lareau2003; Potter and Roksa, Reference Potter and Roksa2013). Influential work on “intensive parenting” argues that middle- and upper-class parents (primarily measured on the basis of education and occupation) engage in “concerted cultivation” of their children, actively structuring their education and development (Lareau, Reference Lareau2000, Reference Lareau2003; see also Hays, 1996; Calarco, Reference Calarco2014). Concerted cultivation is thought to include a range of parenting practices such as constantly talking with one’s children and encouraging them to question adult authority (Lareau, 2000); actively enrolling children in competitive after-school organized activities, for example, in arts, sports and music (Friedman, Reference Friedman2013); and paying for private supplementary education, including tutoring, prep courses and other extra lessons (Kaushal, Magnuson and Waldfogel, Reference Kaushal, Magnuson, Waldfogel, Duncan and Murnane2011; Kornrich and Furstenberg, Reference Kornrich and Furstenberg2013; see Park et al., Reference Park, Buchmann, Choi and Merry2016 for a review of the literature on supplementary education). Lower-income and working-class parents, meanwhile, are argued to follow a more hands off “natural growth” approach to parenting (Lareau, Reference Lareau2000).
While research points to multiple factors underpinning parents’ efforts at concerted cultivation, the desire among higher social class parents to gain or maintain a competitive edge in future education and employment opportunities—or, at the very least, avoid downward mobility for their children—is thought to be one key driver of intensive parenting practices. As Friedman, (Reference Friedman2013, 3) argues in reference to parents’ enrolment of children in after-school competitive activities, “…extensive time devoted to competition is driven by parents’ demand for credentials for their children, which they see as a necessary and often sufficient condition for entry into the upper-middle class and the ‘good life’ that accompanies it.”
Existing U.S.-centric research therefore finds strong support for class gradients in parents’ educational investments. Yet, in Canada, there is reason to support both the alternative possibilities that class gaps in educational spending may be as significant or much less substantial than in the U.S. context. In one respect, if future education and employment opportunities are behind intensive parenting, then research on the phenomena—primarily based on U.S. evidence—may have less applicability to the Canadian case. Despite some relevant similarities between the U.S. and Canada (for example, both countries saw significant increases in top-end income growth in the 1980s–2010s, a point we return to below), the broader educational contexts in which parents compete for advantage in both countries—specifically at the level of postsecondary education—are markedly different. Whereas steep hierarchy and status competition among institutions define the U.S. postsecondary education system (Davies and Hammack, Reference Davies and Hammack2005; Trow and Nybom, Reference Trow and Nybom1991), institutions in the Canadian system are strikingly less differentiated (Davies and Zarifa, Reference Davies and Zarifa2012).Footnote 2 In contrast to the extensive U.S. private education system, the vast majority of Canadian universities receive a portion of their funding from governments. This funding is typically governed by norms of institutional parity and equal funding. The result is a much “flatter” postsecondary education system in Canada than in the U.S., where private and public universities are highly differentiated. As well, as Davies and Zarifa (Reference Davies and Zarifa2012: 146) argue, “Canada lacks a set of internationally renowned elite institutions on par with the Ivy League or Oxbridge.”
This difference in the two countries’ postsecondary education systems may induce different patterns of parental decision making in Canada compared with the U.S. Whereas the deeply stratified post-secondary education system in the U.S. is understood to be “the chief sorting mechanism determining ‘winners’ and losers’ within American society” (Aurini, Missaghian and Milian, Reference Aurini, Missaghian and Pizarro Milian2020: 174), attending a “top school” is considered to yield minimal or no social advantage in Canada (Aurini, Missaghian and Milian, Reference Aurini, Missaghian and Pizarro Milian2020; Betts, Ferrall and Finnie, Reference Betts, Ferrall and Finnie2007; Davies and Hammack, Reference Davies and Hammack2005; Davies, Maldonado and Zarifa, Reference Davies, Maldonado and Zarifa2014). Likely further affecting parent spending decisions, the wage premium associated with a university degree over a high school diploma is smaller in Canada as compared with the U.S. (Boudarbat, Lemieux and Riddell, Reference Boudarbat, Lemieux and Craig Riddell2010; Bowlus et al., Reference Bowlus, Gouin-Bonenfant, Liu, Lochner and Park2022; Fortin and Lemieux, Reference Fortin and Lemieux2015). In the absence of a stratified postsecondary education system that induces competition for admission into universities as high up in the hierarchy as possible, and facing less significant university wage premiums, parents may feel substantially less competitive pressure to invest private resources in their children’s education in earlier years (for a similar argument, see Ramey and Ramey, Reference Ramey and Ramey2009).
Alternatively, despite Canada’s less stratified postsecondary education system, substantial class gaps in parent education spending may still exist to the extent that some parents—particularly highly educated but also other upper-class parents—value education for other status or cultural reasons, beyond just its direct association to labour market earnings. Classic work in sociology by Bourdieu and Passeron (Reference Bourdieu and Passeron1990) argues that educational attainment confers cultural capital—a specific set of knowledge, skills, behaviours and credentials that are central to the maintenance and signaling of high social status (see also Lamont and Lareau, Reference Lamont and Lareau1988). Research suggests that those who have greater cultural capital—high socio-economic groups—value it at least in part for its use in social and cultural exclusion (Bourdieu and Passeron, Reference Bourdieu and Passeron1990; Jæger and Breen, Reference Jæger and Breen2016; Jæger and Karlson, Reference Jæger and Karlson2018). In this sense, cultural capital—and education as a way of acquiring and maintaining it—can be thought of as positional goods; that is, goods that are valued for their exclusivity and the social status they confer, not just their intrinsic utility (Goldthorpe, Reference Goldthorpe2014; Hirsch, Reference Hirsch1976; Jæger and Karlson, Reference Jæger and Karlson2018), and whose consumption both prevents others from accessing them and imposes a cost on others for not consuming them (Ahlquist and Ansell, Reference Ahlquist and Ansell2017).
If sensitivity to the significance of education for cultural capital and the maintenance of social status drives parents to invest in their children’s education, we might observe that parents who have higher cultural capital—Bourdieu and Passeron (Reference Bourdieu and Passeron1990) point in particular to highly educated groups—place particular emphasis on educational investments in their children than other parents, and independent of extensive stratification in their postsecondary education system (Davis-Kean, Reference Davis-Kean2005; Hao and Yeung, Reference Hao and Jean Yeung2015). Reflecting this possibility, several studies show that parent education is a strong determinant of postsecondary education participation in Canada, even as compared with parent income, though the latter is also important (Finnie, Wismer and Mueller, Reference Finnie, Wismer and Mueller2015; St-Denis and Renée, Reference St-Denis and Renée2022).
Thus, existing comparative and U.S.-centric research supports alternative hypotheses in the Canadian context. However, accumulating empirical findings on Canadian parents’ broader investments in their children—though they do not include evidence on parents’ spending on their children’s pre-postsecondary education specifically—on balance provide support for the existence of class gaps in education spending in Canada as well. Most notably, research shows significant class gaps in parent investment in tax-deferred registered education savings plans for their children’s postsecondary education, with both parent income and education exerting independent effects on savings (Frenette, Reference Frenette2022; Milligan, Reference Milligan, Beach, Boadway and McInnis2004). Several Canadian studies have also examined time investments in childcare. Wei (Reference Wei2020) finds evidence of a strong educational gradient in parent time investment in childcare between 1986 and 2020, and that all parents increased their time investments in childcare for their children in this periodFootnote 3 (see also Ramey and Ramey, Reference Ramey and Ramey2010). Finally, a few studies have also examined parent financial investments in discrete areas of children’s schooling, again with mixed evidence of class gaps. Some research shows, for example, that Canadian parents with higher education and incomes are more likely to enroll their children in private tutoring and private schools, but they are not attitudinally more in favour of these private alternatives than lower social class parents (Davies and Aurini, Reference Davies and Aurini2011; Davies, Reference Davies2004).
On the basis of the balance of evidence from comparative (though U.S.-centric) research and Canadian findings, we therefore specify the following three initial hypotheses:
H1a: High-income Canadian parents spend more on their children’s education than low-income parents, due to the direct effect of income on education spending.
H1b: Canadian parents belonging to high-income groups spend more on their children’s education than parents belonging to low-income groups, even once accounting for the direct effect of income.
H1c: Canadian parents belonging to highly educated groups spend more on their children’s education than parents belonging to less educated groups, accounting for the effect of income.
Evolution of education spending in the context of higher income inequality and over time
After specifying our initial hypotheses, we also examine whether spending patterns may have changed over time, most notably in response to changing levels of income inequality. An emerging body of research in the U.S. has posited a link between parents’ education investments and growth in income inequality, as high-income and highly educated parents may feel such investments are increasingly necessary to give their children an advantage in increasingly competitive labour markets (Schneider et al., Reference Schneider, Hastings and LaBriola2018).
Beginning with the evidence in favour of a potential relationship between income inequality and Canadian parents’ financial investments in their children, we examine two potential pathways outlined by Schneider et al. (Reference Schneider, Hastings and LaBriola2018). First, spending increases may be the result of a direct income effect, similar to that which we discussed in the previous section, where parents at the top of the income distribution who now have more disposable income spend more of it on education (as well as other goods). Second, higher income inequality may shift the emphasis parents place on education relative to other goods.
The first pathway, the direct income effect pathway, posits that income inequality may influence education spending among upper-class parents because the growth in income inequality observed across advanced industrial countries has primarily been a consequence of rising incomes at the top of the income distribution (Alvaredo et al., Reference Alvaredo, Chancel, Piketty, Saez and Zucman2017). This means that parents higher up the income distribution have experienced larger increases in income than parents further down the distribution. Consequently, we might expect that higher-income parents in higher inequality settings will spend more in general, including on their children’s education (Kornrich and Furstenberg, Reference Kornrich and Furstenberg2013). Indeed, work by Kornrich (Reference Kornrich2016) documents growth in spending on education among top income earners in the U.S., and shows that at least a third of this growth is attributable to top earners having more income to spend.
If inequality triggers increased education spending through a direct income effect pathway, this has several important implications. As before, it implies that it is primarily among high-income parents (and not high-educated parents) that we should see spending increases, since it is this group that increases their disposable income the most at higher levels of income inequality. Second, the direct income effect pathway also implies that rising income inequality should be temporally closely connected to increased spending; that is, when inequality increases in a given year, high-income parents now have more income in their pockets, and they will in turn spend more of that income on education. Thus, education spending closely tracks trends in income inequality. Together, these implications lead to the first in our second set of hypotheses:
H2a: High-income Canadian parents will spend more on their children’s education when income inequality increases, due to the direct effect of income on education spending.
In contrast, the second pathway connects income inequality to education spending among parents with high incomes and education by shifting the emphasis parents place on their children’s education. In this view, economic transformations that have underpinned the growth in income inequality in advanced industrial countries have increased the competitive pressures parents feel to secure advantages for their children in labour markets through education spending. A number of studies have documented labour market employment and wage polarization in high-income countries (Autor, Reference Autor2010; Autor and Dorn, Reference Autor and Dorn2013; Autor, Katz and Kearney, Reference Autor, Katz and Kearney2008; Goos and Manning, Reference Goos and Manning2007). In Canada, there is more evidence of employment than wage polarization,Footnote 4 as employment in both high-skill and low-skill poles grew relative to employment in the middle in the 1980s and 1990s (Green and Sand, Reference Green and Sand2015). This polarization has developed along with increasing dualization of the labour market into primary and secondary sectors, where the primary sector experiences strong job protections and higher wages, while the secondary sector is characterized by short-term employment, little or no prospect of permanent employment or internal promotion and determination of wages by market forces (Emmenegger et al., Reference Emmenegger, Häusermann, Palier and Seeleib-Kaiser2012). As a result of this employment growth at the high-skill/high-wage end, the wage premium associated with a university or college degree relative to a high school degree has also grown in many countries since the 1980s (Autor, Katz and Kearney, Reference Autor, Katz and Kearney2008; Bourbeau, Lefebvre and Merrigan, Reference Bourbeau, Lefebvre and Merrigan2012), thereby increasing the returns on investment in education (Ramey and Ramey, Reference Ramey and Ramey2010).
Scholars theorize that these labour market transformations—and associated perceptions that good jobs are scarce—foster anxiety among upper class parents about “their ability to transmit their socioeconomic advantages to their children,” leading upper-class parents to double down on the resources they dedicate to their children’s education (Schneider et al., Reference Schneider, Hastings and LaBriola2018: 480). Importantly, however, whereas theories that posit a direct income effect link between income inequality and increased education spending among upper class parents imply that higher parent income results in greater spending, theories focussed on changing preferences in the face of labour market anxiety suggest that high social class parents more broadly—that is, higher-income parents, but also more highly educated parents—may feel heightened pressure to increase spending on their children’s education as a means of defending their privileged socio-economic position in the face of intensifying economic pressures.
Even if income inequality does not foster increased economic anxiety among upper class parents, income inequality could also compound class gaps in education spending if spending is a positional good, as previously discussed. As Hirsch (Reference Hirsch1976: 6) notes, the quality of positional goods and services such as education are judged both according to “absolute” or objective measures such as teaching quality, facilities and so on; and a “relative” dimension “in which quality consists of the differential over the educational level attained by others.” The utility derived from the consumption of those goods comes in part from comparisons of their consumption by others. Ahlquist and Ansell (Reference Ahlquist and Ansell2017: 644) note that, unlike private goods for which consumption does not impose costs on others, the acquisition and consumption of positional goods both prevents others from accessing them and imposes a cost on others for not consuming these goods. For example, the attraction of attending prestigious schools or programs is in part because it is a scarce good that others cannot consume; its value diminishes the value of education elsewhere. Higher levels of inequality may induce those at the top to dedicate increasingly more resources toward competing to achieve the highest relative education vis-à-vis others as the top (Shavit and Park, Reference Shavit and Park2016), as parents play a zero-sum game to acquire educational and other scarce goods so as to signal one’s relative position in social and economic hierarchies (Hirsch, Reference Hirsch1976: 7).
If education spending is a positional good and/or if growing labour market polarization further heightens parents’ anxieties as theorized above, then we might expect income inequality to further strengthen the commitment of parents with high incomes and education to intensive parenting practices in which they were already engaged:
H2b: Canadian parents belonging to high-income groups will spend more on their children’s education than parents belonging to low-income groups when income inequality increases, even once accounting for the direct effect of income.
H2c: Canadian parents belonging to highly educated groups will spend more on their children’s education than parents belonging to less educated groups when income inequality increases, accounting for the effect of income.
Importantly, unlike for explanations focussing on the direct income effect of income inequality on high-income parents’ spending, explanations focussed on how changes in economic structure and/or status competition influence parents’ investments in their children yield less precise predictions about the timelines over which these processes might unfold. Put differently, it is possible that high-income and highly educated parents are responsive less to yearly changes in income inequality and more to the broader economic changes of recent decades. This is particularly significant in the Canadian context and the context of this study since, as we discuss in the next section, income inequality rose substantially in the 1980s and 1990s, but has been more stable since the 2000s, when this study’s time period begins. Thus, we also test the hypothesis that:
H3a: Canadian parents belonging to high-income groups have more rapidly increased spending on their children’s education over time than parents belonging to low-income groups, even once accounting for the direct effect of income.
H3b: Canadian parents belonging to highly educated groups have more rapidly increased spending on their children’s education over time than parents belonging to less educated groups, accounting for the effect of income.
However, not all research agrees that social class gaps in parent investments in children have grown in recent years (for example, Bassok et al., Reference Bassok, Finch, Lee, Reardon and Waldfogel2016; Kalil et al., Reference Kalil, Ziol-Guest, Ryan and Markowitz2016; Reardon and Portilla, Reference Reardon and Portilla2016). In fact, there are several reasons to hypothesize that most parents—that is, not just high-income and highly educated parents—may have increased their investment in their children’s education in recent decades as income inequality increased. First, if education spending is understood as a positional good, valued in terms of relative, not just absolute, consumption, then income inequality may induce not just high-income earners, but also households further down the income distribution, to increase education spending where inequality is higher. As Levine, Frank and Dijk (Reference Levine, Frank and Dijk2010: 55) argue, changes in spending on positional goods among the top income group “shifts the frame of reference that defines consumption standards for others just below them on the income scale.” Such shifts can lead to “expenditure cascades,” in which rising inequality results in increased spending among not only the wealthiest, but also among households further down the income distribution (see also, Bertrand and Morse, Reference Bertrand and Morse2013). Ahlquist and Ansell (Reference Ahlquist and Ansell2017) and others refer to this as the “keeping-up-with-the-Joneses” effect,Footnote 5 in which the average household engages in spending to preserve its status in the face of higher spending among high-income households. However, while the highest-income households have made income gains at high levels of inequality and can dedicate some of these increased resources to consumption on education, incomes for middle-income earners have mostly stagnated in recent decades. Thus, for middle-income households to fund higher levels of education consumption, they must reduce spending elsewhere (or turn to other options such borrowing or spending their savings) (Ahlquist and Ansell, Reference Ahlquist and Ansell2017; Frank, Reference Frank2007; Levine, Frank and Dijk, Reference Levine, Frank and Dijk2010).
A related but distinct argument from the sociological literature suggests that high-income and educated parents’ approach to parenting—the “concerted cultivation” identified by Lareau (Reference Lareau2003)—may have slowly diffused to become the mainstream parenting approach. As Calaraco (quoted in Pinsker, Reference Pinsker2019) argues:
A plausible history of the past couple decades of American parenting, though, is that a critical mass of families with sufficient means started engaging in intensive parenting, and then everyone else followed. That would be consistent with prior research on cultural shifts, which have shown that elite culture gradually becomes mass culture.
Several studies have shown that parents across social classes report similar levels of support for more intensive or involved parenting approaches (Bennett, Lutz and Jayaram, Reference Bennett, Lutz and Jayaram2012; Chin and Phillips, Reference Chin and Phillips2004; Doepke and Zilibotti, Reference Doepke and Zilibotti2019; Hays, 1996; Ishizuka, Reference Ishizuka2019). Similarly, existing Canadian evidence on parents’ investments of time in childcare suggests the education gradient in parent time investment, though substantial, diminished between 1986 and 2010Footnote 6 (Wei, Reference Wei2020; Ramey and Ramey, Reference Ramey and Ramey2010). Of course, desiring to engage in intensive parenting and having the resources and information to do so are two different things, and this distinction may account for why research still often documents persistent gaps in parenting spending behaviour (Ishizuka, Reference Ishizuka2019). As our final set of hypotheses, we therefore test the possibility that:
H4a: Canadian parents belonging to all income groups increase spending on their children’s education in response to higher income inequality, accounting for the direct effect of income.
H4b: Canadian parents belonging to all income groups have increased spending on their children’s education over time, accounting for the direct effect of income.
H4c: Canadian parents belonging to all education groups increase spending on their children’s education in response to higher income inequality, accounting for the effect of income.
H4d: Canadian parents belonging to all education groups have increased spending on their children’s education over time, accounting for the effect of income.
Inequality in Canada
We theorize that Canadian parents may pursue different investment strategies than U.S. parents due to differences in the two countries’ educational structures, but we also note that different patterns of income inequality in the two places may further be germane to preferences. While both Canada and the U.S. experienced similar increases in income inequality from the 1980s to 2000s, in both cases underpinned by increases in the income share of high-income earners, overall income inequality is significantly higher in the U.S. than Canada (Heisz, Reference Heisz, David, Craig Riddell and St. Hilaire2016). Canada falls somewhere in the middle in cross-national comparisons of income inequality in advanced industrial countries. Its Gini coefficient is higher than most European countries, but lower than high-inequality countries such as the U.S. and U.K. (Osberg, Reference Osberg2018). This context makes it less clear whether we should expect to observe patterns of inequality and education spending similar to those documented by Schneider et al. (Reference Schneider, Hastings and LaBriola2018) in the U.S. On the one hand, we might expect lower levels of income inequality to dampen the competitive pressures parents feel to position their children; on the other hand, some research suggests that practices such as “concerted cultivation” have proliferated even in lower inequality settings (for example, Doepke and Zilibotti, Reference Doepke and Zilibotti2019).
Before turning to analyses, we therefore briefly discuss how income inequality has evolved in Canada. Similar to many other advanced industrial countries, inequality in market incomes widened in Canada in the late 1990s and early 2000s, before mostly stabilizing thereafter, but at a higher level than in the early 1990s (Burkinshaw, Terajima and Wilkins, Reference Burkinshaw, Terajima and Wilkins2022). If we examine trends in market income inequality (pre-tax and transfer inequality) in the Gini coefficient by province, we see more variation. To provide a longer-term view of trends in income inequality in the Canadian provinces, Figure 1 plots the Gini coefficient of adjusted market income by province for the years 1982–2019. We mark the year 2006 with a red line, denoting the first year of Survey of Household Spending (SHS) data used in our analysis. Figure 1 shows that in most provinces the largest increase in income inequality occurred in the late 1980s and early 1990s. Since 2006, trends in income inequality have been less pronounced and more heterogenous, with most provinces experiencing years of both increasing and declining inequality.
Evolution of Market Income Inequality by Province, 1982–2019.
Note: Gini coefficients are calculated by the authors for each province using weighted adjusted family market income including capital gains for the working age population (age 18–65 years), as reported in Statistics Canada’s Longitudinal Administrative Databank. For comparison, Appendix A.1 also shows Gini coefficients from Statistics Canada’s Table: 11-10-0134-01 (formerly CANSIM 206-0033), which uses the Canadian Income Survey, Survey of Labour and Income Dynamics, and the Survey of Consumer Finances.

Because there is some question as to whether the Gini coefficient is unduly sensitive to incomes at the middle of the income distribution (for a discussion of this issue, see Gastwirth, Reference Gastwirth2017), in our analysis, we also examine two additional measures of income inequality that provide added insight into income shifts at different parts of the income distribution: the 90/10 income ratio, and the 90/50 ratio. The 90/10 ratio measures how many times larger the income of people at the top of the income distribution (90th percentile) is as compared to people at the bottom of the distribution (10th percentile), while the 90/50 ratio measures how many times larger the income of people at the top is relative to people in the middle of the income distribution (50th percentile). Appendix A.2 shows the evolution of these two measures in this study’s time period. As with the Gini coefficient, we again see heterogeneity across provinces.
Data and Methods
To examine the relationship between parent class, income inequality, and education spending in Canada, we draw on data from the Survey of Household Spending (SHS), an annual survey administered by Statistics Canada that provides an in-depth account of Canadians’ household expenditures and includes detailed questions about families’ spending on education. The SHS enables us to examine over-time trends in the relationship between income and education, and household spending on primary and secondary education in the Canadian provinces. The Survey was first administered in 1997; however, respondent education—a key variable in our analyses—was only included beginning in the mid 2000s. Moreover, as of 2017, the SHS is fielded every second year rather than annually, so no survey was fielded in 2018. Consequently, we examine years 2006–2017 and 2019.Footnote 7 While Statistics Canada makes public some SHS data, public files combine all education spending (including postsecondary education spending), thus we instead access disaggregated data in Statistics Canada’s secure research data centres.
Because we are interested in non-postsecondary education spending, we restrict our sample to survey respondents who report that the children in their household are under the age of 18 years and over the age of 4 years. We further restrict our sample to the 10 provinces due to data availability. Once we impose these restrictions, our sample size is 26,748 respondents.
Our primary dependent variable of interest is private education spending, which we measure as the sum of several educational spending categories in the SHS: spending on tuition for nursery, kindergarten, elementary and secondary (which excludes spending on day/childcare); spending on other educational services (such as tutoring); and spending on other courses and lessons (such as arts and sports classes). By combining these categories of education spending, we are capturing the broader array of options parents have for both substituting and/or supplementing the education available to them through the public system. We also conduct analyses where we subcategorize spending into the three groups: spending on tuition, spending on other courses or lessonsFootnote 8 and spending on other education services. We deflate spending by province-specific consumer price indices available from Statistics Canada, and expressed in dollars of 2002 (Statistics Canada, Table 326-0021).
To measure income, our first independent variable of interest, we use the SHS’s total income variable (household income before taxes). As with spending measures, income is deflated using the province-specific consumer price indices available from Statistics Canada and thus is in 2002 dollars. We adopt Schneider et al.’s (2018) income percentiles, classifying households below the 25th weighted income percentile as low income, respondents between the 25th and 75th income percentiles as middle income, respondents between the 75th and 90th income percentiles as middle–high income and respondents above the 90th percentile as high income.Footnote 9
To measure our second independent variable of interest, parent education, we capture the highest level of education in the household. Survey respondents are coded on the basis of the highest level of education achieved either by themselves or their spouse/partner (that is, whichever level is higher), and where respondents report no spouse or partner, they are coded only on the basis of their own education. We collapse education into four categories: high school or less; college or trades diploma or degree; bachelor’s degree; and postgraduate degree. In Appendix A.3, we show unweighted survey counts for the number of respondents in each SHS survey year, broken down by income and education group.
Finally, we are interested in whether our two independent variables—parent income and parent education—may interact with income inequality to predict education spending. To measure income inequality, we calculate yearly Gini coefficients for each province using weighted adjusted family market income for the working age population (age 18–65 years), as reported in Statistics Canada’s Longitudinal Administrative Databank, a 20% annual sample of tax filers in the T1 Family File. We also report supplementary findings examining 90/10 and 90/50 income inequality. If respondents shift their preferences for education spending when they observe higher inequality in their province, there should be a lag between when inequality changes and when respondents shift their spending behaviour, thus all measures of inequality are lagged by 1 year.
For our modeling approach, we conduct linear regression analyses where education spending and categories of education spending are the dependent variables. In our first set of analyses, we examine how parent education and parent income predict spending on education and its subcomponent categories. Models include controls for both income group (low, middle, mid-high and high) and income (in $1000s). Including both controls allows us to isolate the extent to which higher levels of education spending among higher income parents may stem from a direct income effect, whereby higher income parents simply have more income to spend (on education and other goods), and the extent to which higher spending may stem from different income groups having distinct preferences for education spending (Schneider et al., Reference Schneider, Hastings and LaBriola2018). As a more direct test of the direct income effect, we also report models with only income (in $1000s) in appendices. As an additional test of whether higher levels of education spending among higher income parents are primarily direct, we further conduct supplementary analysis examining education spending as a percentage of parent income as our dependent variable. If higher income parents place greater emphasis on education as compared with lower income parents, than we should expect to see that the relative share of income parents spend on education increases as parent income increases.
In our second set of analysis, to test whether parent spending is responsive to income inequality, we interact respondents’ household income group and household education with our three measures of province-level income inequality—the Gini coefficient, 90/10 income inequality and 90/50 income inequality. Again, as an additional test of the direct income effect, we report models that interact income (in $1000s) with income inequality in appendices. We focus primarily on findings relating to the Gini coefficient in text, since it is the most commonly used measure of income inequality. Finally, to test whether parent spending has increased over time, we interact parent income group and parent education with dummy variables for each year.
All models control for household income (deflated, in thousands), whether the parent is a single parent, the number of children in the household, whether there was a teacher’s strike in the province in a year and whether both the survey respondent and their spouse report being employed full time. We also control for the share of boys among the children in the household, as several previous studies have found that parents invest more time and money in girls than boys (Baker and Milligan, Reference Baker and Milligan2016; Kornrich and Furstenberg, Reference Kornrich and Furstenberg2013).Footnote 10 Finally, we include year and province fixed effects. The former account for possible unobserved variables that evolve over time but are constant across provinces, and the latter constrain our model to variation within, rather than between, provinces. Models use Statistics Canada’s survey weights and are estimated with standard errors clustered by province, using the wild cluster bootstrap method.
Results
Parent income, parent education and spending on education
In Figure 2, we begin by showing descriptive plots of weighted education spending by parent income group (top) and education group (bottom) (see Appendix A.4 for mean yearly education spending). For visualization purposes, we plot 3-year rolling averages of education spending. Appendices A.5 and A.6 further show education spending broken down by categories (tuition, lessons and other education spending). In both figures we observe class gradients; the top figure suggests parents with higher incomes spend more on education across income groups, while the bottom figure suggests the same pattern across levels of education. The top figure further provides suggestive evidence that spending among all income groups may have increased over time, with the largest increase among high-income parents. The bottom plot suggests spending among more highly educated parents may have crept up in the mid-2010s, before falling thereafter.
Evolution of Education Spending by Parent Income Group (Top) and Education Group (Bottom).
Note: Plots show weighted education spending by parent income group (top) and education group (bottom). To smooth the trend lines, we plot 3-year rolling averages for education spending. We show education spending by income back to 1997, since this is the first year data was available. However, in models below we begin our analysis in 2006, subsequent to the inclusion of education as a variable in the SHS.

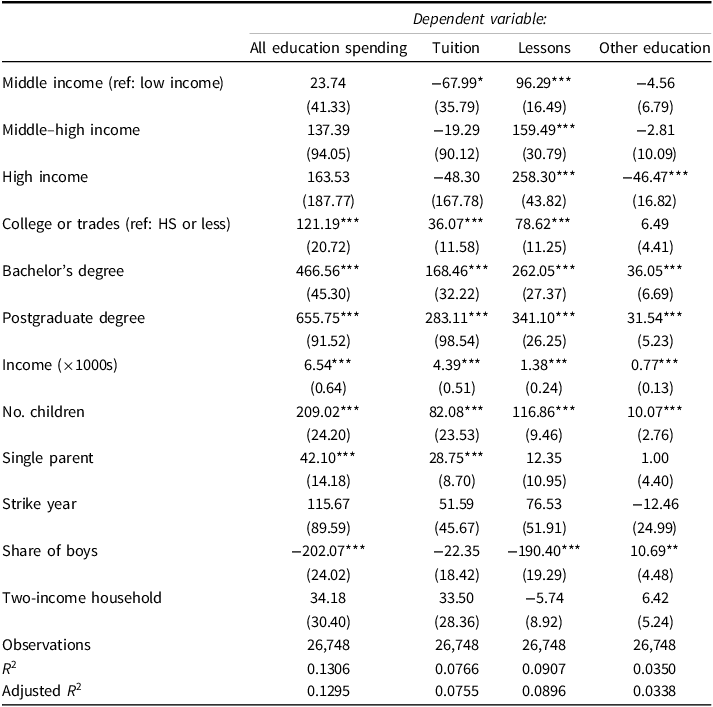
Table 1 formally examines the relationship between parent income and education and education spending. In Table 1, the first column shows results from regressions of education spending on parent income and education groups, while subsequent columns show regression results for each category of education spending separately (for regressions of the relationship between different measures of parent class and education spending without controls, see Appendix A.7). Beginning with parent income, note again that models include both a continuous measure of income (income in thousands) and income group (low, middle, middle-high and high income), allowing us to examine both the direct income effect and any potential behavioural differences associated with higher income (in Appendix A.9, we also show the direct relationship between income (in $1000s) and spending with the exclusion of income group). Table 1 shows that income (in thousands) is positively related to education spending; parents spend on average $7 on education for every $1,000 increase in household income. However, the first column of Table 1 also shows that, when controlling for continuous income and other factors (notably, parent education), parent income group is not clearly related to higher spending on education overall. Put differently, high-income parents are not uniquely investing in spending on their children’s education. Thus, belonging to a higher-income group does not have an added effect on education spending over and above the effect having more income has on spending on education.
Relationship between Parent Income, Parent Education and Education Spending

Note: Models are linear regressions with province and year fixed effects, and standard errors clustered by province using the wild cluster bootstrap method. To conserve space, coefficients for province and year are not reported in text. See Appendix A.8 for all coefficients. *p < 0.1; **p < 0.05; ***p < 0.01
Next, we separately examine categories of education spending, again controlling for income (in $1000s) and other factors including parent education. Here we see there is a significant relationship between income group and some categories of education spending, specifically spending on children’s lessons. Table 1 shows that middle-income, middle–high-income and high-income group parents all spend more than their low-income group counterparts on lessons and other courses for their children, when controlling for the effect of income (in $1000s). Among the highest-income group, parents spend on average $258 more than low-income parents, over and above the effect of simply having more income. That said, in Appendix A.10, we also examine how parent income relates to education spending as a share (percentage) of parent income. Appendix A.10 suggests that higher-income parents spend relatively less of their income across all education categories than do lower-income parents, even as they spend more overall.Footnote 11 Taken together, results therefore provide only limited evidence that the emphasis parents place on their children’s education increases as income increases.
Table 1 also presents how parent education relates to education spending, controlling for parent income and other factors. Here we observe large differences among more and less educated parents. Controlling for parent income and income group, we see that higher levels of parent education are associated with higher education spending among all education groups. As compared with parents with only a high school degree or less in the household, parents with a college or trades education spend on average $121 more on education. Among parents with a bachelor’s degree in the household, the amount is $466, and parents with a postgraduate degree in the household spend on average $656 more on education spending overall.
Examining how parent education relates to each category of education spending, we further observe that parents with more education spend more on all categories of education spending, including tuition, lessons and other education (the exception for the latter category is for parents with a college or trades education). Dollar amounts are particularly notable for parents with a bachelor’s degree or postgraduate degree in the household. For example, looking at parents with a postgraduate degree, we observe that these parents spend on average $283 more on tuition than parents with a high school degree or less, an average of $341 more on lessons and other courses and an average of $31 more on other education. Appendix A.10 further confirms that, across categories of education spending, more educated parents spend more on education as a share of their income than do less educated parents. These findings suggest that, in contrast to parent income, more highly educated parents emphasize education spending relatively more than less-educated parents.
Income inequality and parent spending on education
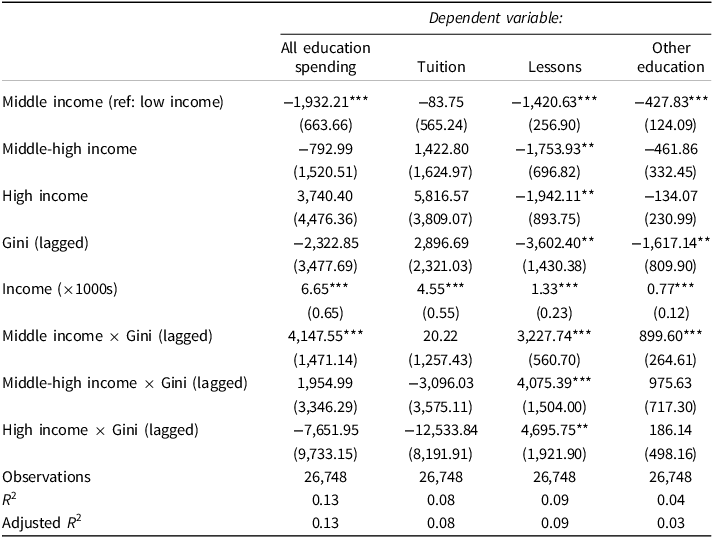
In Tables 2 and 3, we extend analyses by examining whether parents, particularly those with higher incomes or higher levels of education, increase their spending on education in the face of higher income inequality. In the first column of Table 2, we begin by regressing overall education spending on the interaction of parent income group (low, middle, middle-high or high) and province-level income inequality, with the controls introduced above (including parent income in $1000s).Footnote 12 This specification tests whether any relationship between income group and spending stems from a direct income effect, or whether higher-income parents have different actual preferences for education spending than lower-income parents at higher levels of inequality (Schneider et al., Reference Schneider, Hastings and LaBriola2018). In supplementary material, we also examine specifications that include models with education spending as a share of income as the dependent variable; models with 90/10 and 90/50 income inequality as alternative measures of income inequality; and models that interact income in $1000s (instead of income group) with measures of income inequality (see Appendices A.14 through A.20). Across specifications, we find little evidence of a systematic relationship between levels of income inequality and overall education spending among higher income parents, whether due to a direct income effect or behavioural differences. Appendix A.21 also plots predicted spending on education across levels of income inequality for these different specifications, further underscoring the absence of a positive relationship between parent income group, income inequality and spending on education.
Relationship Between Interaction of Parent Income and Province-Level Income Inequality (Gini Coefficient) and Education Spending

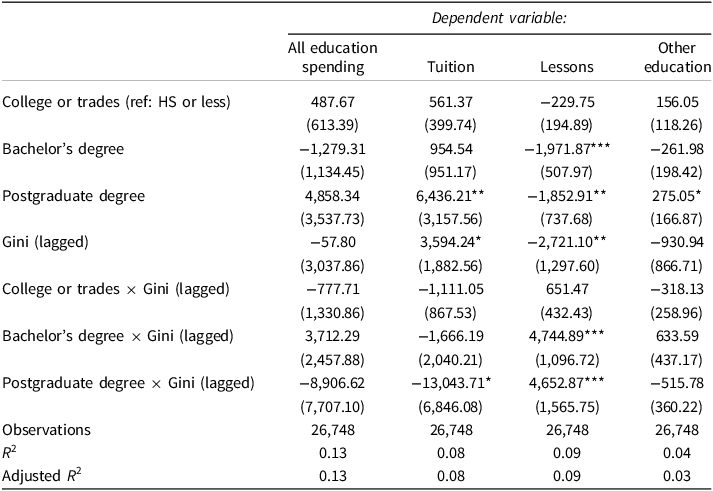
Relationship between Interaction of Parent Education and Province-Level Income Inequality (Gini Coefficient) and Education Spending

In Table 3, we examine the relationship between parent education, income inequality as measured using the Gini coefficient and spending on children’s education. In the supplementary material, we also include specifications examining education spending as a share of parent income as the dependent variable, and specifications examining 90/10 and 90/50 income inequality (Appendices A.23 through A.25). Focussing first on total education spending, overall we find little consistent evidence that changes in the level of income inequality have induced more educated parents to spend more on their children’s education (Appendix A.26 visualizes these findings).
While we do not find consistent evidence of a relationship between income inequality and higher-income or more educated parents’ spending on education overall, we do find some evidence of a positive relationship between parent income and education group and spending on lessons and other extracurriculars (column 3 in Tables 2 and 3). Figures 3 and 4 visualize these findings. Looking first at income group, the top left quadrant of Figure 3 plots predicted parent spending on lessons by parent income group at different levels of income inequality, as measured by the Gini coefficient. For comparison, Figure 3 also plots predicted parent spending on lessons as a share of income by parent income group at different levels of the Gini coefficient (top right quadrant), as well as predicted parent spending on lessons when parent income group is interacted with 90/10 income inequality (bottom left quadrant) and 90/50 income inequality (bottom right quadrant). Figure 3 suggests that parents from lower-income groups spend, if anything, less on lessons and other courses at higher levels of income inequality. While evidence for higher-income parents is mixed across model specifications, findings do provide tentative evidence that high-income parents spend more on lessons when income inequality is higher, at least as measured using 90/10 and 90/50 income inequality. These findings are notable given that, of the measures of inequality examined, the latter two measures most directly measure the position of high-income (90th percentile) parents relative to other groups.
Predicted Spending on Lessons by Parent Income Group, Interacted with Income Inequality.
Note: Top left figure shows predicted spending on lessons and other courses for the interaction of parent income group and the Gini coefficient; top right figure shows predicated spending on lessons and other courses as a share (percentage) of income for the interaction of parent income group and the Gini coefficient; bottom left figure shows predicted spending on lessons and other courses for the interaction of parent income group and 90/10 inequality; and bottom right figure repeats the preceding one but with 90/50 inequality. For each measure of inequality, the figure shows predictions at “low” levels of inequality (10th percentile of the measure), “mid” levels of inequality (50th percentile) and “high” levels of inequality (90th percentile).

Predicted Spending on Lessons by Parent Education Group, Interacted with Income Inequality.
Note: Top left figure shows predicted spending on lessons and other courses for the interaction of parent education group and the Gini coefficient; top right figure shows predicated spending on lessons and other courses as a share of income for the interaction of parent education group and the Gini coefficient; bottom left figure shows predicted spending on lessons and other courses for the interaction of parent education group and 90/10 inequality; and bottom right figure repeats the preceding one but with 90/50 inequality. For each measure of inequality, the figure shows predictions at “low” levels of inequality (10th percentile of the measure), “mid” levels of inequality (50th percentile) and “high” levels of inequality (90th percentile).

As compared with parent income group, we find additional evidence of a positive relationship between parent education, income inequality and spending on lessons and other extracurriculars. Figure 4 repeats analyses in Figure 3 but for parent education. Figure 4 suggests that parents with bachelor’s and postgraduate degrees increase spending at higher levels of income inequality. These findings are more pronounced when income inequality is measured using the 90/10 and 90/50 income ratios.
Finally, to test the possibility that parent spending has increased over time, in Figure 5 we examine the interaction between parent income group and year, and parent education and year (see Appendices A.27 through A.32 for regression tables, which also include models examining income (in $1000s) rather than income group, and spending as a share of parent income). Figures point to a spike in spending around 2011 and 2013, primarily among high-income and highly educated parents, but overall provide little evidence of a clear over-time increase in spending among parents belonging to any income or education group.
Relationship Between Interaction of Parent Income and Year on Education Spending (Top) and Parent Education and Year on Education Spending (Bottom).
Note: Top figure shows predicted spending on education by parent income group interacted with year (on the basis of regression table in Appendix A.27); bottom figure shows the same for parent education (on the basis of regression table in Appendix A.31). Standard errors are clustered on province. See also Appendix A.33 for figures examining education spending as a share of parent income as the dependent variable.

Taken together with findings in Table 1, while parents with both higher incomes and higher levels of education (and in some instances, those belonging to higher-income groups) spend more on their children’s education in Canada, these patterns appear mostly not to be sensitive to yearly changes in income inequality, nor have they changed substantially in recent decades. The notable exception is for parent spending on lessons and other courses, where we find evidence that parents belonging to high-income—and especially high-educated—groups do respond to higher levels of income inequality by shifting their preferences for spending.
Discussion and Conclusions
In this article, we examined class gaps in Canadian parents’ investments in their children’s education. We examined four sets of hypotheses pertaining to: (1) whether parents belonging to higher-income and higher-education groups have distinct preferences for investing in their children’s education; (2) whether these preferences have shifted in response to changes in income inequality or (3) over time; and (4) whether the preferences of lower-income or less educated parents have also shifted. We considered whether findings emanating from the U.S. states generalize to the Canadian context, where the presence of a much less stratified system of postsecondary education may decrease the pressure parents feel to invest in their children’s education early on as a means of securing their future socio-economic status.
Examining our first set of hypotheses, we find substantial class gaps in parent spending by education, and in some instances, by income group, even when accounting for the direct effects of income. Households with higher levels of education spend significantly more on all types of education spending, including tuition, other courses and lessons, and other education spending. While we also find that higher-income parents spend more on education in line with their higher incomes, we find only minimal evidence that higher income groups place unique emphasis on education. The exception is for spending on other courses on lessons, where we observe that spending is considerably higher among higher-income groups (although not when spending is measured as a share of household income).
Examining our second and third set of hypotheses, whereas research in the U.S. finds a close association between income inequality and parent spending on education for both high-income groups and highly educated groups (Schneider et al., Reference Schneider, Hastings and LaBriola2018), we find little evidence of either relationship. Nor do we find evidence of significant changes in spending over time. We also find little evidence of systematic changes among other education or income groups over time or in response to income inequality (our fourth set of hypotheses).
While we are not the first to highlight that more highly educated parents invest more in their children’s education than less educated parents (accounting for income), why this is the case is not a settled question. One possibility is that more-educated parents in Canada are responding to aspects of competition within the Canadian postsecondary education system to which less educated parents are less sensitive. As Davies and Hammack (Reference Davies and Hammack2005) argue, absent steep competition between higher education institutions, competition instead exists within institutions, in the form of competition for spots in the fields of study (majors) associated with the highest pay. Thus, competition for what are perceived to be the “best jobs” may still drive parent decision making in the country, and it may be the case that more educated parents are particularly attuned to this form of competition, having themselves attended postsecondary institutions. Alternatively, it may be that more highly educated parents value education for other benefits it provides, such as the social status it confers. Future research on the Canadian context should further examine these potential alternatives.
A second finding from our analysis worth highlighting is that class gaps, both among parents belonging to high-income and highly educated groups, are substantial when examining spending on lessons and other extracurricular activities. Researchers argue that parents see enrollment in extracurricular activities, for example, in sports, arts and music, as an important way they can position their children for the best jobs in later life (Friedman, Reference Friedman2013). Work on school choice further suggests that choice in the Canadian system is high, exceeding choice in the U.S., with much of this choice exercised within the public system (for example, through parents choosing to place their children in publicly funded alternative schools and programs and Catholic schools) (Asadolahi et al., Reference Asadolahi, Farney, Triadafilopoulos and White2022; Davies and Aurini, Reference Davies and Aurini2011). Given the popularity of publicly funded options on which Canadian parents can draw, parent spending outside of the school day, such as spending on lessons and other extracurricular activities, may simply reflect this wider trend.
Despite not finding evidence of a relationship between changes in income inequality and changes in high-income and educated parents’ investments in education, we do not rule out that the two may in fact be related. First, although Statistics Canada’s SHS is the best available data for measuring education expenditures, allowing us to provide the most comprehensive analysis to date of parents’ financial investments in their children’s education, we are restricted to analyzing a relatively short time period. The time period we do examine (2006–2017 and 2019) further covers two decades where changes in inequality were less dramatic than in the decades previous. Thus, one possibility is that changes in income inequality were not significant enough in the time period we study to register with parents. Moreover, it is also plausible that higher income inequality did in fact have a significant impact on parents’ preferences in Canada, but that parents have now settled into a new equilibrium of higher spending. Although post tax-and-transfer income inequality levelled off in the 2000s, it did so at higher levels than previously (Corak, Reference Corak2016). Higher levels of inequality may have fostered anxiety among upper class parents about securing advantage for their children, inducing them to make new investment decisions—such as moving their children from public to private schools—over the longer run. Such changes in investment would not register in analyses examining the relationship between yearly changes in income inequality and education spending, even if they were ultimately made in response to inequality.
Regardless of whether parents’ preferences for education spending are immediately responsive to income inequality in Canada, we think it matters that high-income and highly educated Canadian parents are devoting significantly more resources to their children’s education than other parents. Canada has been lauded for its high levels of intergenerational mobility, even as income inequality has increased in recent decades (Corak, Reference Corak2017). Canada’s robust public education system plays an important role in facilitating intergenerational mobility in the country; as Simard-Duplain and St-Denis (Reference Simard-Duplain and St-Denis2020: 383–384) argue, “the weak association between parents’ income and children’s education plays a non-negligible part in keeping mobility high.” Yet, there is also evidence that Canada’s intergenerational mobility may now be declining (Connolly, Haeck and Lapierre, Reference Connolly, Haeck and Lapierre2019). To the extent that highly educated parents’ out-spending on their children’s education is a factor driving this decline, the concern is that the class position of the next generation of children will be ever more tightly linked to the class position of their parents.
We therefore think it is important for policy makers to consider these spending patterns when making decisions about the allocation of scarce public dollars to both the public and private education systems. Parental spending on extracurricular education is a private act by individual households, but it can nonetheless affect the education system as a whole. For example, such spending can affect children’s performance on standardized assessments, which may affect board level and ministerial resource allocation decisions. Chmielewski and Maharaj (Reference Chmielewski and Maharaj2022) have also tracked levels of school sorting by socio-economic status in Canada and have found it to be low by international standards but varied by province/territory. This, combined with higher levels of public funding for private schooling in some provinces and territories, along with some federal financing for school choice (Borwein et al., Reference Borwein, Farney, Khovrenkov and White2023) and inequities in parents’ school fundraising (for example, People for Education, 2023), raise serious equity considerations system-wide.
Policy makers should be mindful of these household spending inequities when making allocation decisions regarding everything from tax breaks for household education-related expenses to public funding for private education. Compensatory programs such as public funding directed at extracurricular activities such as school tutoring in lower-income neighborhoods may not do enough to level the spending playing field and overcome what researchers label “Matthew effects,” where more advantaged families are more likely to access scarce but desirable services (Pavolini and Van Lancker, Reference Pavolini and Van Lancker2018). More broadly, our findings can help inform research and policy making in all jurisdictions grappling with these challenging tradeoffs between access and equity, even in countries with more robust social programs, lower levels of inequality and less stratified education systems (Garritzmann, Häusermann and Palier, Reference Garritzmann, Häusermann and Palier2022).
Supplementary material
For supplementary material accompanying this article visit https://doi.org/10.1017/S0008423925100516
Acknowledgments
We are grateful for the assistance of the dedicated Statistics Canada research analysts at both the University of Toronto and Simon Fraser University’s Research Data Centres. We also thank participants at the 2022 American Political Science Annual Meeting.
Financial support
This research was funded by the Social Sciences and Humanities Research Council of Canada grant number 435-2016-0629.


 Open access