


Introduction
Johnsons and Hurd Glaciers are the two main glacier units of Hurd Peninsula ice cap (62˚39–42′ S, 60˚19–25′W; Fig. 1), Livingston Island, South Shetland Islands, Antarctica. They presently cover an area of about 10km2. Johnsons is a tidewater glacier flowing northwestwards, while Hurd Glacier, flowing southwestwards, ends on emerged land. They are separated by a local ice divide, with altitudes of 250– 330 m. The main body of Hurd Glacier has an average surface slope of about 3˚, though its westward-flowing side lobes, Argentina and Las Palmas, have much steeper slopes (~13˚). Typical slopes for Johnsons Glacier range between 10˚ in the northern part and 6˚ in the southern part. The equilibrium-line altitude lies at 150–180m in Johnsons Glacier and 220–270m in Hurd Glacier. Ice surface velocities of Johnsons Glacier increase downstream from the ice divide, reaching values of about 40ma–1 near the glacier terminus (Reference XimenisXimenis, 2001), while the largest ice velocities for Hurd Glacier are typically about 4ma–1 (Navarro, unpublished data). Accumulation and ablation rates show a large spatial and temporal (yearly) variability, with maximum accumulation rates of about 1 mw.e. a–1 and maximum ablation rates up to –4mw.e. a–1 measured during the last 10 years (Reference XimenisXimenis, 2001; Navarro, unpublished data). From the thermal point of view, Hurd Peninsula ice cap is mostly temperate, as revealed by temperature profiles measured at some shallow–intermediate boreholes (Reference Furdada, Pourchet and VilaplanaFurdada and others, 1999; data from M. Pourchet and J. M. Casas reported in Reference XimenisXimenis, 2001), which is consistent with measurements at other locations in the South Shetland Islands (Reference Orheim and GovorukhaOrheim and Govorukha, 1982; Reference Qin, Zielinski, Germani, Ren, Wang and WangQin and others, 1994), and also with the measured radio-wave velocities in ice (Reference Benjumea, Macheret, Navarro and TeixidóBenjumea and others, 2003; Reference LapazaranLapazaran, 2004).
Location of Livingston Island and Hurd Peninsula, and surface map of Johnsons and Hurd Glaciers showing the contour lines of the digital terrain model for 1999–2000. Contour interval is 5 m.
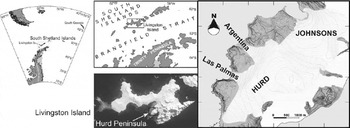
During the second half of the 20th century, a significant retreat of the ice fronts ending on emerged land of Hurd Peninsula has been observed, as well as an almost overall decrease in ice thickness. The main objective of this paper is to quantify the associated ice-volume change during the period 1956–2000, and its comparison with the regional trends in temperature data, which is of interest because Johnsons and Hurd Glaciers can be considered as representative of many small glaciers in the South Shetland Islands, of both tidewater and landed snout types, respectively.
Methods
Radar surveys and data processing
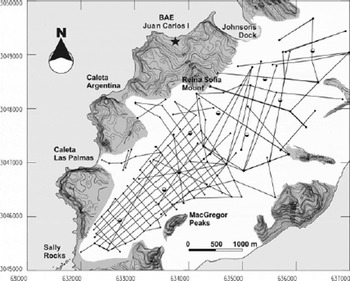
During the austral summer campaigns 1999/2000, 2000/01 and 2001/02, radar profiles were done providing a full coverage of Hurd and Johnsons Glaciers, except for the highly crevassed terminus area of the latter (Fig. 2). The radar data were acquired using a low-frequency monopulse ice-penetrating radar VIRL-2A (Reference Vasilenko, Sokolov, Macheret, Glazovsky, Cuadrado and NavarroVasilenko and others, 2002), with centre frequency of 15–20 MHz. The antennae were resistively loaded half-wave dipoles 5.8m in length. Synchronization between transmitter and receiver was accomplished by a dedicated radio channel. For profiling, transmitter and receiver were placed on separate wood sledges towed by a snowmobile. In addition to the radar data, navigation information from both global positioning system (GPS) receiver and odometer was also recorded. The details can be found in Reference Navarro, Macheret and BenjumeaNavarro and others (2005). These profiles were complemented by additional profiles made during the 2003/04 and 2004/05 campaigns, using VIRL-6 radar and Ramac ground-penetrating radar (Ramac/GPR), of 20 and 25 MHz, respectively, with transmitter–receiver synchronization by optic fibre link. In 2003/04, 200MHz Ramac/GPR profiles were also done on the accumulation zone to determine the firn layer thickness. Using VIRL-6 radar, common-midpoint (CMP) measurements were also performed in 2003/04 at nine locations shown in Figure 2, in order to determine the radio-wave velocity (RWV) in ice.
Radar profiles (15–25 MHz, and additionally 200 MHz for accumulation area) covering Johnsons and Hurd Glaciers. Most of them correspond to December 1999, 2000 and 2001. The locations of the CMP measurements are also shown (large dots). The star denotes the location of Juan Carlos I station.
The processing of radar data included direct-current (d.c.) correction, amplitude scaling, bandpass filtering, deconvolution and migration. Conversion to depth was done using our best estimate for the radio-wave velocity, as discussed later.
Estimation of total volume and ice-volume changes, 1956–2000
The ice volume for 2000 was estimated from the ice-thickness map retrieved from radar data for 1999–2001. Ice-thickness data from 2003/04, corrected for mass-balance changes, were only used to solve some uncertainties in thickness data from 1999–2001 (e.g. zones with bedrock reflection not clearly visible in the radargrams). For the highly crevassed area near Johnsons Glacier front, where radar profiling was not possible, the ice volume was estimated from: (1) the surface topography and the bed topography determined by interpolating data from neighbouring areas located further up-glacier (covered by radio-echo sounding; Reference Navarro, Macheret and BenjumeaNavarro and others, 2005); and (2) bathymetric measurements in Johnsons Dock (García-Sellés, unpublished data).
The topographic map for 1956 was constructed by photogrammetric techniques, as described below. We used four British Antarctic Survey (BAS) aerial photographs overlapping on Hurd Peninsula, taken from a flight altitude of 4200m using an Eagle IX MK I camera with focal length 153.21 mm. The printed photos were digitalized using a Zeiss Intergraph PS-1 Photoscan high-resolution photogrammetric scanner. The approximate scale above sea level was 1 : 27 500. A total of 20 ground-control points (GCPs) with good spatial distribution were obtained from field measurements with total station (14 GCPs) and differential GPS (6 GCPs). These were taken, with centimetre accuracy, on exposed rock or beach areas. In three beach areas showing a poorer coverage of control points, an additional control point at sea level, with unknown horizontal position, was assigned a 0m vertical coordinate to help to define the horizontal plane. The bundle adjustment was done using Erdas Ortho-base software and the camera calibration parameters. The known parameters were radial lens distortion, focal length and the position of fiducial marks, while the unknown parameters were those corresponding to external information. This bundle adjustment produced the following root-mean-square errors for the control points: ground X: 0.3552 m; ground Y: 0.3136 m; ground Z: 0.6118 m. A subsequent quality control was performed by comparing 20 data points measured by differential GPS on non-glaciated areas with the corresponding points obtained from the photogrammetric system, producing a standard deviation of 3.12 m for the vertical coordinates. Having defined the photogrammetric system, we proceeded to construct the digital terrain model for the glacier surface. Due to overexposure of the original photographs, the point selection process was done manually, selecting homologous points from the different photographs (over stereographic pairs and trios) and filtering out those producing slopes inconsistent with the gentle glacier slopes. A total of 1350 photogrammetric points were obtained in this way, from which a triangulated irregular network (TIN) was generated using the Geopak module of Microstation software.
For the 1999–2000 topographic map, data on Johnsons Glacier were acquired in February 1999 using a total station, with a precision lower than 1 cm. Inaccessible areas were covered by close-range photogrammetry, with a precision of about 50 cm. Data on Hurd Glacier were acquired in December 2000 using differential GPS, with a precision better than 1 cm. The area located between the 1956 and 1999–2000 ice fronts was not surveyed. The total number of data points was 2200. From this dataset, a TIN was generated using Microstation software.
Both digital terrain models were referenced to Universal Transverse Mercator (UTM) zone 20E. Contour lines of non-glaciated areas were taken from the Servicio Geográfico del Ejército 1 : 25 000 map of Hurd Peninsula (SGE, 1991).
The map of 1956–2000 ice-thickness changes was obtained by subtracting the digital terrain models for 1999–2000 and 1956 generated directly from the point data. The lowest variation range was set at –5 to +5 m, with the aim of filtering noise arising from inaccuracies in the digital terrain models, and to only highlight relevant fluctuations. The 1956–2000 ice-volume changes were computed from the ice-thickness change map, using Microstation software.
Results
Radio-wave velocity
For the conversion from two-way travel times of radio waves to ice thickness, we used velocities from two different sources: diffraction hyperbolae from radar profiles and CMP measurements. The former were reported in Reference Benjumea, Macheret, Navarro and TeixidóBenjumea and others (2003), where RWV was estimated from 42 hyperbolae corresponding to diffractor bodies between 28 and 162 m depth. The corresponding velocities ranged from 157 to 174 mμs–1, with an average of 164.9 ±4.2mμs–1. These are normal values for temperate glaciers (Reference Macheret, Moskalevsky and VasilenkoMacheret and others, 1993), except those above 168 mμs–1, which corresponded to accumulation area locations and can therefore be attributed to the effect of snow and firn layers. The velocity estimates from CMP measurements, which correspond to average values for the full ice column, were reported in Reference LapazaranLapazaran (2004), showing velocities quite consistent with the above (e.g. 165.3 mμs–1 for the ablation area; 168.0 mμs–1 for the accumulation area), with one exception with unusually high values (176.4mμs–1), attributed to the presence of air within the water drainage system.
Surface topography, ice-thickness and subglacial relief maps
The surface topography, ice-thickness and subglacial relief maps are shown in Figures 1 and 3a and b, respectively. The average thickness in 1999–2001 was 93.6 m, each individual thickness measurement having an estimated error of ±2.5 m. The maximum values, about 200 m, are found in the accumulation area of Hurd Glacier; the maximum ice thickness in Johnsons Glacier is only about 160 m. Johnsons and Hurd are also quite different in terms of subglacial relief. Johnsons’ bed is quite regular, with altitudes decreasing towards the ice front, where glacier bed elevation is slightly below sea level. Hurd, however, is more irregular, showing a clear overdeepening in the area of thickest ice, close to the head of Argentina side lobe, and another, less pronounced, overdeepening near the head of Las Palmas side lobe. A promontory is also apparent close to this area, in a line joining the heads of Las Palmas and MacGregor Peaks. Two subglacial ridges are visible: one separating Johnsons and Hurd basins (though displaced towards Johnsons with respect to the Johnsons–Hurd ice-divide location) and another extending from Reina Sofia Mount to Sally Rocks, passing through the heads of Argentina and Las Palmas side lobes.
(a) Ice-thickness map retrieved from the radar measurements; (b) subglacial relief map obtained by subtracting the ice thickness from the surface topography map. Contour interval is 20 m.

Area, average thickness and volume changes, 1956–2000
The area, the average ice thickness and the ice volume of Johnsons and Hurd Glaciers in 1956 and 1999/2000, together with their changes in the period 1956–2000, are shown in Table 1. Remarkable changes are observed for all parameters, with the exception of the Johnsons area. Considering both glaciers as a single unit, the largest per cent change corresponds to ice volume, as this value combines the effects of both changes in area due to ice-front retreat and changes in ice thickness. The change in ice volume of –0.108±0.048 km3 for the whole of the Hurd Peninsula ice mass is equivalent to an average annual mass balance of –0.23±0.10mw.e. during the period 1956– 2000. Clear differences arise when both glaciers are considered separately. Johnsons Glacier shows almost no change in area, but a noticeable reduction in volume, due to strong ice-thickness decrease. Hurd Glacier shows an even larger reduction in volume, due to its large decrease in area, in spite of having a smaller reduction in ice thickness.
Area, average ice thickness and ice volume of Johnsons and Hurd Glaciers in 1956 and 2000, and changes during the period 1956–2000

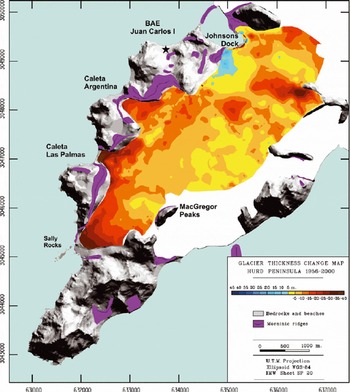
The map of ice-thickness changes during 1956–2000 is shown in Figure 4. The step in the colour scale has been set to 5 m in order to make it larger than the standard deviation in vertical coordinates shown by the quality control of the photogrammetric process (~3 m). Ice-front retreat is apparent from the figure; earlier Holocene glacier margin positions are evidenced by the moraines on the proglacial areas. Changes in ice thickness of the order of –40 to –30m are observed in the ice fronts of Hurd Glacier and near the nunatak to the east of Johnsons Glacier, though the real magnitude of the latter could be slightly smaller (1956 aerial photos for this area were overexposed). The only positive changes, of the order of 10–20 m, are found close to the western side of Johnsons Glacier front, where a large local accumulation of ice has been observed and attributed to the fact that the flowlines in this area end on land and cause the development of compressive deformation structures (Reference XimenisXimenis, 2001, p. 166). For Hurd Glacier the decrease in ice thickness clearly concentrates in the ablation area. For Johnsons Glacier the picture is more complex: though most of the decrease occurs in the upper parts, not all of the accumulation area shows a decreasing trend. There is a good correlation between the areas of largest thickness decreases and those of highest surface slopes (both for 1956 and 2000 surfaces). The neighbouring hot and cold colours present in the Johnsons Glacier calving front are just a consequence of a slight advance of the northern part of the front and a small retreat of its southern part (the ice cliff at the front is some 40 m high).
Map of ice-thickness change, 1956–2000. The area located between the 1956 and 1999/2000 ice fronts was not surveyed and is shown in white. Moraines on the proglacial areas are displayed to show earlier Holocene glacier margin positions.
Discussion
The results on changes in area, average ice thickness and ice volume of Johnsons and Hurd Glaciers during the period 1956–2000 (Table 1; Fig. 4) make clear that the glaciers have experienced a remarkable retreat during the period. The behaviours of the two glaciers, however, are very different. In Hurd Glacier, the decrease in ice thickness focuses on the ablation area, whilst the accumulation area experienced little change. By contrast, most of the thickness decrease for Johnsons Glacier concentrates in the accumulation area, though some parts of it remain almost unaltered. A closer look at the picture, comparing the thickness changes in Figure 4 with the surface slopes shown in Figure 1, reveals a good correlation between high surface slope and large decrease in ice thickness, for both glaciers (this is also true for 1956 slopes, not shown in the figures). In particular, in the upper part of Hurd Glacier, where typical slopes are 5–6˚, the thickness changes are small, while near the terminus, where the slopes reach 9–11˚, they are large. Las Palmas side lobe shows a similar behaviour. In the case of Argentina side lobe, the slopes are everywhere high and the thickness changes, though not as large as those of Hurd and Las Palmas snouts, are also important. For Johnsons Glacier, the largest thickness changes usually correspond to areas with slopes larger than 10˚, i.e. larger than average. This correlation between high slopes and high thickness changes suggests dynamics effects. As the increased melting related to climate warming has greater effect on the lowest elevations, the resulting increase in surface slope will imply an increase in driving stress that will contribute to an enhanced transport of mass between the upper and lower parts of the glacier. Here is where the structural differences between Johnsons and Hurd Glaciers come into play. Johnsons, as a tidewater glacier with much larger velocities, shows a faster dynamic response, while Hurd, ending on land and having very low ice velocities, responds much more slowly.
Typical maximum ice velocities for Hurd Glacier are only about 4 ma–1, and are reached in the middle to lower part of the glacier, but not near the front of its main tongue. This would be expected for a glacier experiencing basal sliding in the middle to lower part but having the glacier snout frozen to the bed, which is consistent with two different evidences: (1) our radar records near the snout of Hurd Glacier show an image of ‘clean’ ice (with few internal diffractions typical of temperate ice) that extends down to the glacier bed, suggesting cold-based ice; (2) geomorphological observations have revealed the presence of structures typical of compressive flow (thrust faults) near the Hurd Glacier snout. The frozen snout is, in turn, consistent with having an ice thickness tapering to zero, as the role of geothermal heat flux is lessened under thinner ice.
Both Johnsons and Hurd Glaciers have experienced significant volume decrease during 1956–2000 (by 7.3% and 13.3%, respectively). The fact that Johnsons has lost most of its volume in areas with high surface slope in the accumulation area, with little change in ice thickness in the lower-elevation areas, means that the glacier, through a fast dynamic response, tends to restore its steady-state surface profile faster as compared to Hurd. This is achieved by means of increased velocities and calving rates, in addition to increased melting rates. By contrast, Hurd’s volume loss, entirely achieved by increased melting, concentrates on the ablation area, with little ice-thickness change in the accumulation area, which means that Hurd’s surface profile is moving away from a steady-state configuration. This, together with its slow dynamic response, implies longer-term instability for Hurd Glacier.
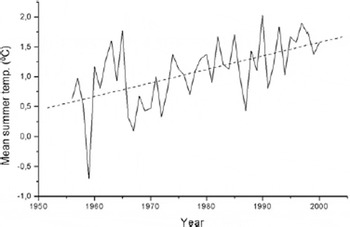
The South Shetland Islands and, at a wider regional level, the Antarctic Peninsula area have experienced a significant climate warming at least since the second half of the 20th century, when continuous meteorological measurements were started. Figure 5 shows the mean summer air temperature recorded at Bellingshausen station (Fildes Peninsula, King George Island, ~90km northeast of Hurd Peninsula) during the period 1956–2000 (BAS, http://www.nerc-bas.ac.uk/public/icd/gjma/). The least-squares fit to a straight line results in a temperature increase of 1.00˚C during the period. The linear trend obtained from 1956– 2000 data is clearly influenced by the low value for 1959, but even if the linear trend for the full 1948–2005 Bellingshausen dataset is used, an increase of 0.78˚C results for the period 1956–2000. The changes in ice volume of Johnsons and Hurd Glaciers during this period can be understood as a response to regional warming. Notice that South Shetland glaciers are mostly made of temperate ice. Therefore, any increase in air temperature is directly translated into ice melting. A part of the generated meltwater percolates into the ice, and a portion of it (discounting for partial refreezing of percolating water) eventually reaches the glacier bed, contributing to basal sliding. Also the increase in water content of temperate ice contributes to enhanced flow, due to the strong dependence of the rate factor in Glen’s flow law on the water content of temperate ice, which implies that a 1% increase in water content results in an increase of the effective strain rate by a factor of 3 (Reference DuvalDuval, 1977).
Mean summer temperatures recorded at Bellingshausen station (62˚12' S, 58˚58’ W), King George Island, South Shetland Islands, during the period 1956–2000 (solid line) and linear fit to the data (dotted line). Data before March 1968 are proxy data from P.D. Jones and P.A. Reid (http://cdiac.esd.ornl.gov/epubs/ndp/ndp032/ndp032.html).
To complete the picture, and obtain a deeper understanding of the response of Johnsons and Hurd Glaciers to changes in mass balance related to regional warming, and the contribution of dynamic effects, it would be valuable to have data on trends in mass balance and ice velocity. Unfortunately, the available time series are too short (limited to 5 years for Hurd Glacier, and close to 10 years for Johnsons, though the first 5 years of the latter do not have a regular coverage of the glacier) and are not fully analyzed yet. The preliminary analysis of trends, however, tends to support our above arguments.
Conclusions
The following main conclusions can be drawn from our analysis:
Johnsons and Hurd Glaciers have experienced a significant retreat at least since 1956, with an estimated ice volume change of –0.108±0.048km3 during the period 1956–2000, which represents a 10±4.5% drop and is equivalent to an average annual balance of –0.23± 0.10mw.e. during this period.
The mass loss for Johnsons Glacier is achieved through a combination of increased calving rate and increased melting. Its fast dynamic response tends to restore a steady-state surface profile at a faster rate as compared to Hurd Glacier.
By contrast, the mass loss of Hurd Glacier is achieved entirely by increased melting, stronger at the lowest elevations, implying increased slopes and hence increased driving stresses. Its slow dynamic response, however, tends to restore Hurd’s surface profile to a steady-state configuration at a slower rate as compared to Johnsons. In other words, a longer-term instability can be expected for Hurd Glacier.
The distribution of surface velocities measured in Hurd Glacier, together with the observation of structures typical of compressive flow (thrust faults) near the snout of its main tongue, and the absence of internal diffractions in the radar profiles for this area, suggest that Hurd is experiencing basal sliding in its middle to lower part but has its snout frozen to the bed. This means that, although mostly made of temperate ice, Hurd Glacier has a polythermal structure, contrary to the general assumption that glaciers in the South Shetland Islands are temperate. At least for those glaciers ending, like Hurd, on emerged land, their consideration as temperate glaciers should be reviewed.
Acknowledgements
This research was supported by grants REN2002-03199/ANT and CGL2005-05483 from the Spanish Ministry of Education and Science. We thank the reviewers A. Fox and T. James and the scientific editor R. Hodgkins for their many suggestions to improve the manuscript.



