


1. Introduction
Influencers in design teams are individuals that have more capacity to affect some team members’ thinking, attitudes, decision-making and behaviour than the others. The term ‘influencer’ is relatively new and is borrowed from social media or social network analysis where they could be defined as key individuals who have many people following them; they often promote companies’ products and are motivated to share new information and products (More & Lingam Reference More and Lingam2019). Similarly, design teams can be viewed as social networks that may harbour influencers. When collaborating in a team, individuals have different relationships and interactions with different members, giving rise to uneven distribution of social influence (Brown & Pehrson Reference Brown and Pehrson2019). Hence, it is often observed that some teammates have more capacity to influence their peers than others (Aries, Gold & Weigel Reference Aries, Gold and Weigel1983). In the context of this work, these individuals in design teams who are relatively more influential than their peers are referred to as influencers (Pei, Morone & Makse Reference Pei, Morone, Makse, Lehmann and Ahn2018). It is known that social influence in teams affects individual thinking during brainstorming (Paulus & Dzindolet Reference Paulus and Dzindolet1993; Singh, Cascini & McComb Reference Singh, Cascini and McComb2020) but the impact of uneven distribution of influence in design teams on the outcomes of the design process is still unclear. Therefore, the purpose of this article is to understand how the final outcome of the design process is affected by the presence of influencers in a team.
This study focuses on idea selection that typically follows idea generation as presented in Singh, Cascini & McComb (Reference Singh, Cascini and McComb2021). In idea selection, the team members communicate their idea to their peers, develop the proposed ideas (such as combining similar ones) and select the ones to propose to the evaluator. The effectiveness of idea selection is dependent on many factors such as team structure, idea selection tools, individual attributes, social influence and many more. Increasingly, the emphasis is being given to studying the design process at the individual level and how social and cognitive factors could contribute to the final design output. Cross & Cross (Reference Cross and Cross1995), stated that team activity should be considered as a ‘social process therefore, social interactions, roles and relationships cannot be ignored in the analysis of design activity teamwork’. Anyone who is observing design activities like idea generation and idea selection should consider the social factors as they could improve the understanding of design team dynamics. Therefore, the work takes into account some of these social factors because it is known that individuals when evaluating solutions of their peers, tend to adjust their beliefs and opinions (Myers Reference Myers1982). They might agree with the most influential individual in the team (i.e., influencer effect) or agree with the majority (i.e., majority effect) (Moussaïd et al. Reference Moussaïd, Kämmer, Analytis and Neth2013). For example, individuals having similar thinking may strengthen their opinion and self-efficacy [i.e., an individual’s belief in their capability to achieve goals (Bandura Reference Bandura1977)], hence, the majority effect. On the other hand, if they are not confident about their option, they may be easily influenced by the opinion of the influencer(s) in the team, hence the influencer effect. This gives an opportunity to study a more complex situation during idea selection that may emerge because of influencer or majority when deciding which solution to select. Thus, the work presented in this article builds the idea selection model framework while considering some of these factors like the influencer effect and the majority effect on decision making.
Certainly, it is difficult to study collaborative activities in a real-world setting, as the study is very resource-intensive (Becattini et al. Reference Becattini, Cascini, O’Hare and Morosi2019). Moreover, it is difficult to track and measure the social factors that affect the decision-making during idea selection under experimental conditions as they change depending on individual characteristics such as confidence level or persuasive power (Latane Reference Latane1981). To overcome these challenges, this work uses a computational model to simulate idea selection in design teams with a varying number of influencer compositions. The article deals with an agent-based approach for simulating idea selection in self-managing collaborative design teams. In self-managing teams, a group of individuals have collective autonomy and responsibility to perform tasks to achieve a common goal (Magpili & Pazos Reference Magpili and Pazos2018). The self-managing team members have a shared leadership model where all team members have a collective responsibility for the project outcome (Magpili & Pazos Reference Magpili and Pazos2018). The work consists of an agent-based model that considers the social factors during idea selection in design teams that have received limited attention in past and attempts to study how influencers impact idea selection outcomes. Thus, the study contributes to design research as the results could be used to increase the understanding of design team behaviour and the perception of the role of influencers in design teams.
Section 2 consists of the related work and the identified research question. This section is followed by a description of the model (Section 3). Section 4 briefly describes the real-world experiment which was used to support the assumption and the model logic. The results from the model simulation show how teams with different influencer compositions produce different design outcomes and differ in their behaviour in Section 5. Section 6 concludes by providing a summary of the work along with the limitations and future goals.
2. Background
Researchers have studied influencers in the context of social media and have tried to identify their traits and personality that lead to influencing thousands of followers (Poulopoulos et al. Reference Poulopoulos, Vassilakis, Antoniou, Lepouras, Theodoropoulos and Wallace2018; Berne-Manero & Marzo-Navarro Reference Berne-Manero and Marzo-Navarro2020). However, in design teams, these influencers have not been studied. Although, from the literature in other domains such as social psychology and group dynamics, self-efficacy that mediates the Big Five personality traits (Stajkovic et al. Reference Stajkovic, Bandura, Locke, Lee and Sergent2018) and trust that impacts individual and team level characteristics (Costa, Fulmer & Anderson Reference Costa, Fulmer and Anderson2018), were identified as factors that could contribute to influencing and being influenced behaviour in design teams (see more Singh et al. Reference Singh, Cascini and McComb2021). Studies in the past have shown the impact of social influence on brainstorming and found that individuals tend to mimic their team members (Brown & Paulus Reference Brown and Paulus1996). It was also shown that learning during idea generation from positive experiences, negative experiences, and social influence varied for teams with different compositions (Singh et al. Reference Singh, Cascini and McComb2020). The same study also found that teams without well-defined influencers explore more but produce solutions with lower quality (Singh et al. Reference Singh, Cascini and McComb2021). Studies like the one done by Becker, Brackbill & Centol (Reference Becker, Brackbill and Centol2017) in the domain of network dynamics of social influence shows that social learning could amplify the influence of some individuals and in cases when the influence of central individuals dominates, the group is likely to increase in error. It is known that social influence affects creativity (Paulus & Dzindolet Reference Paulus and Dzindolet2008), however, the effect of an unequal distribution of influence (that give rise to influencers) on the idea selection design outcome is still underexplored.
Idea selection is crucial during the early design phase and decisions made when selecting final concepts are key to successful projects (Lindley & Wynn Reference Lindley and Wynn2018) and serves as a foundation for any future decisions on time or people strategies. So, exploring the factors that influence idea selection could provide an important component in understanding how design teams’ performance is affected. Most of the research about decision-making during idea selection is prescriptive in nature and deals with strategies, tools or methods to select the most novel concept (Stevanovic, Marjanovic & Storga Reference Stevanovic, Marjanovic and Storga2015; Yan & Childs Reference Yan and Childs2015; Gabriel et al. Reference Gabriel, Camargo, Monticolo, Boly and Bourgault2016) rather than following a descriptive approach that focuses on the factors that lead to that choice. In some studies done in the past, it was found that individuals and groups who generated ideas during brainstorming showed no difference in the quality of the selecting idea or had poor abilities while doing so (Rietzschel, Nijstad & Stroebe Reference Rietzschel, Nijstad and Stroebe2006; Girotra, Terwiesch & Ulrich Reference Girotra, Terwiesch and Ulrich2010). Thus, indicating that selecting ideas is a challenging task and there are several biases that affect decision-making (Jones & Roelofsma Reference Jones and Roelofsma2000; Lockton Reference Lockton2012). It is clear that there are many barriers that could affect the design process (Kleinsmann & Valkenburg Reference Kleinsmann and Valkenburg2008). Some researchers have investigated thinking in design teams and cognitive features (Stempfle & Badke-Schaub Reference Stempfle and Badke-Schaub2002; Nijstad & Stroebe Reference Nijstad and Stroebe2006) while others have studied how personality traits can affect a team’s idea selection (Toh & Miller Reference Toh and Miller2016). It is known that individual cognitive states and social factors go hand in hand (Brown et al. Reference Brown, Tumeo, Larey and Paulus1998). Therefore, for this work design team activity is considered as a social process (Cross & Cross Reference Cross and Cross1995) and social factors are considered in the model formation.
Social influence affects the idea section as it was found that the participant’s chosen ideas were influenced by the one chosen by its peer (Fleury et al. Reference Fleury, Agnes, Cados, Denis-Lutard, Duchêne, Rigaud and Richir2020). Therefore, one of the social factors considered in the article is the influencer effect where the individuals with more social influence (referred to as called influencers as described above) have more capacity to persuade than others (Aries et al. Reference Aries, Gold and Weigel1983). Similar to the expert effect that is in the presence of a ‘highly confident individual in the group’ (Moussaïd et al. Reference Moussaïd, Kämmer, Analytis and Neth2013), self-efficacy is considered in this study for determining the influencer effect (Singh et al. Reference Singh, Cascini and McComb2021). Moussaïd et al. (Reference Moussaïd, Kämmer, Analytis and Neth2013) also showed in their model that confident individuals could change the opinions of the population (majority) around them. The perceived expert status is often independent of individuals’ knowledge as participants in Sinaceur et al. (Reference Sinaceur, Thomas-Hunt, Neale, O’Neill and Haag2010) had similar information in the experiment. Some researchers have shown in their work that assigned leaders or hierarchy in teams could be beneficial to idea selection because it reduces the tendency in individuals to choose their own versus others’ ideas (Keum & See Reference Keum and See2017; Cao et al. Reference Cao, MacLaren, Cao, Dong, Sayama, Yammarino, Dionne, Mumford, Connelly, Martin, Standish, Newbold, England and Ruark2020). The other social factor that is considered for this work and could affect idea selection is the majority effect. The majority effect is ‘caused by the presence of a critical mass of laypeople sharing similar opinions’ (Moussaïd et al. Reference Moussaïd, Kämmer, Analytis and Neth2013). Similar behaviour is also seen in animals while making decisions to move collectively, which show combinations of different rules (Petit & Bon Reference Petit and Bon2010). Self and social relevance is a key source that influences one’s decisions to propose solutions to the team (share information) and conform to majority influence or be persuaded by the influencer (Falk & Scholz Reference Falk and Scholz2018).
Often the models of opinion formation in a group that could lead to consensus, polarisation or fragmentation are based on the confidence level of agents (Hegselmann & Krause Reference Hegselmann and Krause2002), where confident individuals could influence others’ opinions (i.e., influencer effect). While others like Martínez (Reference Martínez2020) have studied opinion formation in coalition groups formed based on majority rule (i.e., when the majority of neighbours share similar opinions, they will act as a coalition group and the influence as a group on an agent will be greater than their individual impact (Das, Kamruzzaman & Karmakar Reference Das, Kamruzzaman and Karmakar2018). Some studies in social networks have represented opinion dynamics under the presence of both influence of the majority and the expert effect in their model (Das et al. Reference Das, Kamruzzaman and Karmakar2018; Nguyen et al. Reference Nguyen, Xiao, Xu, Wu and Xia2020). No studies could be found where the two social factors have been taken into consideration while studying idea selection in design teams. This could be mainly because it is difficult to observe opinion dynamics with respect to influencer and majority effect in design teams. Agent-based modelling (ABM) approach is excellent in capturing features at the micro-level (like individual characteristics of team members) and is useful in representing dynamic processes. The flexibility provided by ABMs often comes with assumptions regarding agent behaviours. These assumptions are often challenging to validate due to constraints on data collection. This issue of validation and calibration is a limitation of ABM (Crooks, Castle & Batty Reference Crooks, Castle and Batty2008). Despite its limitations, the ABM approach has been used in a variety of different fields, including energy management (Zhao, Suryanarayanan & Simões Reference Zhao, Suryanarayanan and Simões2013), stock trading (Luo, Liu & Davis Reference Luo, Liu and Davis2002) and spatial planning (Ligtenberg et al. Reference Ligtenberg, Wachowicz, Bregt, Beulens and Kettenis2004) as is it an efficient way to represent complex phenomena. However, in the field of studying design teams, agent-based models have been used to model collaborative behaviour as they are efficient in modelling dynamic systems, interactions and features like learning and adaptation (Fernandes et al. Reference Fernandes, Henriques, Silva and Pimentel2017; Lapp, Jablokow & McComb Reference Lapp, Jablokow and McComb2019; Cao et al. Reference Cao, MacLaren, Cao, Dong, Sayama, Yammarino, Dionne, Mumford, Connelly, Martin, Standish, Newbold, England and Ruark2020).
2.1. Synthesis of gaps and contribution
It is important to incorporate these socio-emotional factors in one’s model because they affect the collaborative process and should be considered when studying collaborative environments (Isohätälä, Järvenoja & Järvelä Reference Isohätälä, Järvenoja and Järvelä2017). Therefore, the main intention of the work lies in the use and validation of a computational framework for simulating idea selection in teams and investigating the impact of various influencer-team compositions on the design outcome. While past studies have examined social factors such as trust and hierarchy, the influencer-related social factors (like majority and influencer effect) behind idea selection have not been explicitly considered. Moreover, prior work has not studied the impact of the uneven distribution of social influence (giving rise to influencers) on the design outcome. Therefore, the following research question can be identified and addressed:
What is the effect of design teams with and without well-defined influencers on the idea selection outcome?
The design outcome from the computational agent teams was measured in terms of quality solutions (i.e., value or utility as described by Shah, Smith & Vargas-Hernandez Reference Shah, Smith and Vargas-Hernandez2003) and exploration (Dorst & Cross Reference Dorst and Cross2001). These design outcome measures show how a team of agents explore the design space and obtained the solution value, hence informing about the effectiveness of the ideas produced by a team of agents (Shah et al. Reference Shah, Smith and Vargas-Hernandez2003). Other parameters like agreement and contribution were extracted from the simulation to determine team behaviour as they helped in explaining the reason behind the design outcome values. Agreement in teams is crucial in understanding how team members are behaving over the proposed solutions. Contribution, on the other hand, is an important element for early teamwork and may change over time (Thomas-Hunt, Ogden & Neale Reference Thomas-Hunt, Ogden and Neale2003). There might be a reduction in the contribution of isolated individuals as the motivation to communicate might change (Worchel Reference Worchel, Nye and Brower1996). Hence, the contribution of agents in teams could help in understanding the behaviour of various team compositions.
According to Cialdini’s Principles of Persuasion; consensus, liking and reciprocity lead to the conversion of one’s opinion or agreement (Cialdini & Rhoads Reference Cialdini and Rhoads2001). Oyibo, Orji & Vassileva (Reference Oyibo, Orji and Vassileva2017) in their study of linking five personality traits to Cialdini’s Principles of Persuasion, found that people who are low in Openness are more susceptible to Authority, Consensus and Liking. Moreover, it is known that self-efficacy mediates Big 5 Personality traits (Stajkovic et al. Reference Stajkovic, Bandura, Locke, Lee and Sergent2018). Research on Citizen Influencers (CIs), identifies five characteristics like expertise, trustworthiness, likeability, similarity and familiarity as the main contributors that could contribute to persuasiveness (Martensen, Brockenhuus-Schack & Zahid Reference Martensen, Brockenhuus-Schack and Zahid2018). As self-efficacy and trust are the characteristics considered for influencers in this model, influencers could be considered responsible for the persuasiveness of their solutions. It is already known the amount of influence affects the opinions of team members (Das et al. Reference Das, Kamruzzaman and Karmakar2018, thus, it is possible that individuals in teams may agree more with the individuals having more degree of influence (called influencers) on their proposed solutions. Moreover, Cialdini & Rhoads (Reference Cialdini and Rhoads2001) proposed ‘reciprocity’ as one of their principles of persuasion where people tend to pay back favours done to them. By means of this ‘norm of reciprocity’, people could agree with those who have agreed with them in the past as a way of returning favours (Gouldner Reference Gouldner1960). These might affect decision-making in teams; therefore, the above research question cannot be addressed without first considering the parameters which impact an individual’s agreement when evaluating other’s proposed solution during idea selection. In order to support the model that addresses the above research question to evaluate the design outcomes based on different influencer compositions, the following assumption could be made that helps in the formation of the idea selection process:
Assumption: The perceived degree of influence by an individual and the past agreement their peers had with them, are some of the factors that affected their agreement on the proposed solutions by their team members.
Here the perceived degree of influence refers to the degree of influence that individual perceives from someone else in the team.
The research contributions could be summarised as follows; the study uses the majority and influencer effect to formulate idea selection in design teams, which have been unaccounted in many design teams’ agent-based models. Therefore, providing a framework that could be used and extended for simulating complex events during idea selection like conflict in teams. The empirical study presented in the article shows the presence of the majority and influencer effect in design teams. Moreover, revealing some of the factors affecting individuals’ agreement on other’s proposed solution during idea selection hence contributes to the design research. Lastly, the study improves our understanding of the impact of influencers on design outcomes through an agent-based model. Studying influencers in design teams is relatively new and knowing how they affect design outcome, could provide insights about their role and their influence on the team behaviour. Additionally, the study provides a model that could be used as a faster approach by future researchers to study team behaviour by adjusting it to simulate various collaboration scenarios (e.g., by changing the nature of the design task, team size or agent types).
The logic behind the model formation such as the presence of influencer and majority effect during idea selection and the assumption was supported by the empirical study. The results from the model simulation were extracted and analysed to see whether the research question is answered. The overall validation of the simulation results through empirical studies is challenging, hence the empirical study is being used to test the model formation logic and to support the assumption. The following section briefly describes the idea generation part of the current model that was originally published by Singh et al. (Reference Singh, Cascini and McComb2021) and the idea selection part in detail with some literature supporting its formation.
3. Model description
Most of the collaborative studies using agent-based models have focused on collaborative optimisation where an optimal strategy is used to achieve the best design solutions. However, many researchers have argued that co-design teams in the real world do not follow any optimal strategy but a more naturalistic approach. Simon (Reference Simon1981) stated that the idea generation process cannot be an optimising one because of limited information-processing capacity in human designers. Rather, designers apply a satisficing principle, where they search for any acceptable solution to a design problem and then get fixated around such a solution once it is identified (Simon Reference Simon1981). Thus, the model represents design as a search process (i.e., when the design goals are defined at the beginning and focus of the design is not changed till the solution is found) as well as it has some of the elements of an exploration model (i.e., the parts of solution space are explored, however, the expansion in the solution space with changes in the design focus is not implemented) (Maher & Tang Reference Maher and Tang2003). The model could be considered as a computational exploration type, whose aim is not only to study specific phenomena but to build a system that is capable of representing collaboration during team experimentations (Simon Reference Simon1995).
According to the theory of organisational creativity, the relationships among individuals, team, social and contextual influences, environment and project are present thus, changes in any of these elements, impacts project outcomes (Woodman, Sawyer & Griffin Reference Woodman, Sawyer and Griffin1993). A subset of the elements mentioned by Woodman et al. (Reference Woodman, Sawyer and Griffin1993), like design problem type, team size, team composition, and individual characteristics (like self-efficacy) were considered in the presented model. The input-mediator-outcome (IMO) framework for team effectiveness (where mediating mechanisms are because of cognitive, motivational or affective states) suggests that feedback from one session (episode) influences the outcome and process on subsequent input, therefore team states are influenced by their progress over time (Ilgen et al. Reference Ilgen, Hollenbeck, Johnson and Jundt2005). Similarly, as shown in Figure 1, design team collaboration starts in the form of a project that consists of a variable number of sessions of idea generation and idea selection and at the end of each idea selection session, a controller agent provides feedback for that session. Each design project has a set of design agents and a controller agent who is responsible for assigning the task, evaluating the solution quality and providing the team with its feedback. The controller agent (analogous to a project leader, manager or others in a similar role) could be considered similar to an external leader in self-managing teams who provide direction from outside of the team but are not involved in the team’s routine activities (Morgeson Reference Morgeson2005). The design activity represented in the model could be equivalent to a real-world scenario where a design team is given a task, they work this task in multiple design sessions, get feedback from their project leader at the end of each session and implement the learning from the previous session to another. Olson et al. (Reference Olson, Storrøsten, Carter, Herbsleb, Rueter, Moran and Carroll1996), studied 10 design sessions of different projects and found that a large amount of time is spent on generating alternatives (i.e., exploring the design space). Thus, each idea generation in the model consists of several steps which are analogous to an agent thinking and exploring the solution space before proposing its solution to the team.
Simulation layout of a design project.

3.1. Agents generating solutions
Like any real-world collaboration design activity, the simulations start with a design task being given to the team of agents to generate solutions. The design problem function could be represented as an n-dimensional space, where each dimension represents the design aspects or design variables (an example seen in Figure 2).The n-dimension nature of the task is related to the number of design variables, thus increasing the dimensions, could increase the complexity of the design task. The various configuration of the design variables would result in a different outcome. In this aspect, the computational design task fulfils some aspects of configuration design problems, where the components (variables) are fixed and are used to design an artefact, and these components cannot be modified (Mittal & Frayman Reference Mittal and Frayman1989). However, only two design variables were considered for the given results in the article for simplification and for reducing the computational load. A similar 2D design space concept was considered for simplification (Cao et al. Reference Cao, MacLaren, Cao, Dong, Sayama, Yammarino, Dionne, Mumford, Connelly, Martin, Standish, Newbold, England and Ruark2020) and visualisation (Lapp et al. Reference Lapp, Jablokow and McComb2019) purposes. The design solution space is modelled in such a way that there is a gradual slope between the best (solution value 1 in lightest hue) and worst (solution value 0 in darkest hue) solutions, hence the subtle decrease in the hues around the best solution values. This representation of the design task with a smooth change in the solution value was chosen to imitate the real-world representation of a stable design task with robust solutions, that is, a task that has fewer variations or a gradual slope (of intermediate values) between the best and the worst solution (for more details see Singh et al. (Reference Singh, Cascini and McComb2021)). The design task resembles a search task with a fixed design space and variables (i.e., its dimensions). Any point on a design space defines a potential solution to the design problem and has a value, referred to as quality in the article.
Design team collaboration: study layout.
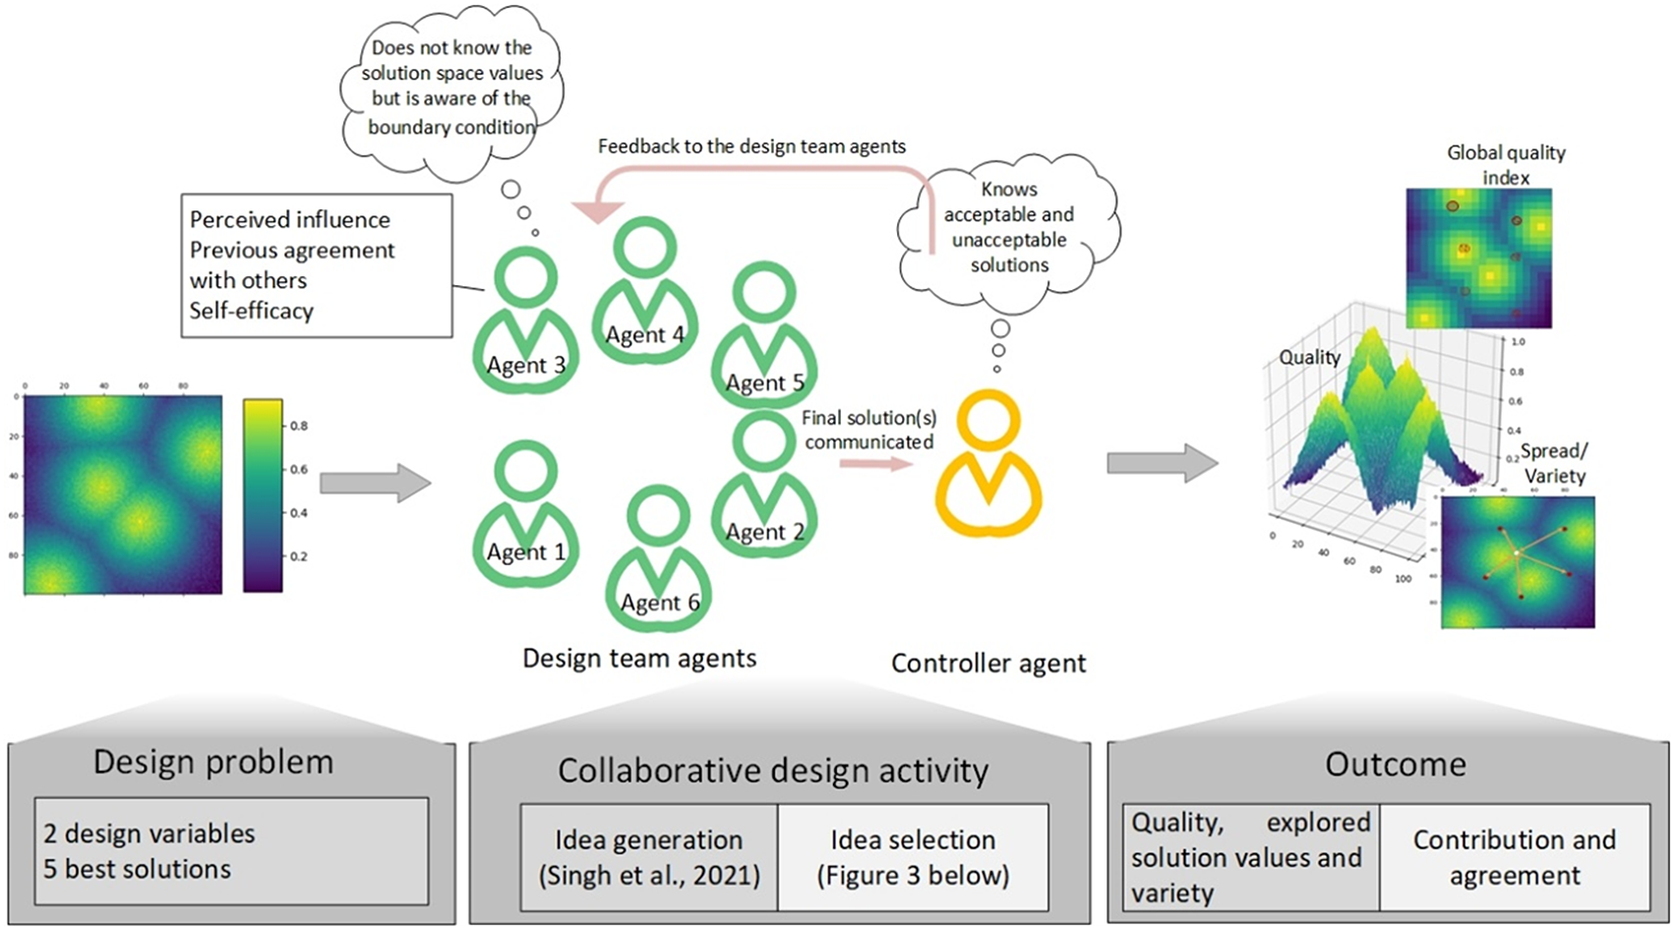
Often in the real world, at the beginning of the activity, the designers do not know the correct configuration of the design variables that would result in the best value. The agents in the model at the beginning of the simulation are also unaware of the configuration of the design variables that would have a good solution value. They go by trial and error. Though the design agents do not know the values of the design space, they are aware of the limits of the solution space. Human designers, in many cases, are also aware of the constraints when proposing a solution (size, weight, material and so on) and when they propose a solution that does not respect these constraints, they correct themselves. Likewise, agents in the model correct themselves if they propose a solution outside the limits of the solution space. An agent moving in design space is equivalent to an individual generating alternative solutions during idea generation. When an agent moves from one point to another (i.e., from one solution to another) it forms a step, and several steps form a path (equivalent to an individual’s flow of thought) that an agent takes before selecting a solution or forming an opinion that it will communicate to its team. The size of the ‘step’ is a predetermined parameter of the model. The size of the step was chosen such that an agent does not land on the boundaries of the design space immediately after it starts moving. The direction in which an agent moves, indicates the parameters of the solution that the agent is changing. The direction is the sum of vectors resulting from a current knowledge (which incorporates randomness, i.e., solution completely unrelated), vectors from self-learning from the past and learning from the influential agents in the team (Singh et al. Reference Singh, Cascini and McComb2021). If an agent generates a solution outside the design space, it is brought back to the boundary, a step vector is calculated and checked if it lies within the design space. Based on this step vector, an agent could go on the other side or remain at the boundary (like designers after correcting themselves could propose a similar or a completely different solution). The number of peaks represent the best alternative solutions and increasing the number of peaks, would increase the ease of finding a good solution, hence decreasing the complexity of the design task. The results of the design outcome presented in the article are related to the solution space with five best solutions or five peaks where peaks denote the best alternative options.
3.2. Agents selecting ideas
The agent-based model used to study opinion dynamics in teams due to social influence can be classified into three types: models of assimilative social influence, models with similarity biased influence, and models with repulsive influence (Flache et al. Reference Flache, Mäs, Feliciani, Chattoe-Brown, Deffuant, Huet and Lorenz2017). The repulsive influence models are based on changes in the dissimilarity of solutions, where individuals’ influence could lead to an increase in the differences in mutual opinions. The presented model in this article closely fits in the category of models with assimilative social influence (‘models in this class are based on the assumption that if two individuals are connected by an influence relationship, they will always exert influence on each other towards reducing their opinion differences (assimilation)’) and models with similarity biased influence (‘models in this class are under the assumption that a similarity bias can generate a self-reinforcing dynamic in which agreement strengthens influence and influence leads to greater agreement with those who already have a similar opinion’) (Flache et al. Reference Flache, Mäs, Feliciani, Chattoe-Brown, Deffuant, Huet and Lorenz2017). Models with assimilative social influence led to a reduction in opinion differences and all agents eventually align with the emergent consensus while models based on similarity, could result in opinion clusters based on similarity in agents’ opinions (Flache et al. Reference Flache, Mäs, Feliciani, Chattoe-Brown, Deffuant, Huet and Lorenz2017). Overall, depending on the self-efficacy distribution in teams that affects influencer formation and the distributions of initial opinions of agents, the simulation may result in consensus formation based on coalition groups’ opinion clusters or group polarisation. The following sections explain the idea selection process.
Agents ready with their solutions in their mind
The design team activity consists of idea generation and idea selection. In idea generation, agents generate solutions based on a set of rules that are given in Singh et al. (Reference Singh, Cascini and McComb2021). Agents generate solutions in their minds based on (a) their way to explore solution space, (b) memory and recalled ability, (c) learning from their past events and (d) the effect of the influencers. Singh et al. (Reference Singh, Cascini and McComb2021) show how an agent’s experience and influencers in a team affect an agent’s idea generation approach. Idea selection comprises team interaction and decision-making (Figure 3). The team interaction starts after the design team agents are ready with their solutions to communicate with the team (step 1 in Figure 3). The idea selection process that can be seen in Figure 3 is elaborated in the sections below.
Flow of processes during idea selection in a design session.

Proposing solutions
As it is known that communication is key in the design process and communication depends on the individual’s self-efficacy level. Self-efficacy mediates the five big personality traits, including extrovertism (Stajkovic et al. Reference Stajkovic, Bandura, Locke, Lee and Sergent2018) and other studies like Cao et al. (Reference Cao, MacLaren, Cao, Dong, Sayama, Yammarino, Dionne, Mumford, Connelly, Martin, Standish, Newbold, England and Ruark2020), also found that talkative agents (an extrovert characteristic in agents) are perceived as more influential. Therefore, even though all individuals generate ideas, some might not be enough confident to propose to their peers as seen in step 2 in Figure 3. In the current model, there is a low probability that all the agents will propose solutions. Agents, who have higher self-efficacy than others, communicate their ideas more often. However, the possibility of a low self-efficacy agent proposing its solution to the team is not completely eliminated. The number of agents who are selected to propose their solutions is given in Eq. (1).
 $$ {N}_{\mathrm{Min}}\hskip0.35em \le \hskip0.35em \left({N}_{\mathrm{SA}}\right)\hskip0.35em \le \hskip0.35em {N}_{\mathrm{tot}}, $$ $ {N}_{\mathrm{Min}} $
are the minimum number of agents that should at least propose solutions. Based on educational experiences as described by authors in their studies (Reid & Reed Reference Reid and Reed2000; Lahti, Seitamaa-Hakkarainen & Hakkarainen Reference Lahti, Seitamaa-Hakkarainen and Hakkarainen2004) as well as a common observation made during the experiment presented in this study that more than 30% of individuals in small design teams (i.e., 5–7 individuals) propose solutions during a session (step 2: proposing ideas to the team in Figure 3). Since the model simulates a team of six agents,
$ {N}_{\mathrm{Min}} $
are the minimum number of agents that should at least propose solutions. Based on educational experiences as described by authors in their studies (Reid & Reed Reference Reid and Reed2000; Lahti, Seitamaa-Hakkarainen & Hakkarainen Reference Lahti, Seitamaa-Hakkarainen and Hakkarainen2004) as well as a common observation made during the experiment presented in this study that more than 30% of individuals in small design teams (i.e., 5–7 individuals) propose solutions during a session (step 2: proposing ideas to the team in Figure 3). Since the model simulates a team of six agents, $ {N}_{\mathrm{Min}} $
here was taken to be 3.
$ {N}_{\mathrm{Min}} $
here was taken to be 3. $ {N}_{\mathrm{SA}} $
is the number of selected agents that propose solutions out of the total number of agents in a team N
tot.
$ {N}_{\mathrm{SA}} $
is the number of selected agents that propose solutions out of the total number of agents in a team N
tot.
The probability of an agent being selected to propose its solution (P SA) depends on how the self-efficacy is varied in the team Var (TeamSE).
 $$ {P}_{\mathrm{SA}}\alpha\;\mathrm{Var}\left({\mathrm{Team}}_{\mathrm{SE}}\right), $$
 $$ \mathrm{Var}\left({\mathrm{Team}}_{\mathrm{SE}}\right)\hskip0.35em =\hskip0.35em \frac{\sum_{i=1}^{N_{\mathrm{tot}}}{\left({\mathrm{SE}}_i-\mu \right)}^2}{N_{\mathrm{tot}}}, $$
where μ is the mean of the self-efficacy of agents in a team and SE is the self-efficacy of an agent i. This means that there is a high probability of all the agents who are selected (or selected agents, SA) to propose their solution have high self-efficacy when the team self-efficacy variance is high. When the team self-efficacy variance is low, that is, all the agents have either low self-efficacy or high, agents are randomly selected to propose their solutions. Cases when then N SA is higher than the number of agents with high self-efficacy, additional low self-efficacy agents are selected randomly selected to propose their solutions. Agents who did not propose their solution still have their solution in their minds that will be regarded as opinions for the further decision-making process.
Merging of solutions
After individually generating ideas, collective work is required. Likewise, at this stage at step 3 in Figure 3, agents who have proposed their solutions merge similar ones. The similarity between the solutions is computationally defined as the distance between the solution points on s design space, that is, the two solutions are similar if they are close to each other on a solution space. Merging similar solutions uses the k-means clustering method. k-means clustering is a popular and simplest cluster analysis method in data mining that uses Euclidean distances between points for a given number of k (clusters). However, in order to define the value of k, one approach is to try different values of k, for example, one can start with k = 1, k = 2 and so on until k = total number of solutions (data points), by comparing the variation within the clusters (Steorts Reference Steorts2017). In this work, k is chosen randomly and lies between 2 < k < $ {\mathrm{Num}}_{\mathrm{totSoln}}-2 $
where
$ {\mathrm{Num}}_{\mathrm{totSoln}}-2 $
where $ {\mathrm{Num}}_{\mathrm{totSoln}} $
is the total number of solutions. By choosing k within this range would give optimal and near-optimal values of k. The using near-optimal values of k in the model could be justified by the presence of environmental noise or other unaccounted factors, which affected the optimal way of merging similar solutions (data points).
$ {\mathrm{Num}}_{\mathrm{totSoln}} $
is the total number of solutions. By choosing k within this range would give optimal and near-optimal values of k. The using near-optimal values of k in the model could be justified by the presence of environmental noise or other unaccounted factors, which affected the optimal way of merging similar solutions (data points).
For the clustering (i.e., merging) similar solutions proposed by the agents, python’s Scikit-learn machine learning library was used. The flowchart for getting the solutions that should be merged is given in Figure 4. The merged solution that becomes the new common proposed for the selected agents in the cluster is the centroid. k-means aims at minimising an objective function given in Eq. (4).
 $$ J(V)\hskip0.35em =\hskip0.35em {\sum}_{i\hskip0.35em =\hskip0.35em 1}^c{\sum}_{j\hskip0.35em =\hskip0.35em 1}^{c_i}{\left(\left|\left|{S}_i-{v}_j\right|\right|\right)}^2, $$
where ||Si − vj || is the Euclidean distance between Si and vj (S is the set of positions of the solutions points and vj is the positions of the centroids. c is the number of clusters and ci is the number of solutions in cluster i.
Flowchart for merging similar solutions.

Coalition groups of like-minded agents
Most of the literature focuses on strategies for decision making that is used to assist decision-makers to solve problems in a systematic and consistent manner to reach optimal solutions. However, here the goal of this study is not to simulate agents to make an optimal decision but to understand how different team dynamics affect the design outcome. Petit & Bon (Reference Petit and Bon2010) identified some rules related to the individual (based on inter-individual differences in physiology, energetic state, social status, etc.) and (or) self-organised (context and group size) state that could govern the collective decision-making in animals. Some of the rules stated in their work were selected to have a simple and useful simulation. These are related to individualization where self-efficacy state and social status (degree of influence as perceived by others) were considered, and others related to self-organisation was the size of the majority group. Taking this into consideration steps 4 and 5 in Figure 3 shows that during decision-making the individuals’ opinion could be affected by the (a) the influencer’s effect (stated as expert effect ‘induced by the presence of a highly confident individual in the group’) or (b) the majority effect ‘caused by the presence of a critical mass of laypeople sharing similar opinions’ (Moussaïd et al. Reference Moussaïd, Kämmer, Analytis and Neth2013).
The majority effect (in Steps 4 and 5 of Figure 3) is based on Cartwright (Reference Cartwright1971) model of choice shift that explains why group decision making is more complicated than just taking an average of group members’ decisions. Cartwright (Reference Cartwright1971) stated two subtypes of majority influence processes: coalition process and pure majority process. Coalition (step 4) takes place when the judgements (opinions) of individuals are close to each other and it tends to dominate the group judgement process. Majority process (step 5), where the judgement of a larger (majority) group of individuals influences the judgement of other team members. Both coalition and majority process contribute to majority influence such that the influence of individual team members or influencer(s) is less effective during decision-making. However, in the case when all the individuals are closer (have a similar opinion) to that of an influencer, its effect would be exaggerated.
-
(i) Coalition groups of ‘like-minded’ agents:
Some studies of social network show that opinions in a social network suffer locality effect, that is, they get localised to given groups without infecting the whole society (Wu & Huberman Reference Wu and Huberman2004) The team members in the real-world communicate during the decision-making process and they would be aware of each other’s thoughts on the solutions. Similarly, each agent at this point after step 3 is aware of the other agents’ proposed solutions and opinions and form coalition groups with (as shown in Figure 5) (a) the agent(s) who have proposed the solution or (b) to the agent(s) who did not propose any solutions. (c) Agents could also not be a part of these coalition groups. The (a) and (b) occur when their opinion on the problem is similar to that of the other (Cartwright Reference Cartwright1971; Read & Grushka-Cockayne Reference Read and Grushka-Cockayne2011). Computationally this means that the distance between their proposed solution/opinion (not a proposed solution) and other members’ solution/opinion are close such that they form a coalition group. The groups formed based on similar opinions behave collectively when evaluating proposed solutions. Case (c) occurs when an agent’s opinion is not similar (close) to the others, hence it stays alone.
-
(ii) Deciding which solution to choose:
In collaborative design sessions, the design team is not directly aware of the quality of their solutions, was inspired from the real-world representation where, when the designers start working (and they have no past experience similar to the agents in this case), they go by trial and error. However, unlike humans who have an intuition or long-term memory that help them to get an idea about the quality value of their solutions, agents in the model are not capable of doing so. Agents in the model are also not informed of the design solution space, that is they do not know the quality values of the solutions. Thus, in this perspective, when deciding which solution to choose, the agents go by the confidence level of the proposing individual/group. The majority of the models of opinion formation in groups are based on the confidence level of agents (Hegselmann & Krause Reference Hegselmann and Krause2002). Therefore, the two behavioural factors that were considered when deciding on which solution(s) to select are the number of agents in the coalition group and their self-efficacies. The first factor was chosen as it is known that influence increases with the number of individuals in the group (to a certain point) (Bond Reference Bond2005), hence affecting other team members’ actions during decision-making. The second factor was chosen as individuals with lower self-esteem, those who are dependent on and those who have a strong need for approval from others are also more conforming (Jhangiani & Tarry Reference Jhangiani and Tarry2014). Thus, similar to the real world, the model also behaves in a manner where more and more individuals have the same opinion, a less confident individual is likely to act like a ‘sheep’ and a more confident one is independent to think for itself when evaluating the proposed solutions. For example: if there are three agents with low/average self-efficacy and two agents with high self-efficacy, the sum of self-efficacies of agents in a group is calculated (Figure 5). If the three agents with low/average have higher or similar self-efficacy sum than the other group (i.e., in this case, two agents with high self-efficacy), they would not change their mind and will stick to their solution. If the sum of three agents with low/average self-efficacies is lower than two agents with high self-efficacy, the former group would go with the solution proposed by the group of two agents (explained in detail in the following sections).
This majority influence is explained by the coalition and majority process, where the behaviours and beliefs of a larger (majority) of individuals in a coalition group influence the behaviours and beliefs of a smaller group (Nemeth Reference Nemeth1986). This happens when the group of ‘like-minded’ agents have higher cumulative self-efficacy than those who proposed the solution. Hence, it is more likely that the latter group of agents (or an agent) will agree with the former group (DeRue et al. Reference DeRue, Hollenbeck, Ilgen and Feltz2010). On the contrary, when the cumulative self-efficacy of the coalition group is less than other groups/individuals, minority influence occurs, and the group is likely to agree with the proposed solution of the influencer(s). Similarly, studies like Hegselmann & Krause (Reference Hegselmann and Krause2002) simulated symmetric or asymmetric confidence in team agents. They found that when all agents had similar confidence (symmetric confidence) the opinions split into many. In contrast, asymmetric cases resulted in convergence into the direction that was governed by asymmetric confidence profiles (Hegselmann & Krause Reference Hegselmann and Krause2002).
An example of a decision-making scenario during Idea selection.

As an example shown in Figure 5, whether an agent is in a coalition group or alone, self-efficacy decides whether to agree with the proposed solution or not. When the self-efficacy is lower than the compared group/individual, how much an agent (i) agrees (A) with the other agent’s (j) proposed solution depends on two factors is given in Eq. (5). Agreement is often represented as binary (i.e., yes/no or agree/disagree) and it is not possible to distinguish between moderate and extreme values. In the social opinion formation model, individuals are affected by their peers in a socially connected system (Nguyen et al. Reference Nguyen, Xiao, Xu, Wu and Xia2020). Thus, they could have a range of agreement values, in other words, they could agree more with some and slightly less with others (Sîrbu et al. Reference Sîrbu, Loreto, Servedio and Tria2017). Based on this, the agreement in the model is not binary but a continuous value that depends on the following factors (as hypothesised at the beginning):
-
(i) The amount of influence (I) ‘proposed solution agent’ j has on the agent i who is evaluating its support to the proposed solution.
-
(ii) The past amount agreement ( $ {P}_A $
) agent j had while deciding on agent i’s proposed solution.
$ {P}_A $
) agent j had while deciding on agent i’s proposed solution.

 $$ {A}_i^j\left(I,{P}_A\right)\hskip0.35em =\hskip0.35em {w}_1\left({I}_i^j\right)+{w}_2\left({P_A}_j^i\right). $$
The weights ( $ {w}_1\hskip0.20em and\;{w}_2 $
) used in Eq. (5) were taken as 0.5.
$ {w}_1\hskip0.20em and\;{w}_2 $
) used in Eq. (5) were taken as 0.5.
 $$ {I}_i^j\left(\Delta \mathrm{SE},\mathrm{SE},T\right)\hskip0.35em =\hskip0.35em {w}_3{\left(\Delta {\mathrm{SE}}_{i-j}\right)}^{1.5}+{w}_4\left({\mathrm{SE}}^j\right)+{w}_5\left({T}_i^j\right), $$
where $ I $
is the degree of influence from agent j perceived by agent i, which is given below as a function of
$ I $
is the degree of influence from agent j perceived by agent i, which is given below as a function of $ \Delta \mathrm{SE},\mathrm{SE}\;\mathrm{and}\;T. $
is the difference in self-efficacy of agent i and agent j, T is the degree of trust agent i has on agent j.
$ \Delta \mathrm{SE},\mathrm{SE}\;\mathrm{and}\;T. $
is the difference in self-efficacy of agent i and agent j, T is the degree of trust agent i has on agent j. $ \mathrm{SE} $
is the self-efficacy of an agent j (a more detailed discussion on this formulation is given in Singh et al. (Reference Singh, Cascini and McComb2021)). The self-efficacy of the two agents are compared, that is, if SEi > SEj then the
$ \mathrm{SE} $
is the self-efficacy of an agent j (a more detailed discussion on this formulation is given in Singh et al. (Reference Singh, Cascini and McComb2021)). The self-efficacy of the two agents are compared, that is, if SEi > SEj then the $ {\Delta \mathrm{SE}}_{i-j} $
= 0. Otherwise, the absolute value of
$ {\Delta \mathrm{SE}}_{i-j} $
= 0. Otherwise, the absolute value of $ {\Delta \mathrm{SE}}_{i-j} $
is calculated and the influence of j on i is calculated as shown in Eq. (6). This considers the impact of
$ {\Delta \mathrm{SE}}_{i-j} $
is calculated and the influence of j on i is calculated as shown in Eq. (6). This considers the impact of $ \Delta \mathrm{SE}\;\mathrm{and}\;\mathrm{SE}\;\mathrm{on} $
a low self-efficacy agent, and the impact on
$ \Delta \mathrm{SE}\;\mathrm{and}\;\mathrm{SE}\;\mathrm{on} $
a low self-efficacy agent, and the impact on $ \mathrm{SE} $
on a high SE agent when they perceived influence from their peers (as proposed in Singh et al. Reference Singh, Cascini and McComb2021).
$ \mathrm{SE} $
on a high SE agent when they perceived influence from their peers (as proposed in Singh et al. Reference Singh, Cascini and McComb2021).
Controller agent actions
Before the solution(s) are communicated to the controller agent who is analogous to the project manager, project leader, professor or others in a similar position (step 6), the total agreement (A total) on a proposed solution (ps) is calculated (as Eq. (7)) for all the proposed solution.
 $$ {A}_{{\mathrm{total}}_q}\hskip0.35em =\hskip0.35em {\sum}_{i\hskip0.35em =\hskip0.35em 1}^{N_A}{A}_i, $$
∀q∈{ps 1, ps 2…, psQ} where Q is the number of proposed solutions. NA is the total number of agents who agreed with the proposed solution (ps) and i as the initial starting index.
At times, it is seen that the design team selected one final or multiple concepts. Here the maximum number of solutions was chosen to be 3 that was based on common observation as well as the teams in the empirical study were asked to select up to 3 concepts final concepts for their presentation to the experts. To simulate similar behaviour in the model to decide whether one or multiple solutions are proposed to the controller agent, the distribution of the total agreement (A total) for all proposed solutions is calculated as in Eq. (8). In other words, the probability of the design team to propose one final solution to the controller agent is more when the distribution is high (i.e., high agreement on some proposed solutions) (Sîrbu et al. Reference Sîrbu, Loreto, Servedio and Tria2017). Conversely, there is a higher probability that the agents would propose three solutions to the controller agent when the distribution of the agreements on the proposed solution is low (i.e., similar agreement values on all the proposed solutions), thus, there is no clear dominant solution.
 $$ \mathrm{distribution}\left({A}_{\mathrm{total}}\right)\hskip0.35em =\hskip0.35em \sqrt{\frac{\sum_{q\hskip0.35em =\hskip0.35em 1}^Q{\left({A}_{{\mathrm{total}}_q}-\mu \right)}^2}{Q}}, $$
Q = number of proposed solutions at the end of step 1 (Figure 3), q is the starting index and μ is the mean.
When the other team agents select one or more solutions to communicate to the controller agents, the self-efficacy of the agents whose solutions or merged solutions were selected increases. While the self-efficacy of those whose solutions were not selected decreases.Footnote 1
The controller agent can assess the solutions proposed by the team and give feedback (e.g., a senior designer, project manager, leader and others in similar roles who evaluate the outcome of a team of novice or less experienced designers or students) as seen in Eq. (9). The feedback is based on a probability ( $ {P}_{\mathrm{feedback}} $
) that a randomly generated number will be smaller than the solution quality value. There is a higher probability of getting a higher feedback value when the quality of the solution is high. However, the probability of getting lower feedback value on a high-quality solution is not completely eliminated as in real-world teams often fail despite having a good concept due to external factors (such as wrong market timing or change in the consumer behaviour). Alternatively, there is a very small chance of getting good feedback on a bad quality solution.
$ {P}_{\mathrm{feedback}} $
) that a randomly generated number will be smaller than the solution quality value. There is a higher probability of getting a higher feedback value when the quality of the solution is high. However, the probability of getting lower feedback value on a high-quality solution is not completely eliminated as in real-world teams often fail despite having a good concept due to external factors (such as wrong market timing or change in the consumer behaviour). Alternatively, there is a very small chance of getting good feedback on a bad quality solution.
 $$ \mathrm{feedback}\hskip0.35em =\hskip0.35em {P}_{\mathrm{feedback}}. $$
 $$ {P}_{\mathrm{feedback}}\alpha \hskip0.35em \mathrm{solution}\ \mathrm{quality}. $$
In this case, when multiple concepts are proposed to the controller agent, it picks the concept with the highest quality and shares that information with the team. Good feedback (above average, in this case, 0.5) results in an increase in self-efficacy of the design team agents and low feedback decrease self-efficacy. The amount of increase and decrease in self-efficacy depends on the current self-efficacy level of an agent (Singh et al. Reference Singh, Cascini and McComb2020). Besides affecting self-efficacy, the reputation of agents is also updated (Singh et al. Reference Singh, Cascini and McComb2021).
4. Empirical study
The exploratory experiment was conducted to get some initial insights to understand the underlying factors of decision-making during idea selection. The aim of the empirical experiment was to gather knowledge about the real world and check if similar relationship logic exists among the model parameters, rather than validating the overall results of the model simulation. The presented empirical study was used for the following:
-
(i) Verify the model logic: To provide logical verification of the presence of the two social factors in the real-world idea selection, the empirical study was done to get some hints.
-
(ii) Findings to support the assumption: To suggest that the perceived degree of influence by individuals is one of the factors affecting their agreement when evaluating proposed solutions by other team members. Additionally, the data analysis was also indicative of individuals’ agreement being affected by their peer’s agreement with them.
4.1. Experiment description
This exploratory study was done during the EU’s Erasmus+ project called ELPIDFootnote 2 where 5 teams of 8 students from different universities worked on a design task for 3 days. The data was collected from a co-design workshop with 40 MS students of Mechanical Engineering from universities located in 4 different European countries (Italy, Croatia, Slovenia and Austria). The student population ranged from 23–27 years with 38 males and 2 females. The workshop was carried out at Politecnico di Milano, within the second year of activities of the E-learning Platform for Innovative Product Development (ELPID) project. The workshop was a sprint to introduce students to ideation techniques. The data collection was done once (at the end of Day 2). Each team had students from different universities, working on a design problem after attending lectures on concept generation and selection. Each team had at least one tutor to support and monitor them throughout the process. These tutors also provided insights to the authors related to the team dynamics of their teams. At the end of the workshop, teams were asked to present at least one best (and a maximum of three best solutions) to the experts. The experts were professors from different universities and judged the overall quality of the solutions based on the fulfilment of the given requirements, novelty and feasibility. The design task required students to ideate and develop a concept for an entertainment system in the university campus of Politecnico di Milano at Lecco that could help students to relax and integrate them with the local population. The conceptual solutions that were the form of sketches had to be compatible with a budget, fit with the current structure of the campus, and be self-sustainable.
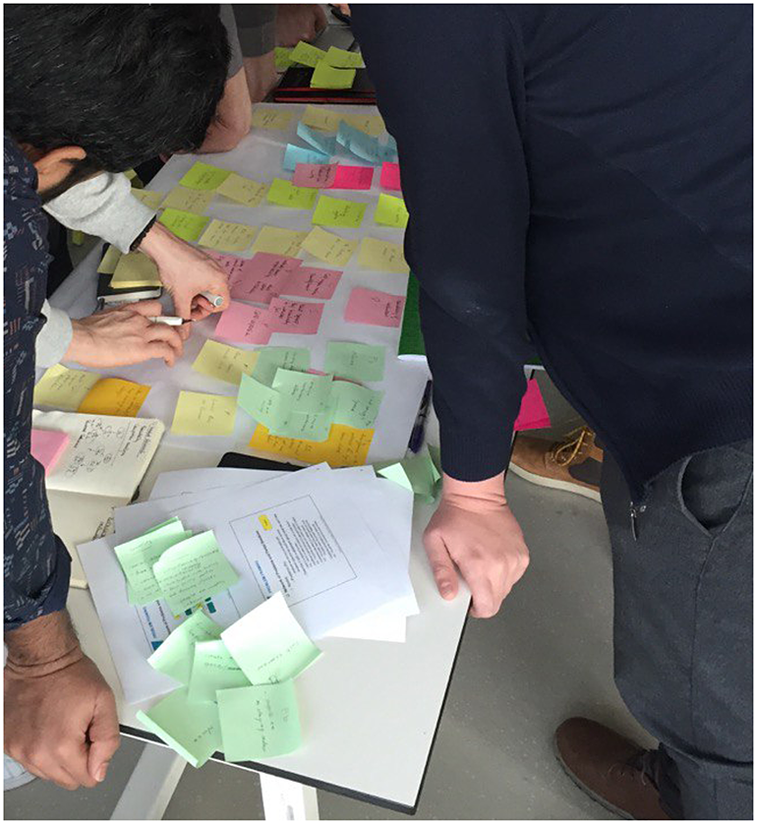
Data collection was done in the form of a short Likert scale survey and designed to be completed by the participants quickly, so as not to distract from their design efforts. The survey questions were direct. The explanation to every question and a definition of the key terms were provided to clear any ambiguity. It was not mandatory for the participants to take part in the surveys. To maintain the anonymity of the participants, colour codes were used. For example (seen from Figure 6), team C had pink, yellow, blue, green, pastel pink and so on as its members and the participants referred to these colour codes while answering questions about their peers. The format of the questions related to peer evaluations was based on work by Ohland et al. (Reference Ohland, Loughry, Woehr, Bullard, Felder, Finelli, Layton, Pomeranz and Schmucker2012).
An image showing one of the teams in action during the workshop.
The questions in the survey included the following and their explanations and definitions based on the references cited next to them (Table 1).
Questionnaire content

4.2. Empirical study results and discussion
From the empirical study, 40 responses were collected but only 29 participants completed the open-ended question. The analysis of the answers to the open-ended question in the survey was done using the python programming language’s Natural Language Processing toolkit (Bird, Klein & Loper Reference Bird, Klein and Loper2019) as it could help in deciding which sequence can be chunked together to form single entities. The text data was cleaned from nonalphabetic characters and stop words (like ‘on’, ‘is’, ‘the’ and so on) before lemmatizing it (Bird et al. Reference Bird, Klein and Loper2019). The n-grams that are all combinations of adjacent words of length n that can be found in the given source text were used to capture the language structure from the statistical point of view determining the word that is likely to follow the given one (Jurafsky & Martin Reference Jurafsky and Martin2019). In this case, as the responses were short, word-level bigram (where n = 2) that is most used and is successful for smaller corpora was used than trigram used for larger corpora (millions of words). Using a bigram model, a sequence of two adjacent elements was extracted and the pair counts were plotted for Figure 7. Figure 7 shows a pairwise count of the words that occurred while analysing the opened ended question about what makes an individual agree with the other when he/she proposes a solution to the team. It can be seen from the pairs which popped out that ‘similar thinking’, ‘good idea’, ‘thinking good’, ‘good communication’ and ‘idea similar’ were the most commonly perceived answers by the respondents. Two things could be inferred from these word pairs:
Pairwise count of the words that occurred when analysing answers to the open-ended question.
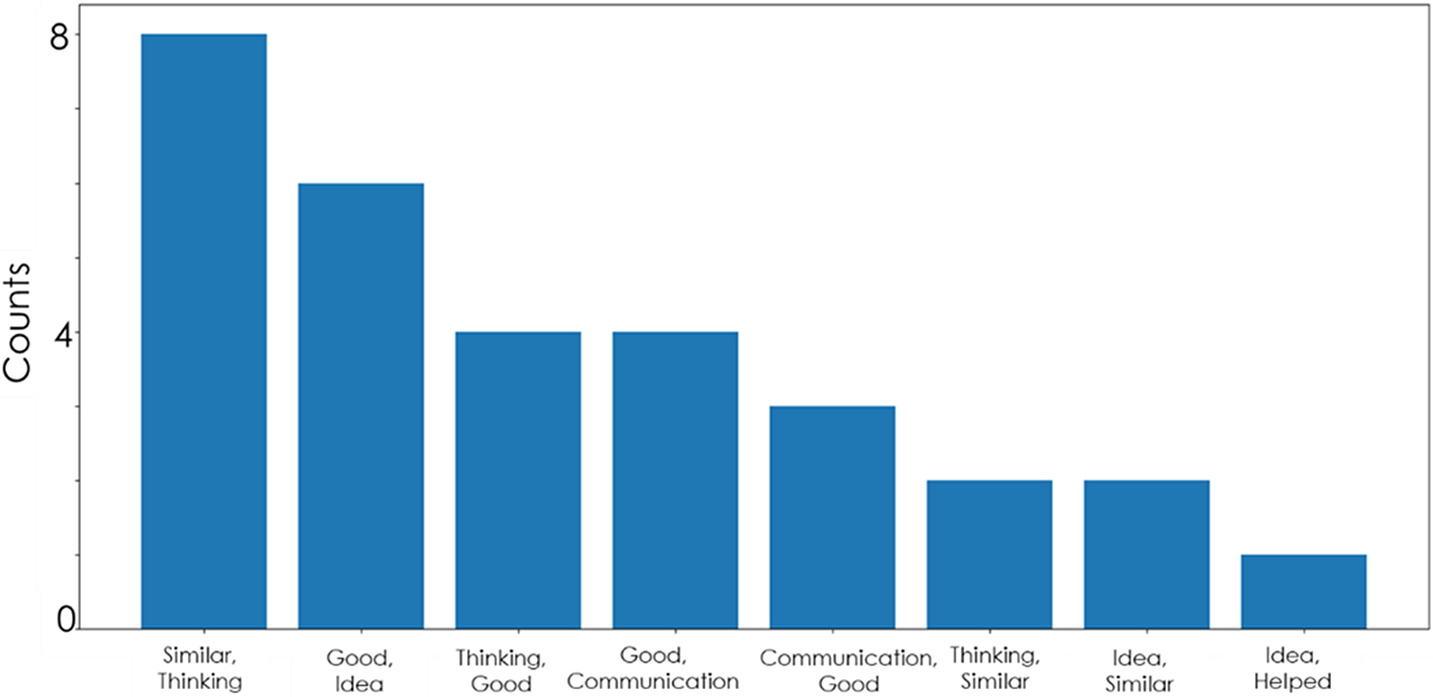
Word pairs like ‘similar thinking’, ‘idea similar’ or ‘thinking similar’ clearly indicate that individuals go with the idea proposed by the other individual when they think it is similar to the one they thought. Hence, justifying the formation of coalition groups based on similar ideas (Cartwright Reference Cartwright1971).
Word pairs like ‘good idea’ and ‘thinking good’ show that an individual will agree with the other’s proposed solution when he/she perceives it to be ‘good’. As is it known that the perceived influence from others in the team could change one’s perception of value or opinion (in this case what solution is attractive or good), postulates the presence of influence effect when agreeing on solutions in teams (Campbell-Meiklejohn et al. Reference Campbell-Meiklejohn, Bach, Roepstorff, Dolan and Frith2010). This could also be due to the presence of Informational influence which occurs when an individual looks to other team member’s guidance as he/she is uncertain about his/her opinion, hence, the effect of influencer prevails (Deutsch & Gerard Reference Deutsch and Gerard1955). From the other word pairs like ‘good communication’ or ‘communication good’, it can be deduced that effective communication is a key trait of individuals that is mediated by self-efficacy (Stajkovic et al. Reference Stajkovic, Bandura, Locke, Lee and Sergent2018; Cao et al. Reference Cao, MacLaren, Cao, Dong, Sayama, Yammarino, Dionne, Mumford, Connelly, Martin, Standish, Newbold, England and Ruark2020), and it is known that self-efficacy is one of the characteristics of an influencer (Singh et al. Reference Singh, Cascini and McComb2021). Hence, the individuals’ decision-making could have been affected by the influencer(s) ‘good communication’.
Figures 8 and 9 show the correlation plots where the size of the dots in these figures indicate the number of data points and the regression line. It can be seen that there is a positive correlation between an individual’s agreement with the others’ proposed solutions and the perceived influence from the other individual in the team (Kendall τ = 0.52, p-value < 0.001), hence supporting the assumption that is a relationship between agreement and influence. Thus, complementing the study where ‘high social rank’ individuals have a larger effect on opinion formation than individuals with low rank (Wu & Huberman Reference Wu and Huberman2004). Complementary findings by Thomas-Hunt et al. (Reference Thomas-Hunt, Ogden and Neale2003) also stated that socially connected group members evaluate individuals more positively whom they favour. In addition to the perceived degree of influence, the agreement was also positively correlated to the amount of agreement the other individual had when the individual (who is deciding) proposed its solution (Kendall τ = 0.55, p-value < 0.001). This may be evidence of the ‘norm of reciprocity, behaviour in social psychology where individuals feel obligated to return the favours that are done for them by others (Gouldner Reference Gouldner1960).
Correlation between agreement and influence (it shows the regression line and the size of the dots that indicate the number of data points).

Correlation between agreement and past agreement (it shows the regression line and the size of the dots that indicate the number of data points).

Summary of the empirical results
The model assumes that the perceived degree of influence by an individual and the past agreement their peers had with them are some of the factors that affected their agreement on the proposed solutions by their team members. The empirical study findings, besides hinting at the presence of coalition groups that are formed based on the similarity of solutions/opinions that lead to the majority effect, show that the influencer effect could also be seen when individuals were agreeing with other proposed solutions, hence supporting the assumption. These findings show the presence of the two social factors considered in the model during decision–making in idea selection. The results from the empirical study support the assumption by showing that an individual’s (j) perceived degree of influence by another individual (i) is correlated to an individual’s agreement (A ∝ I) and was also associated with individual j’s agreement when individual i proposed its solution. The data collected during the empirical study did not capture how many times the teams generated and selected ideas. If the team members proposed and selected solutions multiple times or were asynchronous (i.e., some individuals proposing solutions in one session and some others in the other sessions), then using the term ‘past agreement’ (PA) is accurate. Thus, assuming that the agreement of one individual is affected by the agreement its peer had when this individual proposed a solution in the past, (A ∝ PA). Hence, the study supports the assumption that these two factors could be associated with an individual’s agreement during idea selection.
5. Simulation results and discussion
5.1. Simulation set-up
The purpose of the model is to simulate idea selection in design teams while keeping in mind the factors that affect the decision-making (i.e., agreement with the proposed solutions) when selecting solutions. There are independent, intermediate and dependent parameters that are present when teams collaborate in a design session, however; only the ones relevant to the purpose of the work are considered (Singh et al. Reference Singh, Cascini, Casakin and Singh2019). To test the effect of influencers (while considering the two social factors) during idea selection, a few parameters were varied while keeping the others constant (details can be seen in the Appendix). As seen from the model description, influence depends on both self-efficacy (self-efficacies of the agents were controlled, i.e., each agent was allotted self-efficacy at the beginning of the simulation to control the number of influencers in the team) and trust [that emerges with other parameters like familiarity and reputation, for more details see Singh et al. (Reference Singh, Cascini and McComb2021)]. Other independent parameters like the number of agents, design task, length of idea generation and agent past experience were kept constant for the simulation to see the effect of intermediate parameters on the design outcome.
From the studies done in the past, it is clear that social influence affects creativity (Paulus & Dzindolet Reference Paulus and Dzindolet2008) and above-average teams have a high degree of influence on them (Singh et al. Reference Singh, Cascini and McComb2020). However, to answer the research question, that is, to see the effect of design teams with and without well-defined influencers on the idea selection outcome, simulation results could provide some insights. Two scenarios were designed to extract simulation data that could answer the research question. The first scenario tested the situation where the distribution of self-efficacy in the teams is not uniform, that is, some agents have high self-efficacy and others low when they start working on a design task.Footnote 3 This provided more control over the number of influencers in a team, hence seeing the effect of influencers emerging based on their high self-efficacy (as discussed above) on design outcome. Three subscenarios here were:
-
1.1 One agent with high self-efficacy and others with low (i.e., one influencer)
-
1.2 Two agents with high self-efficacy and others with low (i.e., two influencers)
-
1.3 Half of the agents with high self-efficacy and others with low (i.e., three influencers)
The second scenario tested the situation when the team has a uniform distribution of self-efficacy in its agents, that is, all agents either have high or low self-efficacy when they start working on a design task. Two subscenarios here were:
-
2.1 All agents with low self-efficacy (i.e., no influencer)
-
2.2 All agents with high self-efficacy (i.e., all influencers)
These scenarios were designed to gain clear and accurate insights by controlling the dynamicity of the model processes. Thus, by assigning different self-efficacy combinations at the beginning of the simulation, the various number of influencers were to be formed and allocated to each influencer-team composition (1.1, 1.2 and 1.3 subscenarios). In the other scenario where the teams had uniform self-efficacy [i.e., subscenarios 2.1 and 2.2 with no well-defined influencer(s)], some agents may emerge as influencers as the team works from one session to another.
The results presented in the next section are based on 200 simulations following the Monte Carlo logic where the computer simulations are done several times to reduce the effect of randomness. The design outcome from the computational agent teams was measured in terms of quality solutions (value or utility) (Shah et al. Reference Shah, Smith and Vargas-Hernandez2003) and exploration (Dorst & Cross Reference Dorst and Cross2001). Researchers like Ehrich & Haymaker (Reference Ehrich and Haymaker2012) have used some similar metrics to evaluate team interaction in their model. The design outcome (as seen in Figure 2) is assessed in the following manner:
-
(i) Exploration related findings
-
(ii) Quality related findings
-
(iii) Additional findings related to team behaviour
5.2. Simulation results
Exploration related findings
The exploration of the agents is measured in three different ways; spread, exploration quality index and local exploration quality index. These three different ways were chosen as it would be useful to know how diverse were these solutions, the quality of the explored solutions with respect to the design space and the number of good solutions proposed by a team.
Spread is the dispersion of the solutions (Eq. 11)). It is calculated by getting the distance between each solution from the centroid of all the solutions in the design space. The variation in these distances (i.e., the distance between a solution and centroid) gives the idea about how the solutions are located in the design space. The spread shows how different the solutions are from each other; in other words, it exhibits variety in the solutions. If S is a set of n proposed solutions on a design space having two design variables, $ S\hskip0.35em =\hskip0.35em \left\{\left({x}_1,{y}_1\right),\left({x}_2,{y}_2\right),\dots .,\left({x}_n,{y}_n\right)\right\} $
. The coordinates of a centroid
$ S\hskip0.35em =\hskip0.35em \left\{\left({x}_1,{y}_1\right),\left({x}_2,{y}_2\right),\dots .,\left({x}_n,{y}_n\right)\right\} $
. The coordinates of a centroid $ c\hskip0.35em =\hskip0.35em \left({c}_1,{c}_2\right), $
are calculated as
$ c\hskip0.35em =\hskip0.35em \left({c}_1,{c}_2\right), $
are calculated as $ \left({c}_1,{c}_2\right)\hskip0.35em =\hskip0.35em \left(\frac{1}{n}{\sum}_{i\hskip0.35em =\hskip0.35em 1}^n{x}_i,\frac{1}{n}{\sum}_{i\hskip0.35em =\hskip0.35em 1}^n{y}_i\right) $
. The average distance
$ \left({c}_1,{c}_2\right)\hskip0.35em =\hskip0.35em \left(\frac{1}{n}{\sum}_{i\hskip0.35em =\hskip0.35em 1}^n{x}_i,\frac{1}{n}{\sum}_{i\hskip0.35em =\hskip0.35em 1}^n{y}_i\right) $
. The average distance $ \mu $
from that centroid is
$ \mu $
from that centroid is $ \mu \hskip0.35em =\hskip0.35em \frac{1}{n}{\sum}_{i\hskip0.35em =\hskip0.35em 1}^n\left|\left|{S}_i-c\right|\right| $
, where
$ \mu \hskip0.35em =\hskip0.35em \frac{1}{n}{\sum}_{i\hskip0.35em =\hskip0.35em 1}^n\left|\left|{S}_i-c\right|\right| $
, where $ \left|\left|{S}_i-c\right|\right| $
is the Euclidean distance d given as
$ \left|\left|{S}_i-c\right|\right| $
is the Euclidean distance d given as $ d\hskip0.35em =\hskip0.35em \sqrt{{\left({x}_i-{c}_1\right)}^2+{\left({y}_i-{c}_2\right)}^2} $
. The spread or the variety among the solutions can be calculated as the standard deviation of these distances from the centroid (as given in Eq. (11)). Where N is the total number of distances between the solution coordinates and the centroid.
$ d\hskip0.35em =\hskip0.35em \sqrt{{\left({x}_i-{c}_1\right)}^2+{\left({y}_i-{c}_2\right)}^2} $
. The spread or the variety among the solutions can be calculated as the standard deviation of these distances from the centroid (as given in Eq. (11)). Where N is the total number of distances between the solution coordinates and the centroid.
 $$ \mathrm{Spread}\hskip0.35em =\hskip0.35em \sqrt{\frac{1}{N}\sum_{j\hskip0.35em =\hskip0.35em 1}^N{\left({d}_j-\mu \right)}^2.} $$
Exploration Quality Index (EQI): Exploration quality index is the ratio of the number of solutions proposed on a lower resolution solution space (solnsr) above a certain threshold, t (in this case t is above 0.6, where 0 is a minimum and 1 is a maximum solution quality value) to the total number of solutions (totSolnr) available on the design solution space greater than the threshold value (Eq. (12)). The lower resolution of solution space means that the original solution space (100 × 100) is decreased in size by a factor (5 in this case) so that the resultant is a smaller space (20 × 20). This means that if an agent explores five neighbouring solution cells, the average is calculated. It was done to avoid having an inaccuracy that could arise, for example, when an agent explores five immediate neighbour cells to an agent exploring five cells at a larger distance.
 $$ \mathrm{EQI}\hskip0.35em =\hskip0.35em \frac{\mathrm{s}{\mathrm{olns}}_r}{{\mathrm{totSolns}}_r}. $$
Local Exploration Quality Index (LEQI): Local exploration quality index is the ratio of the number of solutions proposed (solns) that are above a certain threshold, t (in this case t is above 0.6) to the total number of solutions proposed (totSoln) (Eq. (13)) on a given design space (i.e.,100 × 100).
 $$ \mathrm{LEQI}\hskip0.35em =\hskip0.35em \frac{\mathrm{solns}\;}{\mathrm{totSoln}\hskip0.24em }. $$
The results related to the different exploration measures explained above are shown and discussed below. ANOVA was used for analysis where all the data samples were normally distributed, which was the case with the spread, EQI, LEQI, and quality values for 1 and 3 solutions for various influencer-team compositions. Therefore, a pairwise T-test was used when doing a pairwise comparison. Others like quality and contribution had at least one sample that was not normally distributed therefore, Kruskal–Wallis was performed and for the pairwise comparison, Conover’s test was done.
Figure 10 shows a different spread or the variety of the final selected solutions for various influencer-team compositions (ANOVA F = 11.24, p < 0.001). The pairwise difference comparison in the spread values can be seen in Figure 11. In general, it can be noticed that teams with no well-defined influencers (i.e., the second scenario with no and all influencers) behave differently than the teams with well-defined influencers (i.e., one, two, and three influencers) in their spread values (having p < 0.05). Even though the teams with no influencer have the most variety, they do not differ significantly from the teams of 1 influencer in their proposed solution spread values. The teams with well-defined influencers behaved similar to each other in the exploration of the design space when proposing their solutions to the controller agent, hence no significant difference could be seen in their spread values. Teams where all the agents had similar and high self-efficacy (i.e., all influencers), produced the least variety in their proposed solutions. The all influencer team’s variety values differ significantly from the rest of the influencer-team compositions.
Spread of the proposed final solution.

Post hoc pairwise T-test after ANOVA to do pairwise comparisons of the spread values (Holm–Bonferroni correction was performed on the data before the T-tests and Conover’s tests).

Figure 12 shows the EQI and LEQI values. Even though it can be seen that the EQI of the teams with no well-defined influencers had more alteration (i.e., all influencers had the highest and no influencers had the lowest EQI), there was no significant difference in the EQI values for all the team compositions (ANOVA F = 1.66, p = 0.16). LEQI on the other hand for all the team compositions differ significantly (ANOVA F = 3.399, p = 0.009). This significant difference in the LEQI values was mainly due to all influencer teams who had the highest LEQI. All influencer team’s LEQI differed significantly in comparison to the other teams with well-defined influencers and also with teams with no influencer (Figure 13). LEQI of the teams with well-defined influencers and no influencer had no significant difference in their values.
EQI and LEQI of the teams with different influencers.

Post hoc pairwise T-test after ANOVA to do pairwise comparisons of the LEQI of the proposed solutions.

Quality findings
The quality of the solution is the value of a point on a design solution space. The quality of the final solution is the value of the single solution that the team of agents proposed to the controller agent or the best solution according to the controller agents in case of multiple solutions. The final solutions in the various team composition differed significantly in the quality values (Kruskal–Wallis H = 15.35, p = 0.004). It can be seen from Figure 14 that all influencers teams had the best quality of the final proposed solutions throughout the design project, while the other team compositions had minor differences. However, not much difference can be seen towards the end of the project. From Figure 15, it can be noticed that the quality of the final solutions by all influencer teams differ significantly from other team compositions. The difference in the quality values of all influencer teams was comparatively lesser with the teams where agents had no well-defined influencer and all had low self-efficacy (i.e., no influencer) and the teams where half of the agents had higher self-efficacy than others (i.e., three influencers) than the teams with well-defined influencers especially one and two influencers.
Final quality of the solution with the standard error of the teams with different numbers of influencers.
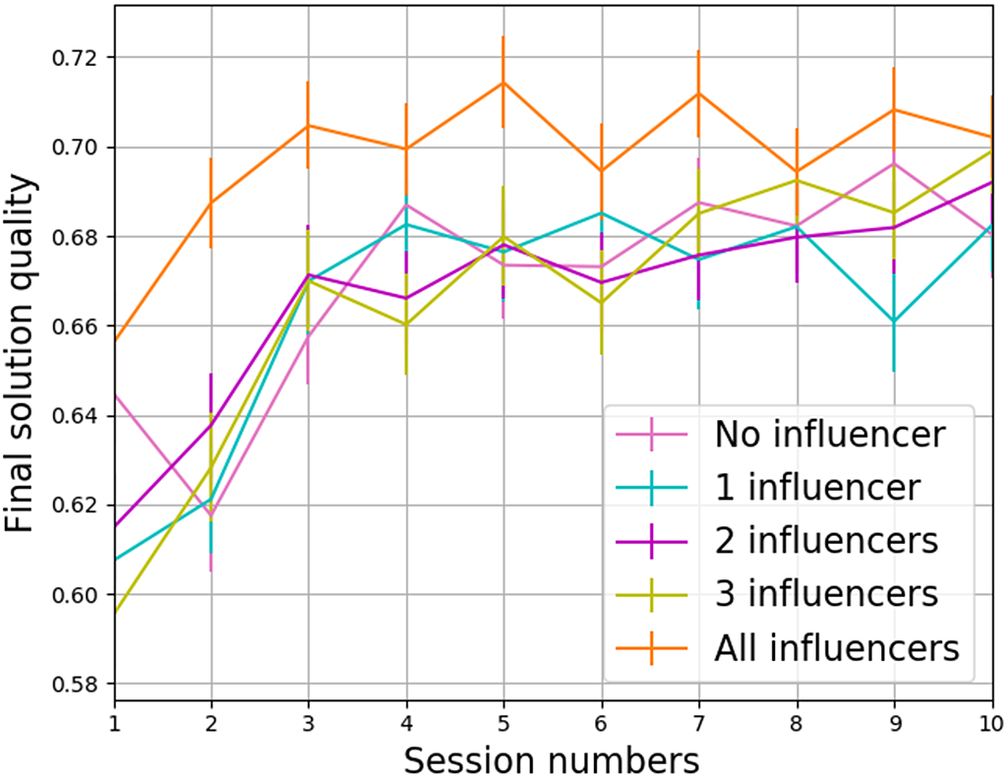
Post hoc Conover’s test used after Kruskal–Wallis to do pairwise comparisons on the final quality values.

As discussed in Section 3 that depending on the disparity in the total agreement value, a team could propose single or multiple solutions to the controller agent. Figure 16 (top) shows the number of times the teams proposed multiple solutions alternatives (in this case 3) or single solutions to the controller agent.
Single versus multiple solutions (3) final solution count (top)and quality (bottom).

To see more variations in the results the two extremes (i.e., one or three solutions) were extracted and analysed. All influencer teams proposed more multiple solutions to the controller agent while other team compositions mainly proposed single solutions. Proposing multiple solutions results in better solution quality as the controller agent has the liberty to select the most promising solution out of the multiple alternatives proposed (Figure 16, bottom). The solution quality differed significantly when different teams proposed single (ANOVA F = 4.22, p = 0.002) as well as multiple solutions to the controller agent (ANOVA F = 4.64, p < 0.001). This difference in the quality was significant between all influencer teams and other team compositions when they proposed single solutions to the controller agent (Figure 17, top). The difference in the quality of the solution when multiple solutions were proposed was most significant between all and no influencer teams and teams with two or three influencers (Figure 17, bottom). An interesting thing to see in Figure 17(bottom) is that no significant difference in the multiple proposed solution quality between all and 1 influencer was found.
Post hoc pairwise T-test after ANOVA to do pairwise comparisons of the quality of the 1(top) and multiple (bottom) proposed solutions to the controller agent.

Additional team behaviour findings
Agreement, as described in the Model description, is the amount an individual agrees with the other’s proposed solution. The mean agreement value in the teams of different compositions changes throughout the project as seen in Figure 18 (Kruskal–Wallis H = 13.5, p = 0.009). Teams with well-defined influencers have higher and a different pattern of agreement values than in teams with no well-defined influencers. However, a very weak correlation could be found between agreement values and solution quality of these teams (Kendall τ = 0.2, p-value = 0.04).
Agreement values and final solution quality throughout the sessions.

In the context of the model, the contribution is defined as the number of times an agent proposed its solution to the other team members, which was important in knowing team behaviour. Low contribution distribution as shown in Figure 19 indicates that more or less all agents equally proposed solutions in the team. On the other hand, a high value of contribution distribution indicates that only some agents often proposed solutions as seen from all influencers and three influencers team compositions (Figure 19). The values of the distribution of agents’ contribution in various team compositions differ significantly (Kruskal–Wallis H = 27.06, p < 0.001). However, this significant difference in the contribution distribution values is due to all and three influencers team composition (Figure 20). There was no significant difference for teams of one and two influencers, three influencer teams with no influencers in the distribution of the contribution by their agents. However, within the no well-defined influencer setting, all and no influencer teams behave significantly different from each other in the contribution by their agents.
Contribution distribution and average quality of the final solutions.

Post hoc Conover’s test used after Kruskal–Wallis to do pairwise comparisons on the contribution distribution values.

5.3. Discussion
In the current work, when the team compositions based on teams with and without well-defined influencers are varied, its impact on the design outcomes (measured in form of exploration and quality values) could be seen. The variety of the final solutions differs significantly from each other in the teams of well-defined and not well-defined influencers. Teams without well-defined influencers (i.e., no and all influencer teams) also behaved differently as the mean influence value in both these teams differed throughout the sessions (Figure 21). Especially, it could be seen from the no influencer teams who had the highest variation in their final solutions and behaved similar to the 1 influencer team. This suggests that one or more (as the distribution of influence is the lowest, seen from Figure 22) weak influencers might emerge in the no influencer teams as the sessions go on. It is often seen that minority influence in teams leads to divergent thinking as it can be seen in teams where influencers form minority (as in no, one, two and three influencers teams), the divergence or spread of the solutions is more (Nemeth Reference Nemeth1986). Whereas in all influencers teams where majority viewpoints lead to convergence or less variation in their solutions (Nemeth Reference Nemeth1986). This aspect of the finding where teams with and without influencers can be dynamically converted from each other under specific circumstances is worth expanding in the future.
Session-wise mean influence value in teams.

Session-wise influence distribution in teams.

The models that considered agent personality features like intelligence and social make-up showed that learning from the number of agents for an agent in a group increases with time (Urban & Schmidt Reference Urban and Schmidt2001). However in their case, the same amount of learning from other agents was assumed and the impact was observed on variables like group size, social satisfaction and number of agents chosen to learn from instead of performance (Urban & Schmidt Reference Urban and Schmidt2001). The importance of the exploration of the design space when agent teams of different cognitive styles work on a design problem was hypothesised by Lapp et al. (Reference Lapp, Jablokow and McComb2019). Therefore, the current model results measured exploration in the form of EQI and LEQI. However unlike cognitive styles of agents that effects global exploration (Lapp et al. Reference Lapp, Jablokow and McComb2019), EQI obtained here was not affected by the presence of influencers in the team (i.e., teams with and without well-defined influencers had the same EQI). This could be because EQI takes into account the quality of the explored solutions with respect to all the above threshold solutions available on the design space. EQI also considers the design space (for example, if the design solution space has fewer above-average solutions, exploring more would not necessarily help in improving EQI value). On the other hand, the LEQI of the team with all agents having the same and high self-efficacy, differ significantly from the other team compositions. Hence, it was clear that all influencer teams had more above-average final solutions than the rest of the well-defined and no influencer teams. This implies that having a team with similar and high-self-efficacy individuals could produce more above-average quality solutions but these solutions might not have much variety in them. If a project desires more variety, it would be suggestive to have a team with well-defined influencers.
The TEAKS model presented by Martínez-Miranda & Pavón (Reference Martínez-Miranda and Pavón2012) simulated the influence of team members’ relations on their performance and incorporated introverted/extroverted personality types in their agents. Their task quality (that was measured as an average of the quality values of the agents involved in the task) was ‘acceptable to high’ for teams with more than three members (Martínez-Miranda & Pavón Reference Martínez-Miranda and Pavón2012), however, the direct impact of introverted/extroverted agent characteristics on the quality was unclear. On the contrary, the quality values obtained by the presented model were similar to the EQI and LEQI results where teams without well-defined influencers like all influencer teams also had the highest final proposed solution quality throughout the design project. This shows that the teams without well-defined influencers where all agents have similar and high self-efficacy (i.e., all influencers) produce better solution quality than the teams with well-defined influencers. The empirical study observation by Singh et al. (Reference Singh, Cascini and McComb2020) found that teams with more perceived influence in them performed better. However, the impact of the number of influencers or distribution of influence within the team on their performance was unclear
Proposing potentially good alternatives during decision-making is crucial (Keeney Reference Keeney1996), but it is often seen that individuals in organisations often consider only one alternative (Nutt Reference Nutt1998). Limiting the alternatives or final selected solution when proposing to the controller agent (project manager, team leader and similar ones) is a common mistake (Keeney Reference Keeney2002). Thus, proposing multiple final solutions alternatives (in this case 3) to the controller agent resulted in better solution quality. All influencers teams proposed more multiple final solution alternatives which could be one of the reasons why they performed better in terms of their final solution quality. It was seen that the teams with well-defined influencers have higher agreement values than teams without well-defined influencers. The agreement tended to increase for well-defined influencer teams while teams without well-defined all influencer teams, the agreement values became constant after initial sessions. Agreement gradually becomes an inherited property of the model for cases where the influence value increases with sessions. It is known that influence contributes to persuasiveness (Martensen et al. Reference Martensen, Brockenhuus-Schack and Zahid2018) and affects the opinions of team members (Das et al. Reference Das, Kamruzzaman and Karmakar2018. Thus, well-defined influencers (who are perceived as more influential than other members) had more influence value that affected agreement with them on their proposed solution, hence resulting in higher agreement values in well-defined influencer teams. The agreement values on the proposed solutions in all influencers teams were significantly lower (as the distribution of influence was lower than other well-defined influencer teams, seen in Figure 22) than other well-defined influencer team compositions, which might have caused the team to propose multiple final solution alternatives than a single solution.
In contrast to the expectation that teams with one or two influencers would experience a dominant contribution from those influencers, a more uniform contribution was found. Instead, an increase in the number of influencers or the agents having high self-efficacy in the team decreased team agents’ contributions. In all influencers and three influencers team compositions (where the influence was higher than other teams as seen in Figure 21), only some agents often proposed solutions than all the team members. In the teams with well-defined influencers (one and two) and no influencer team (where weak influencers emerge as the team works from one session to another), the contribution by their agents was more uniform. In the current model formulation, the probability that a high self-efficacy agent will propose a solution is higher than agents with low self-efficacy. In the current case, at least half of the team members were chosen to propose solutions. This meant that in teams with few influencers, other noninfluential agents were also proposing solutions. This resulted in a more uniform contribution than teams with a larger number of influencers. In the teams with many influencers, many agents proposed solutions due to their high self-efficacy. When the solutions of these agents are selected, their self-efficacy is further increased, therefore resulting in only some agents regularly contributing (hence, also decreasing the variety in their solutions). The low distribution of influence in all influencer teams (Figure 22) is also suggestive of the presence of unclear powerful (high influence value) influencers in the project. In three influencers teams where both the influence value and distribution is high, a clear indication of polarising power is present. The team with all influencers with only some agents regularly proposing solutions performed better than the other team compositions. A rather similar phenomenon was demonstrated by a contribution model for engineering design teams where team members had unequal effects on team performance and enhancing the contribution by the most proficient member of a team is likely to increase team performance (Brownell, Cagan & Kotovsky Reference Brownell, Cagan and Kotovsky2021).
The effect of the influencers on design outcome depends clearly on the cognitive state of an individual (i.e., its self-efficacy level). For example, all influencers and no influencer teams had the same distribution of social influence when they started working but evidently, they behaved differently (Figures 21 and 22). In the no influencer teams, where all agents start with low self-efficacy, weak influencer(s) emerged along with the project and these weak undefined influencers might have controlled the team process as all other agents had relatively low self-efficacy (similar to one influencer). Since they were weak influencers (as the mean SE value was low, Figure 21), no significant impact was found on team’s contribution. This meant the different agents proposed solutions, hence resulting in a high variety in the proposed solutions. However, in all influencers teams, the above effect is less evident as all the agents have high self-efficacy and the team had high influence value throughout the sessions. Studies in the past have also shown that in societies with strong ties among agents, a few influencers may gain high levels of dominance like the case of all influencer teams (Sosa & Gero Reference Sosa and Gero2004). While weak social ties increase social mobility that results in social structures where dominance was more distributed (Sosa & Gero Reference Sosa and Gero2004). Thus, teams with all influencers might be subjected to a majority effect where high influence was more distributed than other teams (unlike three or two influencers where high influence was concentrated in a few individuals). More experiments are needed to better understand the role of the majority effect in teams without influencers (where low influence was distributed in agents).
6. Conclusion
Idea selection is one of the important aspects of design as it directly influences the choice of the final design solution. When considering a collaborative design activity as a social process, several factors emerge that affects decision-making when selecting ideas. Empirically studying the design process in laboratory settings is tedious, therefore a computational model framework of idea selection is presented in the article. The work presented here highlighted that idea selection is a crucial component of a design process that has not been sufficiently studied at the team interaction or social level. Two social factors, the influencer effect and the majority effect were used behind simulating decision making during idea selection which was further verified in the empirical study. As the past literature lacks to explore the effect of influencers on design team outcomes, the goal of the article was to see how these influencers affect the final design outcome. However, to start with the model formation of idea selection and to see the effect of different influencer-team compositions on design outcome, it was assumed that influencers also affect an individual’s agreement on proposed solutions. In other words, an individual’s agreement on the proposed solution by another team member depends on the degree of influence perceived by an individual from its teammate and their past agreement. After gaining some insights from the empirical study, the model simulation results were extracted to answer the main research question, ‘What is the effect of design teams with and without well-defined influencers on the idea selection outcome?’ The results showed that influencers affect design team outcomes (in terms of quality and exploration).
Although the strength of the model lies in its simplification, it is important to be explicit on how far one can take the results presented in the model. The finding presented in the article is based on certain model parameters and changing these parameters may vary the results. Some of these limitations could be listed as follows: (a) The study is based on the assumption that confident individuals are generally more dominating and other social skills are not a barrier to the presentation of individual self-efficacy in team environments. (b) As stated in the model description that ‘k’ in k-means clustering of similar solutions was chosen randomly whose value lied between the 2 and the total number of solutions proposed. This approach might not be effective when the team size is very large. The simulation was based on a team of six agents, changing the team size to very small (like 3 agents) or large (10 agents) results in a different outcome. (c) Due to limited guidelines given on how to computationally represent an actual design task relevant for industry, public, social design or innovation projects, here the model adopts one of the ways to represent it. The results were related to a design problem that had five best solutions, however, increasing the number of best solutions (for example to 12 peaks) or having only one best solution produces different outcomes. The two-dimension representation of the design space was done for simplification purposes; however, the authors have extracted the results for three dimensions as well. (d) The learning rules given to agents limit the exact imitation of the human designers. For example, in the real world, a designer could propose solutions completely unrelated to the previous ones. This ability is limited in the current model through dependence on past experience and influence from others. An agent’s ability to ideate in a solution space is further limited to the step size and the number of steps given when generating solutions in a session. (e) Factors such as gender roles, informal communications, experience, interaction style, and cognitive biases are present during a collaborative interaction but were not considered during this work. (f) Coalition to form groups of agents was based on the similarity of their solutions/opinions which in the real world might also depend on physiological similarity, proximity, gender, team structure and so on. (g) The results shown in the empirical studies were based on self-reported data and could be affected by various collaboration elements (for example, team size, the profile of the respondents and so on). The type and measures used in the questionnaire might alter the empirical study results. The empirical study data was collected at specific times while simulation results were saved after every ideation session. The empirical data did not directly capture how many times the teams generated and selected ideas. The empirical study showed and explained how respondents agreed more when the solutions were ‘good’ or when ‘good communication’. However, it could be possible that the respondents simply meant what they wrote: that they agreed with solutions that were well communicated or they were actually good. In the future, this study should be replicated on a larger scale to reveal other factors that could have influenced the result. The empirical study analysis used bi-grams as the respondents’ answers were short. However, for complex answers, techniques like clustering could become applicable. The agent-based models are useful in capturing the phenomenon at the individual level but their validation in the real world is difficult. Thus, the authors are using the empirical study to support the major assumptions and to provide logical verification of the model. However, the authors are aware that the simulation results need to be tested, future experiments are being planned to use their feedback to make the computational model accurate.
Overall, the purpose of the study was to investigate how different influencer team compositions affect final design outcomes. The results of this research could advance our understanding of design team behaviour. The work could aid industry innovation, by providing insights on how final concepts emerge from different team compositions. Variables like self-efficacy, influence, and agreeableness could be measured in real teams by using the given question format, informing more specific insights. Future researchers could use and expand the current model to further investigate design team collaboration.
List of symbols
- A
-
The amount of agreement an agent has with the other agent on its proposed solution
- A total
-
Total agreement on a proposed solution
- c
-
The number of clusters
- ci
-
The number of solutions in a cluster i
- distribution(A total)
-
The distribution of the total agreement for all proposed solutions
- EQI
-
Exploration Quality Index
- I
-
The amount of influence an agent has on the other
- J(V)
-
The objective function that k-means aims at minimising
- LEQI
-
Local Exploration Quality Index
- NA
-
The number of agents who agreed with the proposed solution
- N Min
-
The minimum number of agents that should propose solutions
- N SA
-
The number of selected agents to propose solutions
- N tot
-
Total number of agents in a team
- Num totSoln
-
The total number of solutions
- PA
-
The past amount agreement an agent had while deciding on the other agent’s proposed solution
-
$ {P}_{\mathrm{feedback}} $
-
The probability of the feedback
- ps
-
Proposed solution
- P SA
-
The probability of an agent to be selected to propose its solution
- Q
-
The number of proposed solutions
- S
-
The set of positions of the solutions points
- SA
-
Selected agents
- SE
-
Self-efficacy of an agent
- solns
-
The number of solutions proposed that are greater than t
- solns r
-
The number of solutions proposed on a lower resolution solution space that is above certain threshold t
- t
-
Threshold taken to determine
$ \mathrm{EQI} $
- T
-
The amount of trust between the two of agents
- TeamSE
-
Team self-efficacy
- totSoln
-
The total number of solutions that are proposed
- totSoln t
-
The total number of solutions available on the design solution space that are greater than the threshold value t
- v
-
The positions of the centroids
- Var (TeamSE)
-
The self-efficacy variance of a team
- ΔSE
-
The difference in self-efficacy between two agents


A. Appendix
The values of model parameters that were assigned when an idea generation activity starts
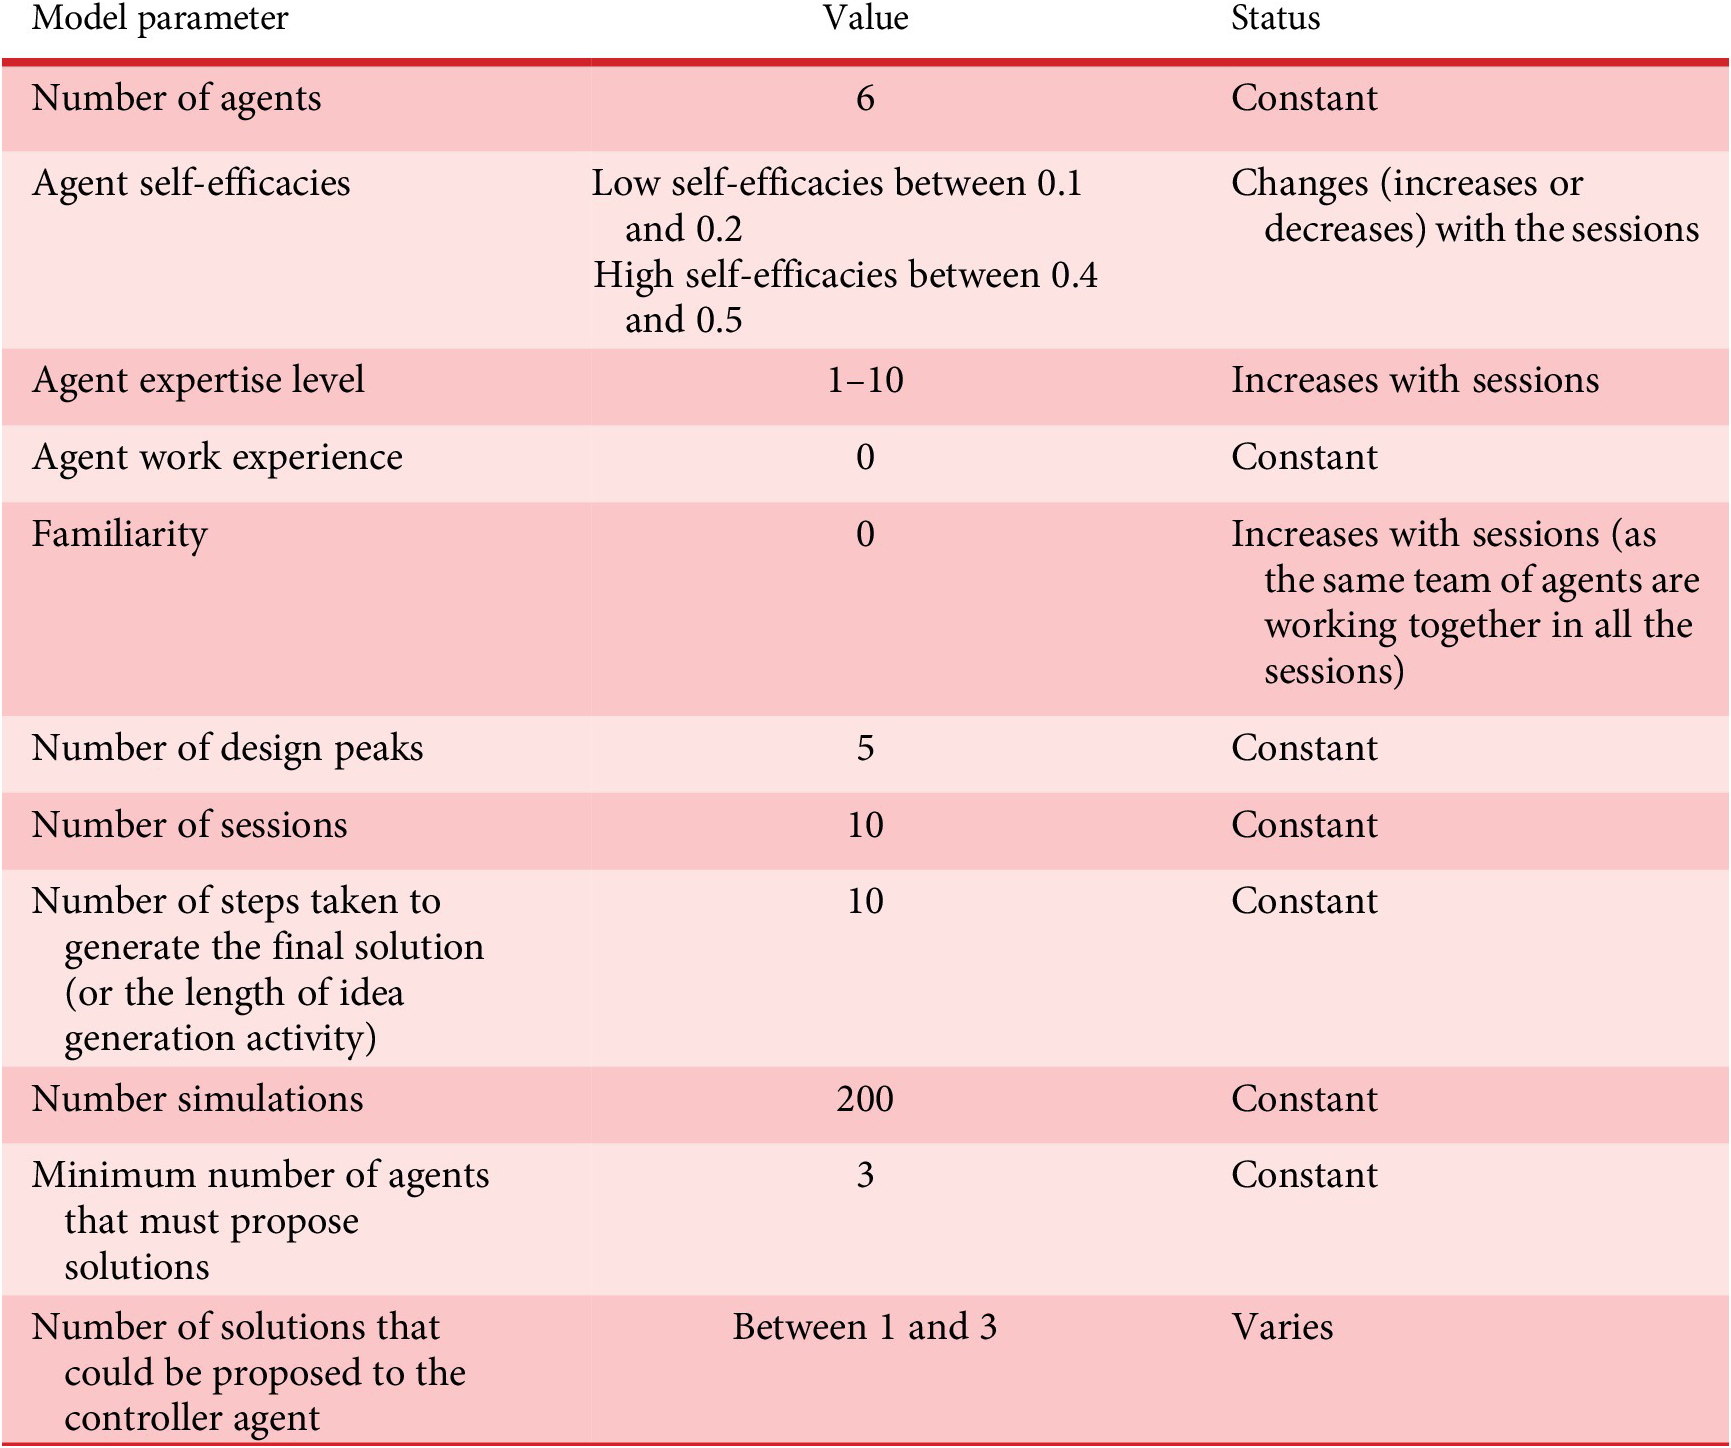


 Open access