





Introduction
Ice patches in the mountains of central Norway are shrinking and vanishing, revealing material culture, such as textiles (e.g. Vedeler and Jørgensen, Reference Vedeler and Jørgensen2013), and hunting equipment (e.g. Callanan, Reference Callanan2014). The study of these artifacts emerging from frozen contexts is ice patch (e.g. Reckin, Reference Reckin2013) or glacial archaeology (e.g. Dixon and others, Reference Dixon, Callanan, Hafner and Hare2014). Driven by site-dependent self-regulating feedback mechanisms (e.g. Glazirin and others, Reference Glazirin, Kodama and Ohata2004; Fujita and others, Reference Fujita, Hiyama, Iida and Ageta2010) ice patches can show remarkable longevity—the Norwegian Juvfonne ice patch has been present since 7600 cal BP (Ødegård and others, Reference Ødegård2017). However, long-term trends indicate steady decline in ice volume (Andreassen and others, Reference Andreassen, Callanan, Saloranta, Kjøllmoen and Nagy2020). In Norway, smaller glaciers and ice patches have already been registered as extinct in the Global Land Ice Measurements from Space (GLIMS) database (Raup and others, Reference Raup, Andreassen, Boyer, Howe, Pelto and Rabatel2025).
Ice patches have served as valuable archives of paleobiological and paleoecological remains (e.g. Røed and others, Reference Røed2014; Rosvold, Reference Rosvold2018; LaBelle and Meyer, Reference LaBelle and Meyer2021) and paleoenvironmental data (e.g. Chellman and others, Reference Chellman2021; Alt and others, Reference Alt2023), preserved in organic-rich sediment layers trapped within the ice. Ice patches are also archives of cultural heritage relating to reindeer hunting (e.g. Farbregd, Reference Farbregd1983) and movements through the mountains (e.g. Pilø and others, Reference Pilø, Finstad and Barrett2020); both material (e.g. Farbregd, Reference Farbregd1972) and intangible (e.g. Ryd, Reference Ryd2013) evidence of prehistoric (e.g. Callanan, Reference Callanan2013) human–ice patch interactions.
Local climate and topography, individual weather events (e.g. Ødegård and others, Reference Ødegård2017), and annual snow cover significantly influence the yearly minimum extent of ice patches. Time series of yearly minimum area measurements enable site comparisons. Minimum extents can be generated through direct field measurements or inferred from remote sensing data such as satellite imagery or orthophotos (e.g. Ødegård and others, Reference Ødegård2017; Andreassen and others, Reference Andreassen, Callanan, Saloranta, Kjøllmoen and Nagy2020, Reference Andreassen, Nagy, Kjøllmoen and Leigh2022).
Here, we present minimum extent fluctuations from 2017 to 2024 for Storhornet, Elghøa and Lågtangan ice patches in the central Norwegian mountains (Fig. 1) based on Sentinel-2 satellite data and field observations. These sites exemplify effects of different stages of cryospheric decay on archaeological ice patch surveying. We introduce and define the term ghost patch to describe ice patch sites, with archaeological finds, that no longer contain ice and therefore possess a diminished capacity for artifact preservation. While ghost patches may still accumulate and retain snow, in some cases perennially, their archaeological knowledge potential is fundamentally altered. ‘Ghost patch’ highlights archaeological implications of the ongoing loss of ice and how surveying strategies can be adapted to include such sites.
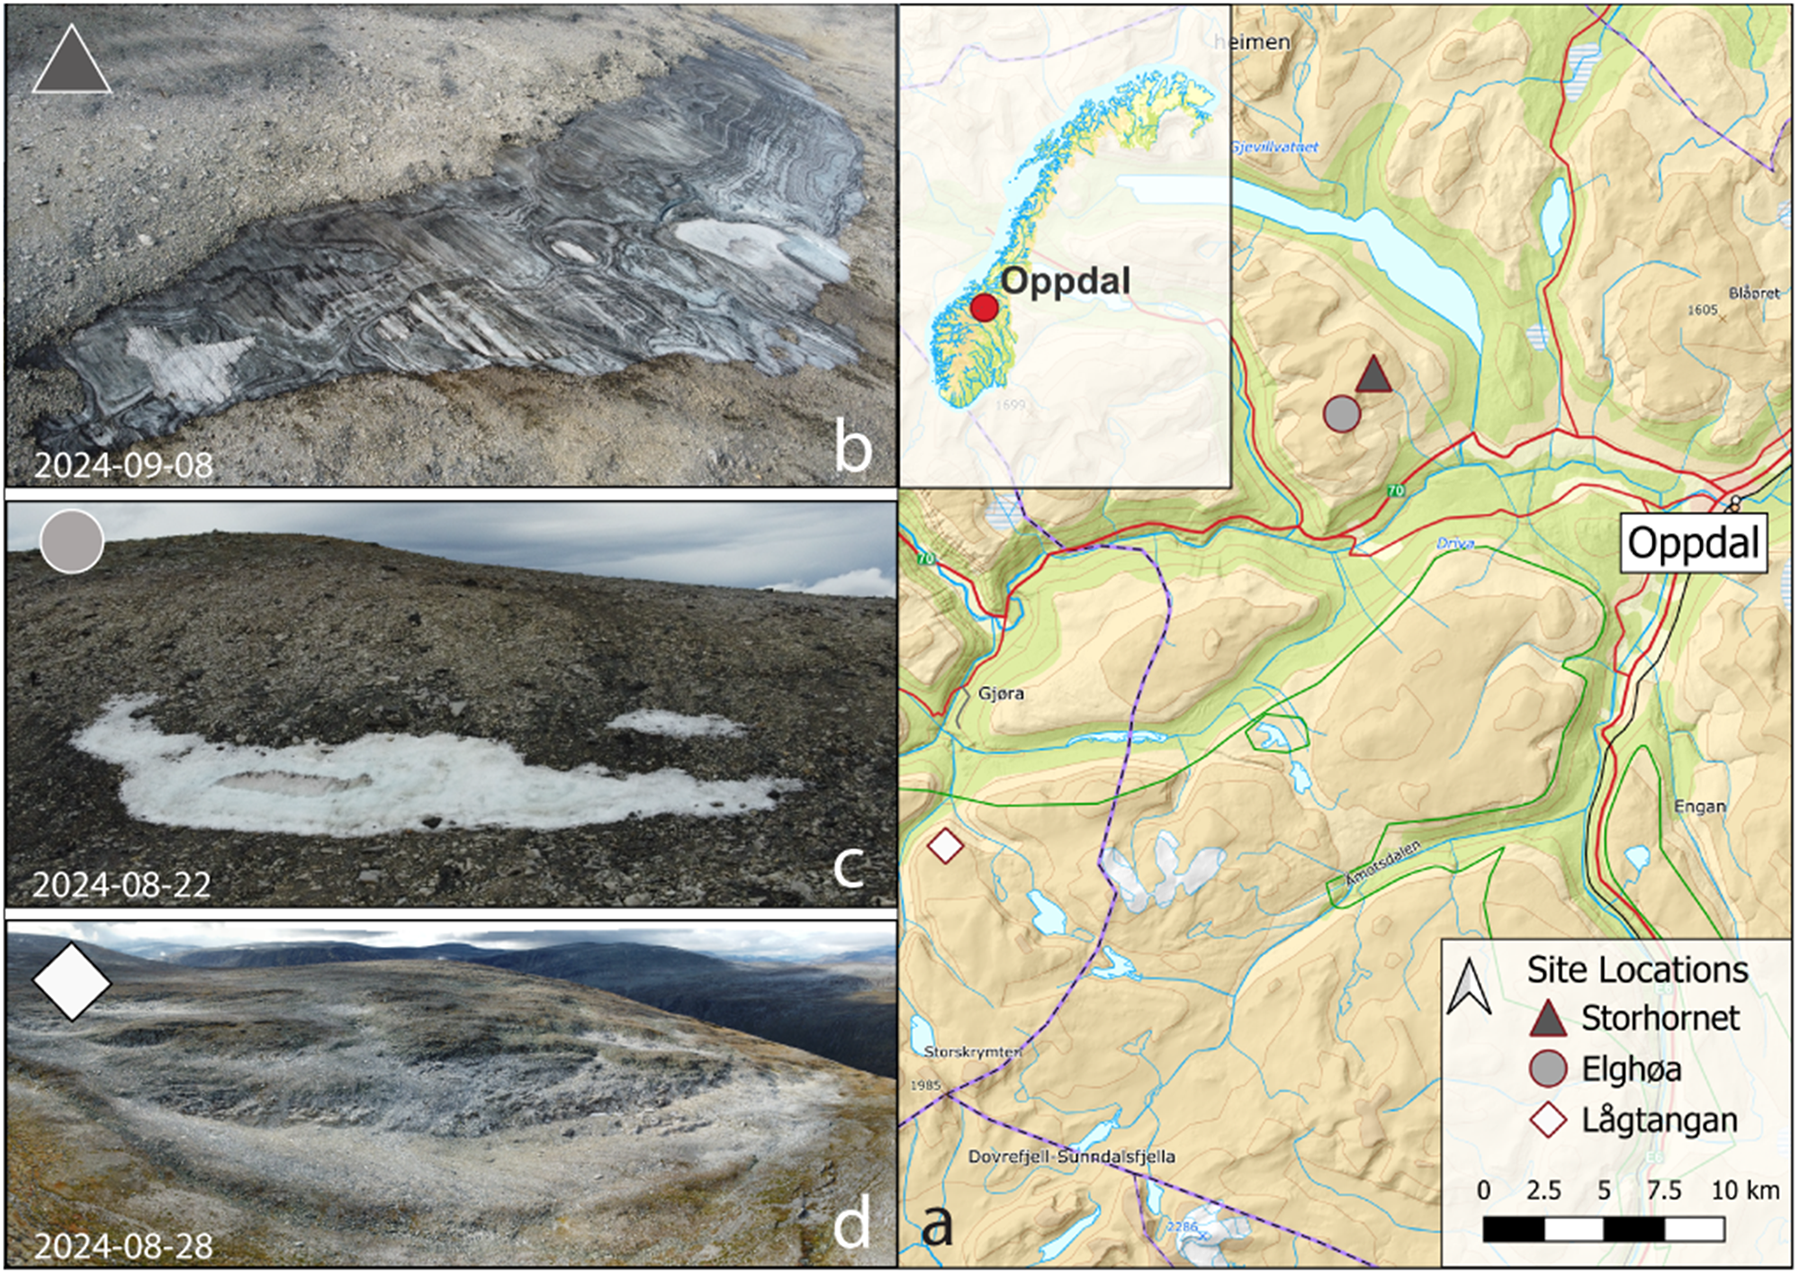
Panel (a) shows the location of the three sites in relation to Oppdal Municipality center, inset map shows the location of Oppdal in Norway. Panels (b–d) are 2024 drone photos.

Methods
Data
This study uses previous glacier inventories, Sentinel-2 (S2) satellite data from 2017 to 2024, when both Sentinel-2A and Sentinel-2B satellites were in operation, and Level-2A (L2A) products were consistently available, as well as site field observations from 2024 to quantify yearly fluctuations in minimum area extents.
Glacier inventory baseline data
The most recent glacier inventory based on S2 data from August 2019 in southern Norway, hereafter GI2019, is used as the reference baseline (Andreassen and others, Reference Andreassen, Nagy, Kjøllmoen and Leigh2022). GI2019 includes glacier IDs (BreID), area, slope, aspect and elevation data. Due to the availability of higher resolution S2 data (10 m), GI2019 mapped many new small glaciers and ice patches, including Elghøa and Lågtangan, not mapped by previous efforts such as the 1999–2006 glacier inventory based on 30 m spatial resolution Landsat data (Andreassen and others, Reference Andreassen, Winsvold, Paul and Hausberg2012).
Deriving ice patch extents
Open access S2 data was downloaded through the Copernicus Data Space Ecosystem. We quantify yearly minimum extents by vectorizing the S2-based Normalized Difference Snow Index (NDSI) (Hall and Riggs, Reference Hall, Riggs, Singh, Singh and Haritashya2011) product from the Copernicus Browser website. This NDSI formula is:
 \begin{equation*}NDSI\;=\;\frac{Band\;3\;(Green)\;-\;Band\;11\;(SWIR)}{Band\;3\;(Green)\;+\;Band\;11\;(SWIR)}\end{equation*}
High resolution RGB GeoTIFFs displaying this NDSI were downloaded for 2017–2024. Our method relies on the optical bands of S2 and therefore on cloud-free images, a challenge for mainland Norway (Andreassen and others, Reference Andreassen, Moholdt, Kääb, Messerli, Nagy and Winsvold2021). We manually selected one image per site per year with minimal cloud cover at the latest date before snowfall (Figs. 2–4). For years when a site completely melted away the earliest date on which the NDSI observes no snow was selected.
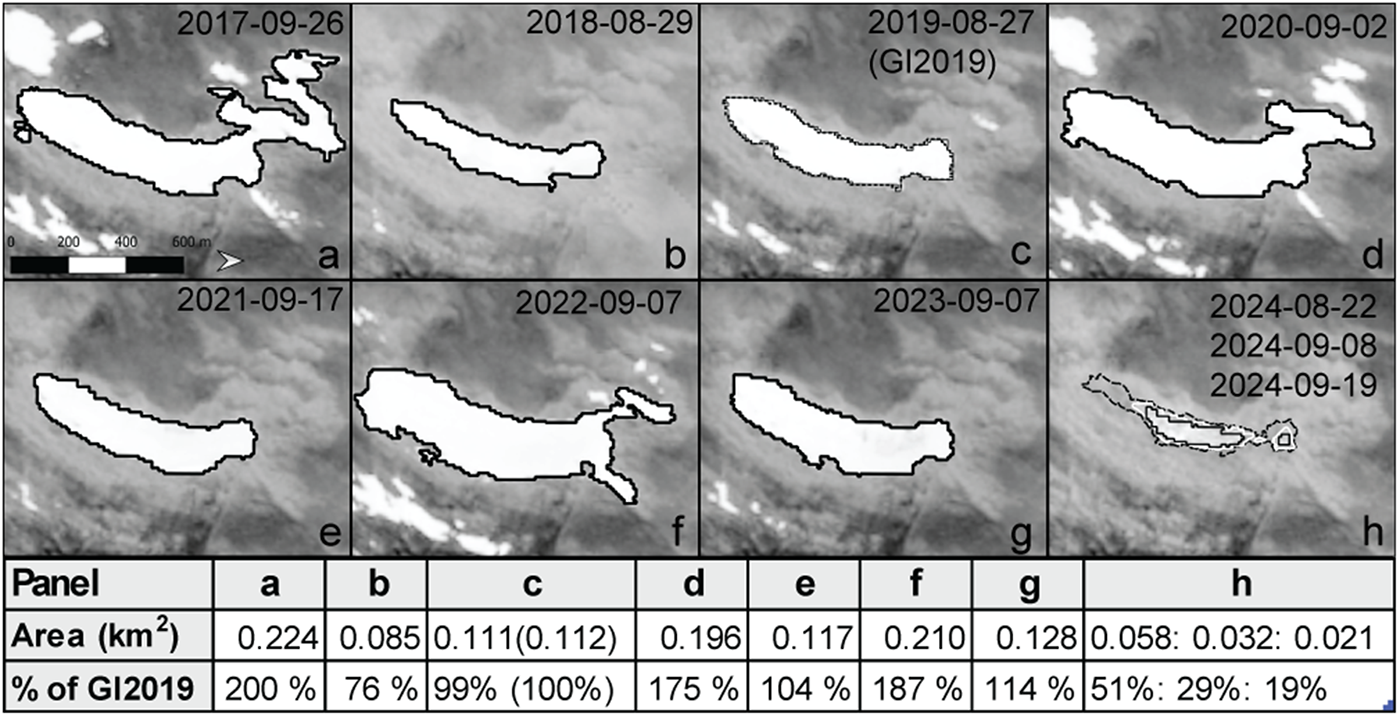
Panels (a–h) show yearly minimum extents of Storhornet. Panel (c) shows NDSI (solid line) and GI2019 (dotted line). Panel (h) shows GPS measurements from 20240822 (dotted line), 20240908 (white line) and NDSI (solid line). Table shows polygon areas and size comparison to GI2019. Background for each panel: S2 image for given date rendered as single band (blue) grayscale.

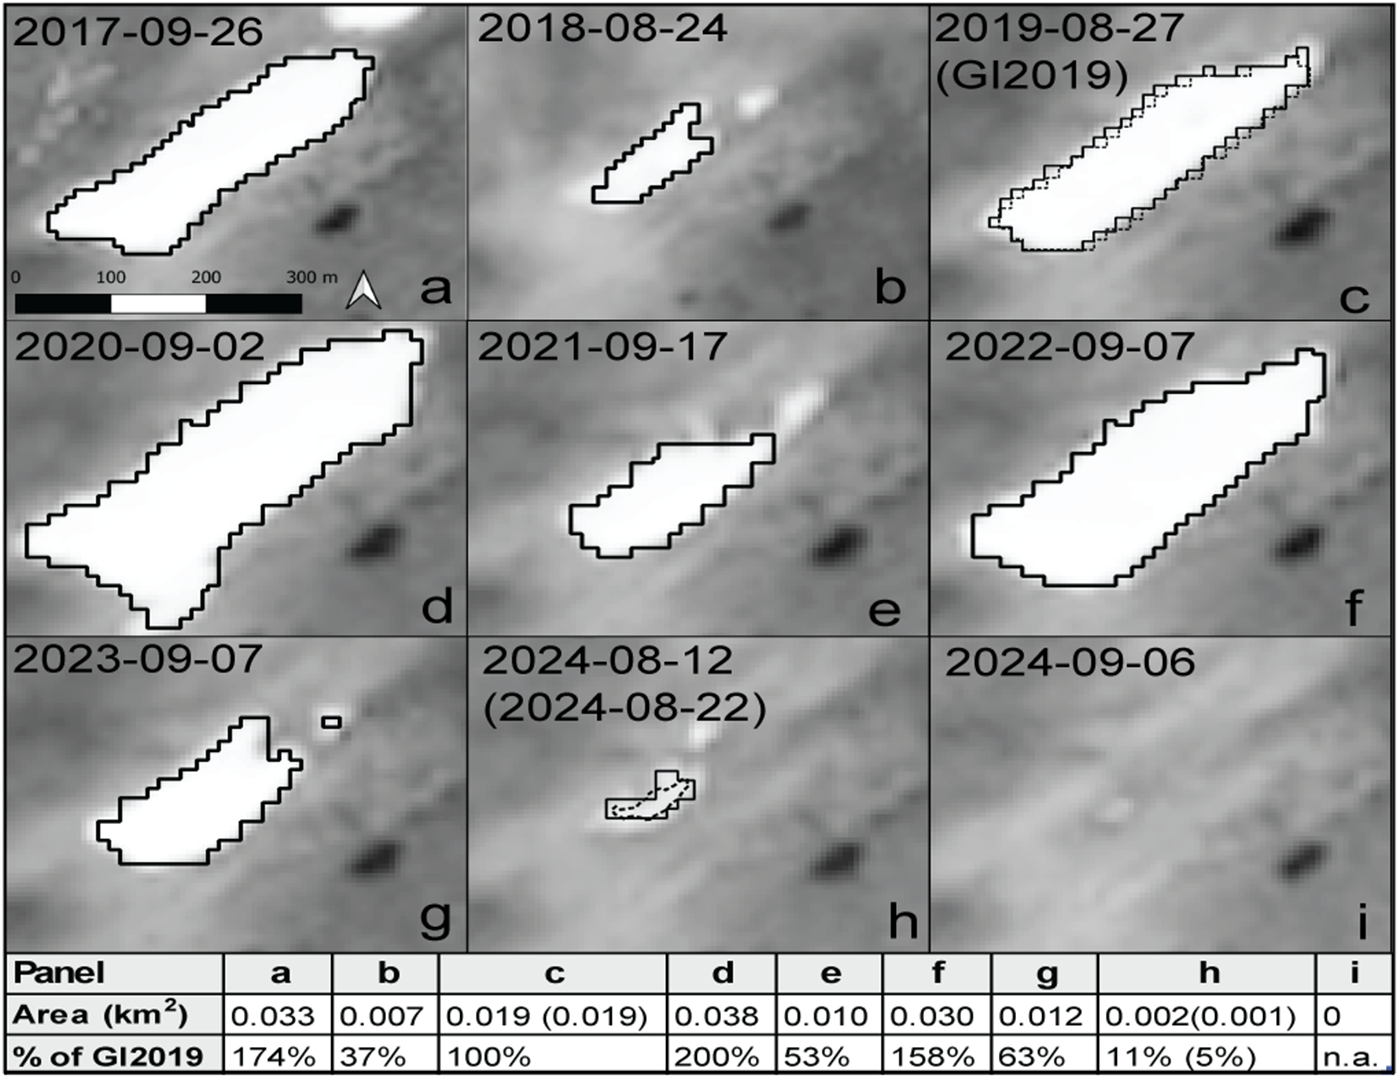
Panels (a–i) show yearly minimum extents of Elghøa. Panel (c) shows NDSI (solid line) and GI2019 (dotted line). Panel (h) shows NDSI from 20240812 (solid line) and GPS measurements from 20240822 (dotted line). Panel (i) shows the earliest date where no snow was registered by NDSI. Table shows polygon areas and size comparison to GI2019. Background for each panel: S2 image for given date rendered as single band (blue) grayscale.

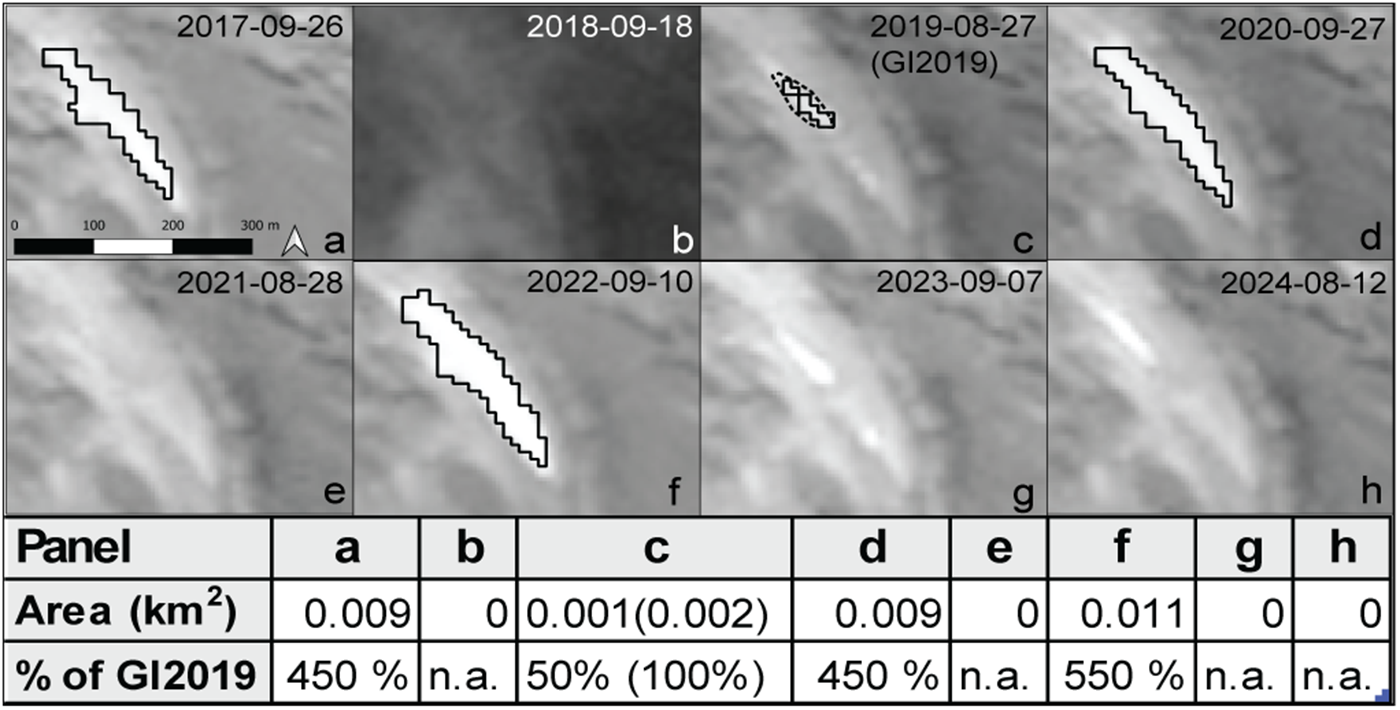
Panels (a–h) show yearly minimum extents of Lågtangan. Panel (b) is darker due to partial cloud cover. Panel (c) shows NDSI (solid line) and GI2019 (dotted line). Panels (b, e, g and h) show the earliest snow and ice free images. Table shows polygon areas and size comparison to GI2019. Background for each panel: S2 image for given date rendered as single band (blue) grayscale.

Measurable polygons were derived from the downloaded NDSI images in QGIS v. 3.34.10. Using the Raster Calculator tool, we created a binary raster (snow/no snow) from the RGB data by applying a threshold where the red band was zero. This binary raster was then converted into vector polygons using the Polygonize (Raster to Vector) tool. Discontinuous patches of snow located outside the GI2019 baseline were discarded.
Our NDSI method efficiently generated measurable polygons. For larger scale mapping, semi-automated approaches, such as the commonly used band-ratio method, could be applied (e.g. Racoviteanu and others, Reference Racoviteanu, Paul, Raup, Khalsa and Armstrong2009). While efficient for mapping even small ice patches, challenges with cast shadow, dark debris or seasonal snow can cause under- or overestimation requiring manual digitization and editing (Andreassen and others, Reference Andreassen, Callanan, Saloranta, Kjøllmoen and Nagy2020, Reference Andreassen, Nagy, Kjøllmoen and Leigh2022). Although NDSI may perform worse than standard band ratio in other regions (e.g. Paul and others, Reference Paul, Winsvold, Kääb, Nagler and Schwaizer2016), our 2019 NDSI polygons were comparable to the GI2019 polygons derived from the same S2 data (Figs. 2c; 3c; 4c).
Fieldwork
Fieldwork was conducted by the first author and one additional individual from mid-August to late September 2024, late in the ablation season when archaeological ice patch surveying is most productive (Callanan, Reference Callanan2012). Fieldwork included visual surveying along terminal edges, GPS measurements of site extents, as well as ground- and drone-based photography. Site extents were measured with the built-in GPS of an iPhone 13 Pro using the ArcGIS Fieldmaps application. We generated polygons from tracks recorded with two second intervals requiring minimum 10 m accuracy for measurement. Some manual cleanup of the data was required potentially introducing errors. Fieldwork derived polygons are also subject to the uncertainties of accurately detecting and following ice patch terminal edges through challenging terrain, material covering the surface, and seasonal snow in addition to the accuracy of signals and equipment. For photographic documentation we used a DJI Mini-2 drone capturing images in .raw and .jpeg formats.
Site descriptions
Storhornet (62.6397351°N, 9.4050132°E), Elghøa (62.6245678°N, 9.3793592°E), and Lågtangan (62.4652972°N, 9.060558°E) lie within central Norway (Fig. 1). Storhornet and Elghøa are located in Oppdal Municipality, Trøndelag County, approximately 16 km NW from Oppdal and only 2 km apart. Lågtangan is located in Sunndal Municipality, Møre og Romsdal County, approximately 35 km SW from Oppdal. All three sites are registered in GI2019.
Storhornet
Storhornet (Glacier ID 1631) is registered in GI2019 as an east-facing ice patch with a mean elevation of 1460 masl and a slope of 18º, measuring ca. 820 m along its long axis NNE–SSW and 170 m at its widest point with a total area of 0.11 km2. Storhornet has a prominent position in the landscape, clearly visible from Oppdal. It was already registered in the 1947/1985 glacier inventory (Winsvold and others, Reference Winsvold, Andreassen and Kienholz2014).
Storhornet ice patch is a registered cultural heritage site in the national Norwegian cultural heritage database Askeladden under the ID: 275112-0. Two iron arrowheads with shaft fragments (T27231; T27267) and another shaft fragment (T27266), all typologically dated to the Iron Age or Medieval period, as well as a wooden ski fragment (T27059) of unknown date have been recovered. Artifact descriptions and photos are available through the NTNU University Museum Collections Online (https://collections.vm.ntnu.no/).
Elghøa
Elghøa (Glacier ID 6076) was registered for the first time in the GI2019 as a southeast-facing ice patch with a mean elevation of 1389 masl and a slope of 11º. It measured ca. 290 m along its long axis NE–SW and 80 m at its widest point with a total area of 0.019 km2. We named the site after the nearby peak of Elghøa (1446 masl). It is not a registered archaeological site and has no archaeological artifacts associated with it.
Lågtangan
Lågtangan (Glacier ID 3152) was registered for the first time in the GI2019 as a northeast-facing ice patch with a mean elevation of 1427 masl and slope of 20º. It measured ca. 97 m along its long axis NW–SE and 31 m at its widest point with a total area of 0.002 km2. We named the site after the nearby peak of Lågtangan (1512 masl).
Lågtangan is not a registered archaeological site, but has one associated artifact (T27926), a Late Iron Age leaf-shaped iron arrowhead and wooden shaft fragment recovered two cm apart in fine sand sediments in 2018. Artifact descriptions and photos are available through the NTNU University Museum Collections Online (https://collections.vm.ntnu.no/).
Results
Storhornet
Storhornet’s area extent varied from 2017 to 2023 (Fig. S1), fluctuating around the GI2019 baseline (Fig. 2a-h). The largest observed extent was in 2017, 200% of baseline (Fig. 2a). Storhornet was smaller than the baseline in 2018 (Fig. 2b). The NDSI and GI2019 provide near overlapping polygons and near identical areas for 2019 (Fig. 2c). During fieldwork in 2024 we recorded a 64% reduction from 0.058 km2 on 22 August to 0.021 km2 by 19 September (Fig. 2h).
During fieldwork we observed organic-rich sediment layers within the ice (Fig. 1b) but no sediment accumulation at the terminal edge. As these layers melt and wash off the ice, the steep, rocky and dynamic ground surface hinders such accumulation, without which emerging artifacts suffer direct sub-aerial exposure. No artifacts were recovered during the fieldwork. Large areas of ground around Storhornet were left unsurveyed due to the rapid shrinkage (Fig. 2h).
Elghøa
Elghøa’s area extent fluctuated from 2017 to 23 (Fig. 3a-g; S1), before completely melting away in 2024 (Fig. 3i). The NDSI-based polygon from 12 August 2024 showed 0.002 km2 remaining. Field measurement on 22 August was 0.001 km2 (Fig. 3h). By 6 September, snow was no longer detected by the NDSI (Fig. 3i). The 2018 and 2024 images are both from August (Fig. 3b,h), while in other years Elghøa remained larger later into the season. The largest yearly minimum, 0.038 km2 (200% of GI2019), was observed on 2 September 2020 (Fig. 3d). The NDSI and GI2019 provide near identical area measurements for 2019 (Fig. 3c).
Our archaeological survey did not reveal any artifacts. Elghøa is not registered as an archaeological site, but observed shed antlers demonstrate the presence of reindeer. Field observations on 22 August 2024 included ice containing limited amounts of sediments and no major sediment accumulation on the rocky but stable and dry ground (Fig. 1c).
Lågtangan
Lågtangan ice patch phased in and out of existence during 2017–2024 (Fig. 4a-h; S1). Snow survived only the 2019–2020 ablation season (Fig. 4c-d). The largest yearly minimum was 0.011 km2 (550% of GI2019) observed on 10 September 2022 (Fig. 4f). The earliest observed vanishing was 12 August 2024 (Fig. 4h). NDSI did not register snow on 7 September 2023 and 12 August 2024 despite the visual impression of snow on the background images (Fig. 4g-h). The GI2019 and the NDSI polygons are comparable (Fig. 4c), however, the resulting area measurements differ markedly when reported in km2, highlighting the importance of spatial resolution for smaller sites.
No artifacts were recovered from Lågtangan during our survey on 28 August 2024, when only two negligible, discontinuous patches of snow remained. Mosses and lichens were growing in exposed sediment accumulations. We collected two faunal samples and recorded the area using drone photography (Fig. 1d).
Discussion
Vanishing ice patches
These sites fluctuated significantly during our observation period (Fig. 2-4; S1) changing our perceptions of the landscape from year to year. The melting at Storhornet in 2024 (Fig. 2h) illustrates how quickly large areas can be exposed. The complete loss of ice at Elghøa in 2024 (Fig. 3h-i) significantly changes our evaluation of its archaeological potential. If it once contained old ice, now it does not. Lågtangan ice patch vanished in 2018, 2021, 2023 and 2024 (Fig. 4a-h). Based on our data, the Elghøa and Lågtangan ice patches can be added to the GLIMS list of extinct glaciers (Raup and others, Reference Raup, Andreassen, Boyer, Howe, Pelto and Rabatel2025).
Rapid exposure of previously ice-covered ground, as observed at Storhornet in 2024 (Fig. 2h), challenges the capacity of standard glacial archaeological methodology. For ice patches without old ice, like Elghøa and Lågtangan, future surveying should ignore the yearly terminal edge, which no longer serves any purpose. Following an extensive melt or complete loss of ice, organic artifacts are likely to deteriorate quickly and any lingering snow hinders surveying. Even when no organic artifacts are likely to remain, such sites may still offer insights into past human activities. Just as reindeer have been observed returning even after the snow and ice is gone, driven by memory, instinct, or habituation (Andrews and MacKay, Reference Andrews and MacKay2012, p. v), archaeologists too may find value in returning to vanishing and vanished ice patches.
Ghost patch archaeology
As ice patches vanish they sometimes leave behind ghost patches. We defined a ghost patch site as: (1) having an archaeological dimension; and (2) no longer containing old ice. For other former ice patch location terms, see VanderHoek and others (Reference VanderHoek, Wygal, Tedor and Holmes2007 p. 68). The novelty of “ghost patch” is that it distinguishes sites that have an archaeological dimension from geological phenomenon.
Melting ice patches may transition into perennial or intermittent snow patches. Such sites are ghost patches if they produce archaeological finds. Although they retain the capacity of accumulating perennial snow, firn, or even new ice, archaeologically they are fundamentally altered. During transition, well-preserved artifacts of fragile, organic components may still be recovered (e.g. Thomas and others, Reference Thomas, Greer and Pennanen2022), however the loss of old ice irreversibly and rapidly reduces the likelihood of such preservation.
Ice patch locations that in normal years retain no snow might remain visible in the landscape as lichen-free-zones, bleached halos, or sediment rich organic deposits with unique flora that can be identified through field observation or from remote sensing data. Such extinct ice patches, having not contained ice for a long time, would also constitute a ghost patch in our definition if surveying reveals archaeological artifacts.
In terms of our sites then, Storhornet remains an ice patch. It is a known archaeological site still containing ice despite a significant reduction in 2024. Coming years will show if Storhornet transitions to a ghost patch. Elghøa melted away in 2024. In a reality of short field seasons and stretched culture heritage resources, Elghøa represents a likely future of many ice and snow patches, their knowledge potential diminished before ever being surveyed. We will never know what these ice patches might have contained. Elghøa is now an intermittent or perennial snow patch. If archaeological artifacts are recovered, it would be a ghost patch.
Lågtangan most closely fits our ghost patch definition. The 2018 recovery of an iron arrowhead and wooden shaft fragment demonstrates its archaeological potential; and it no longer contains old ice. Farbregd (Reference Farbregd1972, p. 10) suggests that, for active ice patches, the age of a shaft fragment speaks to the age of the ice it emerged from. While not directly applicable to a ghost patch context, the 2018 finds indicate that the site has, until recently, contained old ice.
If current trends of vanishing ice continue, we must adapt our fieldwork priorities to prepare for a future in which ghost patches are the primary contexts for understanding past human–ice patch interaction. We must seek to better understand how and when these transitions occur, how they affect archaeological preservation, and how to adapt our surveying methodology to prioritize flexible fieldwork in dynamic conditions. Understanding ice patch to ghost patch transitions will enable future surveying efforts to focus on the most vulnerable sites.
Recommendations
Adapting archaeological fieldwork to the realities of vanishing ice patches is complicated and, to a large degree, dependent on local conditions and available resources. We suggest the following methodological updates for a future with less ice:
Site prioritization should be informed by fluctuations in recent yearly minimum extents to identify areas beyond current terminal edge still retaining archaeological potential (e.g. Pilø and others, Reference Pilø2022, p. 160). On site ground conditions such as slope, sediment accumulation and surface stability should also be considered.
Ghost patch sites can be identified in the field or through remote sensing by broadening surveyors’ focus beyond the presence of ice to include perennial snow patches, lichen-free zones, bleached halos, sediment accumulations and vegetation anomalies.
Field seasons can be extended by including potential ghost patches in surveying strategies because they can exist at lower elevations and become snow free earlier in the ablation season. During years when known sites are unproductive, they may provide alternative survey targets. Survey design should account for each site’s transition phase, focusing primarily on first-time melt events, and subsequent snow free years when fragile organic artifacts are most likely to remain recoverable.
In contexts where metal artifacts are probable, organic preservation is poor, or sediment accumulation is substantial, metal detectors may be a beneficial addition to visual surveying. Even without the presence of well-preserved organic artifacts, ghost patches may provide valuable insights into past human–ice patch interactions.
Conclusion
In this study, we used Sentinel-2 satellite images and field survey to investigate yearly minimum area extents between 2017 and 2024 for Storhornet, Elghøa and Lågtangan ice patches in the central Norwegian mountains. During this period, Storhornet lost a significant portion of its area, Elghøa completely vanished, and Lågtangan repeatedly phased in and out of existence. While they remain as perennial snow patches, Elghøa and Lågtangan can be added to the GLIMS list of extinct glaciers as they have lost their old ice. As perennial ice and snow vanish, these sites undergo dynamic and site-dependent transitions from archaeological ice patches to ghost patches. In the future, ghost patches and vanishing ice are likely to become the dominant source of knowledge on (pre)historic human–ice patch interactions. These transitions affect archaeological site potential and inform how we should adapt our site prioritization strategies and fieldwork methodologies to a future of further melt.
Supplementary material
The supplementary material for this article can be found at https://doi.org/10.1017/aog.2026.10039.
Acknowledgements
We thank two anonymous reviewers and scientific editor Gwenn Flowers for their valuable input that helped improve the manuscript. We thank Martin Callanan and Roberta Gordaoff for valuable comments and proof-reading of the manuscript. We thank Tord Bretten, Øyunn Wathne Sæther, and Roberta Gordaoff for assistance during fieldwork in 2024. The work is a contribution to the project NVE Copernicustjenester.
Data availibility statement
Artifact descriptions and photos are available through the NTNU University Museum Collections Online https://collections.vm.ntnu.no/. The 2017-24 outlines for the three locations are available as a DOI-referenced dataset in Nasjonalt vitenarkiv: https://doi.org/10.58059/spbv-gs87. Glacier outlines from GI2019 are available at https://nve.brage.unit.no/nve-xmlui/handle/11250/2836926.


 Open access

