





Introduction
The need for alternative weed control methods has increased due to restrictive pesticide regulations, complex registration procedures, and additional legislative constraints imposed by the Food Quality Protection Act and the Endangered Species Act (Dayan et al. Reference Dayan, Cantrell and Duke2009; Duzy et al. Reference Duzy, Campana and Brain2023; Loddo et al. Reference Loddo, McElroy and Giannini2021). The widespread herbicide resistance among problematic weed populations further limits the effectiveness of traditional chemical control strategies in turfgrass (Brosnan et al. Reference Brosnan, Elmore and Bagavathiannan2020; McCurdy et al. Reference McCurdy, Bowling, de Castro, Patton, Kowalewski, Mattox and Bagavathiannan2023). Growing public concern about environmental sustainability and potential health risks associated with synthetic herbicides (Li et al. Reference Li, Zhang, Yin, Cui, Cai, Chen, Jin, Robson, Li, Ren, Huang and Hu2014) further underscores the demand for innovative, nonchemical alternatives, particularly in residential, recreational, and urban turfgrass environments where public exposure is significant (Hahn et al. Reference Hahn, Sallenave, Pornaro and Leinauer2020; Md Meftaul et al. Reference Md Meftaul, Venkateswarlu, Dharmarajan, Annamalai and Megharaj2020).
Laser weed control technology has become feasible with recent advancements in artificial intelligence (AI) and machine vision, allowing real-time weed identification while precisely targeting the plant meristems (Rakhmatulin et al. Reference Rakhmatulin, Kamilaris and Andreasen2021). This method functions by directing concentrated light energy onto weeds, inflicting thermal damage that either stunts their growth or causes their termination. Laser weeding involves raising the temperature of targeted plant parts, like the apical meristem or stem, to lethal levels, which disrupts cell integrity and halts essential biological processes (Andreasen et al. Reference Andreasen, Scholle and Saberi2022; Heisel et al. Reference Heisel, Schou, Andreasen and Christensen2002; Mathiassen et al. Reference Mathiassen, Bak, Christensen and Kudsk2006; Mwitta et al. Reference Mwitta, Rains and Prostko2022). Laser weed control utilizes machine learning algorithms to precisely target individual weed seedlings without damaging crops (Sosnoskie et al. Reference Sosnoskie, Bill, Butler-Jones, Bouchelle and Besançon2025). Carbon Robotics (Seattle, WA, USA) manufactures equipment featuring arrays of thirty 150-W CO2 lasers coupled with 42 high-resolution AI-driven cameras for accurate weed discrimination (Sosnoskie et al. Reference Sosnoskie, Bill, Butler-Jones, Bouchelle and Besançon2025). Another company, WeedBot, developed Lumina, a laser weeder prototype that uses AI for weed recognition and blue lasers for targeting weeds and can operate up to 1.5 km h−1 (WeedBot n.d.). Earth Rover developed CLAWS™, which integrates AI-driven machine vision with eight cameras and Lightweeder™ modules to target the weed meristem using concentrated blue light. This system is battery and solar powered and operates autonomously (European Space Agency n.d.).
Laser weeding technology presents both advantages and limitations for weed management. In a recent survey of European stakeholders, key benefits identified by participants included reduced labor requirements, high precision in weed targeting, and environmental sustainability (Tran et al. Reference Tran, Schouteten and Degieter2023). Conversely, the technology still faces several challenges, such as high energy consumption, a narrow window for targeting weed seedlings, limited operational speed of 4 to 6 km h−1, and substantial initial investment costs (Andreasen et al. Reference Andreasen, Saberi and Rakhmatulinn.d.). In turfgrass settings, weed management presents distinct challenges compared with production agriculture. Turfgrass weeds are often treated at growth stages significantly more advanced than those targeted in cropping systems. For example, the recommended growth stages of smooth crabgrass [Digitaria ischaemum (Schreb.) Schreb. ex Muhl] control with Callisto® (mesotrione) at 140 g ai ha−1 in production agriculture are 1- to 6-leaf stage (Anonymous 2024), while Digitaria spp. are usually targeted with Tenacity® (mesotrione) at 175 g ai ha−1 in turf at the 3-tiller stage or beyond. Targeting more mature weeds can require more laser energy. Research by Coleman et al. (Reference Coleman, Betters, Squires and Walsh2021) demonstrated that high-energy dosages (76.4 J mm⁻2) effectively controlled annual ryegrass (Lolium rigidum Gaudin) at early stages but failed to achieve adequate control at mid- to late tillering stages. Additionally, Heisel et al. (Reference Heisel, Schou and Christensen2001) reported that common lambsquarters (Chenopodium album L.) and wild mustard (Sinapis arvensis L.) exhibited regrowth after stems being cut with a laser treatment at late growth stage. These results emphasize the importance of targeting stems as close to the soil surface as possible or applying treatments at the seedling stage (Andreasen et al. Reference Andreasen, Scholle and Saberi2022).
Mature weeds have greater shoot biomass, increased numbers of meristems, and enhanced tolerance to mechanical disruptions, presenting significant hurdles for laser weed management (Rakhmatulin and Andreasen Reference Rakhmatulin and Andreasen2020; Sugiyama Reference Sugiyama2005). For instance, D. ischaemum and goosegrass [Eleusine indica (L.) Gaertn.] can tolerate mowing heights as low as 1.2 cm while surviving in rosette patterns in which a mature plant can develop over a dozen tillers in summer (Abbey et al. Reference Abbey, Landschoot and Delvalle2022). Although laser weeding through rapid energy bursts has proven effective in controlling small seedlings in production crops, its use for managing mature weeds and its effects on turfgrass tolerance have not yet been investigated. Thus, optimizing laser parameters, including energy intensity, application pattern, and treatment frequency, is critical to effectively manage mature turfgrass weeds without negatively affecting desirable turfgrass.
Both laser energy quantity and pattern would be expected to influence weed control, because parameter changes will lead to modifications in intensity. By optimizing these parameters, this research seeks to reduce the time and energy needed to control key weeds in turfgrass and evaluate turf recovery rates. This work is based on the assumption that equipment similar to machines already commercialized in production agriculture could likewise be used to apply laser energy directly to targeted weeds in turfgrass systems. In most production agriculture systems, laser weeding is performed by applying energy to a single point on individual weed seedlings, typically at the apical meristem, using stationary or pulsed delivery systems (Heisel et al. Reference Heisel, Schou, Andreasen and Christensen2002; Mathiassen et al. Reference Mathiassen, Bak, Christensen and Kudsk2006). This approach is effective at early growth stages but less applicable to turfgrass settings, where weeds are often mature, low-growing, and embedded within a dense canopy. In contrast, our proposed method involves delivering laser energy via a continuously moving laser head over the weed-infested turf surface. This movement results in a distinct spatial and temporal energy distribution not addressed by previous single-point applications. To quantify this dynamic delivery system, we introduced the concept of laser pattern-averaged energy density (PAED), which integrates energy, movement, and spacing parameters into a single metric. Expressed in joules per square centimeter (J cm⁻²) to represent spatially averaged energy across the treated area, PAED allows us to compare and optimize laser dose delivery across treatments in a way that is both reproducible and applicable to complex turfgrass environments. The objectives of our research were to develop a method to deliver laser energy to turfgrass and weed species. This research aims to address significant knowledge gaps regarding the practical application of laser weed technology in turfgrass; specifically: to identify optimal laser application parameters for effectively targeting mature weeds, reduce the energy and time required for weed control, and evaluate turfgrass recovery posttreatment. The objectives of our research experiments include examining the impacts of varying laser energy levels, application patterns, and multiple treatment passes on weed control of annual bluegrass (Poa annua L.) and D. ischaemum, and turfgrass recovery rates for key turf species, such as bermudagrass [Cynodon dactylon (L.) Pers.] and creeping bentgrass (Agrostis stolonifera L.).
Materials and Methods
Two studies were conducted, each implemented across four species (P. annua, bermudagrass, creeping bentgrass, and D. ischaemum) at two locations. In this paper, the term “study” refers to the two main components of the research design: Study 1 evaluated increasing laser intensity (PAED, with corresponding changes in line-specific energy density [LSED]), and Study 2 evaluated laser pattern configuration (line spacing, number of passes, and PAED). An experiment is defined as a single species-by-site combination. Thus, each study consisted of 8 experiments (4 species × 2 sites), totaling 16 experiments conducted from July 2024 to March 2025. All experiments were performed on research fairways mowed at 13 to 19 mm three times per week at the Turfgrass Research Center (TRC; 37.215°N, 80.413°W) and the Glade Road Research Facility (37.234°N, 80.436°W) in Blacksburg, VA. Each species was evaluated independently in monoculture plots. Weed experiments used natural infestations of D. ischaemum or P. annua, whereas turfgrass experiments used pure stands of bermudagrass (‘Patriot’ at Site 1; ‘Latitude 36’ at Site 2) and creeping bentgrass (‘L93’ at both sites). No plot contained a mixture of turf and weeds. Thus, weeds or turf occupy essentially 100% of the treated area, which was 100 cm2.
Weed and Turfgrass Response to Increasing PAED
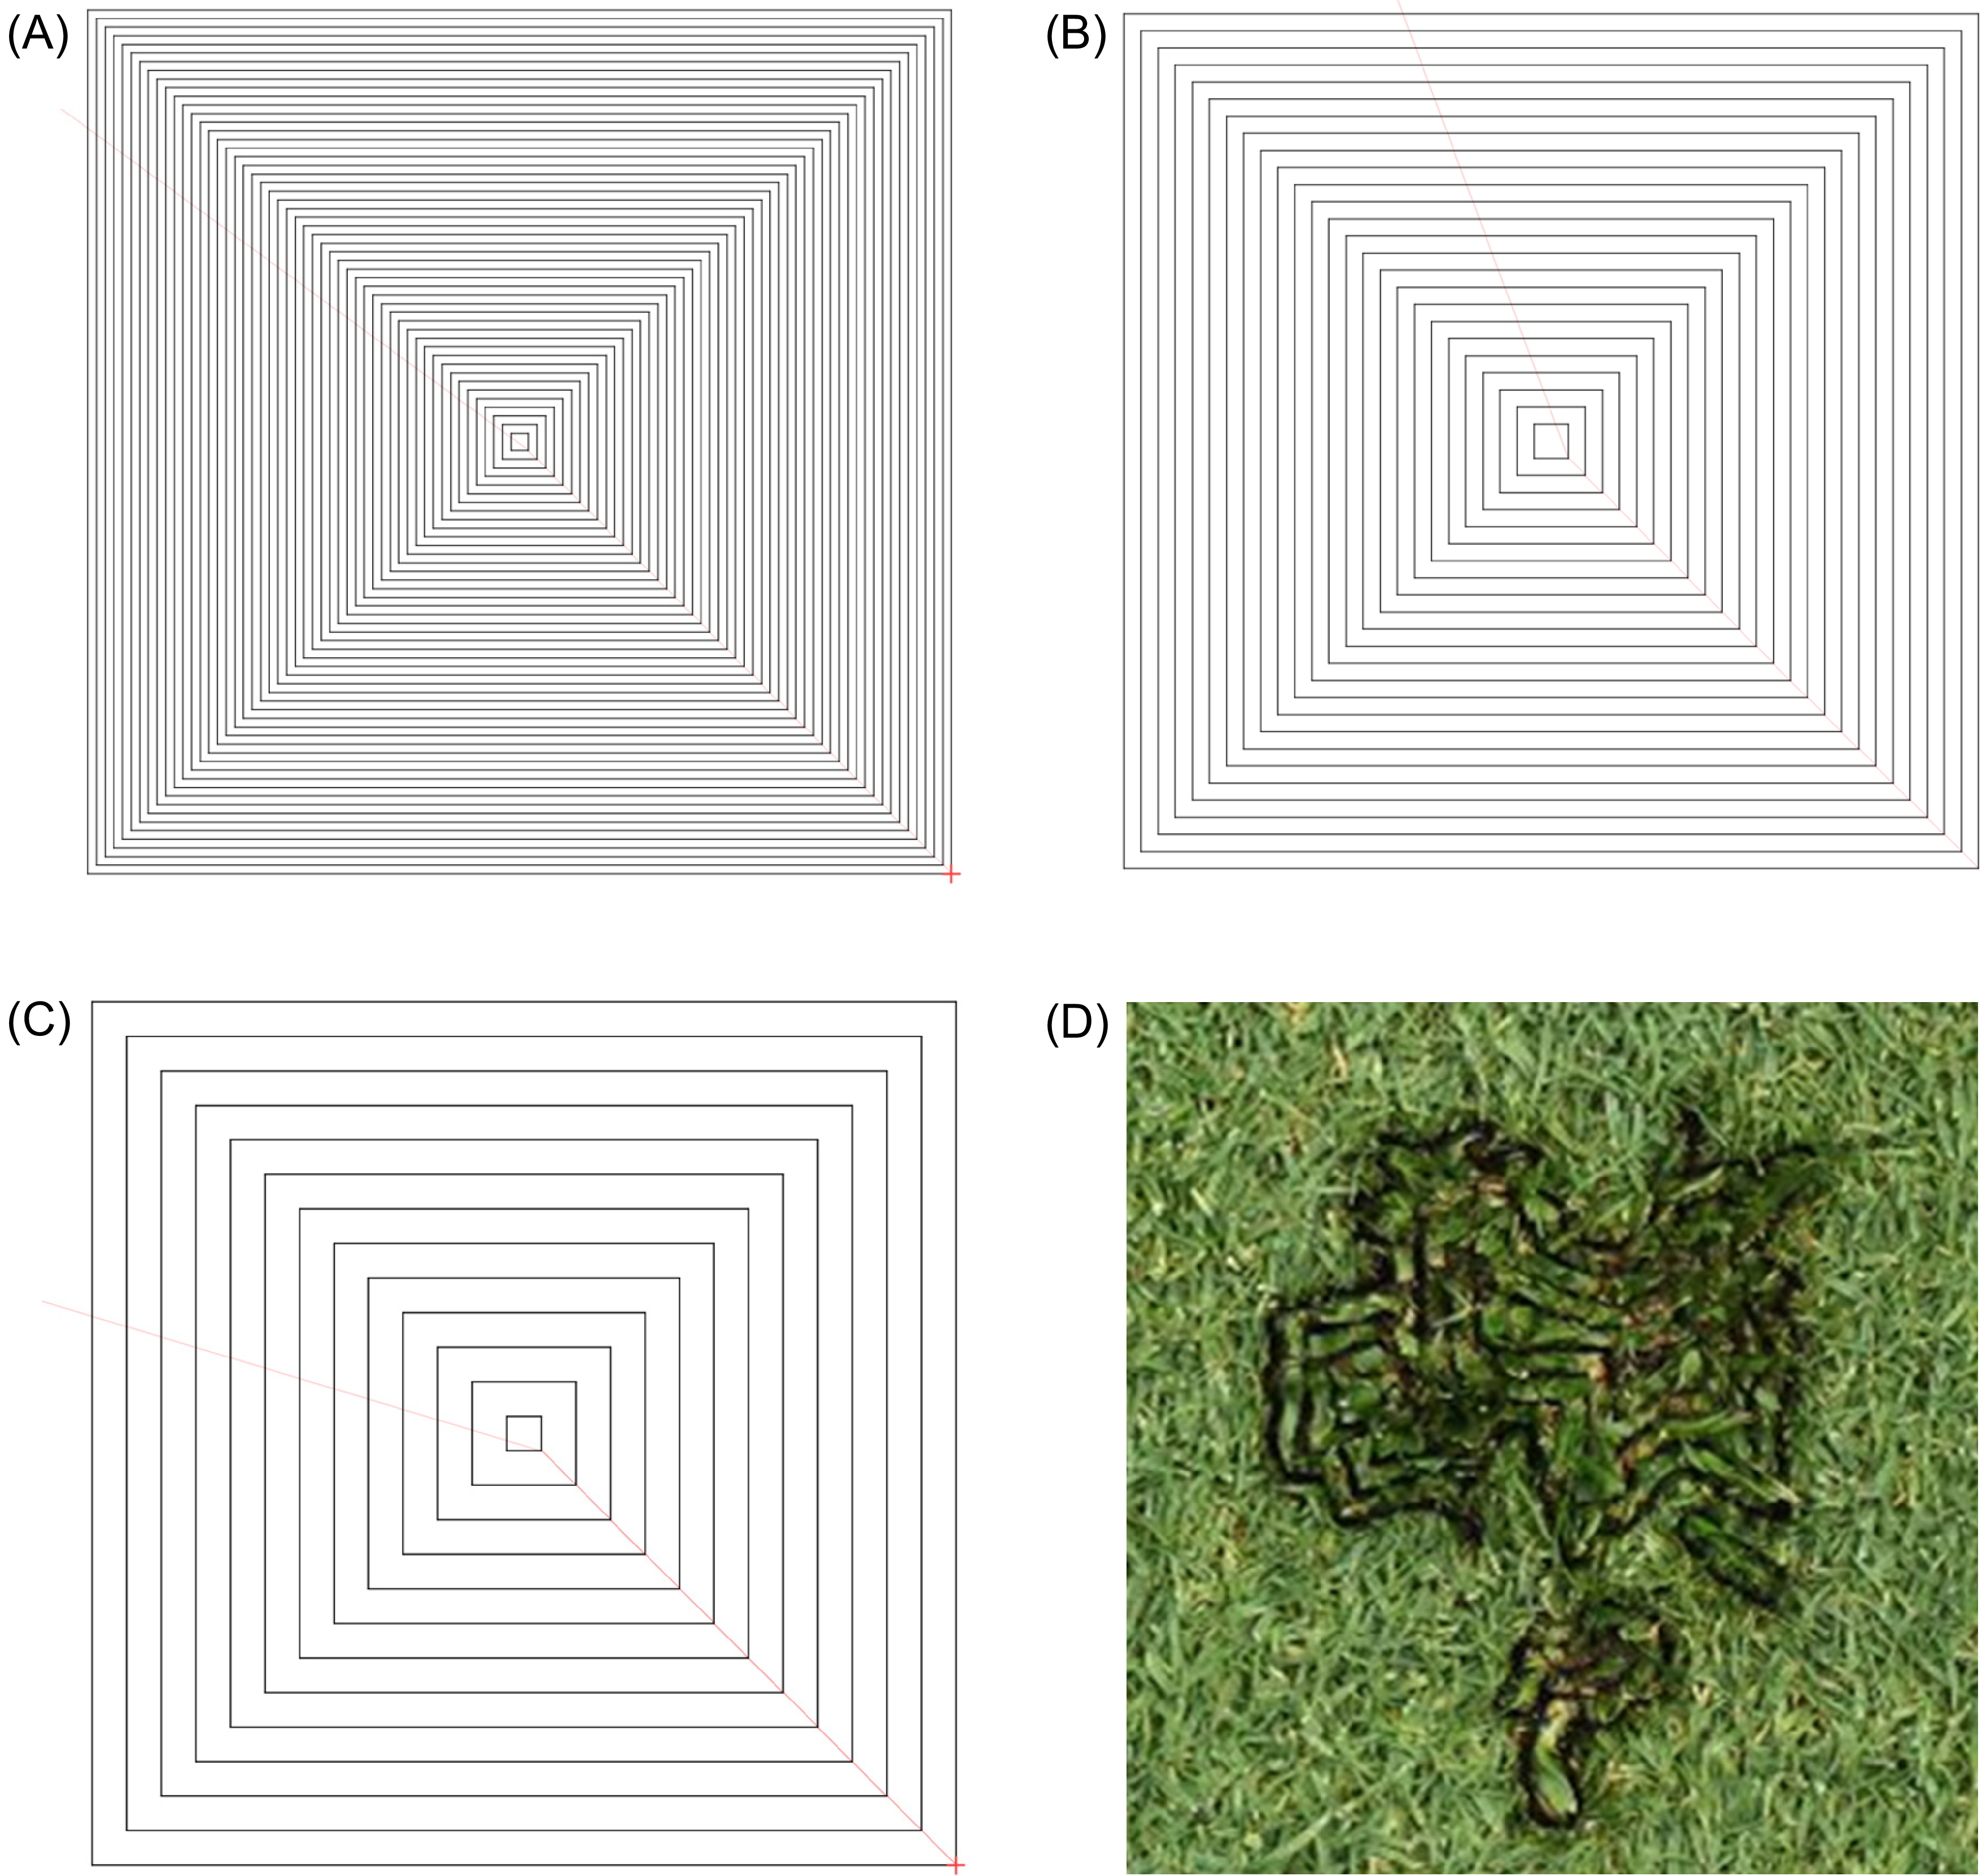
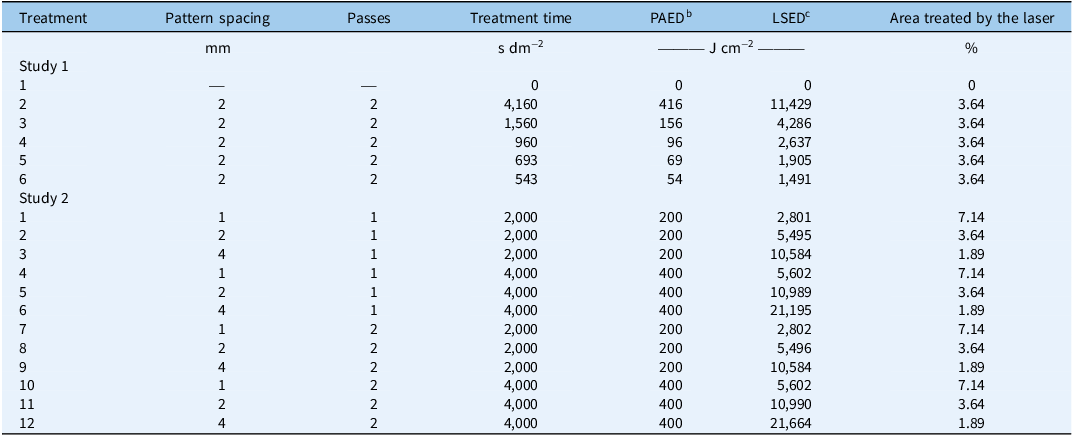
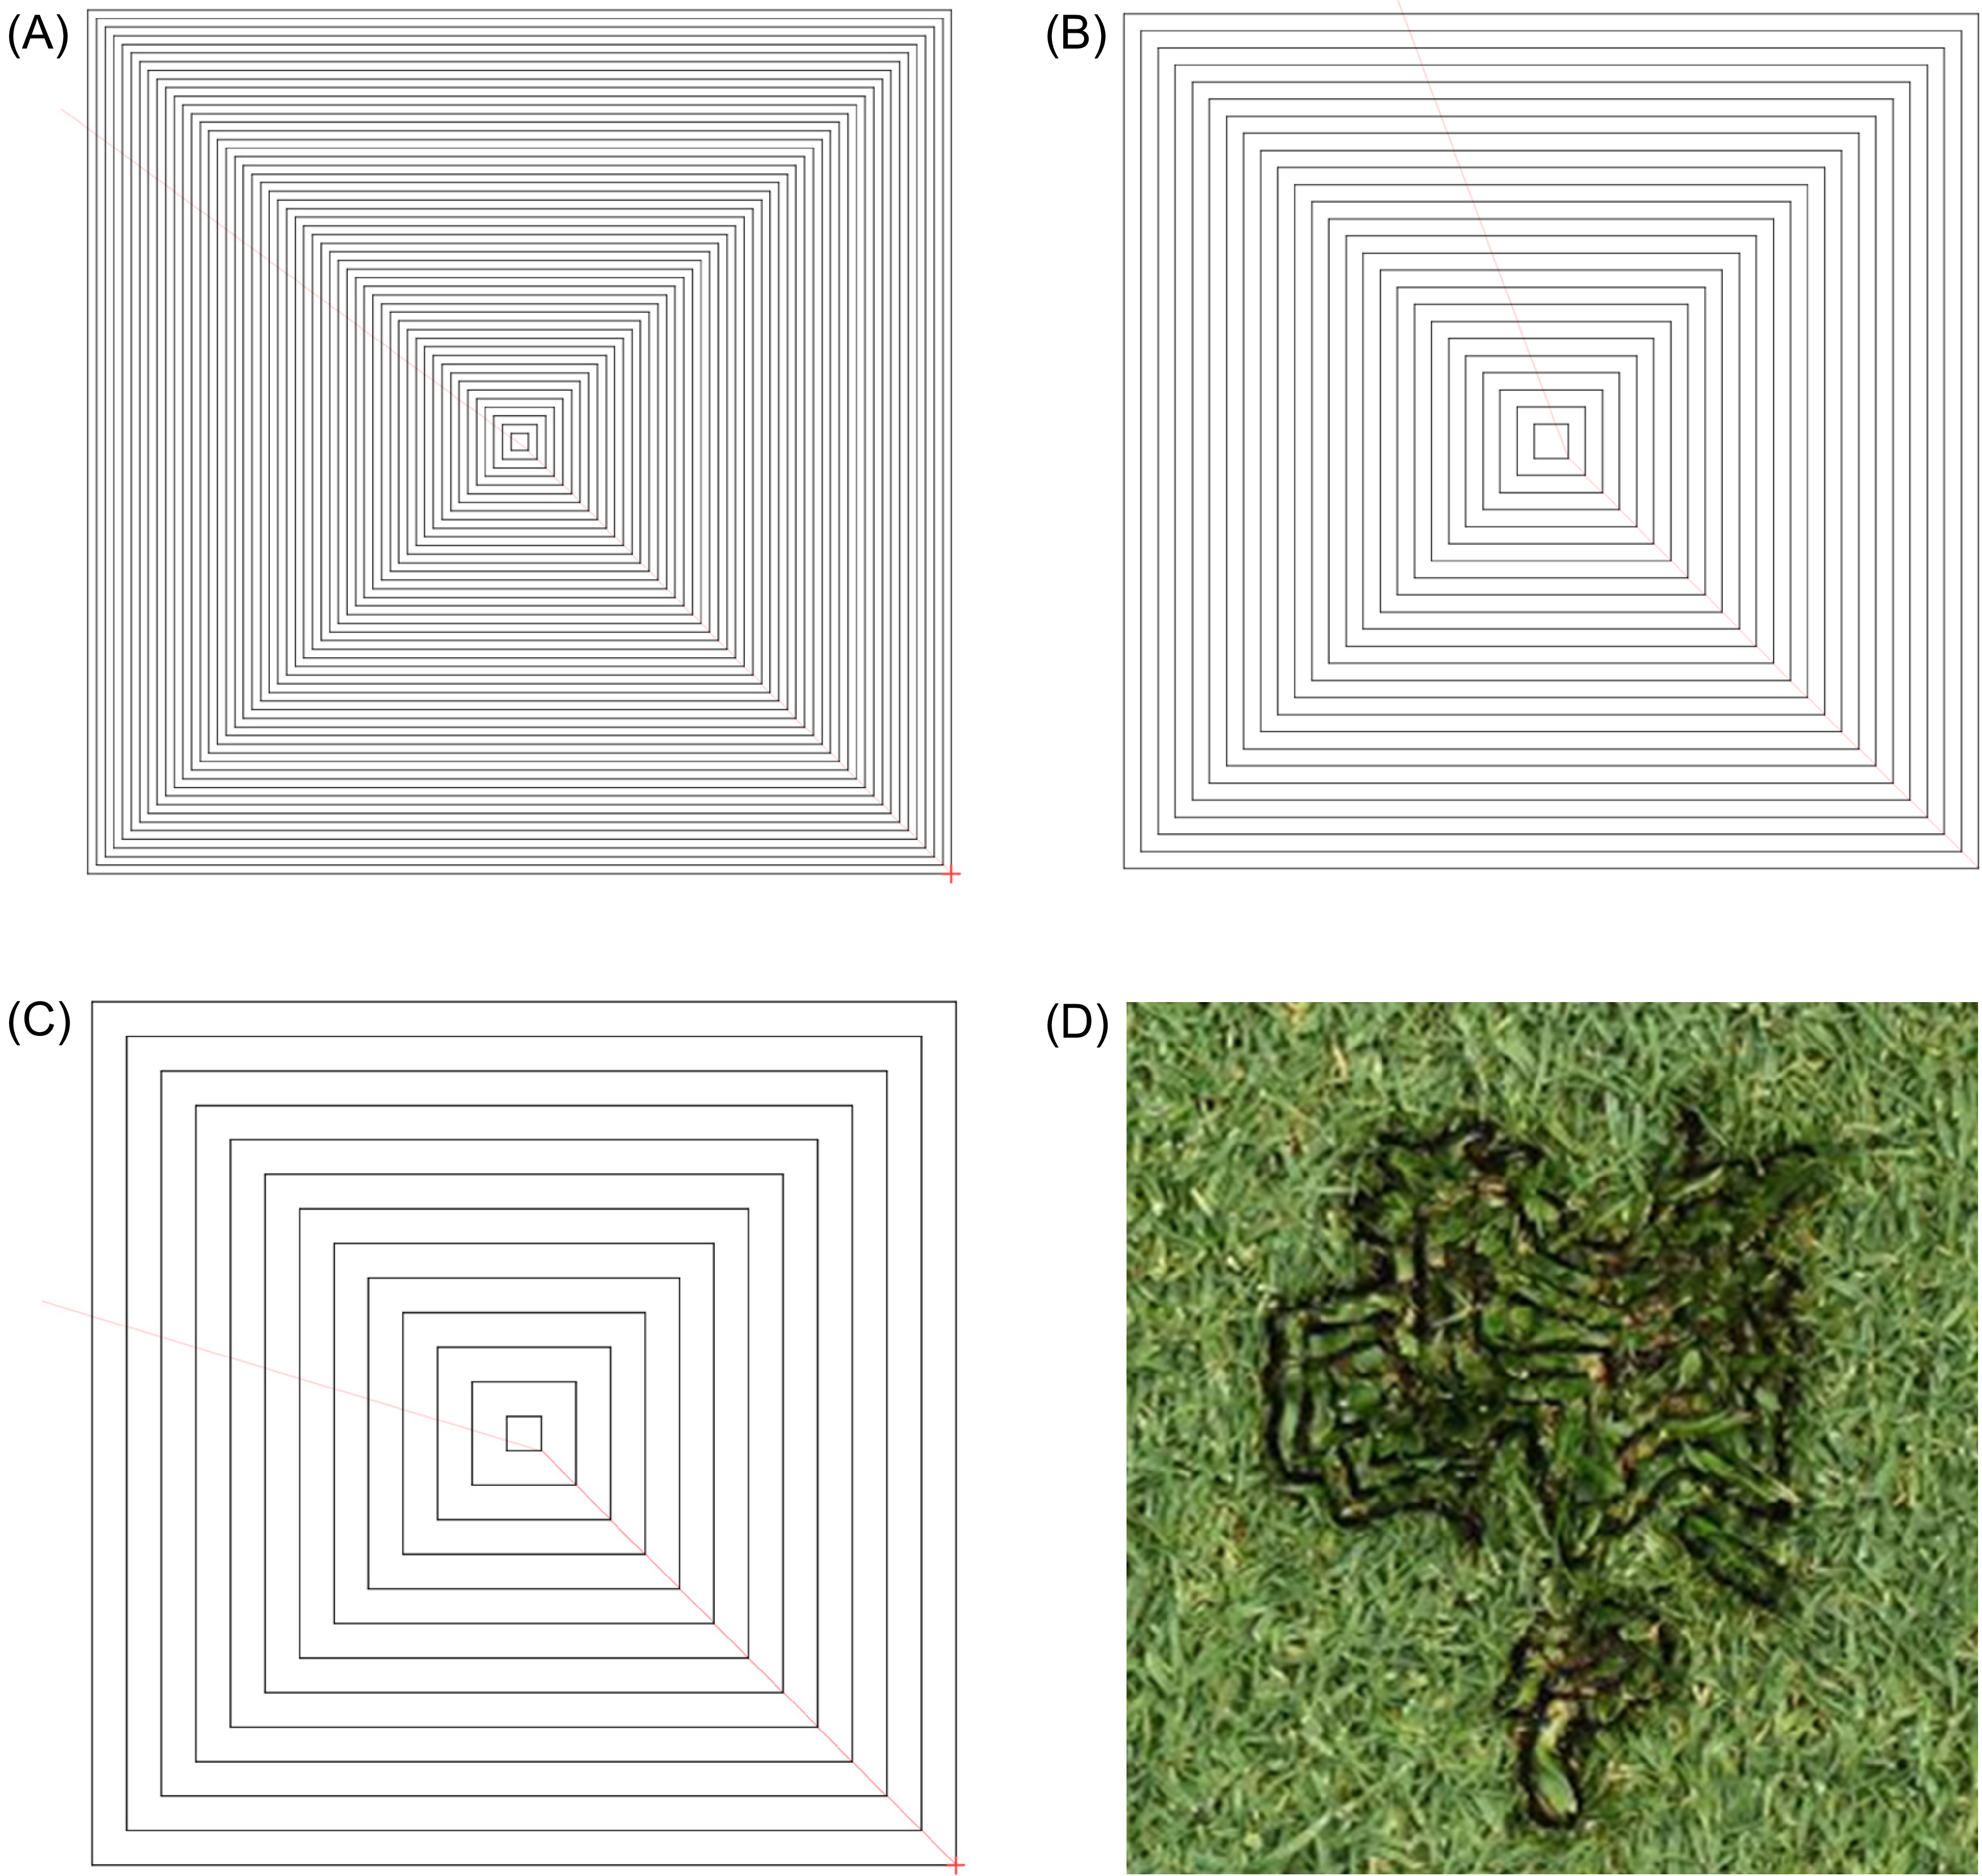
This study was implemented as a single-factor randomized complete block design with four replicates and two trial sites. The single factor consisted of six different levels of PAED achieved by altering the operating speed of a 10-W diode laser engraver (Xtool D1, Makeblock, Shenzhen, China); the unit uses a semiconductor to emit a continuous wave radiation at a wavelength of 455 nm (blue region). The laser head produces a 0.08 mm by 0.06 mm laser dot (Table 1). The module uses a built-in fixed-focus mechanism with a standardized focusing height of ∼20 mm, consistently maintained to keep the laser at a fixed distance from the turf canopy. In this study, the laser energy was applied in two passes of a continuous square spiral with lines spaced 2 mm apart (Figure 1B) on 100-cm2 plots.
Parameters of laser energy and varying pattern for two studies conducted to influence Digitaria ischaemum, Poa annua, bermudagrass, and creeping bentgrass green cover over time.a
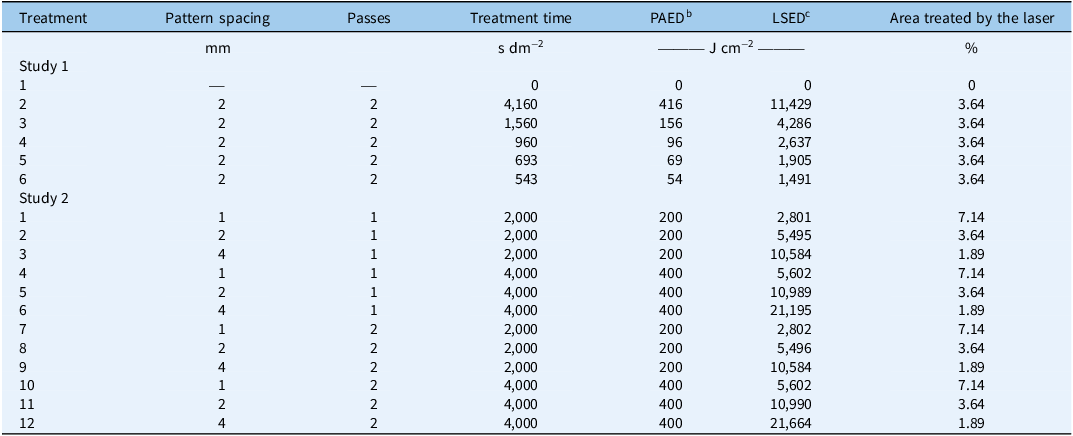
a Laser spot diameter was 0.08 mm × 0.06 mm from a 10-W diode laser and delivered a continuous square spiral pattern to 100-cm2 plots in all cases. For patterns that received two passes, the second pass was initiated immediately after the first pattern was finished.
b Laser intensity was based on the pattern-averaged energy density (PAED) calculated as PAED (J cm−2) = (e*t)/A, where e is laser energy (W), t is time to treat a given pattern on a given plot (s), and A is the area of the treated plot (cm2).
c The line-specific energy density (LSED) describes radiation actually delivered to each line in a given pattern and is calculated as LSED (J cm−2) = (e*t)/A t where A t is the ratio of treated area to total area in each plot.
Schematic representation of a continuous square spiral pattern: (A) 1-mm spacing, (B) 2-mm spacing, and (C) 4-mm spacing between lines. (D) Example of a 2-mm spacing pattern burned in a Digitaria ischaemum weed.
Levels of PAED, LSED, and other treatment parameters are listed in Table 1. Laser PAED is the amount of energy delivered over the total area where a given pattern has been burned and is expressed in Equation 1 as:
 $${{\rm PAED\ (J\ cm^{-2})}=(e^{*}t)/A}$$
where e is laser energy (W), t is time to treat a given pattern on a given plot (s), and A is the area of the treated plot (cm2). The LSED, which is the amount of energy delivered in each pattern line, is explained in Equation 2 as:
 $${\rm LSED\ (J\ cm^{-2})}=(e^{*}t)/A_{\rm t}$$
where A t is the ratio of treated area to total area in each plot. These calculations allow comparison of treatment intensities across moving laser patterns and ensure consistent reporting of both total energy exposure and concentrated dose at the point of contact. The diode laser was directed via LightBurn software (LightBurn Software, Pasadena, TX, USA). Plot edges were cut before each data assessment with a 100 cm−2 metal tubing to avoid lateral growth into the plots from adjacent, nontreated areas. The use of a two-pass pattern with 2-mm line spacing was based on preliminary experiments, where laser energy delivered in two passes delayed creeping bentgrass recovery compared to one pass and equivalent to three passes (Romero et al. Reference Romero, Godara and Askew2025). Digital pictures were collected at 0, 3, 7, 14, 21, and 28 d after treatment (DAT) using a custom lightbox with two LED lights (Husky cordless 2,000 Lumens Model EL2206, The Home Depot, Atlanta, GA); lights were positioned on opposite sides of the interior frame at 1.2192 m (122 cm) above the ground and directed downward to provide a uniform, shadow-free illumination across the plots. The lightbox housed a digital camera (Canon EOS 5D Mark IV, Tokyo, Japan) and a 100-mm macro lens EF 100 mm f/2.8L (Macro IS USM, Tokyo, Japan) affixed with an exclusion plate with an opening specific to each plot. Digital images were analyzed for green cover via Turf Analyzer (Green Research Services, Fayetteville, AR, USA), based on hue (60 to 360) and saturation (39 to 100) thresholds. Green cover data at each assessment date were converted to a percent reduction compared with the initial pretreatment cover. Percentage cover–reduction data from each species were subjected to ANOVA using PROC GLM in SAS v. 9.3 (SAS Institute, Cary, NC, USA) with sums of squares partitioned to reflect treatment, trial, and trial by treatment. Trial was considered a random variable in the combined analysis, and mean squares of treatment were tested by mean squares of trial by treatment. Means were separated using Fisher’s protected LSD (α = 0.05) and separately by trials if the interaction was significant; otherwise, means were pooled over sites.
Weed and Turfgrass Response to Varied Laser Pattern at Discrete Energy Levels
A total of eight field experiments were conducted as randomized complete block designs at adjacent sites and times compared with the previous study but employing a two by two by three factorial treatment design (Table 1). The three factors evaluated were two levels of PAED (200 and 400 J cm−2), three levels of line frequency in a continuous square spiral (1, 2, or 4 mm apart; Figure 1), and the number of times the laser passed over each line (once or twice) (Table 2). Subsequent passes were initiated immediately after the entire pattern was completed. The two levels of PAED were selected to represent an intermediate and high laser intensity based on the response patterns observed in Study 1. Data collection and statistical analysis were the same as in the previous study, although the ANOVA included additional partitions for the sums of squares of PAED, pattern line spacing, number of passes, trial, and all possible interactions of these variables. In all cases, significant interactions were presented in lieu of main effects. Where PAED main effects or interactions were significant, regressions were used to describe the relationship of PAED to green cover reduction.
Main effect of laser pattern line spacing on Digitaria ischaemum and Poa annua green cover reduction at 3 d after treatment (DAT) and 28 DAT, respectively; interaction of trial by pattern-averaged energy density (PAED) by pattern line spacing for Digitaria ischaemum at 28 DAT; and interaction of trial by pattern line spacing for Poa annua green cover reduction at 3 DAT.a

a Laser spot diameter was 0.08 mm × 0.06 mm from a 10-W diode laser and delivered a continuous square spiral pattern to 100-cm2 plots in all cases. For patterns that received two passes, the second pass was initiated immediately after the first pattern was finished. Means followed by the same letter within each column are not different based on Fisher’s protected LSD (α = 0.05).
b Laser intensity was based on the PAED calculated as PAED (J cm−2) = (e*t)/A, where e is laser energy (W), t is time to treat a given pattern on a given plot (s), and A is the area of the treated plot (cm2).
Results and Discussion
Weed and Turfgrass Response to Increasing PAED
Digitaria ischaemum
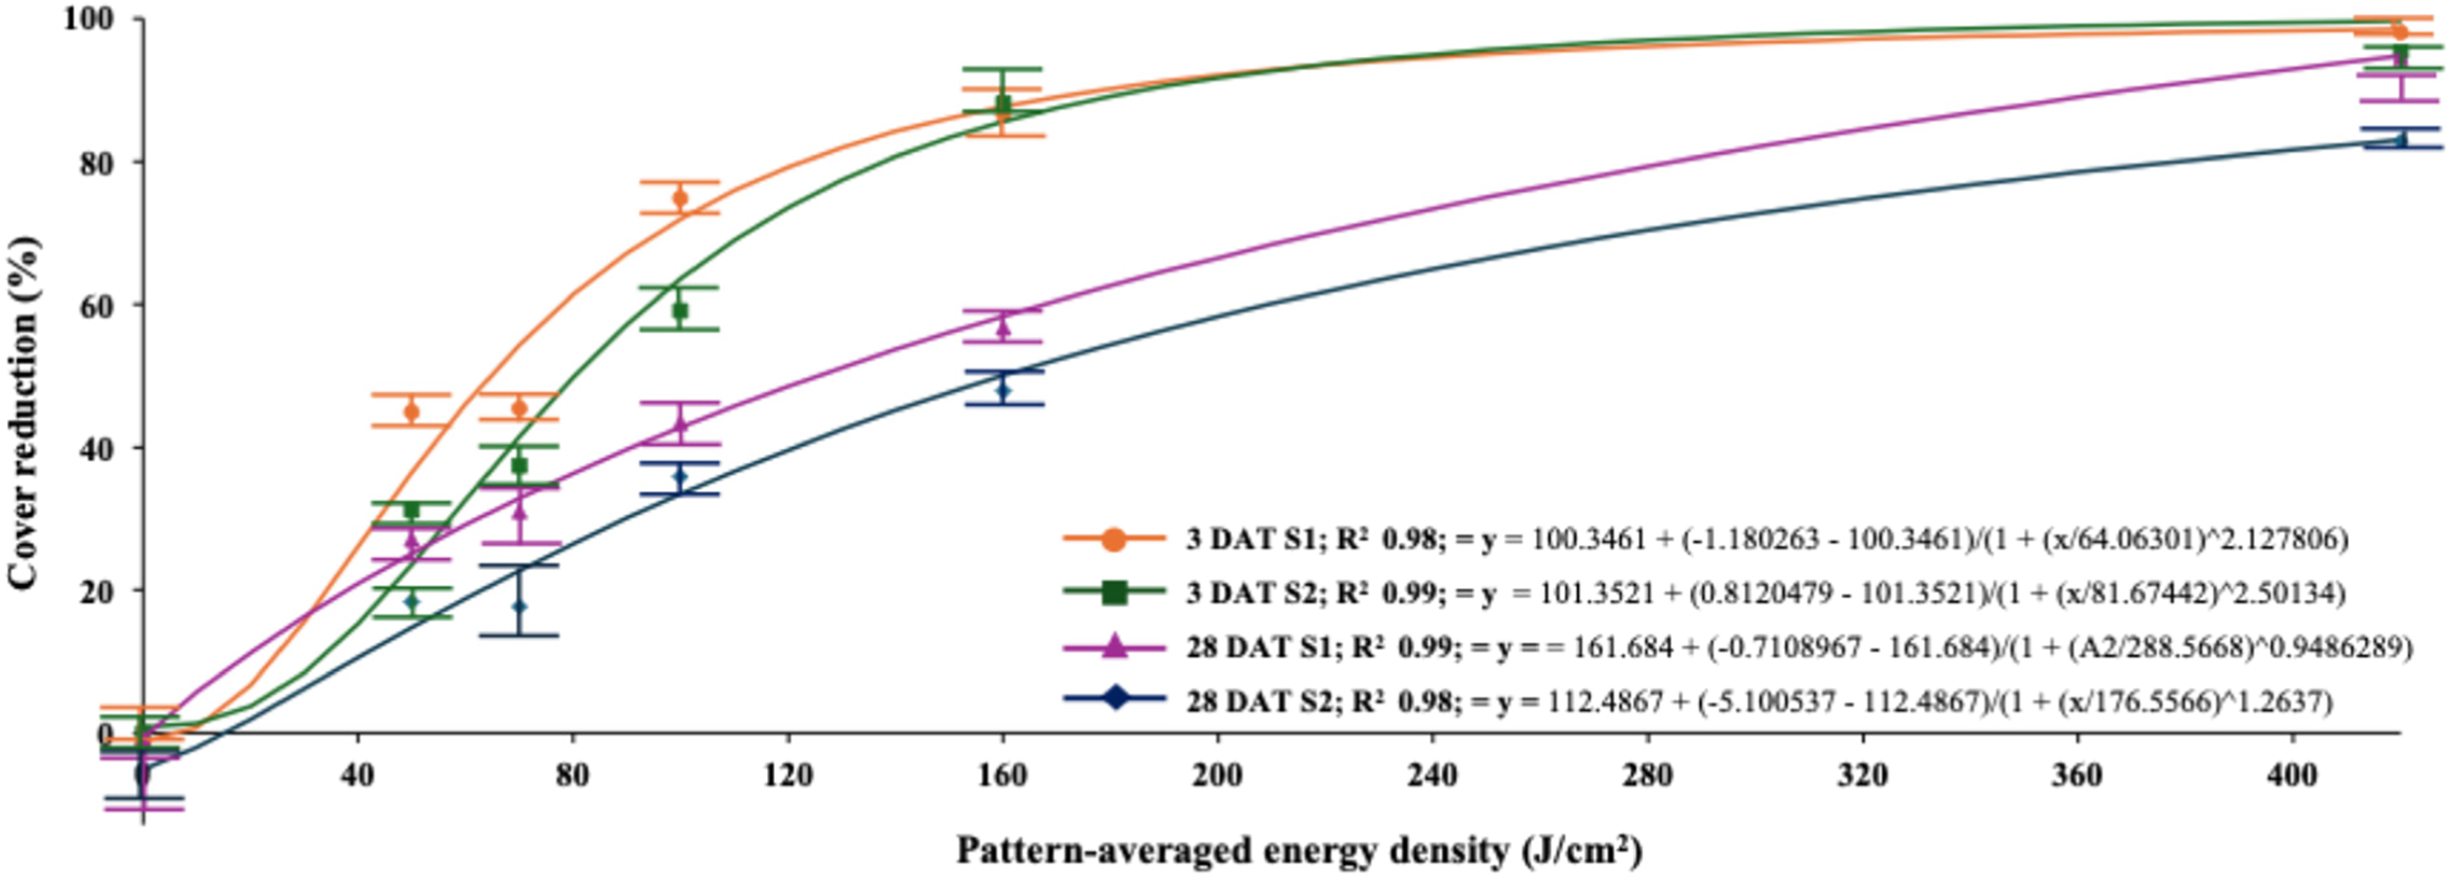
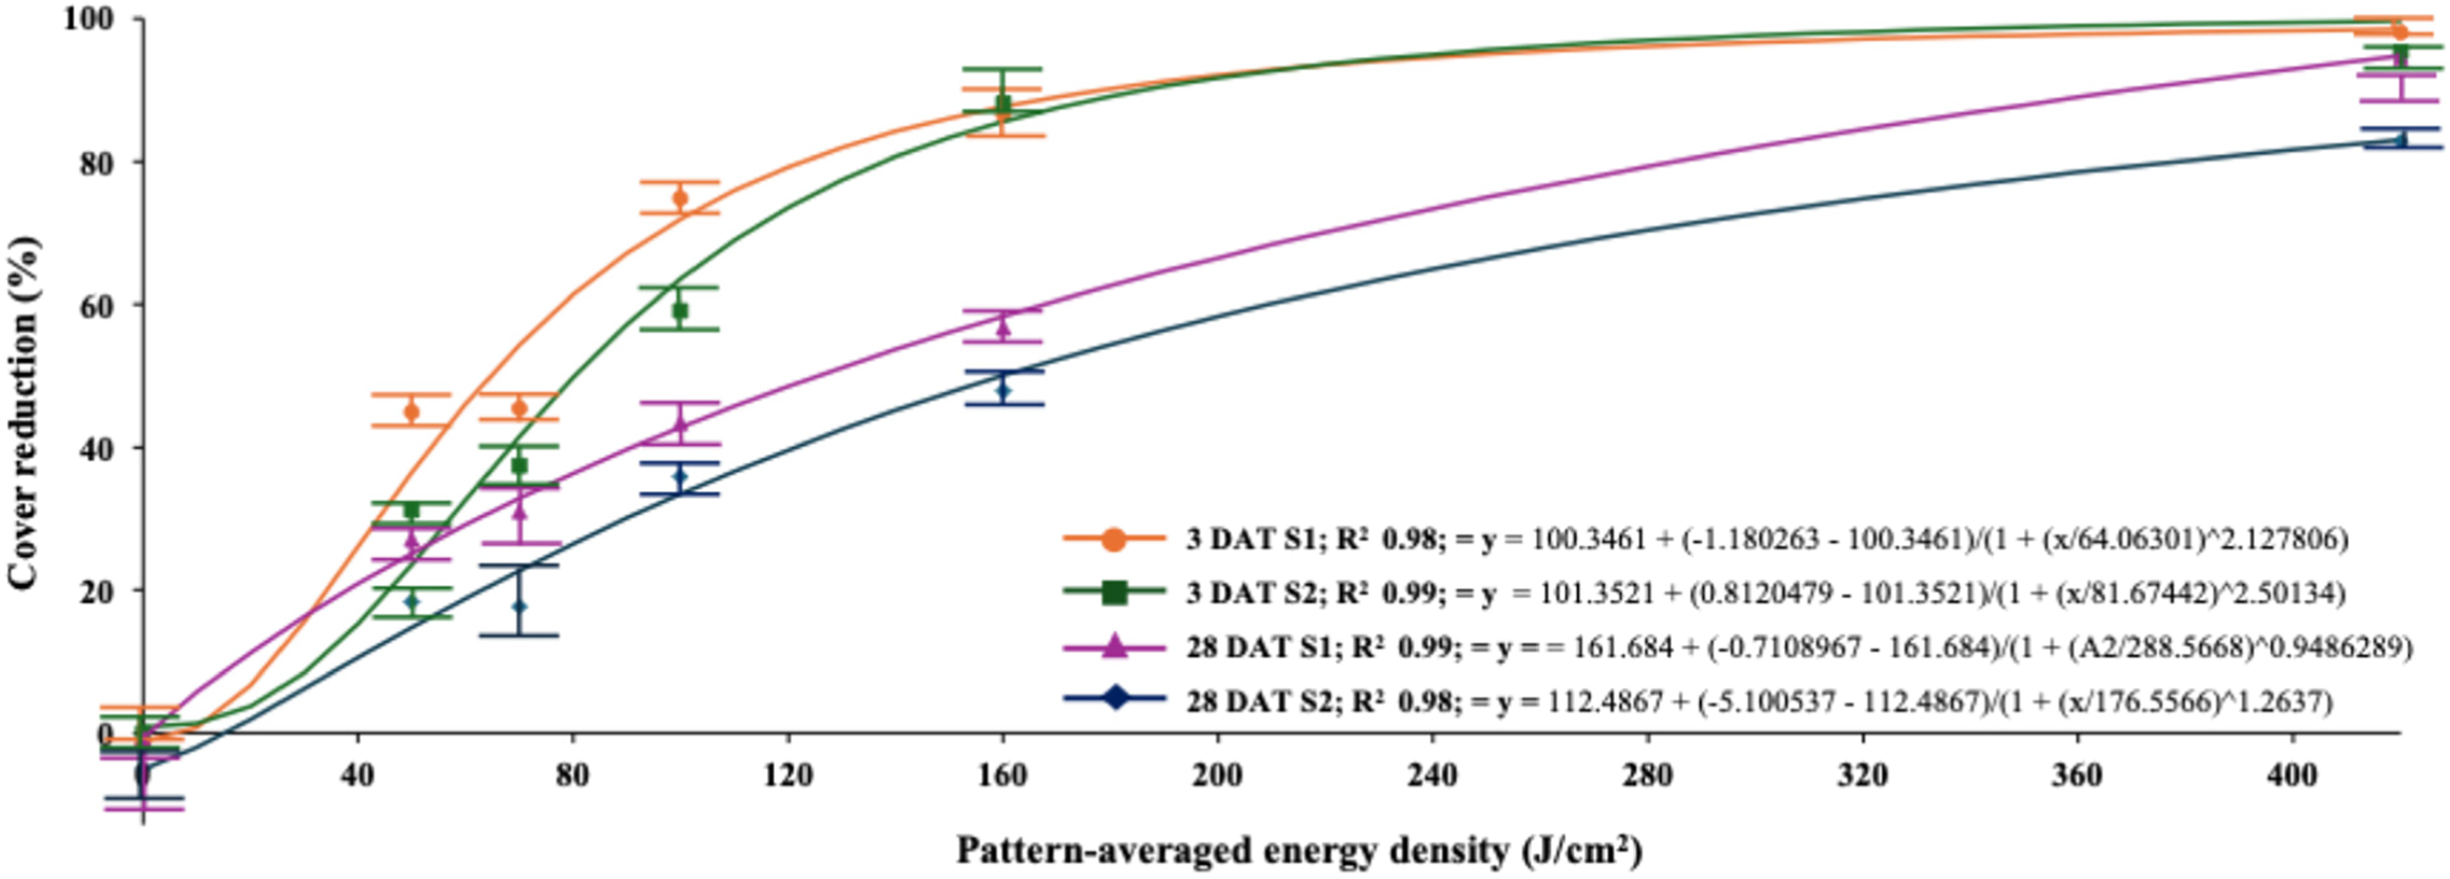
The interaction of trial by treatment was significant for D. ischaemum green cover reduction at 3 DAT (P < 0.0001) and 28 DAT (P = 0.0091) (Figure 2). At 3 DAT, both sites exhibited rapid discoloration, with cover reduction exceeding 90% at 160 J cm⁻² PAED. By 220 J cm⁻², responses had plateaued near 95% at both locations, indicating consistent acute injury across trials at higher dosages. However, differential recovery was observed by 28 DAT. At Site 1, green cover reduction reached 93% at the maximum dose of 410 J cm⁻², while Site 2 maintained 82% reduction, suggesting less persistent injury under those conditions. These trial-dependent outcomes may reflect differences in D. ischaemum maturity (2 to 4 tillers at Site 1 vs. 4 to 6 tillers at Site 2), edaphic factors, or irrigation regimes. Nonetheless, the level of suppression observed is comparable to that of postemergence herbicides such as fenoxaprop (Brewer et al. Reference Brewer, Willis, Rana and Askew2017), mesotrione (Goddard et al. Reference Goddard, Goncalves and Askew2021; Goncalves et al. Reference Goncalves, Ricker and Askew2021), quinclorac (Willis et al. Reference Willis, Beam, Barker and Askew2006), and topramezone (Brewer and Askew Reference Brewer and Askew2021; Cox et al. Reference Cox, Rana, Brewer and Askew2017). In addition, the conditions of this study, although optimized for tracking fluctuations in weed green cover via digital image analysis, preclude turfgrass competition with weeds, which could have enhanced weed mortality or reduced weed recovery (Koo et al. Reference Koo, Goncalves and Askew2022).
Study1: influence of laser intensity levels achieved by different speeds on digitally assessed Digitaria ischaemum green cover reduction compared with the initial cover at 3 d after treatment (DAT) and 28 DAT by site (S1, S2).
Poa annua
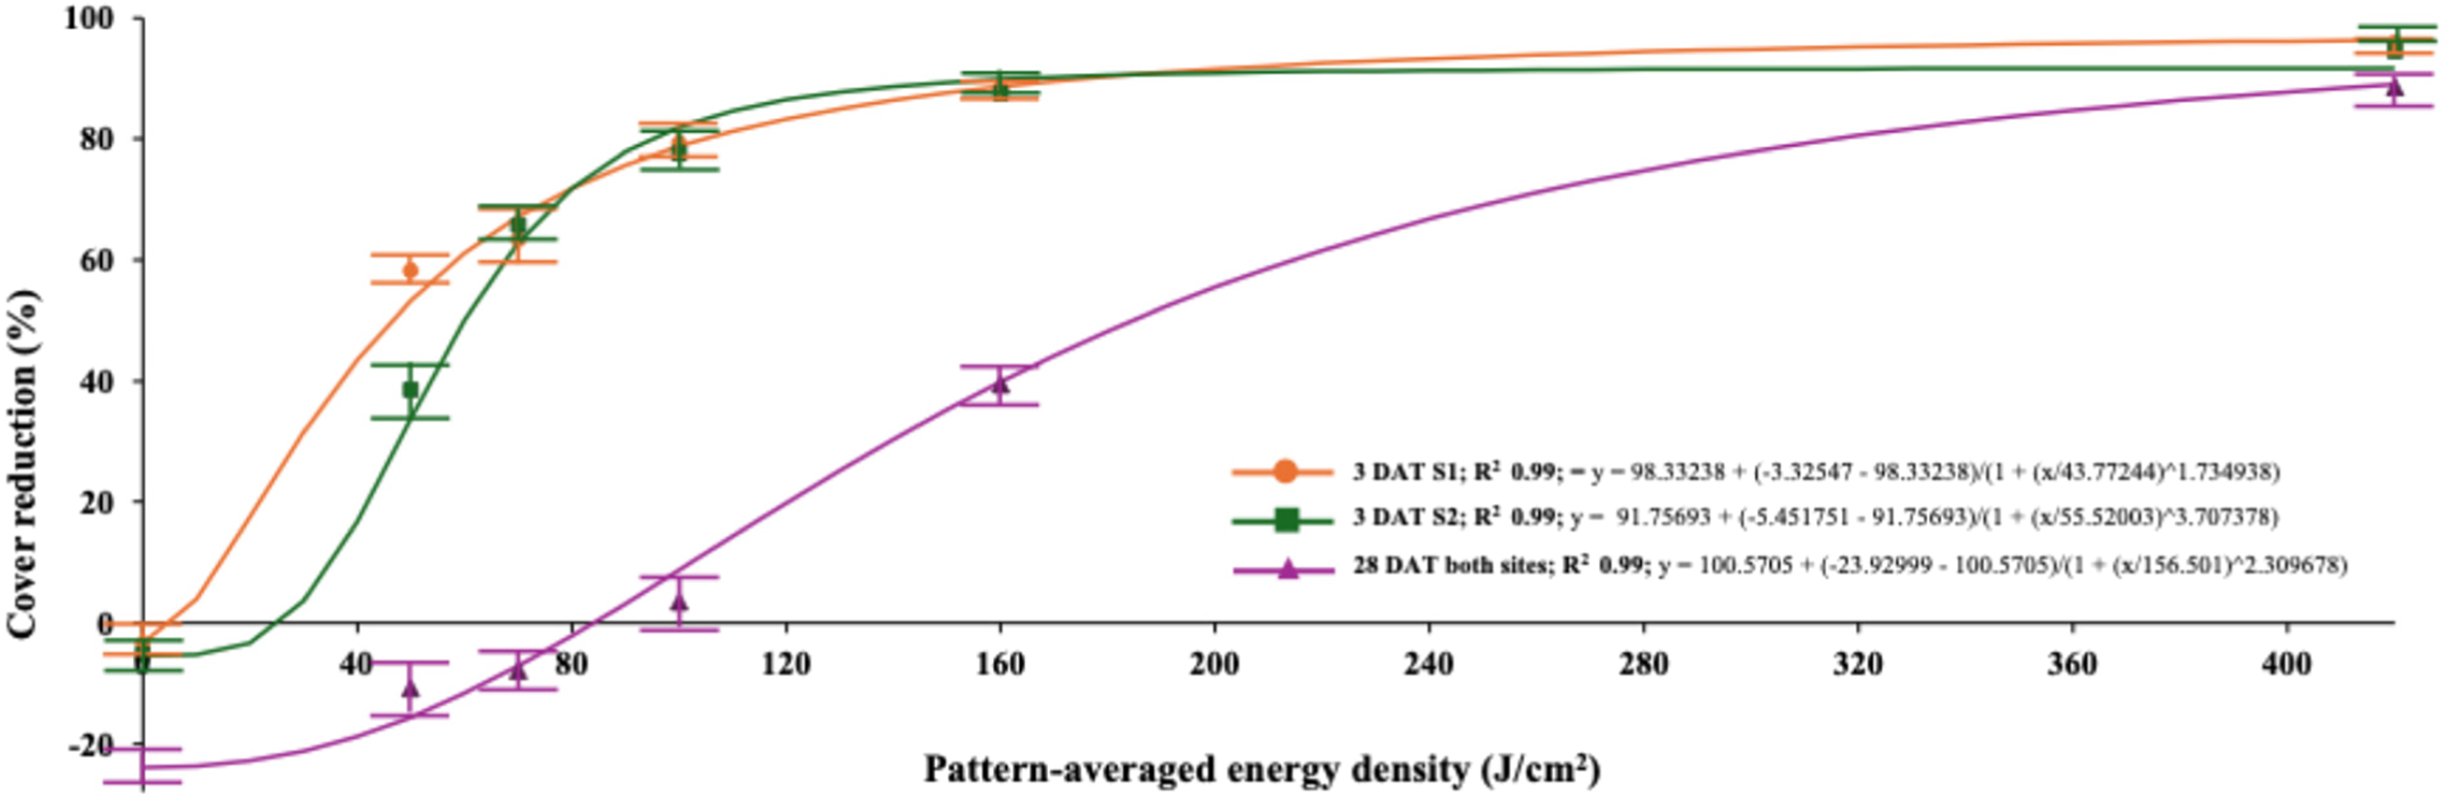
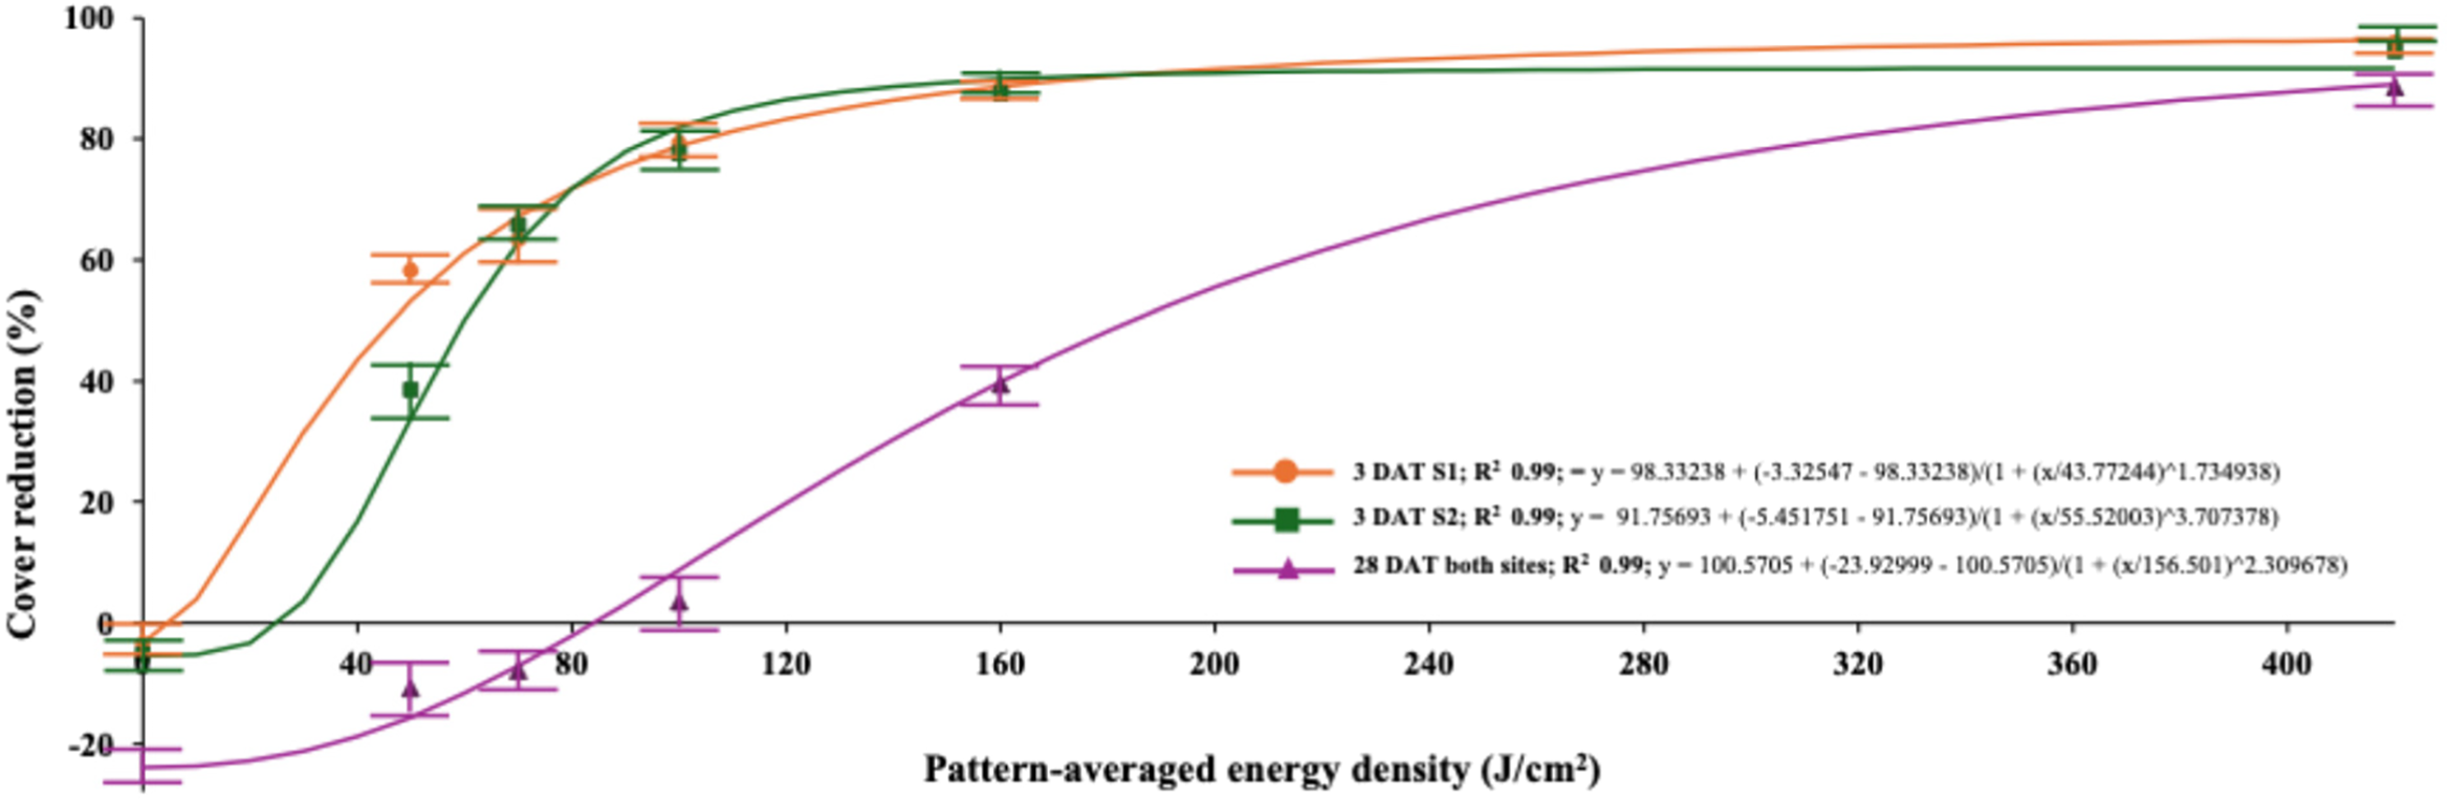
The trial by treatment interaction was significant (P = 0.0016) for P. annua control at 3 DAT, while only the treatment main effect remained at 28 DAT (P = 0.0014) (Figure 3). The source of the trial interaction at 3 DAT may lie in higher green cover reduction of P. annua at lower PAED doses (<70) at Site 1. For example, 50% green cover reduction required 55 J cm−2 and 45 J cm−2 PAED at Sites 1 and 2, respectively, 3 DAT (Figure 3). At 28 DAT, P. annua recovered from laser treatments consistently across trials, leading to 50% green cover reduction by 200 J cm−2 PAED and 80% reduction at 340 J cm−2 PAED. Thus, P. annua was seen as an excellent candidate to evaluate potential benefits of pattern manipulation, which will be discussed in the next section. At 410 J cm−2 PAED, P. annua cover was reduced 89% at 28 DAT, consistent with better-performing herbicides such as foramsulfuron (Willis et al. Reference Willis, Ricker and Askew2008), trifloxysulfuron (Askew et al. Reference Askew, Goddard, Askew, Beam and Keese2013), flazasulfuron (Goddard et al. Reference Goddard, Gonçalves and Askew2022), glyphosate (Askew et al. Reference Askew, Askew and Goatley2019), glufosinate (Craft et al. Reference Craft, Godara, Derr, Nichols, McCurdy, Richard and Askew2023), methiozolin (Askew and McNulty Reference Askew and McNulty2014), and endothall (Peppers and Askew Reference Peppers and Askew2025). Alternative strategies for P. annua control are important to address herbicide-resistant biotypes that have become persistent in recent years (Bowling et al. Reference Bowling, McCurdy, De Castro, Patton, Brosnan, Askew, Breeden, Elmore, Gannon, Concalves, Kaminski, Kowalewski, Liu, Mattox and McCarty2024; McCurdy et al. Reference McCurdy, Bowling, de Castro, Patton, Kowalewski, Mattox and Bagavathiannan2023). These data suggest laser energy could be an effective measure to support this industry need.
Study1: influence of laser intensity levels achieved by different speeds on digitally assessed Poa annua green cover reduction compared with the initial cover at 3 d after treatment (DAT) by site (S1, S2) and average over sites at 28 DAT.
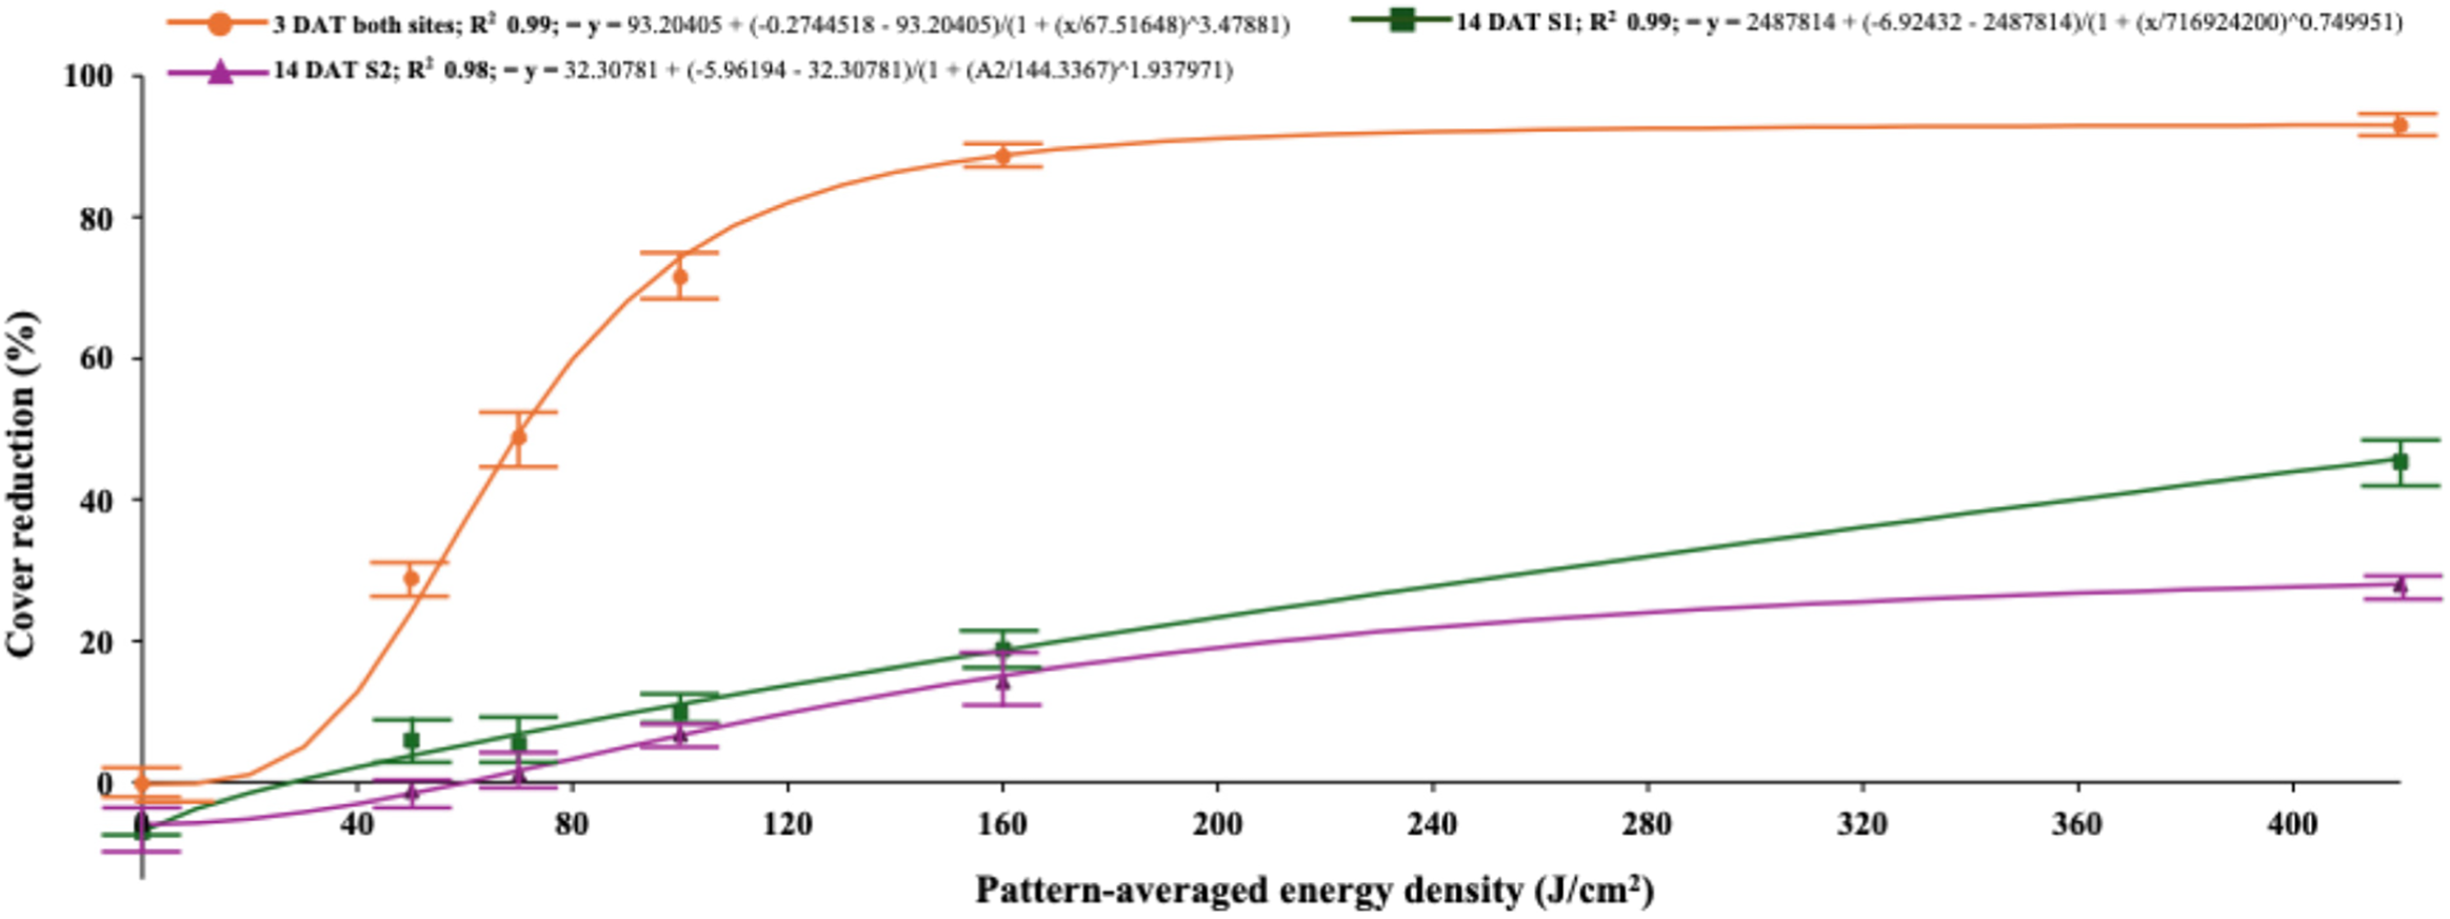
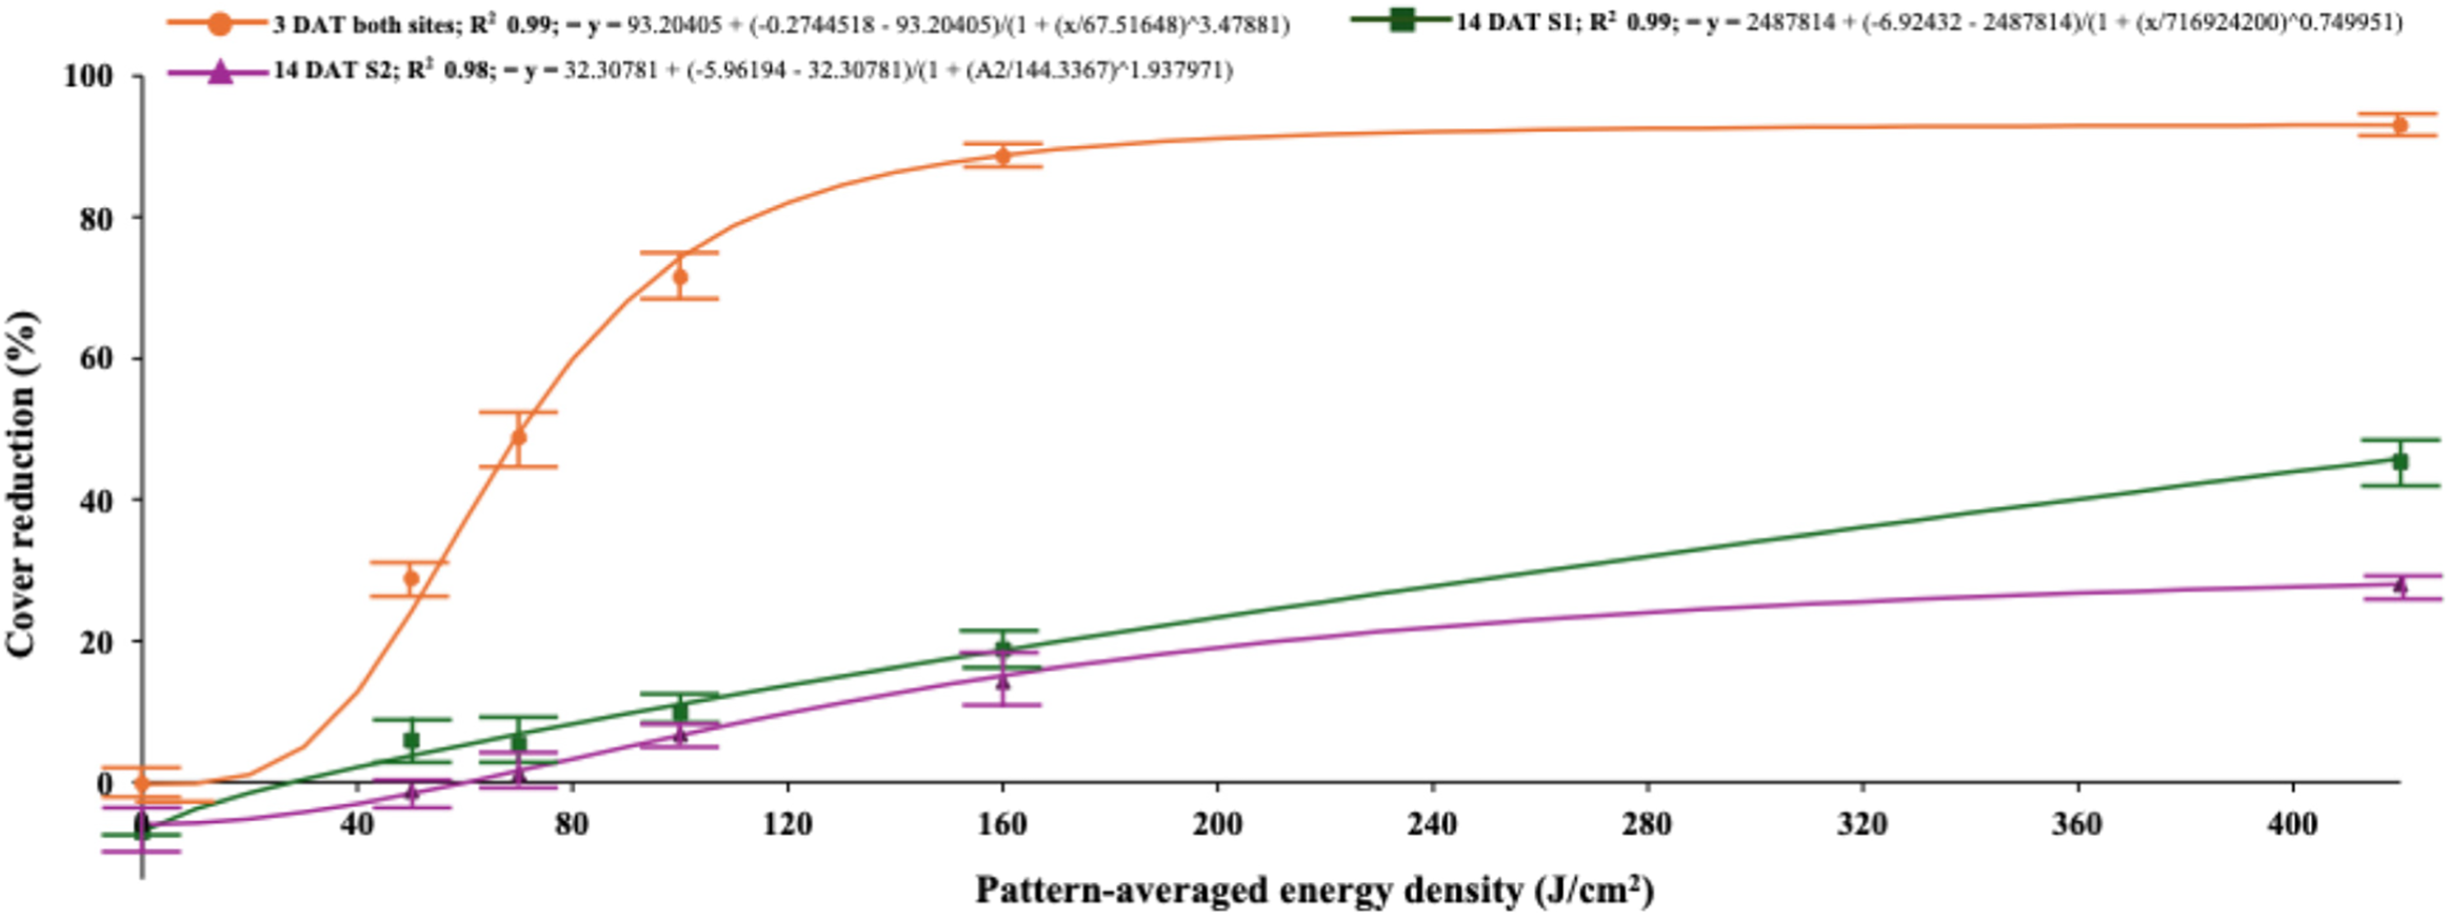
Bermudagrass
Laser energy rapidly discolored bermudagrass in response to increasing PAED (P = 0.0005) consistently across trials, as evidenced by an insignificant treatment by trial interaction at 3 DAT (P = 0.0155) (Figure 4). Bermudagrass discoloration peaked at 90% following treatment of 180 J cm−2 PAED or more at 3 DAT (Figure 4). Despite initial discoloration, bermudagrass recovered rapidly at both locations, although significantly (P < 0.05) slower at Site 1, where green cover reduction at 14 DAT by 410 J cm−2 PAED was 44% compared with only 27% by this energy dose at Site 2 (Figure 4). At 28 DAT, bermudagrass had recovered entirely independently of the energy level. Bermudagrass also recovered from thermal treatments such as hot water and direct flame more rapidly than other turfgrasses (Goncalves et al. Reference Goncalves, Askew, de Castro and McCurdy2021). Although green cover reduction of turfgrass at this scale would not normally be commercially acceptable (Patton et al. Reference Patton, Trappe, Strahan and Beasley2010), laser applications made by machine vision would primarily direct radiation to targeted weeds. Given that bermudagrass recovers more rapidly than both D. ischaemum (Figure 2) and P. annua (Figure 3), the prospects of targeted weed control in turfgrass with lasers are rendered more plausible.
Study1: influence of laser intensity levels achieved by different speeds on digitally assessed bermudagrass green cover reduction compared with the initial cover at 3 d after treatment (DAT) averaged over sites and 14 DAT by site (S1, S2).
Creeping bentgrass
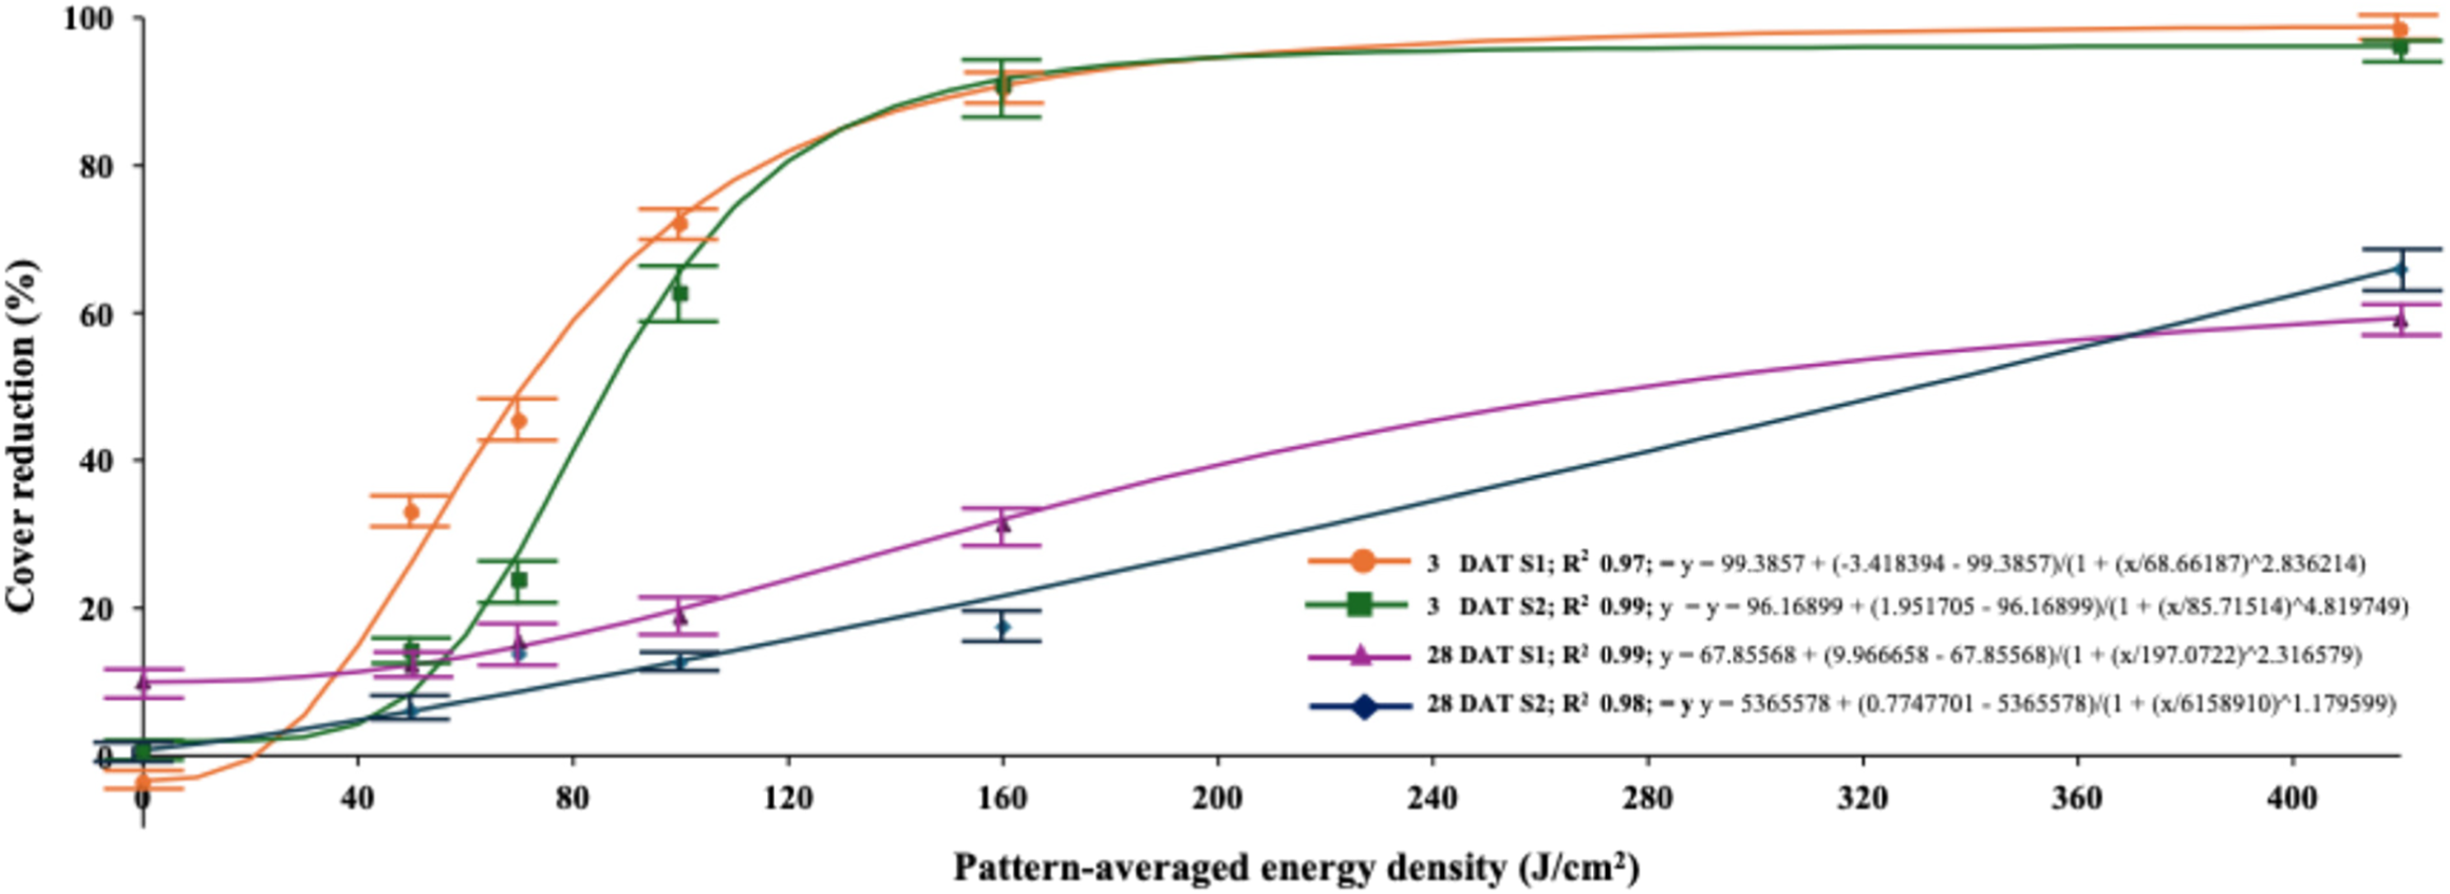
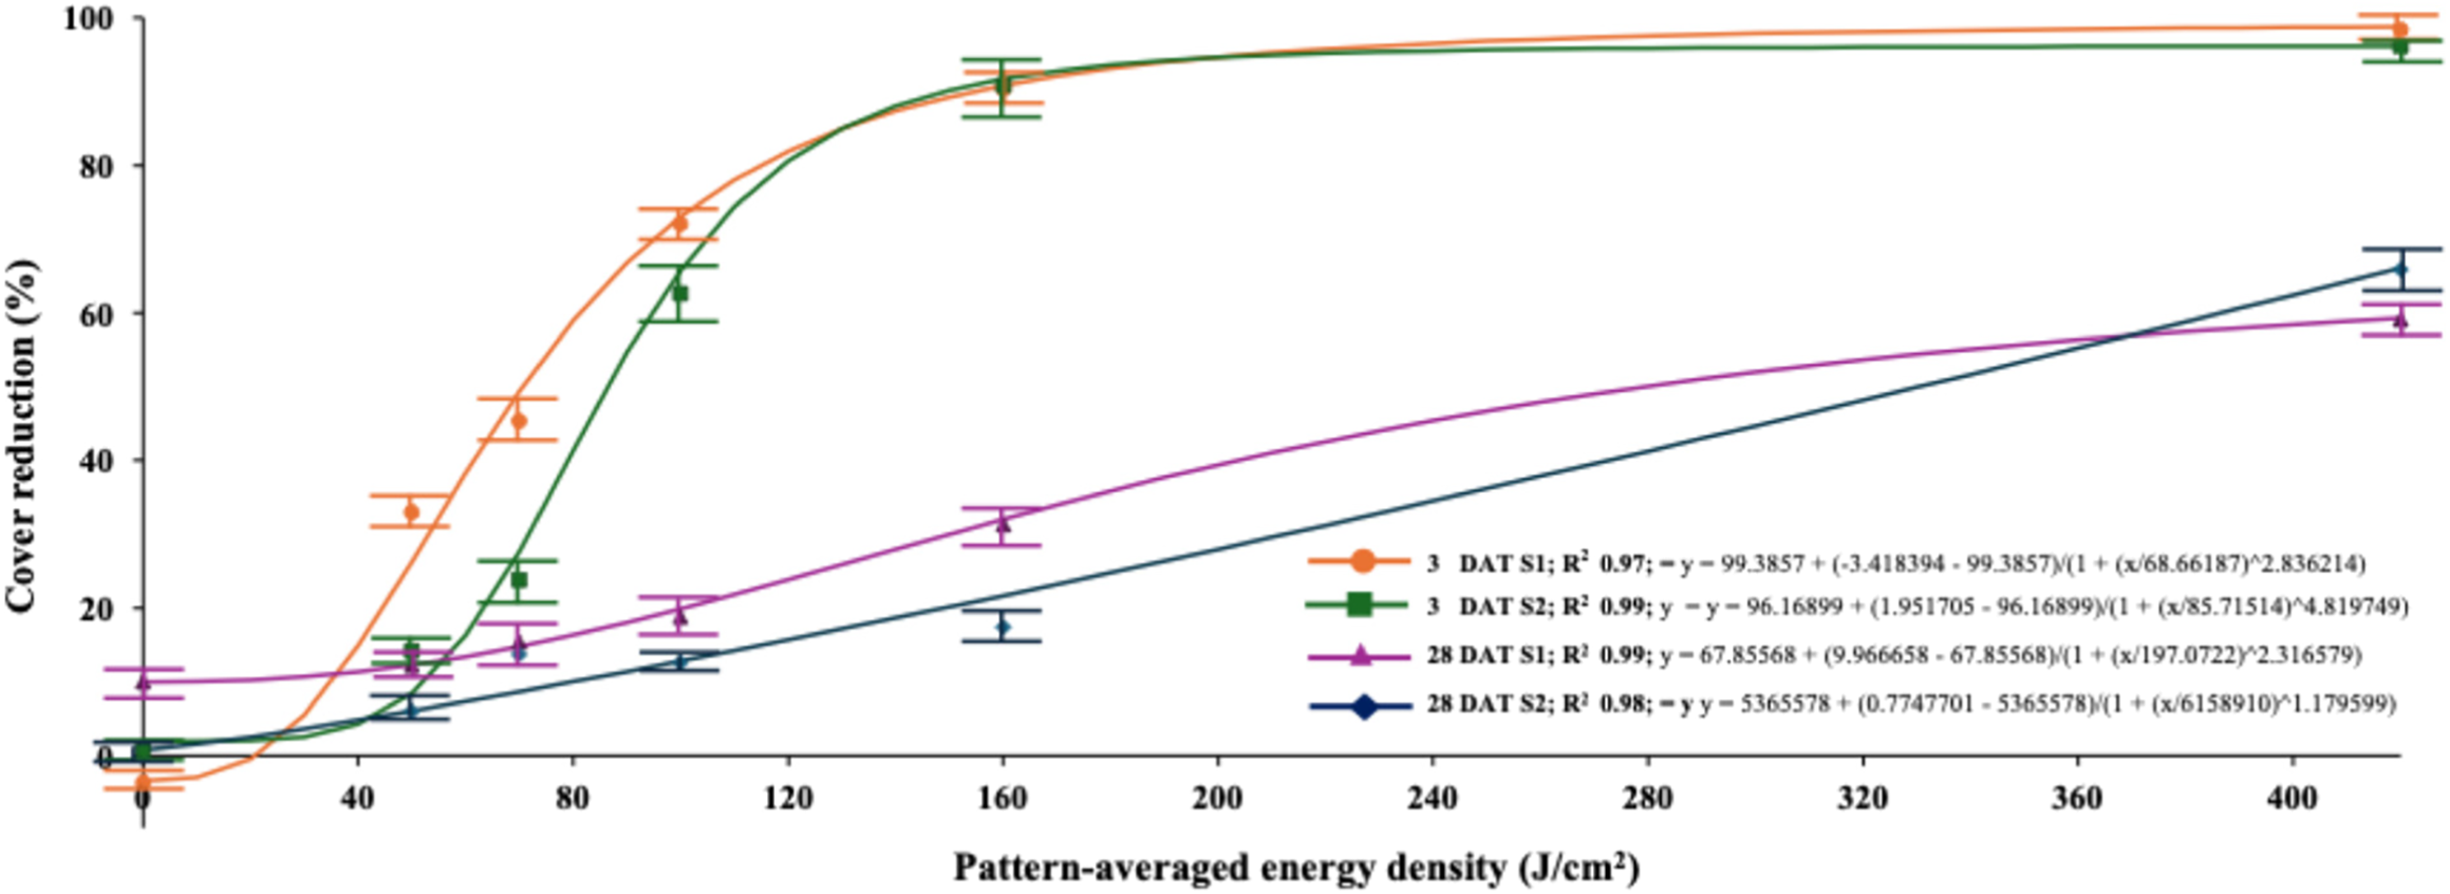
The interaction of trial by treatment was significant for creeping bentgrass green cover reduction at 3 DAT (P = 0.0051) and 28 DAT (P < 0.022) (Figure 5). By 3 DAT, both sites exhibited strong initial responses, with green cover reduction reaching 91% at 160 J cm⁻² PAED at Site 1 and 90% at Site 2—indicating that creeping bentgrass is highly sensitive to laser energy. At 28 DAT, creeping bentgrass injury persisted at Site 1 with a 59% cover reduction at the maximum 410 J cm⁻² dose, while Site 2 exhibited a reduced response of 65%, suggesting slightly less recovery under those trial conditions. Although environmental factors such as soil moisture were not recorded, they likely contributed to observed site-dependent effects, consistent with results from other thermal weed control studies (Goncalves et al. Reference Goncalves, Askew, de Castro and McCurdy2021). Despite some variability, creeping bentgrass showed relatively high susceptibility and limited recovery compared with D. ischaemum and P. annua. While our study design does not support direct species comparisons, general trends suggest that C4 species like D. ischaemum may recover more robustly than C3 grasses such as creeping bentgrass. Prior research in agronomic systems has shown that species-specific traits and growth stages significantly influence laser efficacy (Andreasen et al. Reference Andreasen, Vlassi and Salehan2024), a finding further reinforced in this turfgrass study.
Study1: influence of laser intensity levels achieved by different speeds on digitally assessed creeping bentgrass green cover reduction compared with the initial cover at 3 d after treatment (DAT) and 28 DAT by site (S1, S2).
Weed and Turfgrass Response to Varied Laser Pattern at Discrete Energy Levels
The main effect of pattern line spacing was the only significant effect (P < 0.05) for D. ischaemum green cover reduction at 3 DAT (Table 2). When line spacing was increased from 1 mm to 2 or 4 mm, D. ischaemum cover reduction was increased 8% to 10%. This phenomenon was also exhibited in the significant interaction of trial by PAED by pattern line spacing (P < 0.05), where the 1-mm spacing reduced D. ischaemum cover 28 DAT less than the 4-mm spacing at both sites when 200 J cm−2 PAED was applied and at Site 2 when 400 J cm−2 PAED was applied (Table 2). This pattern influence likely occurred because the 4-mm line spacing had line-specific energy densities that were four times greater than the 1-mm line spacing (Table 1). Within a given site, the 4-mm line spacing applied at 200 J cm−2 PAED consistently reduced D. ischaemum equivalent to 400 J cm−2 PAED applied in a pattern of 1-mm line spacing (Table 2). This is the first report regarding how altering laser pattern can change plant responses across PAED levels. In prior research conducted in production agriculture, only seedling weeds have been targeted (Heisel et al. Reference Heisel, Schou and Christensen2001; Yaseen and Long Reference Yaseen and Long2024). A relevant comparison between the laser pattern assessments in this study and previous work can be drawn from Mathiassen et al. (Reference Mathiassen, Bak, Christensen and Kudsk2006), who demonstrated that increasing laser spot diameter (from 0.9 mm to 2.4 mm) significantly reduced weed control efficacy at a given energy dose, due to the lower energy density delivered to the apical meristem.
Poa annua cover reduction exhibited a trial by pattern line spacing interaction due to differences in the performance of the 1-mm spacing between sites at 3 DAT (Table 2). At Site 2, P. annua cover was reduced less by the 1-mm spacing, while cover reduction was not dependent on spacing at Site 1 (Table 2). At 28 DAT, P. annua cover reduction exhibited only a line spacing main effect with a stepwise increase in cover reduction as line spacing increased from 1 mm to 4 mm. These data suggest that line spacing strongly influences weed control and potentially could be optimized beyond the 4-mm spacing assessed here. Future research should evaluate an expanded range of line spacings to determine whether further optimization is possible. As in the previous study, laser weed control can be comparable to leading herbicides (Brosnan et al. Reference Brosnan, Henry, Breeden, Cooper and Serensits2013; Flessner et al. Reference Flessner, McElroy and McCurdy2017), given the appropriate laser pattern and intensity.
Both turfgrasses exhibited rapid recovery from laser treatments but on different temporal scales. Thus, rather than report data at discrete assessment times as was done for the weeds, it seemed more appropriate to calculate maximum cover reduction and time to complete recovery (bermudagrass) or percentage recovery at 28 DAT (creeping bentgrass). The interaction of PAED by line spacing was significant for maximum bermudagrass cover reduction (P < 0.05) (Table 3). At the lower energy level, the 1-mm spacing reduced bermudagrass green cover slightly less than the 4-mm spacing, while differences between line spacings were not evident when the PAED was increased from 200 J cm−2 to 400 J cm−2 (Table 3). Bermudagrass recovery time varied by line spacing but was dependent on site (P = 0.0029; Table 3). At Site 1, it took 3 additional days for bermudagrass to recover following the 4-mm spacing, but this trend was not evident at Site 2. Bermudagrass recovery required 21 to 24 d depending on site and line spacing. Although similar recovery durations have been noted following herbicide injury (Brewer et al. Reference Brewer, Willis, Rana and Askew2017; Cox et al. Reference Cox, Rana, Brewer and Askew2017), such durations are generally deemed unacceptable. Thus, targeted weed control via machine vision (Xie et al. Reference Xie, Hu, Bagavathiannan and Song2021) will be important to improve selectivity of laser weed control in turfgrass.
Interaction of laser pattern-averaged energy density (PAED) by pattern line spacing on maximum bermudagrass green cover reduction; interaction of trial by pattern line spacing for bermudagrass time to complete recovery, creeping bentgrass maximum cover reduction, and creeping bentgrass recovery at 28 d after treatment (DAT); and interaction of pattern passes by pattern line spacing on creeping bentgrass maximum cover reduction.a

a Laser spot diameter was 0.08 mm × 0.06 mm from a 10-W diode laser and delivered a continuous square spiral to 100-cm2 plots in all cases. For patterns that received two passes, the second pass was initiated immediately after the first pattern was finished. Means followed by the same letter within each column are not different based on Fisher’s protected LSD (α = 0.05). An asterisk (*) indicates differences between PAED or number of passes within a given level of pattern line spacing.
b Laser intensity was based on the PAED calculated as PAED (J cm−2) = (e*t)/A, where e is laser energy (W), t is time to treat a given pattern on a given plot (s), and A is the area of the treated plot (cm2).
Maximum cover reduction for creeping bentgrass was influenced by a line spacing by pass number interaction (P < 0.05) and a site by line spacing interaction (P < 0.05) (Table 3). Creeping bentgrass cover was maximally reduced 79% to 91% depending on pass number, line spacing, and site. When one pass was applied, the LSED was the same as for two passes (Table 1), with all of the energy delivered in a single pass rather than split between the two passes. This led to a step-wise increase in maximum creeping bentgrass cover reduction with line spacing at one pass while both 2- and 4-mm line spacings maximally reduced creeping bentgrass cover equivalently and more than the 1-mm spacing when two passes were applied (Table 3). At both sites, the 1-mm line spacing caused maximum cover reductions that were less than those of the 2-mm and 4-mm line spacings. Creeping bentgrass recovery at 28 DAT exhibited an interaction between trial and line spacing (P < 0.05) (Table 3) similar to that of maximum cover reduction. When 1-mm spacing was used, creeping bentgrass recovered 47% and 65% of its initial cover at 28 DAT (Table 3). For the 4-mm spacing, recovery was only 37% to 42%, depending on site (Table 3).
These data show that line spacing and PAED of a continuous square spiral of laser radiation influences plant responses for both weeds and turfgrasses. Likewise, the effectiveness of laser treatments observed in this study is consistent with previous research, highlighting the ability of lasers to disrupt critical plant tissues through focused energy application, thereby minimizing environmental disturbance unlike chemical or mechanical methods (Andreasen et al. Reference Andreasen, Scholle and Saberi2022; Yaseen and Long Reference Yaseen and Long2024). Trends in the data suggest that both site conditions and targeted plant species may influence plant response to laser energy, but limitations in our design preclude specific inferences related to environmental conditions or species. Laser performance for weed control has been shown to depend on laser parameters and weed species traits (Mathiassen et al. Reference Mathiassen, Bak, Christensen and Kudsk2006), although environmental site conditions remain an area requiring further exploration. Additionally, the laser platform used here, a 10-W fixed-focus diode engraver, is inherently limited for field-scale use due to low power output, slow pattern delivery, and the absence of integrated sensing or autonomous tracking. Its energy delivery and optical characteristics also differ substantially from high-power CO2 laser systems currently used in commercial robotic weeders (Sosnoskie et al. Reference Sosnoskie, Bill, Butler-Jones, Bouchelle and Besançon2025), which restricts direct comparison across platforms.
Integrating autonomous robots could enhance the practicality of laser weeding within turfgrass environments, mainly due to time constraints. Autonomous robotic systems, equipped with advanced navigation and real-time identification capabilities, might reduce labor requirements while reducing the use of chemical herbicides, following a trend that calls for less pesticide usage. However, laser weeding presents certain challenges that require attention for broader adoption. Variability in weed species characteristics, particularly stem thickness and resilience, necessitates precise calibration of energy density (Heisel et al. Reference Heisel, Schou, Andreasen and Christensen2002; Mathiassen et al. Reference Mathiassen, Bak, Christensen and Kudsk2006). The scalability and speed of current laser weeding technology present additional challenges, with high initial costs and operational speeds potentially limiting widespread use in larger turf areas. Previous studies suggest that deploying robotic fleets could mitigate some scalability issues (Yaseen and Long Reference Yaseen and Long2024). Safety considerations, including potential fire hazards in dry turf conditions, demand the incorporation of advanced sensor technologies and robust safety protocols, as recommended by earlier studies (Andreasen et al. Reference Andreasen, Scholle and Saberi2022). Addressing these concerns is vital for safe, effective, and widespread use of laser weeding.
This research demonstrates that laser parameters can be strategically customized to improve time and energy efficiency while maintaining effective weed control. This work is the first to report the influence of laser patterns on mature weed control and shows that changes in pattern line spacing can influence weed control, potentially reducing energy requirements by half. Future studies will investigate the influence of environmental conditions, such as temperature and humidity, and expand the exploration of laser application patterns. Future work should evaluate a wider range of turf and weed species at different growth stages and incorporate higher-power or alternative laser types to improve treatment speed and efficacy. Improving weed detection algorithms will also be critical to boosting precision and reducing costs. By addressing these technical and biological challenges, laser weeding is well positioned to become a useful tool in sustainable turfgrass management.
Funding
This research was partially funded by the Virginia Agricultural Council in association with the Virginia Turfgrass Foundation (Project Number 858).
Competing interests
The authors declare no conflicts of interest.



 Open access

