


The Supplemental Nutrition Assistance Program (SNAP), formerly known as the Food Stamps Program, is the largest anti-hunger programme in the USA. In 2019, SNAP provided nutrition assistance to one in eight Americans – more than 38 million participants – every month. Over $55 billion in benefits were distributed in the year(1). However, while SNAP is an effective anti-hunger programme(Reference Nord and Golla2), households participating in SNAP experience worsening food insecurity and dietary quality towards the end of the benefit month(Reference Hamrick and Andrews3–Reference Kharmats, Jones-Smith and Cheah8).
SNAP policy requires that benefits are distributed once per month. On average, households participating in SNAP spend 59 % of benefits within the first week; a quarter of households exhaust benefits within the first week(Reference Castner and Henke9,Reference Tiehen, Newman and Kirlin10) . This pattern of rapid depletion of benefits immediately after issuance has been termed the ‘benefit cycle’ and is of significant public health concern. Although immediate spending of benefits may be due to households stocking up on food for later consumption, research suggests that cyclical spending closely aligns with food consumption. Households participating in SNAP experience declining energetic intake and reduced food security as the benefit month progresses(Reference Hamrick and Andrews3–Reference Todd and Gregory6). Furthermore, the dietary quality of SNAP participants – which is lower compared with non-participants throughout the month – further worsens towards the end of the benefit month, with a notable reduction in fruit and vegetable intake(Reference Todd4,Reference Whiteman, Chrisinger and Hillier7,Reference Kharmats, Jones-Smith and Cheah8) . Cyclical food consumption patterns have also been linked to chronic disease(Reference Laraia11,Reference Basu, Berkowitz and Seligman12) , and a growing body of research suggests that the benefit cycle may be associated with worsening health outcomes at the end of the month(Reference Ojinnaka and Heflin13,Reference Cotti, Gordanier and Ozturk14) .
In consideration of its adverse sequelae, there has been interest in finding ways to mitigate the benefit cycle(Reference Blumenthal, Hoffnagle and Willett15). Proposed strategies include increasing the frequency of benefit distribution to smooth cyclical spending and expanding SNAP-Education and the Expanded Food and Nutrition Education Program, both of which include curricula on planning and shopping for nutritious meals on a budget(Reference Blumenthal, Hoffnagle and Willett15–Reference Mancino and Andrews18). There have also been proposals to improve dietary quality by targeting food purchasing behaviour among SNAP participants(Reference Blumenthal, Hoffnagle and Willett15,Reference Mancino and Andrews18,Reference Just and Gabrielyan19) . Two commonly cited proposals include incentives for purchasing fruits and vegetables(Reference Olsho, Klerman and Wilde20) and prohibiting the use of SNAP benefits for less nutritious foods such as foods high in added sugar(Reference Brownell and Ludwig21–Reference Shenkin and Jacobson23).
However, current policy discussions are limited by an incomplete understanding of the benefit cycle. Proposals to address the benefit cycle – or more broadly, to alter food purchasing behaviour – need to be evaluated within the context of the benefit cycle. Research thus far has often relied on repeated cross-sectional data, with a few days of purchasing data and comparisons between households instead of capturing intra-household variations in food purchasing behaviour over time(Reference Whiteman, Chrisinger and Hillier7,Reference Smith, Berning and Yang24–Reference Franckle, Thorndike and Moran26) . To our knowledge, no study has assessed household food purchasing using prospective data, with records before and after households receive nutrition assistance to evaluate changes in food purchasing triggered by nutrition assistance. Furthermore, while food intake has been examined during the benefit month(Reference Todd4,Reference Whiteman, Chrisinger and Hillier7,Reference Kharmats, Jones-Smith and Cheah8) , there has been no prospective evaluation of fluctuations in spending for food categories relevant to policy proposals targeting food purchasing behaviour.
To address these gaps in the literature, this paper examines food purchasing behaviour in a sample of low-income households before and after receiving monthly nutrition assistance as part of a benefit programme modelled after SNAP(Reference Harnack, Oakes and Elbel27). The study has three primary objectives: (1) to assess whether initiation of nutrition assistance was associated with initiation of cyclical food expenditures for two different types of vendors: food retailers and restaurants; (2) to evaluate whether the observed cyclical food expenditure patterns at food retailers varied by household demographic characteristics, composition and economic resources and (3) to determine whether cyclical food expenditure patterns at food retailers are consistent for food categories most relevant to current policy discussions: fruits and vegetables and foods high in added sugar.
Methods
Study design
Analyses for this paper use data from a trial designed to evaluate strategies to improve the nutritional quality of foods purchased by low-income households (Reference Harnack, Oakes and Elbel27). In brief, low-income households in the Minneapolis-St. Paul, Minnesota, area were recruited between August 2013 and May 2015. Eligibility criteria included (1) not currently enrolled in SNAP or planning to enroll during the study; (2) household income ≤200 % the federal poverty rate or participating in a government programme that automatically qualifies households for SNAP (e.g. the Diversionary Work Program in Minnesota) and (3) adult in the household primarily responsible for food shopping is able to read and speak English. Some SNAP eligibility criteria, such as asset and citizenship verifications, were not applied. The University of Minnesota Institutional Review Board approved all aspects of the study (ClinicalTrials.gov: NCT02643576).
Intervention
Participants who completed baseline measures and submitted at least 3 weeks of receipts during the baseline period were randomised into one of four study arms: (1) incentive (30 % financial incentive on fruits and vegetables purchased using benefits); (2) restriction (no purchase of sweetened beverages, sweet baked goods or candies using benefits); (3) incentive plus restriction (combination of incentives and restrictions on purchases using benefits) or (4) no incentive or restriction on foods purchased with benefits (control).
The study intervention was modelled after SNAP. All participants were given a debit card similar to the SNAP Electronic Benefits Transfer card and received benefits every month for 3 months. Nutrition assistance across all study arms was equal to the average SNAP monthly benefit amount in Hennepin and Ramsey Counties in Minnesota in June 2013 ($139, $233, $350, $421 and $493 per month for households with 1, 2, 3, 4 and 5 or more members, respectively). Federal guidelines for SNAP benefits were applied. Thus, benefits could be used for foods and beverages from food retailers (e.g. grocery stores and convenience stores that sell food), but not in restaurants or for alcoholic drinks and hot prepared foods.
Measures
Household characteristics
At the baseline visit, participants completed a survey that included questions about household composition, demographic characteristics, economic means and concurrent enrollment in Special Supplemental Nutrition Program for Women, Infants, and Children (WIC). Household food security status was evaluated using the USDA Household Food Security Module, a standardised and validated measure that categorises households into three levels of food security: high or marginal (no reported indication of food access problems or limitations); low (reduced quality, variety or desirability of diet, but little or no indication of reduced food intake) or very low (multiple indications of disrupted eating patterns and reduced food intake)(28). Additional measures collected have been described previously(Reference Harnack, Oakes and Elbel27–Reference Rydell, Turner and Lasswell30).
Food expenditures
Study staff met with participants to provide training on the receipt collection protocol. Participants were asked to collect and submit all household receipts for food and beverage purchases throughout the study. For line items with vague or unclear descriptions, participants were asked to annotate the receipts to provide detail (e.g. ‘produce’ would require annotation to specify the type of produce, such as ‘tomatoes’). Missing receipt forms were requested for purchases without a receipt. Participants submitted receipts every week and received a gift card every month. The reward amount was pro-rated, with $30 for 4 weeks submitted, and lesser amounts for 3 ($15), 2 ($10) and 1 ($5) weeks.
Timing of food expenditures within the month was determined using dates for receipt purchases and benefit disbursement. Day 1 refers to the day of benefit distribution, and day 28 refers to the last day of the benefit month. Receipts also provided information about the vendor, food type and income source. Vendors were categorised as either food retailers (vendors that primarily sell unprepared food) or restaurants (vendors that sell ready-to-consume food). Expenditures at food retailers were further categorised into one of eleven food categories. This paper focused on two specific categories: fruits and vegetables and foods high in added sugar (sugar-sweetened beverages, candy and sweet baked goods). For restaurant expenditures, post-tax amounts excluding tips were recorded; expenditures were not categorised by food type.
The source of payment for expenditures was categorised as either benefits (study visa card) or other income (non-benefit funds). Benefit expenditures were verified by cross-referencing the final four digits of the card on the receipt with the study visa card and using the online transaction history of study visa cards. Non-benefit funds were presumed to have originated from the study participant. This paper evaluates total food expenditures made using all income sources.
Statistical analysis
Analyses for this paper included 3 months of food expenditures – 1 month of baseline (pre-benefits) and the first 2 months of the intervention (benefits) period. The fourth month of the study (i.e. third month of the intervention) was excluded from analyses due to skewed food purchasing as participants ‘cashed out’ remaining benefits and demonstrated a sudden increase in spending in final week of the study (see online supplementary material, Supplemental Fig. 1). To ensure completeness of data, only households that submitted receipts every week during the first 3 months were included in the analyses.
Linear regression models were constructed using generalised estimating equations and Huber–White robust standard errors with unstructured correlation matrices to account for within-household correlation in food expenditures over time. The outcomes of interest were expenditures in US dollars (USD). Since households do not shop for food every day, the data consisted of many days with zero observations (i.e. no food or beverage expenditures). Thus, similar to previous studies with daily food expenditure data(Reference Hastings and Washington31,Reference Damon, King and Leibtag32) , expenditures were aggregated by week. For each month included in the analyses, weeks 1, 2, 3 and 4 were composed of days 1 through 7, 8 through 14, and 15 through 21 and 22 through 28, respectively. Expenditures made beyond day 28 were categorised according to the timing of benefit distribution – expenditures were categorised as week 4 of that month if new benefits had not been distributed, or week 1 of the subsequent month if the next month’s benefits had been distributed. Separate models were run to evaluate expenditures at restaurants and food retailers; food retailer expenditures were further evaluated for two categories of food (fruits and vegetables and foods high in added sugar).
The primary predictor variable for all models, timing in the benefit cycle by week, was evaluated as a categorical variable, with values 1–4. A dummy variable was used to distinguish baseline and intervention periods. Furthermore, models were controlled for the calendar year and month associated with household expenditures to account for any seasonal or yearly trends. In order to test the primary hypothesis of the paper – trends in food expenditures before and after households receive benefits – data were aggregated across the entire study sample and the models were adjusted for study arm. Preliminary analyses suggested that there were not important differences in food expenditure patterns across study arms.
The model also included covariates for household resources, composition and demographic characteristics of the primary respondent. To account for available household resources for food budgets, models included variables for annual household income ($14 999 or less; $15–34 999; $35 000 or more), concurrent participation in WIC and the amount of study benefits households received. Models were also adjusted for baseline household food security status (high/marginal, low and very low). Household composition was evaluated using the number of children under the age of 18 and the number of adults (single-adult household or household with two or more adults). Finally, all models were adjusted for the following demographic characteristics of the primary respondent: age, gender, education level (high school graduate or less; some college/associate’s degree; college graduate or higher) and employment status (full-time; part-time; unemployed or other). Race/ethnicity (non-Hispanic white; non-Hispanic Black, Hispanic, other) was included as a proxy variable for historical and current systemic racism that shape a household’s access to and ability to maintain economic resources(Reference Jones33,Reference Manly34) .
To evaluate variations in weekly spending during the baseline and intervention periods, an interaction term between variables for week and the dummy variable for the intervention period was included. Based on prior hypotheses regarding predictors of cyclical food purchasing(Reference Hamrick and Andrews3,Reference Shapiro5,Reference Smith, Berning and Yang24) , we evaluated three-way interaction terms between week, intervention and the following variables: annual household income, baseline food security status, concurrent WIC participation and education. These interactions tested whether receipt of benefits was associated with a different magnitude or pattern in spending behaviour for different household characteristics. Three-way interaction terms were included in the final model if significant at the level P < 0·05. Ultimately, interaction terms with annual household income and baseline food security status were retained.
Predictive margins and 95 % confidence intervals were calculated using parameter estimates from the final GEE regression model. The predictive margins are adjusted estimates of average food expenditures standardised to the distribution of covariates for the population that the sample represents; for linear models such as the one estimated in this analysis, this is equivalent to the average outcome estimated at the mean of all covariates(Reference Graubard and Korn35). Predictive margins were plotted to better visualise patterns in food purchasing during the baseline and intervention periods for overall food expenditures and for each of the two food categories evaluated. Pairwise comparisons of these weekly predictive margins were used to evaluate whether estimated expenditures varied from week to week. Finally, adjusted estimates are also reported stratified by all levels of the covariate, because the sample size may not be adequately powered to identify 3-week interactions of week, intervention and covariates at the level P < 0·05. All analyses were completed using Stata version 16·1 software (Stata-Corp LP).
Results
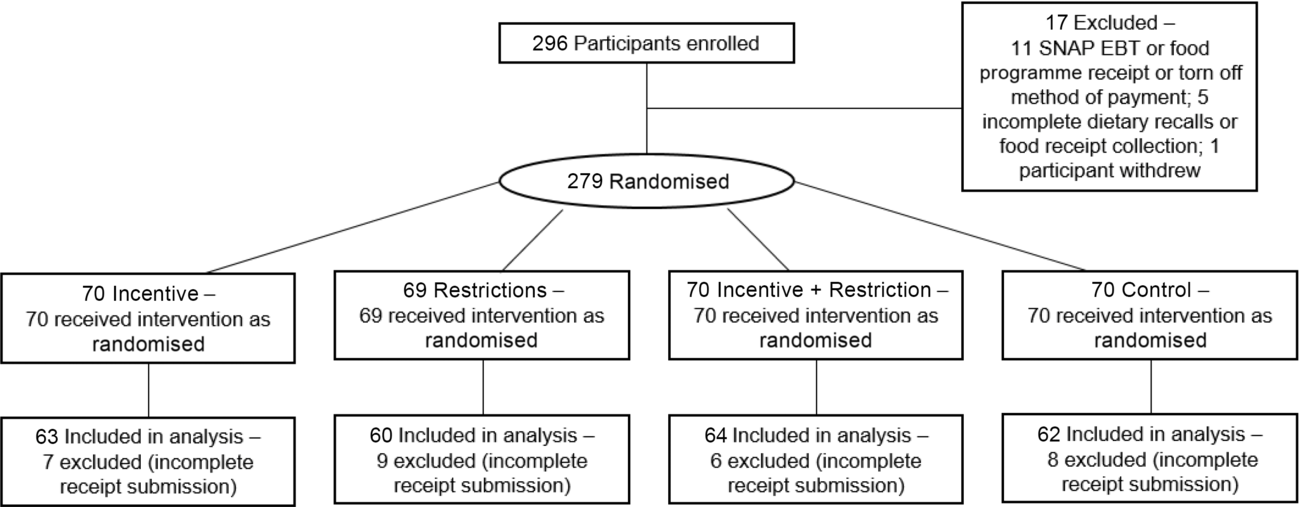
Of the 279 participants randomised at baseline, 249 participants submitted receipts every week and were included in analyses (Fig. 1). There were no qualitative or significant differences between households with and without complete weekly data by any of the demographic characteristics evaluated (data not shown). Most participants were women (81 %), with an average age of 44·7 years. Half the participants identified as African American. Nearly three quarters of households reported annual household incomes below $35 000 and 80 % reported low or very low food security. Ten percent of households were concurrently enrolled in WIC (Table 1).
CONSORT flow diagram. SNAP, Supplemental Nutrition Assistance Program; EBT, Electronic Benefits Transfer
Baseline characteristics of households in the Minneapolis-St. Paul, Minnesota, area receiving monthly nutrition assistance (n 249)
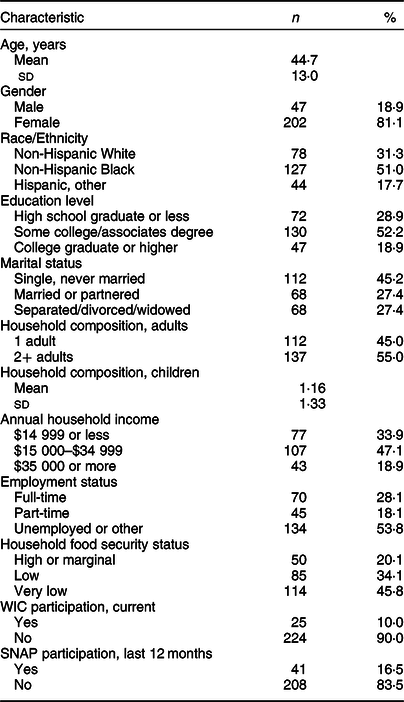
WIC, Special Supplemental Nutrition Program for Women, Infants, and Children; SNAP, Supplemental Nutrition Assistance Program.
Figure 2 shows the predictive margins of weekly food expenditures for baseline (pre-benefit) and intervention (benefits) periods by type of vendor (food retailers and restaurants), as well as mean change in household expenditures from week to week. Household expenditures at restaurants did not vary from week to week during either the baseline or intervention periods (Fig. 2a). During the baseline period, weekly restaurant expenditures ranged from $25·32 in week 1 to $22·64 in week 4; there were no significant changes in expenditures between weeks. During the intervention period, average weekly restaurant expenditures ranged from $16·95 to $20·61. As in the baseline period, there were no significant changes in restaurant expenditures from week to week.
Predictive margins and average change in food expenditures during baseline and intervention periods by vendor type (A) restaurants; (B) food retailers (n 249). Predictive margins are estimates of average food expenditures adjusted for age, gender, race/ethnicity, education, number of children in household, number of adults in household, baseline household food security status, annual household income, employment status, concurrent participation in Special Supplemental Nutrition Program for Women, Infants, and Children (WIC), benefit levels and study group. Pairwise comparisons of the adjusted estimates were used for average change in food expenditures between weeks. *P < 0·05; **P < 0·01; ***P < 0·001
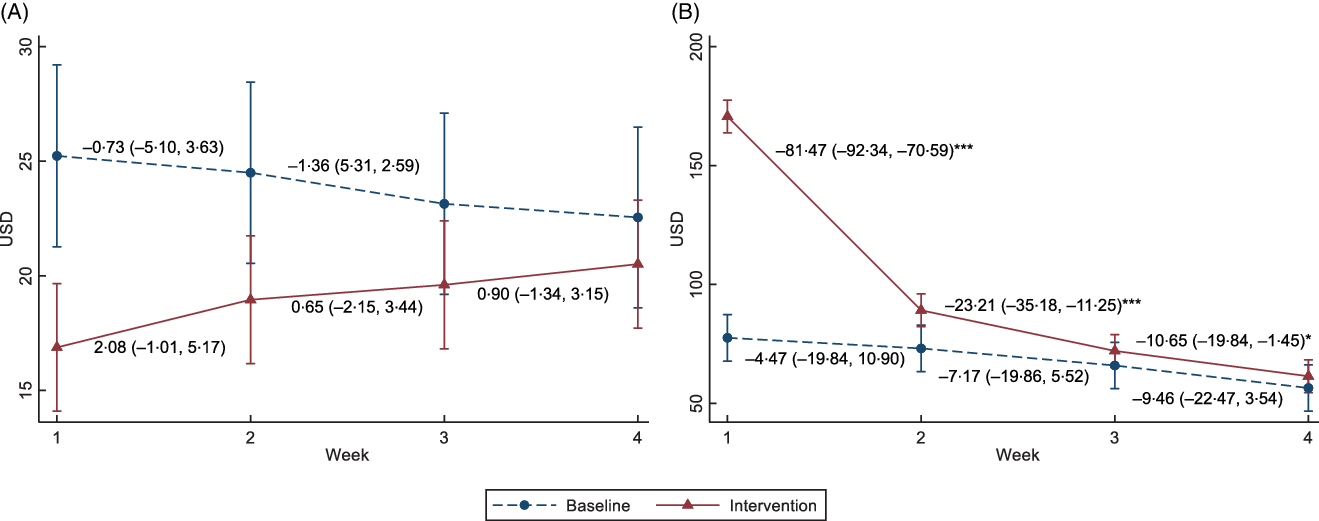
During the baseline period, food retailer expenditures did not vary from week to week. Households spent between $77·89 in week 1 and $56·70 in week 4, with no significant change between weeks. During the intervention period, however, food retailer expenditures were cyclical (Fig. 2b). Nearly all households depleted benefits fully every month; on average, households depleted half their monthly budget on food retailers within a week of benefit distribution. Food retailer expenditures were highest in the first week ($171·35) and declined precipitously in the second week ($89·36); this reduction in spending was maintained for the remainder of the month ($72·38 and $61·69 in weeks 3 and 4, respectively). The change in expenditures was statistically significant from week to week (P < 0·001 for all pairwise comparisons).
Cyclical food retailer expenditures were observed across the sample during the intervention period, independent of household characteristics (see online supplementary material, Supplemental Table 1). There were, however, differences in magnitude of spending by household composition and available household resources. Larger households with more children (P = 0·008) or adults (P < 0·001) spent more in the first week compared with smaller households. Households with higher annual incomes (>$35 000) spent more than lower-income households throughout the month (P < 0·001 for all weeks). Households with an annual income of $15–34 999 also spent more than lower-income households in all but the final week of the month (P < 0·05). Households participating in WIC spent more than non-participants throughout the month (P < 0·001). Finally, households with low or very low food security spent more in the first week compared with households with high or marginal food security (P < 0·001). This trend was reversed for the remainder of the month: households with very low food security spent less than households with low or high food security status (P < 0·05 for weeks 2, 3 and 4).
Figure 3 shows results from analysis of food retailer expenditures by food category. During the baseline period, weekly expenditures on fruits and vegetables did not vary significantly between weeks, ranging from $9·76 in week 1 to $5·95 in week 4 (Fig. 3a). During the intervention period, however, expenditures were $22·58, $13·29, $10·76 and $9·86 in weeks 1 to 4, respectively. The changes in expenditure from week 1 to week 2 and from week 2 to week 3 were significant (P < 0·001 and P = 0·004, respectively).
Predictive margins and average change in food retailer expenditures during baseline and intervention periods by food category (A) fruits and vegetables; (B) foods high in added sugar (n 249). Predictive margins are estimates of average food expenditures adjusted for age, gender, race/ethnicity, education, number of children in household, number of adults in household, baseline household food security status, annual household income, employment status, concurrent participation in Special Supplemental Nutrition Program for Women, Infants, and Children (WIC), benefit levels and study group. Pairwise comparisons of the adjusted estimates were used for average change in food expenditures between weeks. *P < 0·05; **P < 0·01; ***P < 0·001
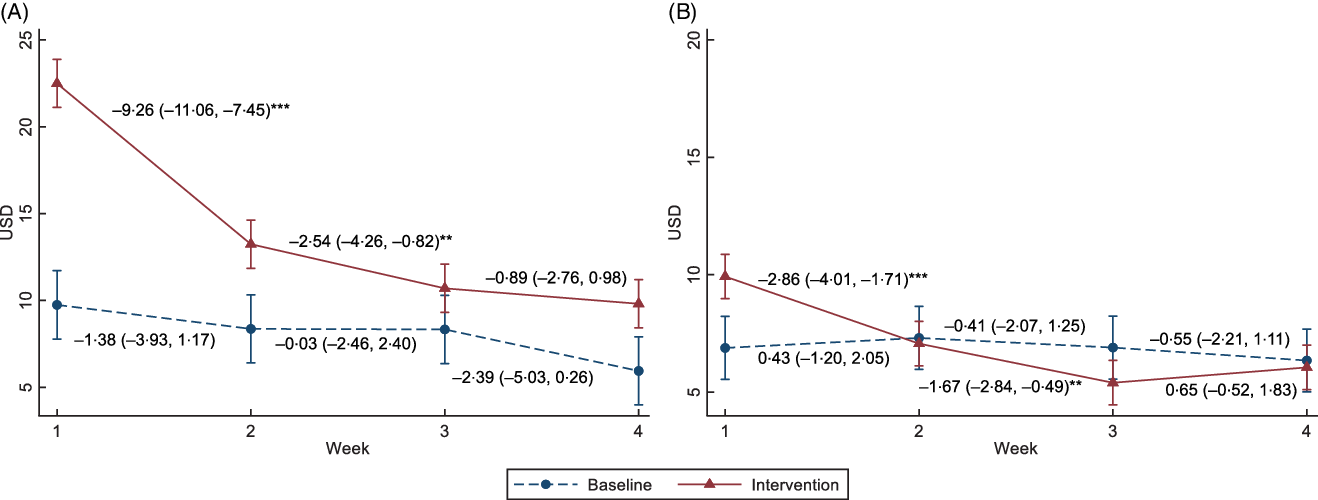
A similar pattern was observed for foods high in added sugar (Fig. 3b). Weekly expenditures did not vary during the baseline period, with households spending between $6·99 and $6·42. In contrast, expenditures on foods high in added sugar decreased from $9·96 in week 1 to $7·05 in week 2 of the intervention period (P < 0·001). Expenditures were consistent for the remainder of the month, with no significant differences in expenditures between weeks.
Discussion
To our knowledge, this is the first study to assess changes in household food purchasing behaviour using prospective food purchasing data with measurement periods before and after the onset of benefits. This study is also the first to evaluate changes in spending for policy-relevant categories of food – specifically, changes triggered by nutrition assistance. Findings are notable for several reasons. First, restaurant expenditures, which were not covered by benefits, did not vary through the month during either the baseline and intervention periods. In contrast, food retailer expenditures covered by benefits demonstrated a cyclical pattern after households received nutrition assistance. Spending was greatest in the first week, with a precipitous reduction in spending in the second week that was sustained for the remainder of the benefit month. These findings are consistent with studies showing the benefit cycle among households enrolled in SNAP(Reference Whiteman, Chrisinger and Hillier7,Reference Tiehen, Newman and Kirlin10,Reference Wilde and Ranney25,Reference Franckle, Thorndike and Moran26) .
Importantly, the cyclical pattern in food retailer expenditures was robust across all household characteristics included in the analyses, suggesting that the benefit cycle broadly impacts low-income households participating in SNAP-like nutrition assistance programmes. Nonetheless, findings suggest notable differences by household economic means. Households with higher annual incomes and concurrently participating in WIC spent more throughout the benefit month compared with non-WIC, lower-income households. This is likely due to greater available resources for food in both cases – either greater expendable income in higher-income households or a greater nutrition assistance in WIC households. In contrast, households with very low food security experienced a more prominent benefit cycle, with greater spending in the first week followed by fewer expenditures for the remainder of the month compared with more food secure households. Low food security may indicate a more severe state of resource depletion and pent-up demand for food, resulting in greater fluctuations in expenditures across the month.
Further evaluation of food retailer expenditures also found evidence of this pattern for both fruits and vegetables and foods high in added sugar, although the decline was steeper for fruits and vegetables. This aligns with previous research, which suggests that SNAP households may experiences close to 25 % reduction in fruit and vegetable spending in the last 2 weeks of the benefit month(Reference Franckle, Thorndike and Moran26). Previous research has also found lower intake of fruits and vegetables and lower quality of diet among SNAP participants as the benefit month progresses, suggesting that reduced fruit and vegetable expenditures likely result in reduced intake(Reference Todd4,Reference Whiteman, Chrisinger and Hillier7,Reference Kharmats, Jones-Smith and Cheah8) .
Limitations
Limitations of this study include reliance on participant submission of all household food purchase receipts. While benefit expenditures were confirmed using an online debit card interface, expenditures made using other income sources could not be verified. If receipt submission was incomplete for expenditures made using other income sources, household expenditures may be underestimated(Reference French, Shimotsu and Wall36). However, since underestimation likely occurred to a similar extent across the baseline and intervention periods, this measurement error should not affect the ability to evaluate cyclical patterns in spending within those periods. Furthermore, while the present analyses control for concurrent participation in WIC, this study did not include information about the timing of other income sources. Previous research shows that the timing of other income streams does not significantly impact cyclical food purchasing behaviour among SNAP participants, which may also be applicable to our study(Reference Beatty, Bitler and Cheng37).
Finally, the study sample was drawn from the Minneapolis-St. Paul, Minnesota, metropolitan area, with an income threshold for study inclusion that was higher than SNAP eligibility criteria. This likely resulted in a sample of households with greater resources than SNAP participants. In a random, nationally representative sample of SNAP participants, approximately 40 % of households reported an annual income <$15 000 and another 40 % reported an income of $15-$34 999(38). In contrast, 34 % and 47 % of the present study sample reported annual household incomes of <$15 000 and $15–34 999, respectively. Thus, findings of this study may not generalise to the SNAP-eligible population.
Conclusions
This study is the first longitudinal examination of cyclical food purchasing behaviour in the benefit cycle and addresses multiple policy-relevant aspects of the cycle. Food purchasing behaviour among low-income households was found to be cyclical in the presence of nutrition assistance. The cycle was robust across a variety of household characteristics, with notable differences in spending by household economic means and food security status. Findings suggest that efforts to mitigate the benefit cycle should be applied broadly, but with a focus on households with the fewest resources. Cyclical food purchasing was also evident for both categories of foods being evaluated, with a prominent cyclical pattern in fruit and vegetable expenditures. Future interventions should consider investment of resources in the second half of the benefit month to help smooth this cycle, especially as it relates to fruits and vegetables. From a policy perspective, further research is necessary to evaluate factors that may be contributing to the benefit cycle. Research is also needed to evaluate heterogeneity within the benefit cycle to inform targeted interventions to smooth cyclical food expenditures and address negative outcomes associated with the benefit cycle.
Acknowledgements
Acknowledgements: The authors thank Sarah A Rydell for her help with quality assurance of the data. Financial support: This project was supported by Award Number R01DK098152 and T32DK083250 from the National Institute of Diabetes and Digestive and Kidney Diseases at the Division of Epidemiology & Community Health, School of Public Health at the University of Minnesota. Conflicts of interest: There are no conflicts of interest. Authorship: S.V. and L.J.H. wrote the first draft of the manuscript; all authors read and approved the final manuscript. Ethics of human subject participation: This study was conducted according to the guidelines laid down in the Declaration of Helsinki, and all procedures involving research participants were approved by the University of Minnesota Institutional Review Board. Written informed consent was obtained from all participants.
Supplementary material
For supplementary material accompanying this paper visit https://doi.org/10.1017/S136898002000405X


