





Introduction
Herbicides have long anchored weed management in U.S. cropping systems since the 1960s, offering unmatched efficacy, scalability, speed, and cost-efficiency across vast acreages (Duke Reference Duke2012; Green Reference Green2014; Powles and Yu Reference Powles and Yu2010). Their dominance expanded alongside agricultural mechanization, simplified rotations, and the widespread adoption of herbicide-resistant cultivars due to seed company and chemical company integration, thus embedding chemical control within the operational model of industrial row-crop agriculture (Harker and O’Donovan Reference Harker and O’Donovan2013; Owen Reference Owen2016; Shaner Reference Shaner2014). This trajectory reflects an efficiency-oriented paradigm in weed control product marketing and weed control, rooted in classical competition theory (Harper Reference Harper1977) and reinforced by deterministic models that prioritize uniformity, predictability, and short-term economic returns (Radosevich et al. Reference Radosevich, Holt and Ghersa2007; Swanton and Weise Reference Swanton and Weise1991). Yet the long-term viability of this approach is increasingly constrained by structural weaknesses: herbicide-resistant weeds threaten sustainability, and increasing multi–site-of-action failures indicate the fragility of herbicide-dependent systems (Heap Reference Heap2025; Kniss Reference Kniss2018). Meanwhile, inflation-adjusted herbicide and associated trait-containing seed expenditures continue to rise, signaling declining returns on chemical reliance (Livingston et al. Reference Livingston, Fernandez-Cornejo and Frisvold2015; Singh and Jhala Reference Singh and Jhala2025).
Resistance evolution is now a central challenge in modern weed management, reshaping both practice and theory. Repeated application of herbicides with similar sites of action imposes strong directional selection, accelerating the spread of resistant alleles across agroecosystems (Délye et al. Reference Délye, Jasieniuk and Le Corre2013; Neve et al. Reference Neve, Norsworthy, Smith and Zelaya2011). As of October 2025, 537 resistance cases spanning 273 weed species have been documented globally (Heap Reference Heap2025). This trajectory makes clear that management tactics must be diversified to mitigate the evolutionary processes that sustain resistance (Peterson et al. Reference Peterson, Collavo, Ovejero, Shivrain and Walsh2018). Palmer amaranth, a dominant weed in southern, mid-southern, midwestern, and northeastern states exemplifies this challenge; populations of the weed in Arkansas are now resistant to six or more postemergence herbicides (Carvalho-Moore et al. Reference Carvalho-Moore, Norsworthy and Barber2025). At the same time, discovery of novel herbicide sites of action has nearly stalled; tetflupyrolimet (Kang et al. Reference Kang, Emptage, Kim and Gutteridge2023; Selby et al. Reference Selby, Satterfield, Puri, Stevenson, Travis, Campbell, Taggi, Hughes and Bereznak2023), diflufenican, and icafolin (Bayer 2025) represent rare advances in herbicide mode of action discovery.
These constraints expose limitations of chemical input-intensive paradigms and reinforce the need for complementary strategies that strengthen ecological buffering. In mid and upper latitude U.S. wheat soybean systems, the need for diversification is particularly acute where the short interval between winter wheat harvest and soybean planting constrains traditional wheat–soybean double-cropping (DC) systems. By extending effective season length, relay intercropping (RIC) offers a practical alternative to DC across a wide geography, including Arkansas and more northerly latitudes. Unlike conventional DC, in which delayed soybean establishment incurs photothermal penalties and subsequent yield reduction, RIC allows earlier ground cover and radiation capture with wheat while preserving the effective growing season for soybean, mitigating risks associated with delayed planting (Caviglia et al. Reference Caviglia, Sadras and Andrade2004; Egli Reference Egli2011; Hansel et al. Reference Hansel, Schwalbert, Shoup, Holshouser, Parvej, Prasad and Ciampitti2019; Wesley Reference Wesley, Heatherly and Hodges1998). In this context, RIC aligns with resistance-management frameworks that emphasize diversification and reduction of selection pressure (Beckie et al. Reference Beckie, Ashworth and Flower2019; Davis and Frisvold Reference Davis and Frisvold2017; Owen et al. Reference Owen, Beckie, Leeson, Norsworthy and Steckel2015).
Integrated weed management (IWM) represents a strategic reorientation from reactive control to proactive ecological stewardship. Rather than relying on single interventions, IWM integrates chemical, cultural, mechanical, and ecological tactics designed to diversify mortality sources, fragment selection pressure, and delay resistance evolution (Mortensen et al. Reference Mortensen, Egan, Maxwell, Ryan and Smith2012; Norsworthy et al. Reference Norsworthy, Ward, Shaw, Llewellyn, Nichols, Webster, Bradley, Frisvold, Powles, Burgos, Witt and Barrett2012; Owen Reference Owen2016). Practices such as crop diversification, strategic rotation, and habitat manipulation are foundational to sustainable resistance mitigation (Beckie and Harker Reference Beckie and Harker2017). In this systems-oriented view, resistance is not simply a loss of chemical efficacy but a failure of the production system to distribute risk across independent weed control and weed biology practices and processes. Biological diversification can provide functional redundancy that buffers agricultural system performance against perturbations such as a rapidly expanding noncontrolled weed population, consistent with Holling’s (Reference Holling1973) resilience framework, which posits that ecosystem stability arises from the capacity to absorb disturbance and reorganize while maintaining essential function. RIC exemplifies this principle, functioning not merely as a spatial arrangement but as a temporal and ecological scaffold that promotes resource partitioning, suppresses weed emergence, and advances ecological intensification (Tilman et al. Reference Tilman, Cassman, Matson, Naylor and Polasky2002; Tittonell Reference Tittonell2014). Supporting this premise, a recent meta-analysis reported weed suppression (decreases in weed biomass or density) in 86% of intercropping cases relative to mono cropping, indicating that temporal and spatial overlap can constrain the weed recruitment niche and motivate evaluation of RIC within IWM tactics and practices (Stomph et al. Reference Stomph, Dordas, Baranger, de Rijk, Dong, Evers, Gu, Li, Simon, Jensen, Wang, Wang, Wang, Xu, Zhang, Zhang, Zhang, Bedoussac, van der Werf and Sparks2020).
In wheat-soybean RIC, soybean is seeded into standing winter wheat, typically between Feekes growth stages 8 and 10.5 (flag leaf to heading). The aim is to exploit canopy stratification and phenological offset and thereby extend the effective growing season, suppress weeds biologically, and improve land-use efficiency (Duncan Reference Duncan1988; Malcomson et al. Reference Malcomson, Mourtzinis, Gaska, Roth, Silva and Conley2025; Nelson Reference Nelson2010; Storkey et al. Reference Storkey, Neve and Westbury2021). This temporal layering creates a ground cover mosaic that limits light penetration to the soil surface and reduces weed recruitment through ecological shading (Jha and Norsworthy Reference Jha and Norsworthy2009; Norsworthy and Oliveira Reference Norsworthy and Oliveira2007). Empirical studies report land equivalent ratios (LERs) exceeding 1.2 in cereal-legume relay systems (Liebman and Dyck Reference Liebman and Dyck1993; Thompson et al. Reference Thompson, Smith, Barbercheck and Mortensen2024). However, cultural interventions alone rarely achieve weed control sufficient for maximizing yield and reducing weed seedbank recruitment, and herbicide inputs often remain necessary to meet agronomic expectations for weed suppression (Jeffers et al. Reference Jeffers, Triplett and Lafever1977; MacLaren et al. Reference MacLaren, Storkey, Menegat, Metcalfe and Dehnen-Schmutz2020).
Relay intercropping may therefore be best understood not as a substitute for chemical control but as a resilience-oriented scaffold within IWM in which ecological processes support herbicide efficacy and buffer performance variability such as lack of control of herbicide-resistant weeds or decreases in herbicide efficacy due to environmental factors. This study evaluated RIC relative to full-season soybean (FS) across a gradient of herbicide-use intensity at two Arkansas locations. Specifically, we tested whether RIC 1) elevates baseline weed control under minimal herbicide inputs, 2) adds functional weed suppression overlap under more intensive herbicide programs, 3) curtails weed seed rain, and 4) stabilizes profitability when herbicide performance is variable. By embedding RIC within a systems-level IWM framework, the study aimed to clarify its role as a biologically grounded and economically viable cultural tactic for managing herbicide-resistant weeds in Arkansas and other states in the mid-South where soybean is grown.
Materials and Methods
Field experiments were conducted during fall 2023 through crop harvest in 2024 at two University of Arkansas research stations: the Milo J. Shult Agricultural Research and Extension Center in Fayetteville (36.09°N, 94.17°W; Captina silt loam), and the Pine Tree site Research Station, near Colt (35.10°N, 90.94°W; Calhoun silt loam), representing moderately differentiated agroecological zones of the mid-South. The experimental design was a randomized complete block design (RCBD) with four replications (plot size = 3.66 m × 12.19 m at the Fayetteville site; 3.05 m × 12.19 m at the Pine Tree site) per site, arranged as a factorial combination of two cropping systems and three herbicide management intensities.
Two cropping systems were compared: 1) FS, grown as a monoculture, and 2) wheat-soybean RIC, in which winter wheat (cultivar Buck Monster) was sown in fall (mid-October) and soybean (cultivar Asgrow AG45XFO) was interseeded (April 15 and 17 in Fayetteville and Pine Tree, respectively) into standing wheat (Feekes growth stages 10 to 10.5). Wheat was drilled at 120 kg ha−1 with 19-cm spacing with a skip row (every fifth row at Fayetteville and fourth row at Pine Tree) on top of the bed. Soybean seeding rate was 346,000 seeds ha−1 with 91-cm and 76-cm row spacing at the Fayetteville and Pine Tree sites, respectively. RIC wheat was harvested in early June (adjusted to 12% moisture). All crop management practices, including fertilization, irrigation, and pest control, followed University of Arkansas Extension recommendations.
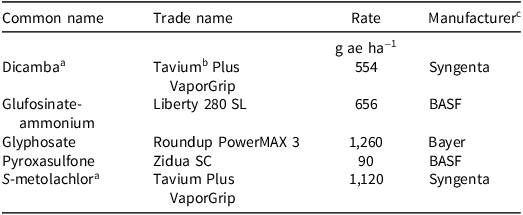
Three herbicide use intensities were imposed: 1) a nontreated control (hereafter “no herbicide”), 2) one-pass, and 3) two-pass applications. Herbicide information is presented in Table 1. In FS, no herbicide plots received a burndown application of glufosinate-ammonium prior to crop emergence to establish the plots but they did receive no in-season herbicide. RIC plots also received no herbicide during the soybean phase, and one-pass and two-pass treatments. One-pass treatments included dicamba, S-metolachlor, and glyphosate applied at soybean planting for FS or at wheat harvest for RIC systems. The two-pass regime included a postemergence application of glyphosate, pyroxasulfone, and glufosinate-ammonium for FS, or the same rates of glyphosate and pyroxasulfone only for RIC. Herbicides were applied using a CO2-pressurized backpack sprayer calibrated to deliver 140 L ha−1.
Herbicides used in this study along with relevant product information.

Table 1 Long description
A table comparing herbicide use intensities and relevant product information. The table has four columns: Common name, Trade name, Rate, and Manufacturer. It has seven rows, including the header row. Row 1: Common name, Dicamba; Trade name, Tavium Plus, VaporGrip; Rate, 554; Manufacturer, Syngenta. Row 2: Common name, Glufosinate-ammonium; Trade name, Liberty 280 SL; Rate, 656; Manufacturer, BASF. Row 3: Common name, Glyphosate; Trade name, Roundup PowerMAX 3; Rate, 1,260; Manufacturer, Bayer. Row 4: Common name, Pyroxasulfone; Trade name, Zidua SC; Rate, 90; Manufacturer, BASF. Row 5: Common name, S-metolachlor; Trade name, Tavium Plus, VaporGrip; Rate, 1,120; Manufacturer, Syngenta.
a The herbicide is a component of the premixed formulation.
b Tavium is a premixed formulation of dicamba and S-metolachlor.
c Manufacturer locations: BASF Corporation, Research Triangle Park, NC; Bayer CropScience LP, St. Louis, MO; Syngenta, Greensboro, NC.
Weed control and ground cover were assessed weekly (4 to 16 wk after planting [WAP]) via visual ratings (0% to 100%). Ground cover was further quantified using imagery (33 m altitude) from an unpiloted aerial vehicle (UAV) processed to estimate percent soil coverage. Weed biomass was sampled at soybean maturity by harvesting aboveground portions from two 0.5-m2 quadrats per plot. Samples were oven-dried at 60 C for 72 h, and weighed. Weed biomass was categorized as either grass or broadleaf. The grasses included barnyardgrass [Echinochloa crus-galli (L.) P. Beauv], broadleaf signalgrass, foxtail species (Setaria spp.), and large crabgrass [Digitaria sanguinalis (L.) Scop.] at the Fayetteville site, and broadleaf signalgrass and barnyardgrass at the Pine Tree site. Broadleaf weeds included primarily Palmer amaranth at the Fayetteville site and Palmer amaranth and common cocklebur (Xanthium strumarium L.) at the Pine Tree site). Palmer amaranth seed production was estimated from the same samples by threshing female inflorescences and calculating seed density (seeds per square meter) using the 100-seed weight method.
Soybean yield was measured by harvesting all rows per plot with a combine and adjusting to 13% moisture. To enable system-level comparisons, ${\rm{RIC}}$
yield was converted to soybean-equivalent yield, calculated using Equation 1:
${\rm{RIC}}$
yield was converted to soybean-equivalent yield, calculated using Equation 1:
 \begin{equation} {\rm{Soybean}} - {\rm{equivalent}}\;{\rm{yield}}\; = {Y_s} + \left( {{{{P_w}} \over {{P_s}}}} \right){Y_w} - \left( {{{{C_w}} \over {{P_s}}}} \right) \end{equation}
Where Y s and Y w are soybean and wheat yields, respectively, in kilograms per hectare (kg ha−1), P s ($0.35 kg−1) and P w ($0.20 kg−1) are soybean and wheat prices, respectively, and C w ($400 ha−1) is the incremental wheat production cost. (All prices and costs are in U.S. dollars.) Economic parameters were derived from University of Arkansas Extension crop budgets (UAEX 2025). Soybean was designated as the primary crop and assigned full production costs, whereas wheat was evaluated based on incremental inputs only.
Analyses were conducted in R (v. 4.5.1; R Core Team 2025). Weed control and ground cover were modeled using beta-distributed generalized additive models (beta-GAMs) with a logit link, chosen to avoid transformation artifacts. Fixed effects included cropping system and herbicide intensity, with temporal dynamics modeled using smooth functions of WAP or days after soybean planting (DAP). Random effects for block and location were included as penalized smooth terms, estimated via restricted maximum likelihood, with factor-smooth interactions to accommodate site-specific variation. Predictions were generated on a dense time grid and averaged across locations. Season-integrated suppression was quantified using area-under-the-curve metrics for early (4 to 8 WAP), mid (8 to 12 WAP), and late (12 to 16 WAP) intervals via trapezoidal integration, normalized to the FS no herbicide baseline.
Weed biomass and seed production, and soybean-equivalent yield data were analyzed using linear and generalized linear mixed models (LLMs/GLMMs). Soybean-equivalent yield was analyzed using an LMM with a Gaussian error structure. Weed seed production was analyzed using a GLMM with a Poisson (or negative binomial) distribution and log link. Weed biomass was analyzed using a zero-inflated gamma GLMM to account for a high frequency of zero observations. Fixed effects in these models included cropping system, herbicide intensity, location, and their interactions; replication nested within location was treated as a random effect. Type-III ANOVA was used for hypothesis testing, and estimated marginal mean (EMM) with pairwise contrasts (RIC vs FS) were computed using the Tukey adjustment (α = 0.05). Residual diagnostics were used to verify model assumptions.
Sensitivity analysis was conducted with Equation 2:
 \begin{equation} -{P_s} \in \left[ {0.25,\!0.45} \right]\$ \;{\rm{k}}{{\rm{g}}^{ - 1}})\;{P_w} \in \left[ {0.10,\!0.30} \right]\;\$ \;{\rm{k}}{{\rm{g}}^{ - 1}} \end{equation}
A closed-form grid was generated for Δ = RIC – FS across all combinations of ${P_s}$
and
${P_s}$
and ${P_w}$
, stratified by herbicide intensity and location. Break-even loci (
${P_w}$
, stratified by herbicide intensity and location. Break-even loci ( ${\rm{\Delta }} = 0$
) were computed as follows (Equation 3):
${\rm{\Delta }} = 0$
) were computed as follows (Equation 3):
 \begin{equation} \Delta \left( {{P_s},{P_w}} \right) = {\Delta _0} + \left( {{{{P_w}} \over {{P_s}}} - {k_0}} \right)\cdot{w_{{\rm{emm}}}} - \left( {{{{C_w}} \over {{P_s}}} - {{{C_w}} \over {P_s^0}}} \right)\end{equation}
where Δ0 is the baseline yield contrast and w emm is the estimated marginal mean wheat yield for RIC. Uncertainty was quantified via paired-block bootstrap (1,000 iterations), resampling blocks within locations to preserve RCBD structures.
Results and Discussion
Weed Control
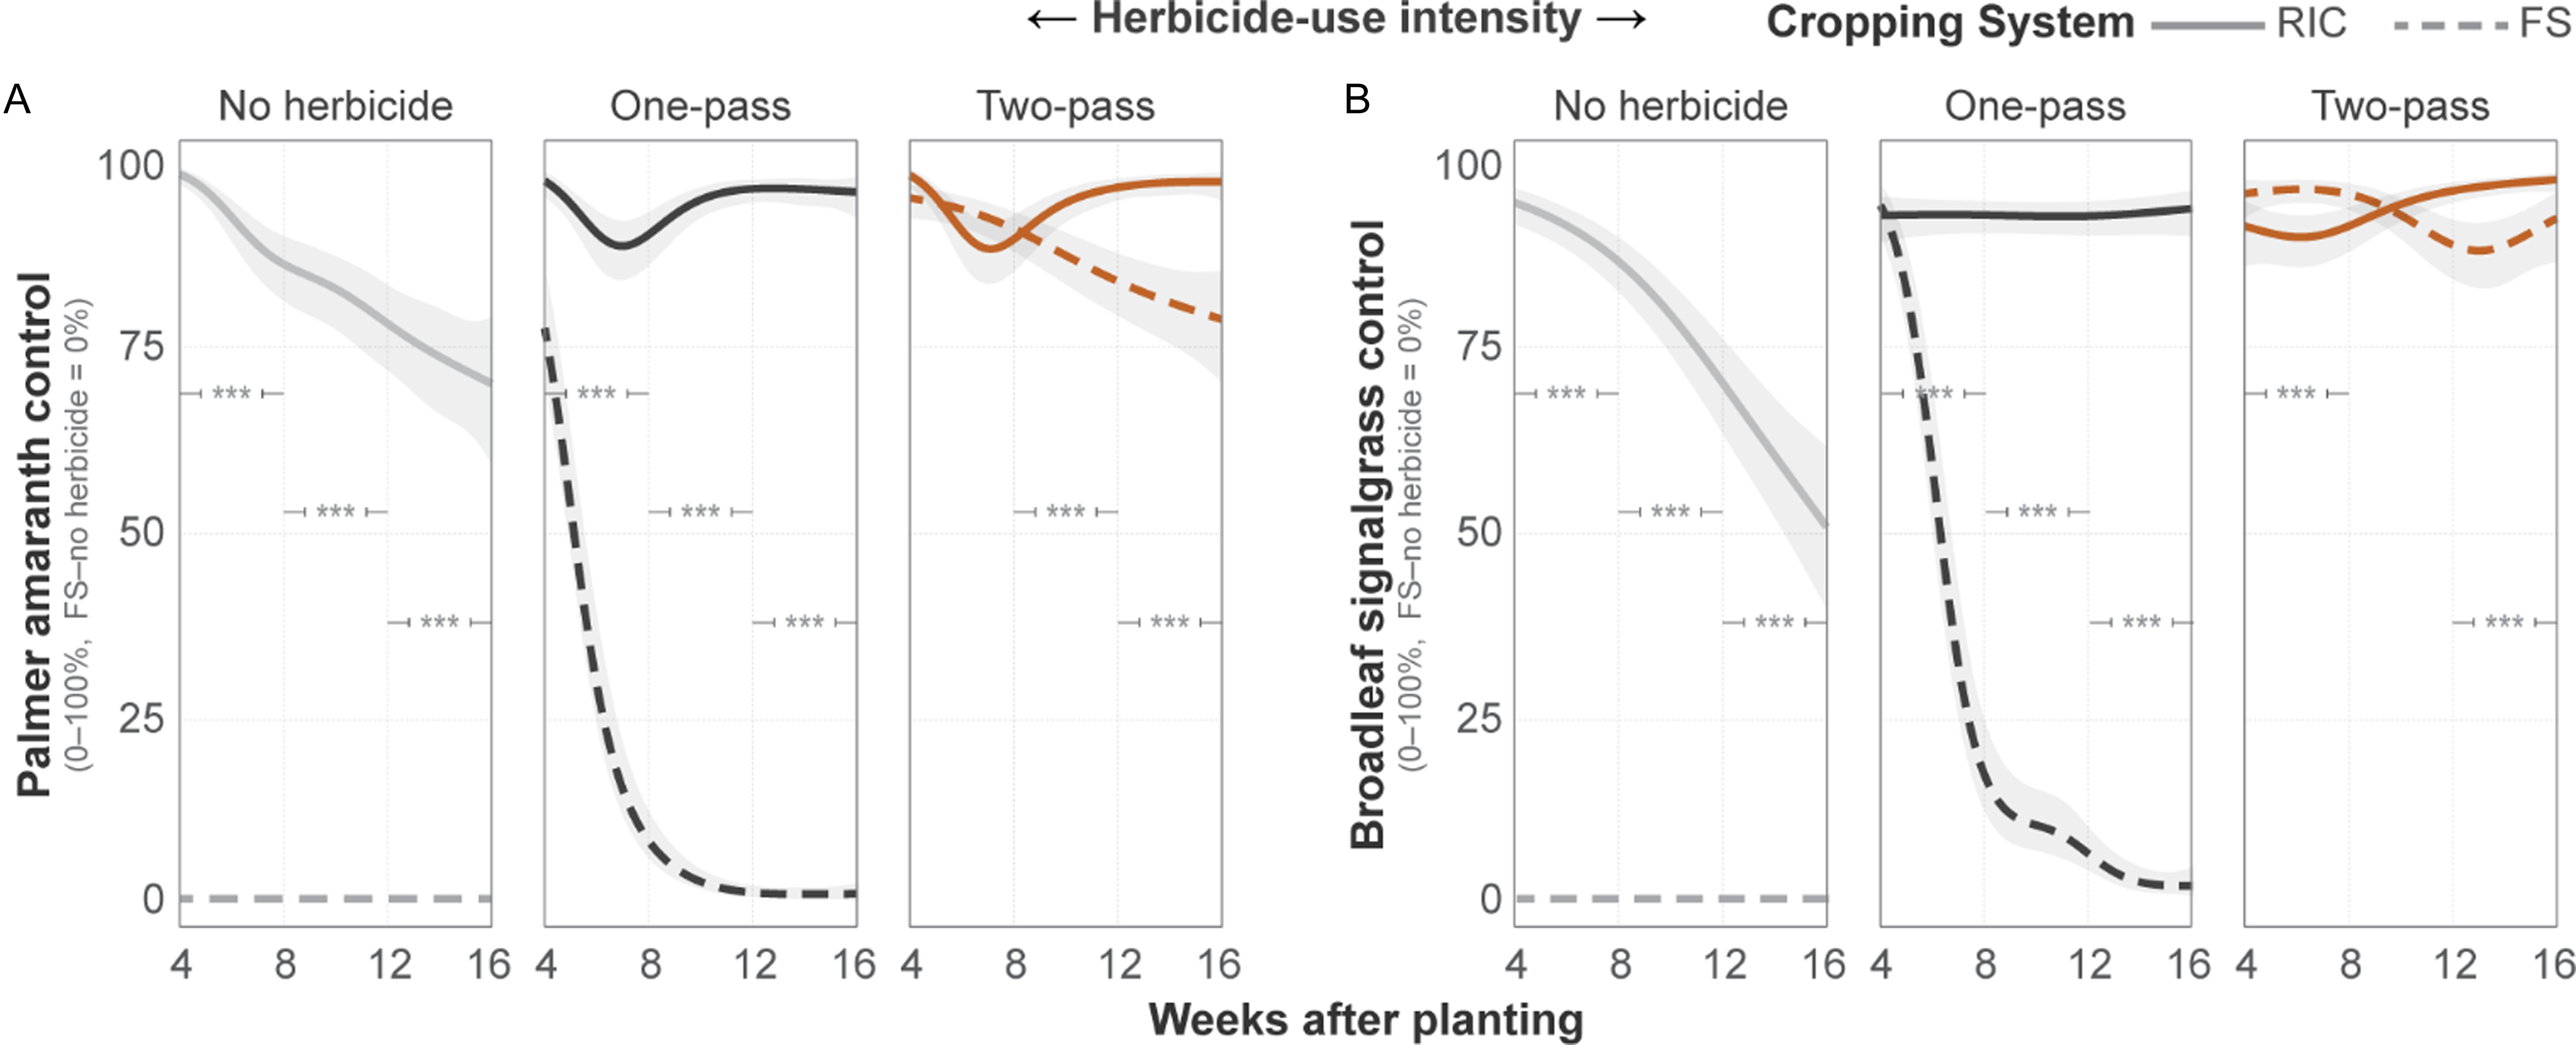
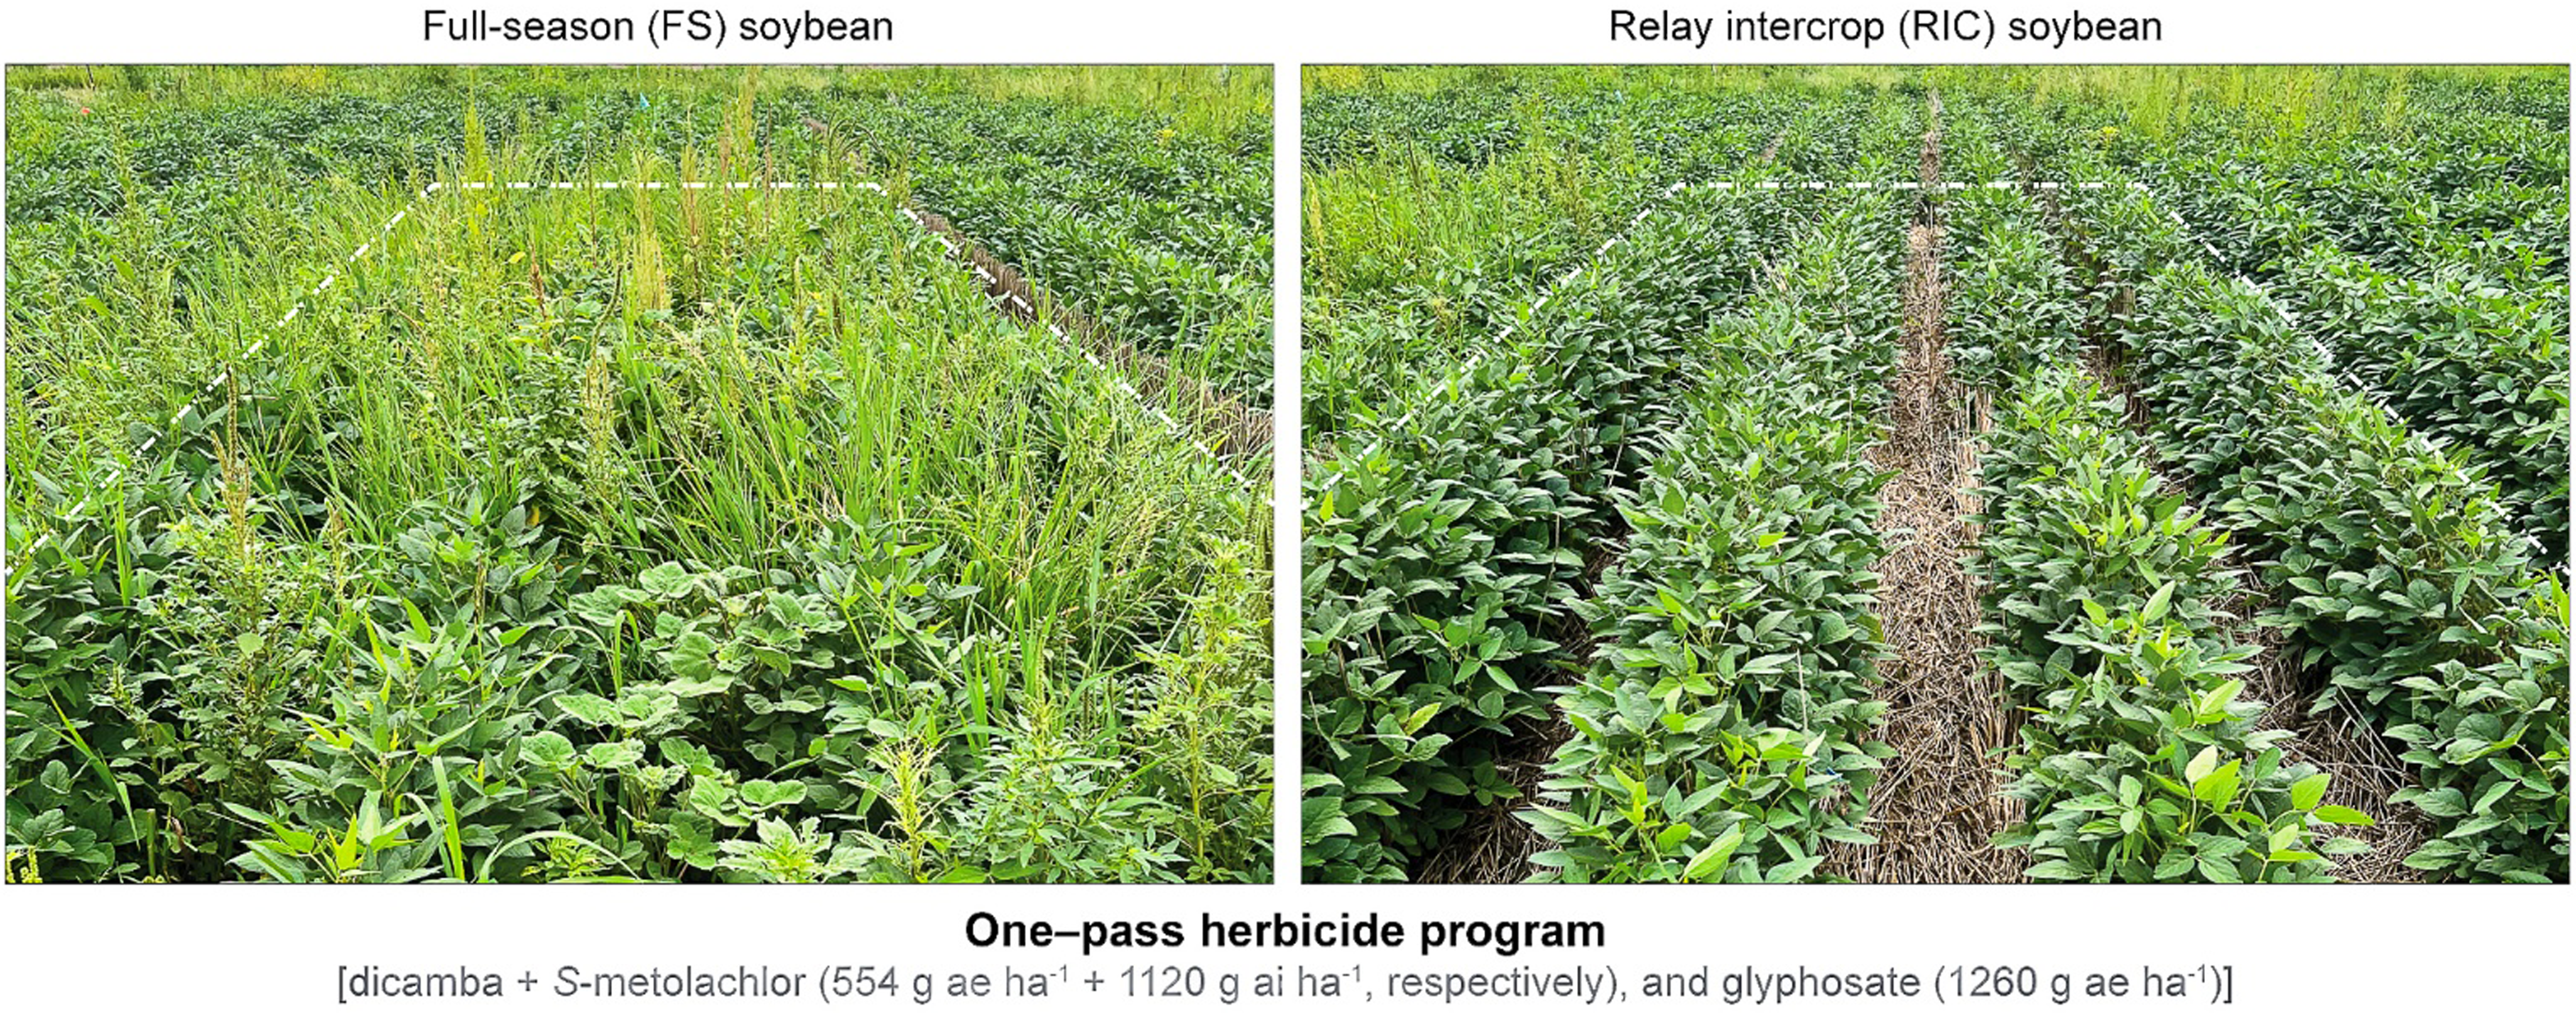
Weed control trajectories differed between cropping systems and herbicide-use intensities for both Palmer amaranth (Figure 1A) and broadleaf signalgrass (Figure 1B). Temporal models indicated early season divergence despite initially high control across treatments. Suppression in the FS one-pass system declined rapidly over time (P < 0.001), whereas RIC maintained stable control, consistent with sustained ecological interference. The advantage of RIC over FS was greatest under the no-input and one-pass regimes, with significant differences across all season-integrated area under the curve intervals (P < 0.001). Representative midseason photographs under the one-pass regime illustrate this contrast (Figure 2). Under the two-pass regime, Palmer amaranth suppression in RIC exceeded FS by 7% and 16% during midseason and late-season intervals, respectively (P < 0.001). For broadleaf signalgrass, early season and midseason differences were not significant, but late-season suppression remained higher in RIC by an average of 9 percentage points (P < 0.001).
Temporal weed control dynamics across cropping systems and herbicide-use intensities. Smoothed trajectories of weed control (% suppression) over weeks after planting for (A) Palmer amaranth and (B) broadleaf signalgrass, averaged across two sites (Fayetteville and Pine Tree). Curves are derived from beta-distributed generalized additive models with logit link functions. Neutral 95% confidence ribbons are shown. Asterisks (*, **, ***) denote statistical significance of area-under-the-curve contrasts between relay intercropping (RIC) and full-season soybean (FS), corresponding to P-values < 0.05, < 0.01, and < 0.001, respectively.

Plot-level photographs illustrating midseason weed cover levels in full-season (FS) soybean and relay intercropping (RIC) soybean, left and right, respectively, following one-pass herbicide application. The herbicide application was made to FS at planting and to RIC soybean immediately following wheat harvest. Weed control was ∼20% from FS and ∼90% from RIC.

The weed control observed under RIC likely reflects interacting ecological mechanisms, including canopy architecture and related light quantity and quality that affects soil temperature and seed and plant growth response; residue-mediated interference, including physical and allelopathic effects (Blum Reference Blum2011); and resource partitioning. In RIC, these processes reduce soil-surface irradiance and dampen diurnal temperature fluctuations, conditions that inhibit germination and establishment of light- and heat-responsive species. This mechanism-based interpretation is consistent with sustained suppression under reduced-input regimes (Norsworthy and Oliveira Reference Norsworthy and Oliveira2007; Teasdale Reference Teasdale1995; Teasdale and Mohler Reference Teasdale and Mohler1993). Broadleaf signalgrass, a C4 annual grass that favors open, disturbed environments, was suppressed under prolonged shading, reinforcing the role of canopy-driven interference. These patterns align with classical interference theory, which emphasizes early capture of light and resources as determinants of competitive outcomes (Harper Reference Harper1977; Radosevich et al. Reference Radosevich, Holt and Ghersa2007). Similar effects have been reported in diversified systems and cover-crop contexts that promote rapid canopy closure and constrain the germination niche of annual weeds (Liebman and Dyck Reference Liebman and Dyck1993; Storkey et al. Reference Storkey, Neve and Westbury2021; Teasdale Reference Teasdale1998).
Overall, temporal layering in RIC sustained weed suppression at levels that matched or exceeded FS across herbicide regimes. RIC therefore served two roles: a cultural weed control substitute under low-input scenarios, and a synergistic complement to chemical control when herbicides were applied. Under minimal inputs, RIC approached the efficacy of FS managed with a two-pass program. Even with the two-pass regime, RIC maintained superior midseason and late-season weed suppression, indicating that canopy interference and residue-mediated shading can buffer control against seasonal variability (e.g., rain timing and temperature) and operational constraints (e.g., delayed application or equipment disruption). The ability of RIC to achieve one-pass control comparable to two-pass FS control illustrates functional redundancy within IWM, where overlapping ecological and chemical processes jointly sustain agronomic outcomes. In this framing, system durability arises less from escalating inputs than from strategic stacking of complementary weed control tactics.
Weed Biomass and Seed Production
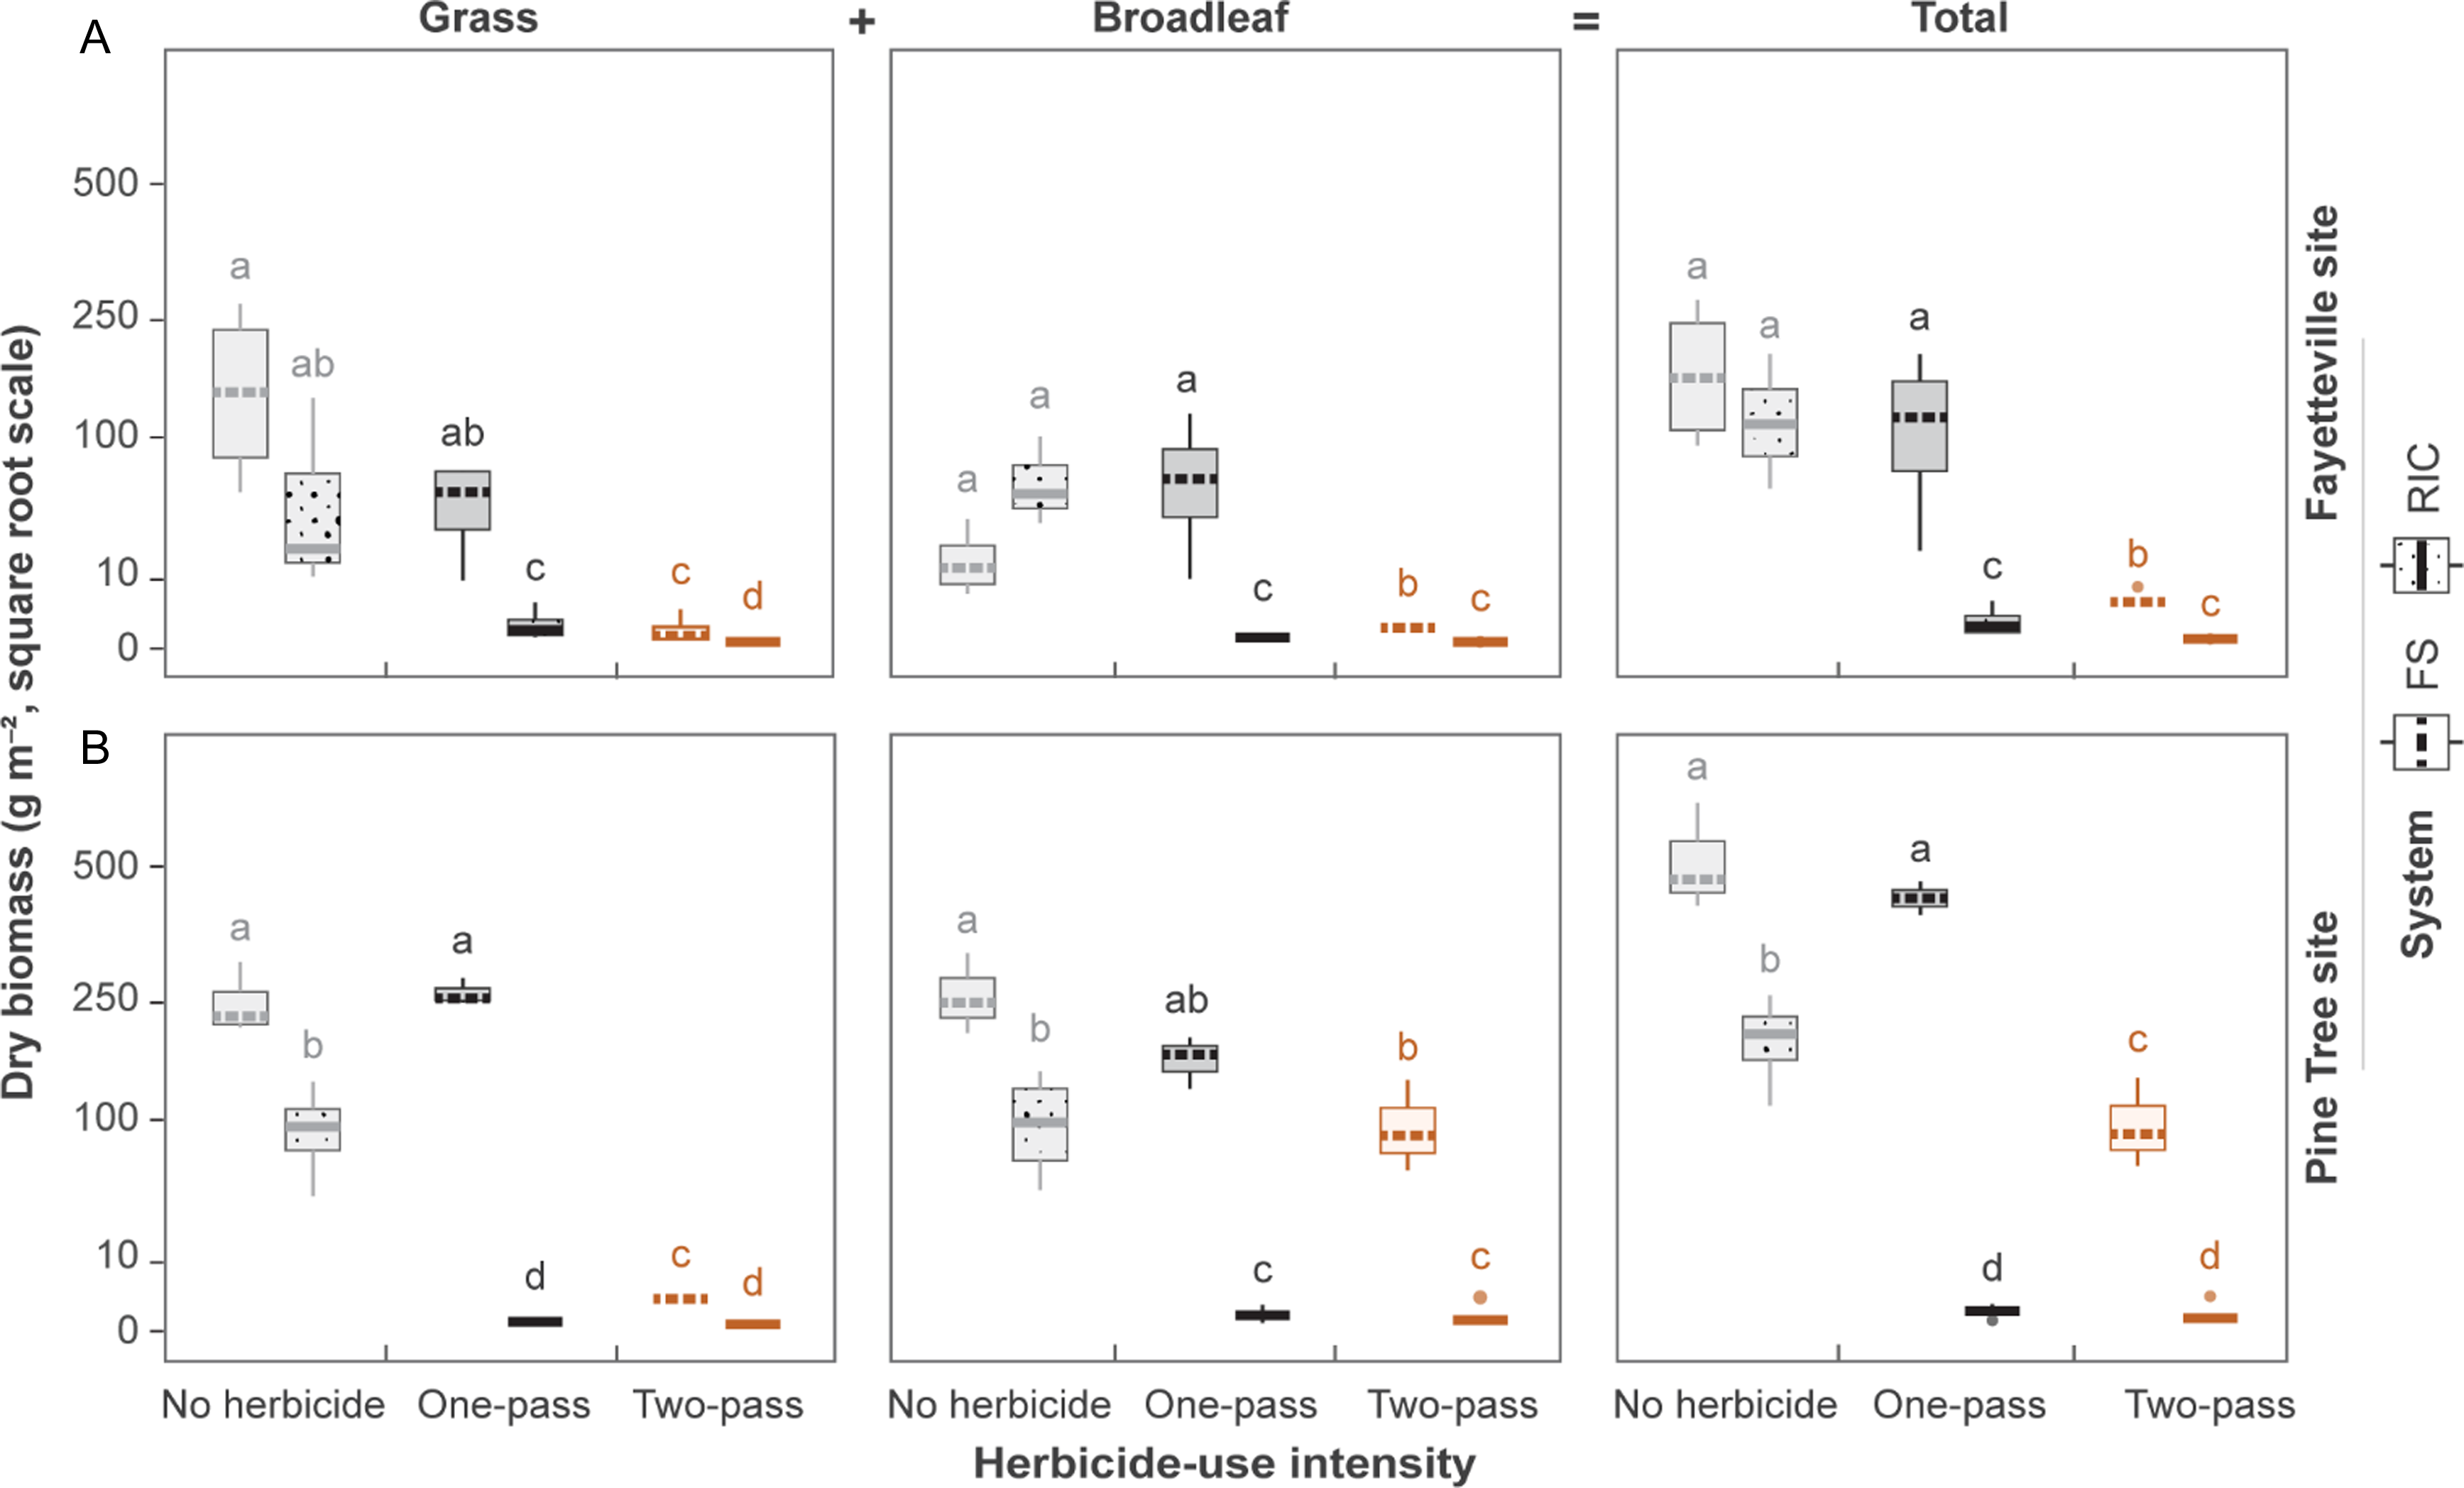
Weed biomass exhibited strong main and interactive effects of cropping system and herbicide regime at both locations (all P < 0.001). At Fayetteville, RIC reduced grass biomass under herbicide-treated conditions (Figure 3A). In the absence of herbicide, grass biomass ranged from 162 g m−2 to 60 g m−2, with no difference between systems (P > 0.05). Under a one-pass program, FS grass biomass declined to 50 g m−2, whereas RIC biomass declined to 1.6 g m−2 (P < 0.001). Under the two-pass regime, biomass was low in both systems, but RIC reduced biomass to <1% of FS levels (0.01 g m−2 vs. 1.1 g m−2; P < 0.05). Broadleaf biomass followed similar patterns, yielding total biomass trends that mirrored these system-level contrasts. At Pine Tree, RIC produced lower biomass across weed groups and herbicide-use intensities than FS (all P < 0.005; Figure 3B).
Boxplots of weed biomass (in grams per square meter; g m−2) for grass, broadleaf, and total weed groups under different cropping systems and herbicide-use intensities at (A) the Fayetteville site and (B) the Pine Tree site. Letters above boxes indicate Tukey-adjusted significance groups (α = 0.05) derived from bootstrapped estimated marginal means.

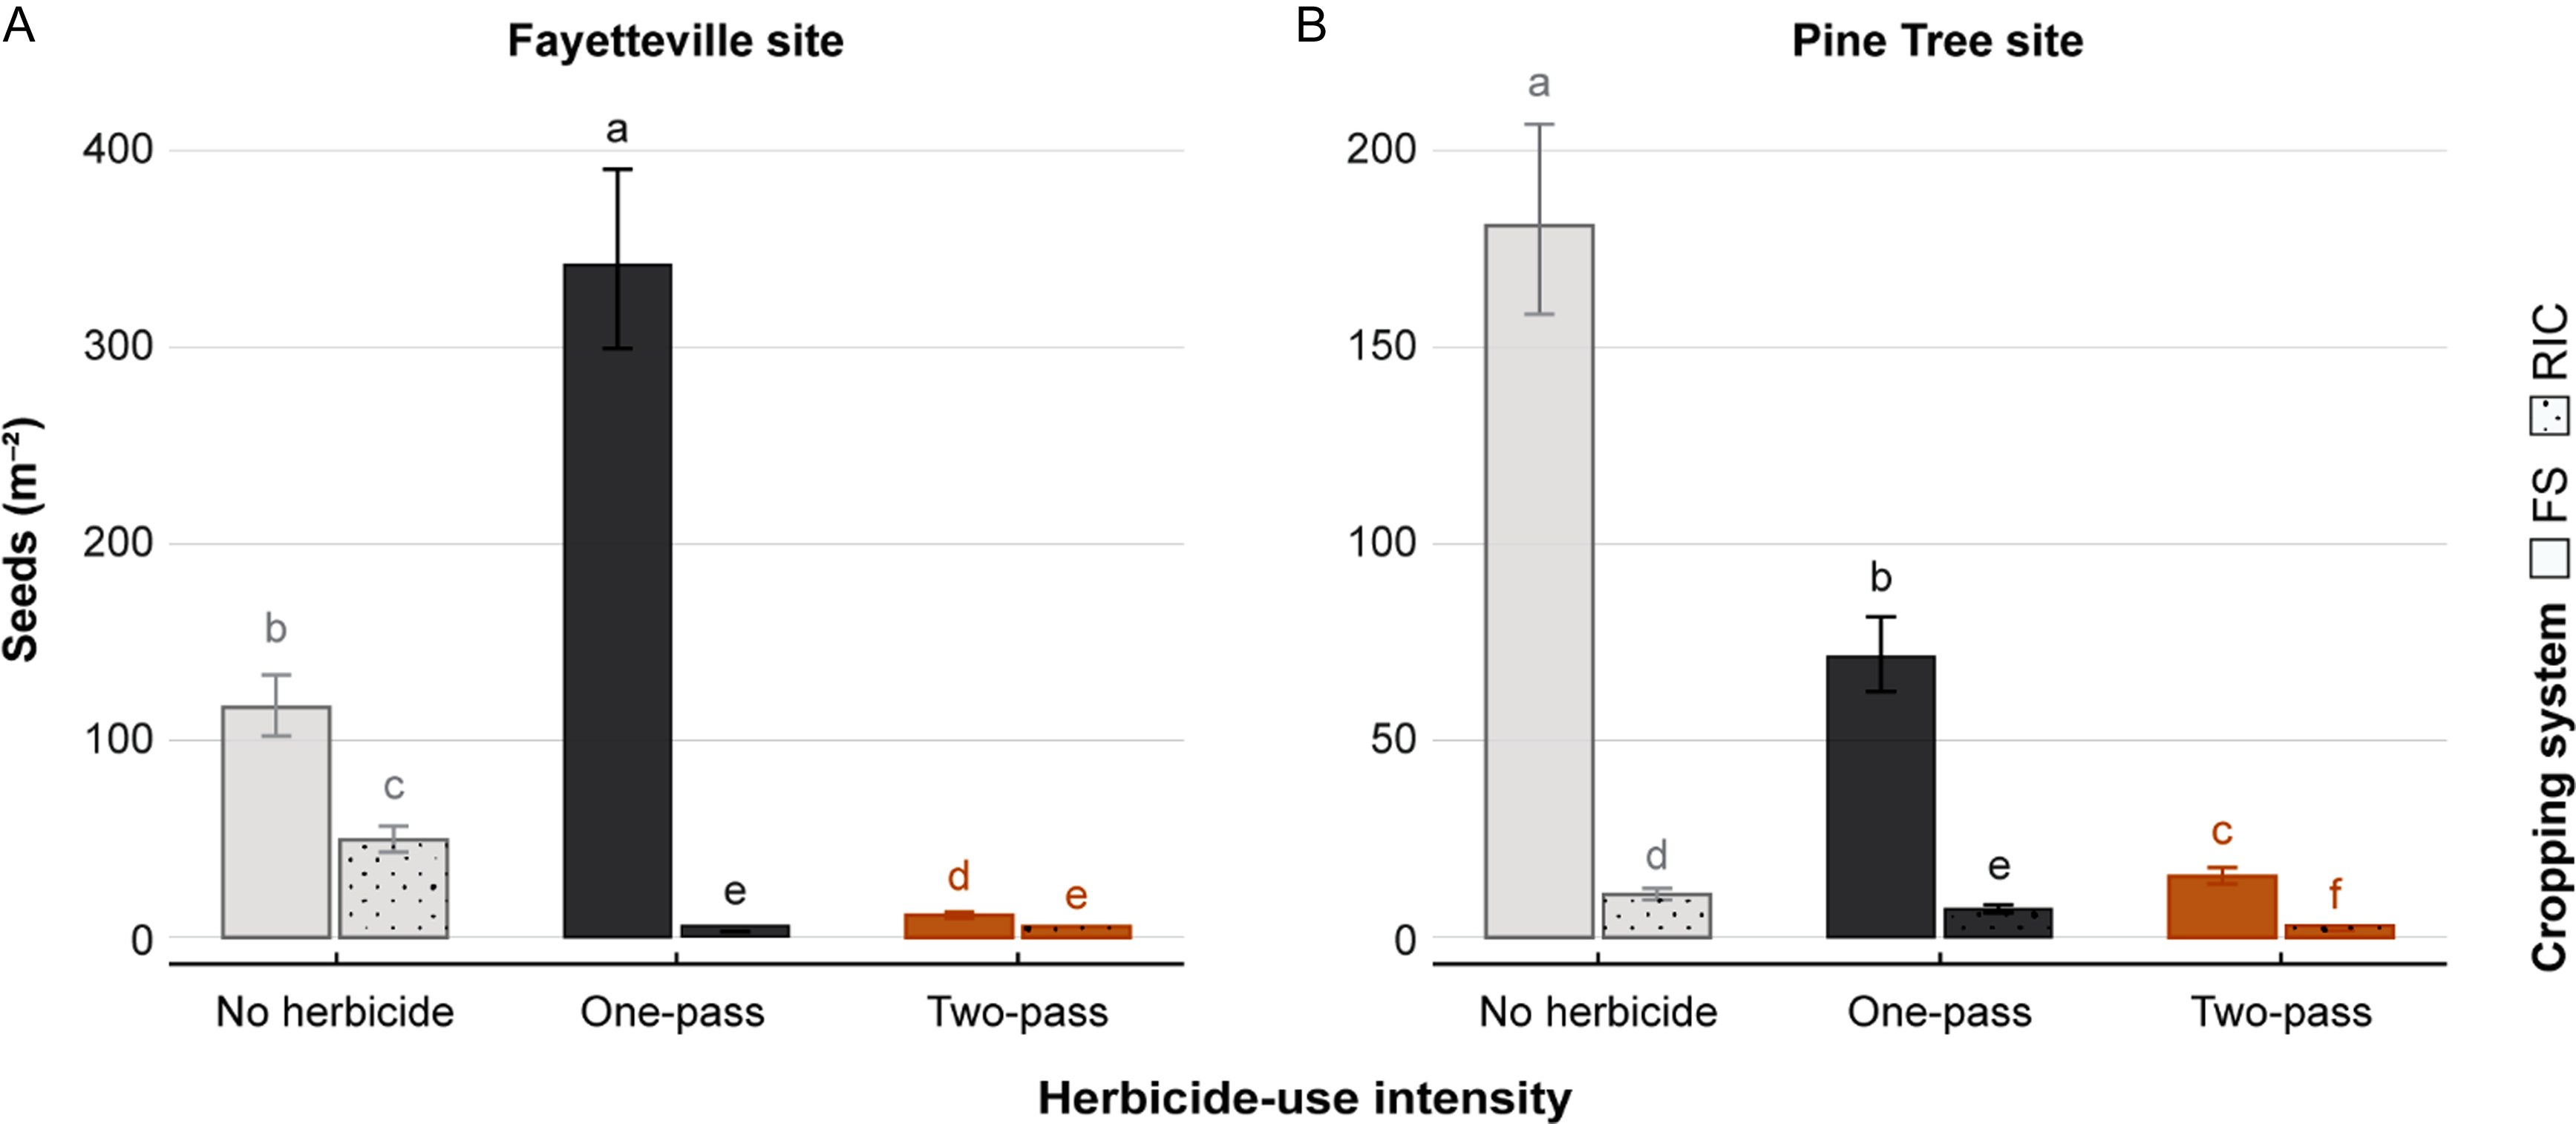
Palmer amaranth seed production also showed strong main and interactive effects of cropping system and herbicide intensity at both locations (all P < 0.001). At Fayetteville, RIC reduced seed output by >90% relative to FS across herbicide regimes (Figure 4A). Seed production was slightly higher under the one-pass regime than under no herbicide, which may reflect altered competitive structure (e.g., reduced intraspecific crowding following partial chemical suppression). When no herbicide was applied, Palmer amaranth in FS plots produced approximately 120 seeds m−2, whereas RIC produced 51 seeds m−2 (P < 0.001). With the one-pass program, FS seed rain increased to 337 seeds m−2, whereas RIC declined to 2 seeds m−2 (P < 0.001). In the two-pass regime, both systems approached near-complete suppression, although RIC remained slightly lower (4 seeds vs. 8 seeds m−2; P = 0.03). At Pine Tree, the FS-RIC contrasts were similar (Figure 4B). Unlike Fayetteville, Pine Tree followed the expected intensity gradient, with seed output declining from no herbicide to one-pass to two-pass. Across intensities, FS plots produced >90% more seed than RIC, reinforcing the suppressive advantage of relay intercropping.
Estimated marginal means of seed production (seeds per square meter) by female Palmer amaranth plants under different cropping systems and herbicide-use intensities at (A) the Fayetteville site and (B) the Pine Tree site. Error bars represent 95% confidence intervals. Letters above bars denote Tukey-adjusted significance groups (α = 0.05) within each site.

Reduced reproductive output directly limits seedbank replenishment and persistence of resistant genotypes (Bagavathiannan and Norsworthy Reference Bagavathiannan and Norsworthy2012; Neve et al. Reference Neve, Norsworthy, Smith and Zelaya2011) and is consistent with foundational models of weed population ecology (Cousens and Mortimer Reference Cousens and Mortimer1995). Although individual Palmer amaranth plants can produce >500,000 seeds (Jha and Norsworthy Reference Jha and Norsworthy2009), seedbanks decline rapidly when seed return is curtailed; viability can drop to approximately 4% to 5% after 36 mo on the soil surface (Jha et al. Reference Jha, Norsworthy and Garcia2014; Korres et al. Reference Korres, Norsworthy, Young, Reynolds, Johnson, Conley, Smeda, Mueller, Spaunhorst, Gage, Loux, Kruger and Bagavathiannan2018). By reducing fecundity by >90%, RIC shifts the population balance from replacement toward decline, lowering the effective population size and the substrate for resistance evolution (Délye et al. Reference Délye, Jasieniuk and Le Corre2013; Neve and Powles Reference Neve and Powles2005). This logic is supported by modeling studies showing that reducing seed rain delays resistance evolution (Norsworthy et al. Reference Norsworthy, Ward, Shaw, Llewellyn, Nichols, Webster, Bradley, Frisvold, Powles, Burgos, Witt and Barrett2012; Somerville et al. Reference Somerville, Powles, Walsh and Renton2018). Because population dynamics compound over years, even modest reductions in seed rain can drive multiyear declines and reduce selection pressure (Bagavathiannan and Norsworthy Reference Bagavathiannan and Norsworthy2012). In practical terms, the fewer plants reach reproductive maturity, the fewer resistant seeds enter the seedbank, and subsequent herbicide applications encounter smaller, less resilient populations, compared with systems that lack seed rain reduction.
Ground Cover
Ground cover trajectories differed consistently between FS and RIC across herbicide input levels. Beta-GAMs fit both visual ratings and estimates derived from a UAV well (P < 0.001; 97% deviance explained). Time-by-treatment smooths were strongly significant for FS (all P < 0.001) but were weak or nonsignificant for RIC (P = 0.045 to 0.898), indicating greater temporal fluctuation in FS and comparatively stable canopy trajectories in RIC.
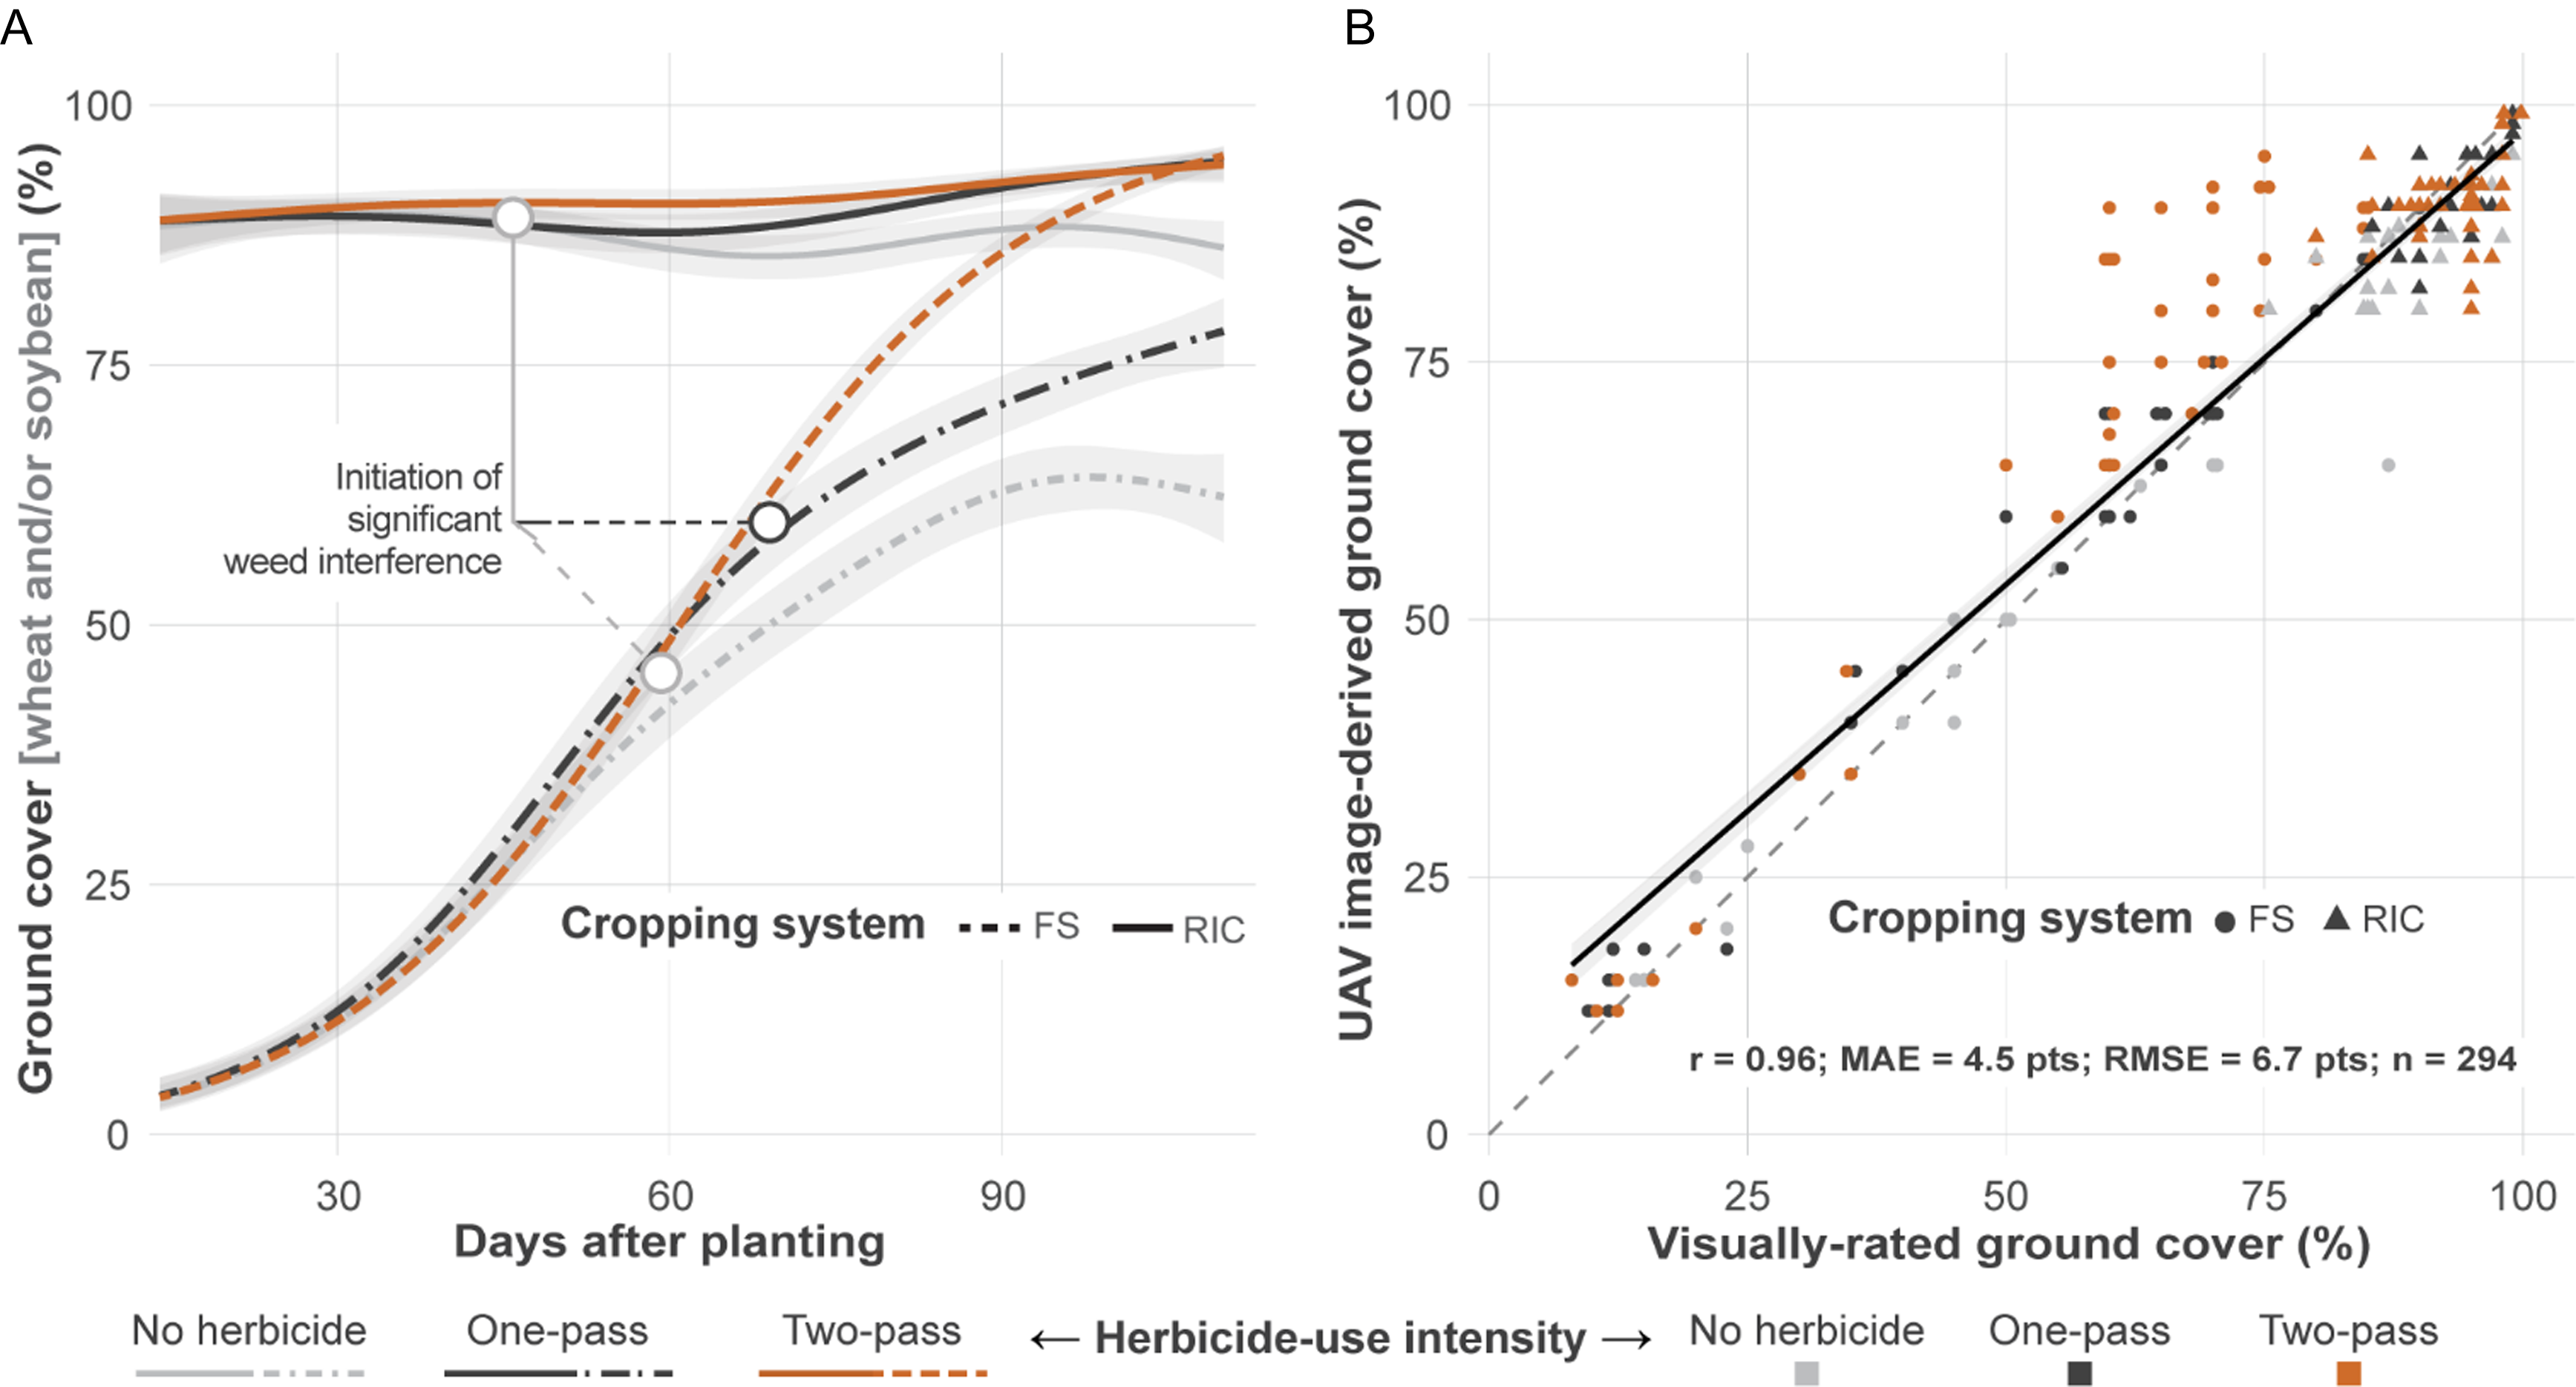
Predictions derived from a UAV averaged across locations (Figure 5A) showed that the advantage of RIC was large and expressed early. By 28 DAP, RIC achieved approximately 89% to 90% cover across herbicide-use intensities, whereas FS remained near 10% to 11%. By 56 DAP, RIC sustained 88% to 91% cover while FS increased only to 38% to 44%. Peak cover followed the same pattern. When no herbicide was applied, FS peaked late (98 DAP) at 64% cover, whereas RIC peaked early (33 DAP) at 90%. With the one-pass regime, FS peaked at 110 DAP with 78% cover, while RIC reached 94.6%. In the two-pass regime, both systems approached canopy closure (FS 95%, RIC 94%), although RIC maintained higher cover during early and midseason intervals.
Ground cover dynamics and method concordance. (A) unpiloted aerial vehicle (UAV) image-derived beta-distributed generalized additive models (beta-GAMs) smooths of ground cover (%) over days after soybean planting, stratified by cropping system and herbicide-use intensity. Neutral 95% confidence ribbons are shown. B: Scatterplot comparing UAV image-derived and visual ground cover estimates. The dashed line indicates a 1:1 reference; the solid line is a fitted regression. Annotated metrics include Pearson correlation (r), mean absolute error (MAE), root mean square error (RMSE), and sample size (n).

Within each system, the DAP at which herbicide-intensity curves began to separate indicated the onset of measurable weed interference. In FS, the no-herbicide and one-pass curves diverged from the two-pass curve near 59 DAP and 65 DAP, respectively, consistent with loss of canopy momentum as weeds accumulated (Figure 5A). In RIC, divergence under no herbicide occurred earlier (approximately 47 DAP) but remained modest, indicating relatively limited interference under wheat residue and overlapping canopies. Although the precise timing of divergence will vary with seedbank density and early emergence conditions, the consistent direction across herbicide-use intensities indicates that RIC suppresses the buildup of interference pressure and stabilizes canopy development across environments.
UAV and visual methods were strongly correlated (r = 0.95), with UAV images providing finer temporal resolution (Figure 5B). Beta-GAMs fit to visual ratings produced trends that were similar to UAV-based estimates (data not shown).
These canopy dynamics reflect core principles of plant interference and light competition (Harper Reference Harper1977; Swanton and Weise Reference Swanton and Weise1991): early canopy closure creates competitive asymmetry by limiting light availability for emerging weeds, while sustained midseason and late-season cover maintains shading through the critical period of crop-weed competition. This ecological layer complements chemical control and contributes to system-level buffering within IWM (Mortensen et al. Reference Mortensen, Egan, Maxwell, Ryan and Smith2012). Beyond weed suppression, cross-system differences near 60% cover are agronomically meaningful; field studies report approximately 98% reduction in wind erosion and 60% to 85% reductions in runoff and sediment loss at approximately 60% surface coverage, suggesting that the canopy dynamics driving weed suppression under RIC also confer soil conservation benefits (Fryrear Reference Fryrear1985; Hagen Reference Hagen1996; Kaspar et al. Reference Kaspar, Radke and Laflen2001; Lal et al. Reference Lal, Regnier, Eckert, Edwards and Hammond1991).
System Yield and Economics
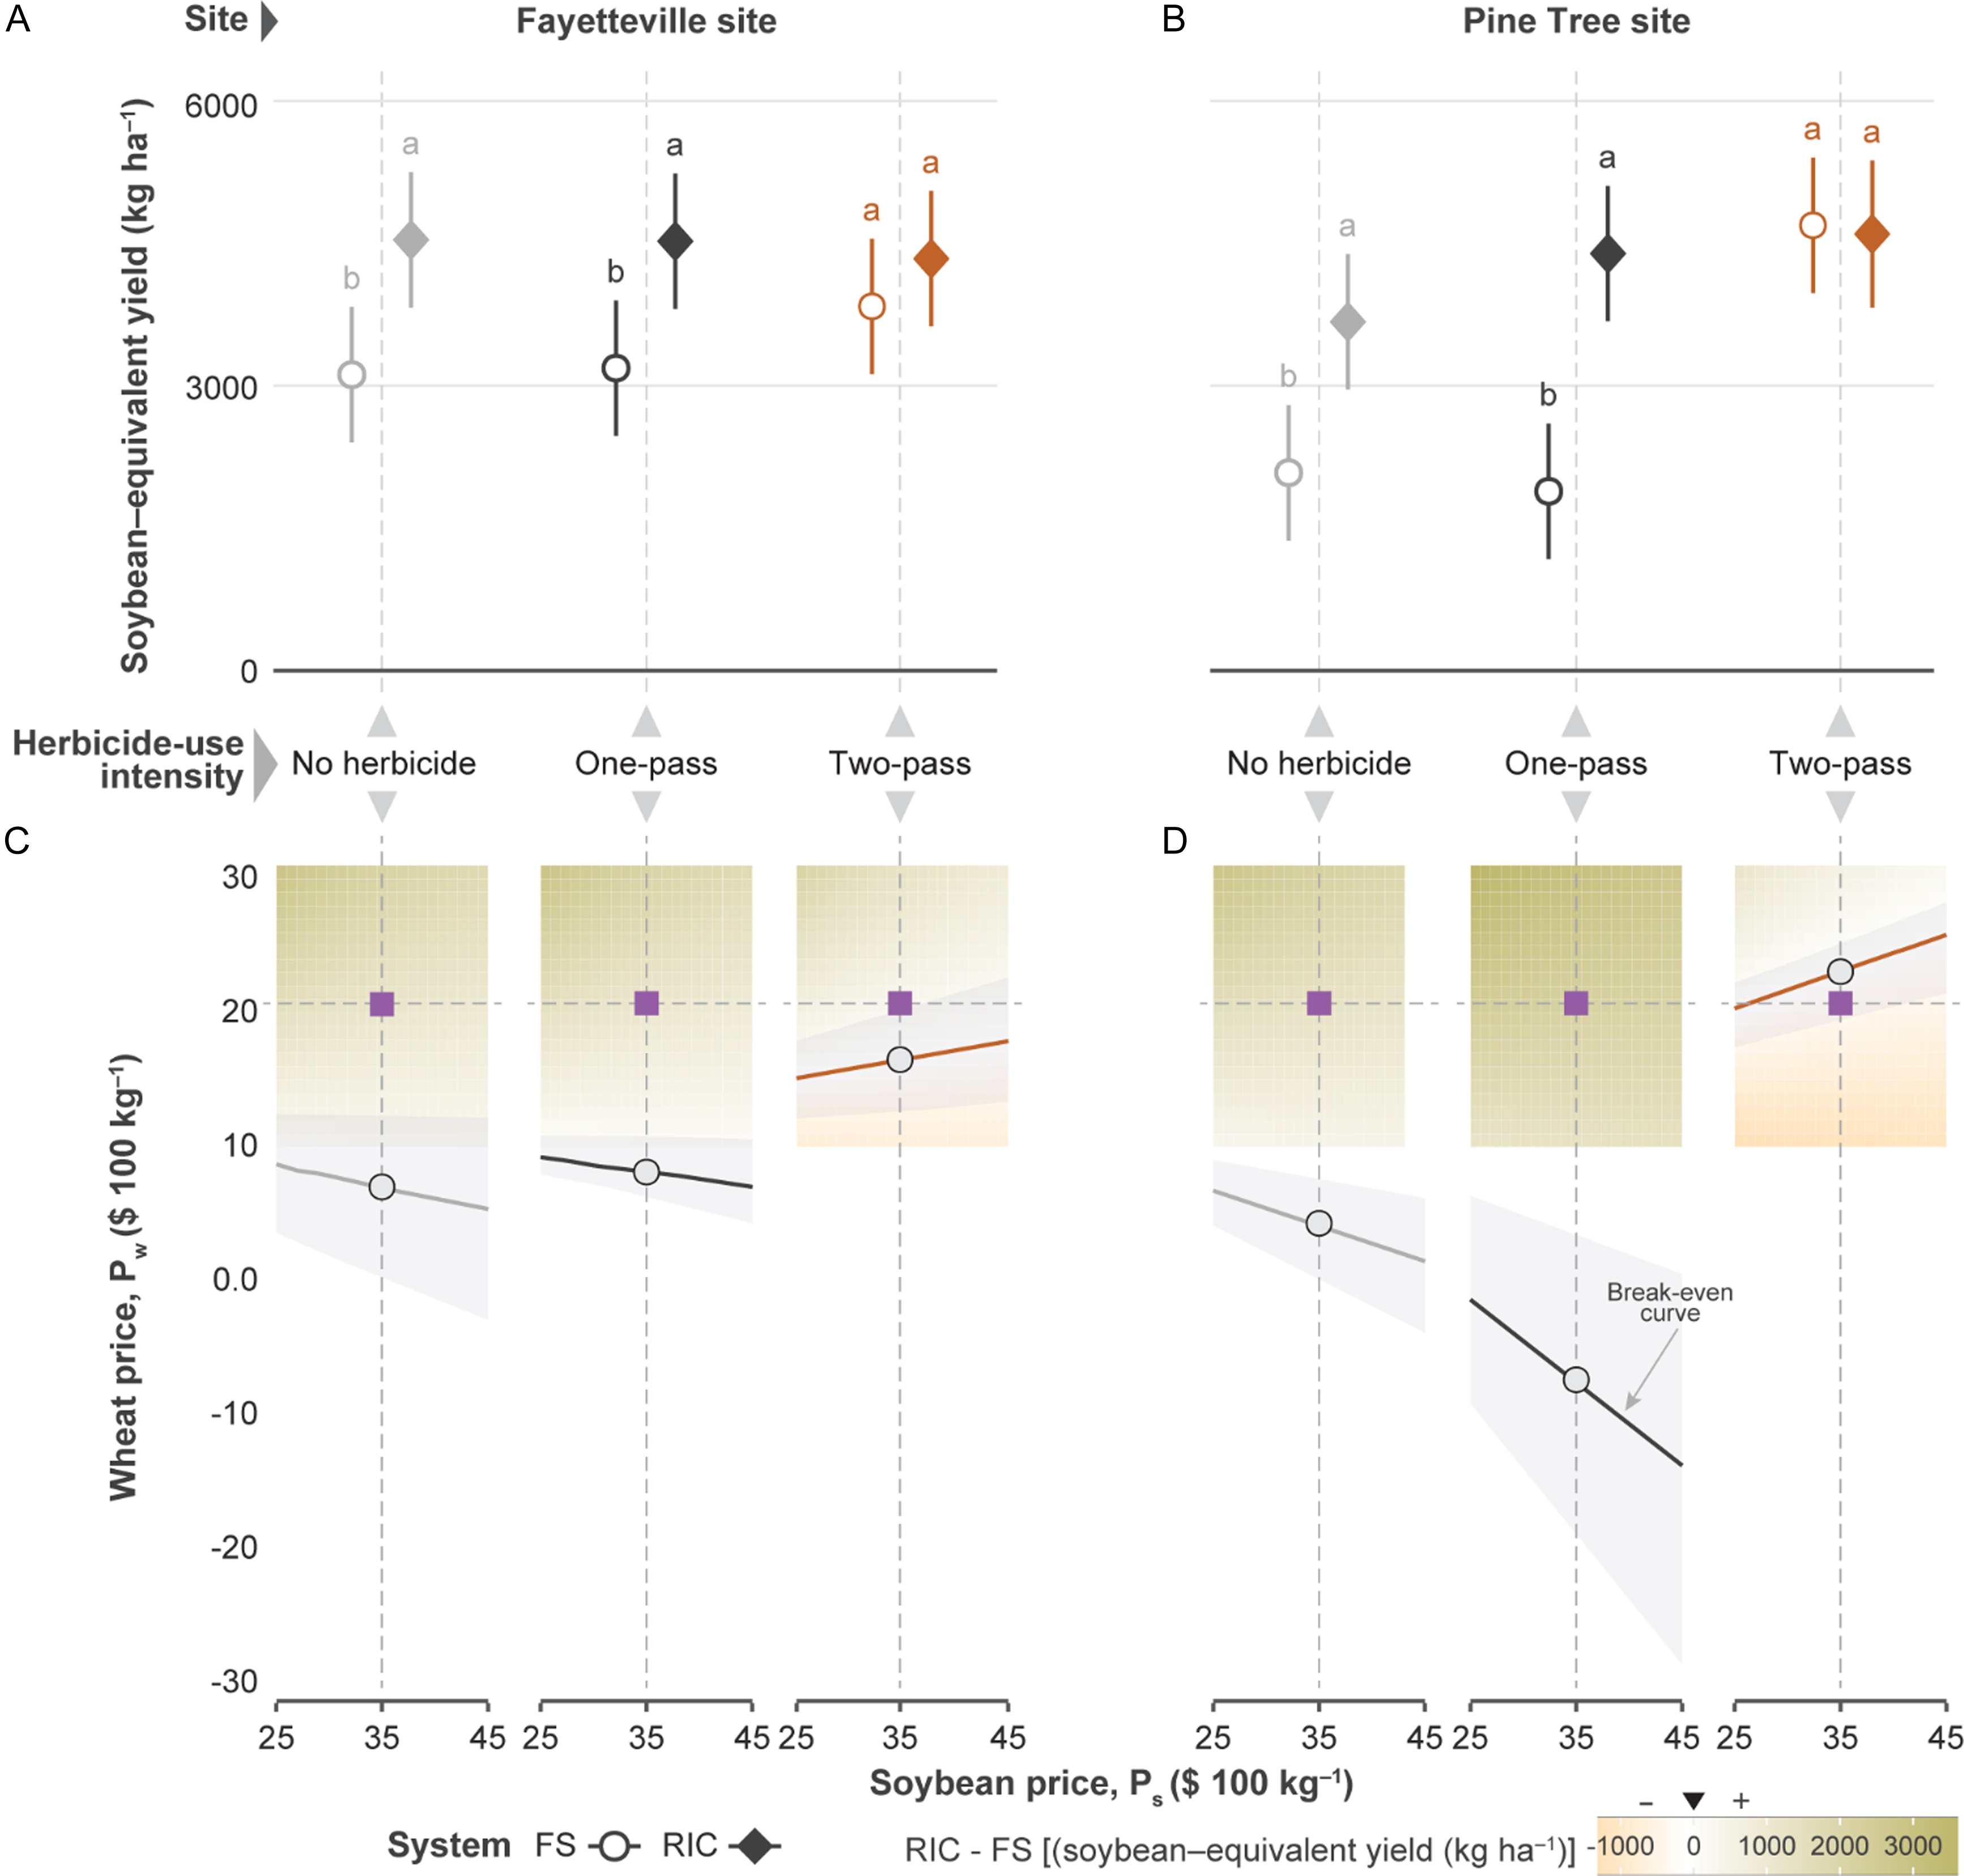
Soybean-equivalent yield responded strongly to cropping system, herbicide intensity, and location, with significant main effects and interactions (all P < 0.001). At Fayetteville, RIC out-yielded FS under reduced herbicide inputs: under no herbicide, adjusted means were 4,442 vs. 3,107 kg ha−1 (Δ = +1,335; SE = 36; P < 0.001), and under one-pass, 4,439 vs. 3,176 kg ha−1 (Δ = +1,263; SE = 361; P = 0.002; Figure 6A). Under the two-pass regime, yields were statistically similar (3,826–4,260 kg ha−1; P = 0.24). At Pine Tree, the pattern mirrored Fayetteville: no herbicide, 3,568 vs. 2,084 kg ha−1 (Δ = +1,484; SE = 361; P < 0.001); one-pass, 4,274 vs. 1,888 kg ha−1 (Δ = +2,385; SE = 361; P < 0.001); and two-pass, 4,492–4,690 kg ha−1 (P = 0.62; Figure 6B).
Soybean-equivalent yield and economic viability of relay intercropping (RIC). A and B: Estimated marginal means of soybean-equivalent yield (Equation 1) for full-season (FS) and RIC systems, stratified by herbicide-use intensity for the Fayetteville site and the Pine Tree site, respectively. Letters denote Tukey-adjusted significance groups (α = 0.05) within each stratum. C and D: Economic viability surface (Equation 2) showing differential yield (Δ = RIC − FS) across a continuous grid of wheat (P w ) and soybean (P s ) prices for the Fayetteville and Pine Tree sites, respectively. Heatmap regions indicate net advantage (Δ > 0) or disadvantage (Δ < 0) for RIC. Overlaid contour line marks Δ = 0; shaded band represents bootstrap-derived 95% break-even envelope. Dashed lines indicate current Pw and Ps values. Soybean-equivalent yield represents the combined economic value of soybean and wheat outputs in the RIC system, expressed as an equivalent soybean yield based on prevailing crop prices and incremental wheat production costs.

Figure 6 Long description
Panel A: A scatter plot shows the estimated marginal means of soybean-equivalent yield for full-season and relay intercropping systems at the Fayetteville site, stratified by herbicide-use intensity. The y-axis represents soybean-equivalent yield in kilograms per hectare, and the x-axis shows herbicide-use intensity categories: no herbicide, one-pass, and two-pass. Letters denote Tukey-adjusted significance groups within each stratum. Panel B: A similar scatter plot for the Pine Tree site follows the same structure as Panel A. Panel C: A heatmap with overlaid contour lines represents the economic viability surface for the Fayetteville site, showing differential yield across a grid of wheat and soybean prices. The y-axis represents wheat price in dollars per 100 kilograms, and the x-axis represents soybean price in dollars per 100 kilograms. Heatmap regions indicate net advantage or disadvantage for relay intercropping, with a shaded band representing the bootstrap-derived 95% break-even envelope. Panel D: A similar heatmap for the Pine Tree site follows the same structure as Panel C.
With RIC, wheat captures early season radiation and soil moisture that would otherwise support weed recruitment, while soybean exploits residual resources following wheat harvest, a stratified resource use that is consistent with land equivalent ratios exceeding 1.2 in cereal-legume systems (Donald Reference Donald1968; Lithourgidis et al. Reference Lithourgidis, Dordas, Damalas and Vlachostergios2011; Nelson Reference Nelson2010; Willey Reference Willey1979). This coordination enhances resource-use efficiency and stabilizes productivity across herbicide regimes, positioning RIC as a buffering mechanism rather than a direct substitute for FS. Multifunctional cropping systems can similarly balance productivity and environmental health (Smith et al. Reference Smith, Barbercheck, Mortensen, Hyde and Kiernan2020). In this framing, RIC makes ecological resilience operational (Holling Reference Holling1973; Walker et al. Reference Walker, Holling, Carpenter and Kinzig2004) by translating early season canopy advantages into yield stability under variable weed pressure and input performance (Mortensen et al. Reference Mortensen, Egan, Maxwell, Ryan and Smith2012; Teasdale Reference Teasdale1998).
Under the current price-cost scenario (P s = 0.35; P w = 0.20; C w = US$400 ha−1), RIC outperformed FS across regimes, with the greatest advantage under low-input programs where FS was most vulnerable to weed interference (Figure 6C and D). Across the full price grid, mean change was largest when no herbicide was applied (Fayetteville: 1,337 kg ha−1 [276–2,980]; Pine Tree: 1,483 kg ha−1 [470–2,968], with 100% of grid points favoring RIC), followed by one-pass (Fayetteville: 1,266 kg ha−1 [179–2,992]; Pine Tree: 2,383 kg ha−1 [1,403–3,762], 100% positive). Under the two-pass regime, cropping system yield at Fayetteville site retained a modest advantage (mean Δ = 437 kg ha−1, 69% positive), whereas the Pine Tree site showed a negative mean (–199 kg ha−1, only 38% positive), indicating that as herbicide intensity increases and FS maintains weed-free canopies, the marginal economic value of ecological buffering under RIC diminishes and can trend negative.
Break-even slopes were near zero when no herbicide was applied (P w ≈ $0.10 to $0.12 kg−1) and slightly negative under the one-pass regime (P w ≈ $0.13 to $0.15 kg−1), indicating that economic advantage of RIC over FS was largely insensitive to the wheat-to-soybean price ratio when FS was most exposed to weed pressure. Under the two-pass scenario, the break-even relationship exhibited positive slopes (+0.138 at Fayetteville; +0.274 at Pine Tree), indicating that as soybean price increases, wheat price must rise disproportionately for RIC to offset the baseline yield advantage under strong herbicide performance. For example, at P s = $0.25 kg−1, break-even P w was ∼$0.17 kg−1, whereas at P s = $0.45 kg−1 would be needed to exceed $0.20 kg−1.
Collectively, these results position RIC as a resilience-enhancing strategy rather than a universal replacement for intensive herbicide programs. When herbicide performance is uncertain or fails, ecological buffering in RIC translates into economic gains across broad price conditions; when herbicides succeed and FS maintains weed-free canopies, the incremental value of buffering declines, and adoption becomes favorable primarily when wheat markets are strong and soybean prices are not exceptionally high. This interpretation aligns with agricultural risk theory, in which expected utility depends on both mean return and variance (Hardaker et al. Reference Hardaker, Huirne, Anderson and Lien2004; Heady Reference Heady1952), and diversification functions as a hedge against systemic shocks. In practice, RIC behaves as a low-volatility component within prevailing high-input systems—neutral in favorable years and protective in unfavorable ones—reflecting the asymmetry central to resilient system design (Holling Reference Holling1973; Walker et al. Reference Walker, Holling, Carpenter and Kinzig2004).
Beyond immediate suppression, reduced seed rain under RIC interacts with seedbank attrition to generate increasing benefits over time. While a two-pass program tested in this study was less intensive than conventional mid-South soybean programs that layer residuals and multiple postemergence applications, RIC substantially narrowed this gap. The ability of RIC to maintain high suppression under one-pass programs is especially relevant because it suggests that ecological intensification can partially substitute for chemical intensification without sacrificing agronomic standards. By curtailing seed rain, RIC also reduces the population exposed to herbicide selection, which can slow resistance evolution. However, pollen-mediated gene flow can move resistance alleles across field scales in dioecious species such as Palmer amaranth, reinforcing the need for regional coordination (Jhala et al. Reference Jhala, Norsworthy, Ganie, Sosnoskie, Beckie, Mallory-Smith, Liu, Wei, Wang and Stoltenberg2021; Sosnoskie et al. Reference Sosnoskie, Webster, Kichler, MacRae, Grey and Culpepper2012).
Wheat-soybean RIC consistently improved weed suppression and buffered yield and profitability relative to FS across herbicide regimes. Within the IWM literature, row narrowing, early planting, and rapid canopy formation repeatedly shorten the critical period of competition; RIC expresses these principles at the system level by coordinating crop phenology to achieve earlier and more persistent cover (Arsenijevic et al. Reference Arsenijevic, DeWerff, Conley, Ruark and Werle2022; Klingaman and Oliver Reference Klingaman and Oliver1994; Knezevic et al. Reference Knezevic, Evans and Mainz2003). This pattern aligns with a central IWM premise: durable control emerges when multiple, partially redundant components contribute to suppression rather than relying on a single tactic (Swanton and Weise Reference Swanton and Weise1991). In this study, sustained ground cover under RIC reduced emergence and fecundity through shading and resource competition, while economic performance improved when herbicide input was reduced and remained neutral under the two-pass program, thereby lowering return volatility.
Reduced seed output under RIC also strengthens IWM by lowering seedbank replenishment and reducing the effective population size exposed to herbicide selection (Bagavathiannan and Norsworthy Reference Bagavathiannan and Norsworthy2012; Délye et al. Reference Délye, Jasieniuk and Le Corre2013). Relay intercropping is therefore best viewed as a complement to chemical control that links efficiency-oriented production goals (Cassman Reference Cassman1999; Donald Reference Donald1968) with the resilience required for sustainable intensification (Bommarco et al. Reference Bommarco, Kleijn and Potts2013; Tilman et al. Reference Tilman, Balzer, Hill and Befort2011). Because it can be implemented with existing operations, RIC may be a practical IWM component in regions facing elevated resistance risk or rising input costs. The Arkansas results suggest potential value beyond the mid-South; future research should test system performance in more northern environments where shorter growing seasons currently constraints double-cropping. If validated, RIC could function as a latitude-flexible alternative to FS and double-crossing by combining season extension with weed suppression. Adoption barriers remain likely, however, because reluctance to implement nonchemical IWM is often driven by perceived risk and knowledge gaps (Liebman et al. Reference Liebman, Baraibar, Buckley, Childs, Christensen, Cousens, Eizenberg, Heijting, Loddo, Morotto, Renton and Riemens2016; Moss Reference Moss2019). Multistate research and extension efforts are warranted to evaluate robustness across environments and to develop adoption pathways (e.g., planter retrofits, decision tools, and risk-sharing incentives) that reduce operational and financial barriers to RIC.
Practical Implications
Wheat-soybean RIC offers soybean growers in Arkansas and similar mid-South environments a practical cultural tactic to strengthen weed management while reducing reliance on herbicides and stabilizing returns. Interseeding soybean into standing wheat using skip-row configurations and standard seeding rates can establish early season ground cover approaching 90%. This early cover suppresses Palmer amaranth and other problem weeds through shading and resource competition and can provide weed control comparable to intensive two-pass programs in full-season soybean with fewer herbicide inputs. Across sites and herbicide regimes, RIC reduced weed biomass and seed production, often by >90%, thereby limiting seedbank replenishment and the pool exposed to selection for resistance. Soybean-equivalent yields were maintained or increased, and profitability improved most under reduced-input programs or when herbicide performance was uncertain. RIC can be implemented with minimal changes to field operations and thus represent a complementary and relatively easily attainable component of integrated weed management in wheat-soybean systems. Future RC evaluation in more northern environments may further increase its value where shorter growing seasons constrain traditional double-cropping as latitude increases.
Acknowledgments
We thank Jared Smith for his exceptional effort in collecting intensive high-quality data for this study. We are also grateful to the Pine Tree Research Station personnel and the Milo J. Shult Agricultural Research and Extension Center team for facilitating this research.
Funding
Partial financial support for these studies was provided by Arkansas Soybean Promotion Board.
Competing Interests
The authors declare they have no competing interests.

 Open access

