


Introduction
Infection dynamics in wild animal populations are shaped by variation in the environment, which influences exposure and transmission, and variation in host physiology, which influences susceptibility and resistance (Stromberg, Reference Stromberg1997; Acevedo-Whitehouse and Duffus, Reference Acevedo-Whitehouse and Duffus2009; Cardon et al., Reference Cardon, Loot, Grenouillet and Blanchet2011; Hawley and Altizer, Reference Hawley and Altizer2011). Environmental influences incorporate short-term dynamic variation (e.g. seasonal and annual variation) and longer-term repeatable differences among hosts (e.g. influenced by host genotype or early-life environment; Smith et al., Reference Smith, Wilson, Pilkington and Pemberton1999; Altizer et al., Reference Altizer, Dobson, Hosseini, Hudson, Pascual and Rohani2006; Hayward et al., Reference Hayward, Pilkington, Pemberton and Kruuk2010). Wild populations are typically infected with diverse parasites, each potentially showing varying sensitivity to environmental pressures due to differences in their life cycles and vulnerability to different types of host immune response (Petney and Andrews, Reference Petney and Andrews1998; Cox, Reference Cox2001; Pedersen and Fenton, Reference Pedersen and Fenton2007). Parasite burdens also vary with host age and sex (i.e. demographic group), and the exposure and susceptibility of these different host groups may respond in different ways to variation in the environment (Zuk and McKean, Reference Zuk and McKean1996; Hayward et al., Reference Hayward, Wilson, Pilkington, Pemberton and Kruuk2009). Non-invasive, longitudinal studies of well-understood wild populations which monitor important parasite taxa repeatedly in individuals from different demographic groups (Clutton-Brock and Sheldon, Reference Clutton-Brock and Sheldon2010) can complement other important lines of evidence to better understand the complex parasite dynamics of natural systems.
Within-year variation in parasite dynamics of wild vertebrates depends on parasite and host population characteristics (Nelson and Demas, Reference Nelson and Demas1996; Altizer et al., Reference Altizer, Dobson, Hosseini, Hudson, Pascual and Rohani2006; Martin et al., Reference Martin, Weil and Nelson2008; Albery et al., Reference Albery, Kenyon, Morris, Morris, Nussey and Pemberton2018). Seasonal fluctuations in weather and resource availability can act directly on parasites and their vectors, for instance by influencing survival of vectors or environmental stages of parasites, limiting or enhancing exposure (Altizer et al., Reference Altizer, Dobson, Hosseini, Hudson, Pascual and Rohani2006). In seasonal breeders, the arrival of large numbers of highly susceptible, immunologically naïve juveniles into the population at a certain point in the year may also increase transmission and exposure across the population (Wilson et al., Reference Wilson, Grenfell, Pilkington, Boyd, Gulland, Clutton Brock and Pemberton2004). Environmental variation in a population can also impact the physiological state of hosts to impact their exposure, susceptibility and resistance to parasites. For example, reduced food availability in winter reduces the nutritional resources available to hosts, which is expected to reduce investment in immunity (Nelson and Demas, Reference Nelson and Demas1996; Zuk and Stoehr, Reference Zuk and Stoehr2002; Martin et al., Reference Martin, Weil and Nelson2008). Furthermore, host immunity can fluctuate within the year due to temporal variation in nutritional demands and constraints associated with growth and reproduction (Nelson and Demas, Reference Nelson and Demas1996; Martin et al., Reference Martin, Weil and Nelson2008). Reproductive costs can be sex-specific, particularly in polygynous species including several mammals (Zuk and McKean, Reference Zuk and McKean1996; Moore and Wilson, Reference Moore and Wilson2002). In such systems, males tend to have higher parasite burdens compared to females, and this is ascribed to the high costs of intrasexual competition for mates limiting investment in immunity in males (Zuk and McKean, Reference Zuk and McKean1996; Muehlenbein and Bribiescas, Reference Muehlenbein and Bribiescas2005; Ezenwa et al., Reference Ezenwa, Stefan Ekernas and Creel2012). However, there is also evidence that seasonal female investment in reproduction has costs which impact immunity and parasite burden (Zuk and McKean, Reference Zuk and McKean1996; Metcalf and Graham, Reference Metcalf and Graham2018). Female mammals often show a peak in infections around birth (the so-called peri-parturient relaxation of immunity, PPRI) that is ascribed to reduced investment in immunity during late gestation and early lactation (Brunsdon, Reference Brunsdon1970; Houdijk et al., Reference Houdijk, Jessop and Kyriazakis2001; Ayalew and Gibbs, Reference Ayalew and Gibbs2005; Houdijk, Reference Houdijk2008). Thus, it is well-established that age and sex can impact parasite dynamics across wild and managed vertebrate systems in a season-dependent manner. However, whether longitudinal dynamics of multiple parasites present in the same host population is shaped by similar factors, and whether these parasites interact, is less clear.
When multiple parasites are endemic in a population, as is the norm in unmanaged systems, fluctuations across seasons and demographic groups may vary among co-infecting parasite species. The way the environment affects parasites with different transmission or life cycles may underlie this variation (Cable et al., Reference Cable, Barber, Boag, Ellison, Morgan, Murray, Pascoe, Sait, Wilson and Booth2017; Albery et al., Reference Albery, Kenyon, Morris, Morris, Nussey and Pemberton2018). Even among environmentally transmitted parasites inhabiting the same site within the host, differences in burdes among demographic groups and seasons can be observed. For example, gastrointestinal (GI) strongyle parasite burden in domestic and wild sheep are observed to peak around the breeding season in adult females (via PPRI), but a peak is observed later in summer and autumn in lambs (Vlassoff et al., Reference Vlassoff, Leathwick and Heath2001; Wilson et al., Reference Wilson, Grenfell, Pilkington, Boyd, Gulland, Clutton Brock and Pemberton2004; Hamer et al., Reference Hamer, McIntyre, Morrison, Jennings, Kelly, Leeson, Bartley, Chaudhry, Busin and Sargison2019). In contrast, parasitic GI apicomplexans of the genus Eimeria (coccidian parasites) are found disproportionately in immature lambs and burdens across the population peak later in spring and summer aligned with increased transmission via the pasture after infections establish in young individuals (Chartier and Paraud, Reference Chartier and Paraud2012). Furthermore, co-infecting parasites sharing host sites and resources can interact to impact infection dynamics (Lello et al., Reference Lello, Boag, Fenton, Stevenson and Hudson2004; Fenton, Reference Fenton2008; Graham, Reference Graham2008; Ezenwa, Reference Ezenwa2016). For instance, in wild wood mice removal of a key helminth species (Heligmosomoides polygyrus) resulted in a 15-fold increase in coccidia burdens via a hypothesized competitive release (Knowles et al., Reference Knowles, Fenton, Petchey, Jones, Barber and Pedersen2013; Rynkiewicz et al., Reference Rynkiewicz, Pedersen and Fenton2015). Although interspecific parasite interactions are difficult to detect from observational data and correlation methods, longitudinal studies are among the more robust methods for reliably detecting interactions among parasites (Fenton et al., Reference Fenton, Knowles, Petchey and Pedersen2014). Monitoring environmental and demographic variations alongside longitudinal infection data for multiple parasites within host populations is important for determining whether factors shaping infection dynamics act similarly across parasites, and for determining processes underlying relationships within the parasite community.
There are several biological processes occurring at different scales which might cause the prevalence or abundance of two (or more) parasites to significantly correlate on average, and which may be distinguishable by an appropriate model set-up. For instance, prevalence of two parasites might be positively correlated across hosts with overlapping space use because certain sites within the region are well suited to the transmission of both parasites while others are not. Here, the correlation would be driven by among-site, rather than within-site, covariation (Stutz et al., Reference Stutz, Blaustein, Briggs, Hoverman, Rohr and Johnson2017). Within one host population, correlations among parasite groups could be driven by among- or within-individual host covariation, or by both (Fig. 1). A positive correlation between two parasite taxa at the population level (Fig. 1A) could result from only among-individual variation which influences exposure or susceptibility to both parasites in the same manner (Fig. 1B). For example, where genetically based differences in immunity confer resistance to multiple parasites, we would expect among-individual covariance to drive observed correlations across parasite abundances. Alternatively, solely within-individual covariation could be responsible (Fig. 1C). Here, short-term variation that influences deviations from a host's average abundance in the same direction for both parasites drives the overall correlation, and the host's average abundance over time for one parasite is not correlated with their average in the other parasite (Fig. 1C). For example, fine-scale spatial or temporal variation in resource availability might mean that some hosts had more resources to invest in immunity to all parasites at specific sampling points compared to others. The same conceptual framework would apply to an observed negative correlation between two parasites (Fig. 1E). For example, if genetically based variation in immunity was associated with resistance to only one type of parasite, allowing another parasite to consistently outcompete it, this would drive negative covariance at the among-individual level (Fig. 1F). Alternatively, some habitat types might be well suited for transmission of one parasite but limit transmission in another; if hosts regularly moved between such habitats this could generate negative covariation at the within-individual level (Fig. 1G). Due to the high degree of environmental and individual variation present in the wild, we might expect to observe contributions from both within- and between-individual levels to patterns of covariance in co-infection (Fig. 1D and H). Recent applications of multivariate hierarchical mixed-effects models to longitudinal data from wild animal systems demonstrate how this approach can separate these levels of covariance (Debeffe et al., Reference Debeffe, McLoughlin, Medill, Stewart, Andres, Shury, Wagner, Jenkins, Gilleard and Poissant2016; Froy et al., Reference Froy, Sparks, Watt, Sinclair, Bach, Pilkington, Pemberton, McNeilly and Nussey2019), but this approach has very rarely been applied to understand the patterns of co-infections (although see Stutz et al., Reference Stutz, Blaustein, Briggs, Hoverman, Rohr and Johnson2017).
Decomposing relationships among co-infecting parasites in wild populations. Colours represent individual animals. (A and E) Positive and negative phenotypic correlations may be driven by multiple non-exclusive processes. (B and F) Correlation of two parasites driven entirely by within-individual processes result from covariance in deviations from means in the same (B) or opposite (F) direction for both parasites, likely induced by fluctuating environmental conditions. (C and G) Correlation of two parasites driven entirely by among-individual processes result from covariance in individual means of both, likely driven by interindividual variation in factors such as genotype or immunity which impact host susceptibility to both (C) or one (G) parasite, facilitating indirect interaction between parasites in competition. It is also likely in wild systems that multiple factors shape relationships among parasites, which can result in positive (D) or negative (H) correlations shaped by within- and between-host processes.

The Soay sheep living on the St Kilda archipelago represent a powerful system to disentangle the roles of long-term individual differences and short-term effects of environment, age and reproductive status on parasite dynamics in the wild. Environmentally transmitted GI nematodes and coccidian microparasites are the primary parasites infecting the Soay sheep (Wilson et al., Reference Wilson, Grenfell, Pilkington, Boyd, Gulland, Clutton Brock and Pemberton2004; Graham et al., Reference Graham, Nussey, Lloyd-Smith, Longbottom, Maley, Pemberton, Pilkington, Prager, Smith, Watt, Wilson, McNeilly and Brulisauer2016). Higher abundance of both parasite groups are expected in the spring and summer due to fecal–oral transmission cycles and the abundance of immunologically naïve lambs that harbour disproportionately high infection intensities which increase exposure in the environment (Wilson et al., Reference Wilson, Grenfell, Pilkington, Boyd, Gulland, Clutton Brock and Pemberton2004; Craig et al., Reference Craig, Pilkington, Kruuk and Pemberton2007). In addition, for strongyle nematodes, there is evidence that males tend to have greater parasite abundance compared to females, and reproductively active females exhibit a strong peak in the spring due to PPRI (Wilson et al., Reference Wilson, Grenfell, Pilkington, Boyd, Gulland, Clutton Brock and Pemberton2004). To date, however, longitudinal parasitological studies in this system have been limited to spring and summer and have focused on the strongyle nematode group only. Here, we investigated longitudinal dynamics of six GI parasite groups by repeatedly fecal sampling known individuals belonging to different age and sex groups across five sampling points within a single year. We test the predictions that: (1) parasite abundances will be highest in warmest months and (2) in the youngest individuals; (3) males will have higher abundance compared to females across the year and (4) parasite abundance will be increased in spring among breeding females due to PPRI. We specifically test whether age and sex groups drive variation across sampling points, as well as estimate the individual repeatability of strongyle nematode and coccidian abundance and test whether correlations between these two highly prevalent parasite groups are driven by among- or within-individual level processes.
Materials and methods
Data collection and study system
This study was conducted in an unmanaged population of Soay sheep on the St Kilda archipelago (57°49′ N, 08°34′ W, 65 km northwest of the Outer Hebrides, Scotland). A population of 107 Soay sheep was moved from the island of Soay to the largest island of the archipelago, Hirta, in 1934. The resultant unmanaged Soay sheep population living in Village Bay on Hirta has been part of a long-term individual-based study since 1985 (Clutton-Brock and Pemberton, Reference Clutton-Brock, Pemberton, Clutton Brock and Pemberton2004a). The annual reproductive cycle of the population is illustrated in Fig. 2. In April, most ewes give birth to one or two lambs (approximately 20% of lambs are twins), and neonates are captured within a few days of birth and marked with unique ear tags allowing them to be identified and monitored throughout life. Sheep gain condition and females lactate to their lambs over the months that follow, with most lambs weaned by approximately 4 months old. Males live in bachelor groups for much of the year and gain body condition through spring and summer in preparation for the autumn rut, during which males compete for mating opportunities with oestrous females. In the winter months that follow, the sheep are food limited and experience challenging climate conditions, and most natural mortality occurs late in the winter period (February and March).
Fecal sampling programme (‘sampling’) is illustrated alongside the major events of the annual cycle of Soay sheep on St Kilda (‘sheep year’). Each ‘X’ designates each sampling point for adults or lambs with the number of samples collected indicated. Wherever possible, the same individuals as initially selected were repeatedly sampled across the study period.

Fecal samples for parasitological analyses were collected seasonally in five sampling trips to capture major seasonal variation: winter 2019 (6 March–16 March 2019), spring 2019 (13 May–24 May 2019), summer 2019 (17 July–29 July 2019), autumn 2019 (27 October–8 November 2019) and winter 2020 (4 March–18 March 2020) (Fig. 2). We targeted individuals from two demographic groups for repeated sampling over this period: adults (aged 2 years or more, sampled from winter 2019 onwards) and lambs (sampled from summer 2019 onwards). Individuals were targeted for sampling based on having a home range centred within our core study area, with an effort made to distribute individuals as evenly as possible across age and sex groups, given the adult population is heavily female-biased (Wilson et al., Reference Wilson, Grenfell, Pilkington, Boyd, Gulland, Clutton Brock and Pemberton2004). Details of the total animals sampled are given in Table S1. Lambs were not sampled in spring 2019 as fecal samples were not consistently of sufficient size for parasitological analysis. Target individuals were observed closely until they defecated. The fecal sample produced was collected from the pasture within 2 min of defecation. For each sample, individual identity, collection date and time of day were recorded. Samples were weighed at the end of each collection day. A total of 2 g of fecal matter for adults and 1 g for lambs were stored in plastic bags, which were flattened and rolled tightly to provide anaerobic conditions, and refrigerated at 4°C until processing to minimize egg hatching. Parasite egg/oocyst counts were carried out upon return to the laboratory within 3 weeks of collection.
Parasitology
GI parasites were quantified using a modified salt-flotation method to enumerate eggs (helminths) or oocysts (protozoans) in the fecal samples (Hayward et al., Reference Hayward, Pilkington, Wilson, McNeilly and Watt2019). Briefly, 2 g (adults) or 1 g (lambs) of fecal matter was mixed with 10 mL of water per gram and mechanically homogenized. A 10 mL aliquot of each sample suspension was filtered through a 1 mm sieve and washed with 5 mL of tap water. Filtrates were centrifuged in 15 mL polyallomer tubes for 2 min at 200 g. The supernatant was removed and the fecal pellet was re-suspended with 10 mL of saturated NaCl solution and centrifuged for another round of 2 min at 200 g. Tubes were clamped below the meniscus using medical forceps, leaving GI parasite eggs or oocysts which float on the salt solution in the fluid above the clamp. The fluid above the clamp was added to a cuvette in addition to approximately 1 mL of NaCl used to wash the upper chamber. The cuvette was added with NaCl solution and the entire cuvette surface was scanned to count parasite eggs and oocysts to a precision of 1 egg/oocyst per gram. Fecal egg counts (FECs) are a common proxy for worm burden (described as abundance) which typically show a positive correlation with worm number in Soay sheep as well as other wild animals and domestic sheep (McKenna, Reference McKenna1981; Cabaret et al., Reference Cabaret, Gasnier and Jacquiet1998; Wilson et al., Reference Wilson, Grenfell, Pilkington, Boyd, Gulland, Clutton Brock and Pemberton2004; Cringoli et al., Reference Cringoli, Rinaldi, Veneziano, Pennachio, Morgoglione, Santaniello, Schioppi and Fedele2008). High technical repeatability with the cuvette method described above has previously been previously established in Soay sheep (Albery et al., Reference Albery, Kenyon, Morris, Morris, Nussey and Pemberton2018; Hayward et al., Reference Hayward, Pilkington, Wilson, McNeilly and Watt2019).
Statistical analysis
All statistical analyses were conducted using R version 3.6.1 (R Core Team, 2019). We fitted all models using the Bayesian modelling package ‘MCMCglmm’ (Hadfield, Reference Hadfield2010). All models were run for 260 000 iterations with a 2000-iteration thinning interval and a 60 000-iteration burn-in period. We used generalized linear mixed-effects models (GLMMs) to test the effects of season and sex on egg/oocyst counts for each parasite group separately, and ran separate models for lambs and adults due to differences in the seasons sampled in each age group (Fig. 2; Table 1). In few instances, rarer parasites were not present at all time points so models were fit only to those time points containing meaningful infection data (Fig. 3; Table 1). Strongyle, coccidian, Capillaria and Nematodirus models were fitted with FECs/fecal oocyst counts (FOCs) as a response variable and Poisson error families. Strongyloides and Moniezia were scored as presence/absence and therefore modelled with a binomial error family (Table 1). Individual identity was included as a random effect in all models. In addition to model effect estimates which compared each level of season to the intercept category (Winter19), we assessed statistical support of pairwise differences between subsequent time points (e.g. spring vs summer) for each parasite, equivalent to a post-hoc difference of means, where significant values were determined using the proportion overlap of the posterior distributions of the Markov Chain Monte Carlo (MCMC) estimates for each level divided by half the number of stored iterations (Albery et al., Reference Albery, Kenyon, Morris, Morris, Nussey and Pemberton2018; Palmer et al., Reference Palmer, Hadfield and Obbard2018).
Infection status of individual sheep across parasite groups and seasons. Shading represents the presence of a parasite for each sample (filled: present; blank: absent; grey: not sampled). The top panel represents adult samples and the bottom panel represents lamb samples. Overall prevalence within the population is shown for each parasite at the top of the plot.

Details of GLMMs fit to parasite data in this study

FEC, fecal egg counts; FOC, fecal oocyst counts; P, presence; A, absence.
See text for further details.
We then investigated whether and how observed seasonal dynamics in parasite counts were driven by particular demographic groups in the population. We fit interactive effects with sex and reproductive status in adult sheep. We used all seasons of strongyle egg and coccidian oocyst counts only, as these were the two most prevalent parasites in the population and other parasites had very low or no prevalence in some seasons (Fig. 3). To test for sex differences overall as well as differences among females that did or did not breed, we coded a ‘sex/reproductive status’ variable with the following categories: ‘male’, ‘female no lamb’ (did not breed in spring 2019) and ‘female with lamb’ (gave birth to at least one lamb in spring 2019). GLMMs with Poisson error families were fitted to both strongyle FECs and coccidian FOCs with the following fixed effects: sex/reproductive status (‘SexRepro’), Season (five level factor, as above), Age in years (continuous, scaled to a mean of zero and a standard deviation of 1) and a SexRepro-by-Season interaction (Table 1). Individual identity was included as a random effect in these models. We used posterior prediction to evaluate model performance by comparing predicted values to raw data, and to investigate whether and how SexRepro categories varied in their seasonal trajectories. In total, 1000 predicted values were generated for each SexRepro/Season category to calculate a distribution (Seasont +1 − Seasont) representing the relative change from season-to-season. These distributions were compared across each combination of SexRepro categories for each seasonal change to assess significant differences in seasonality for demographic groups, where significant values were calculated using proportional overlap of each pairwise set of distributions divided by half the number of predicted values (equivalent to a post-hoc test).
Next, we investigated repeatability of strongyle and coccidian counts for adults across sampling seasons. Finally, we estimated the among- and within-host covariance in strongyle and coccidian counts. We specified a multivariate Poisson model with strongyle and coccidian counts as response variables, and fixed and random effects identical to those in univariate models above (Table 1). Individual repeatability across seasons for both responses was derived using the individual variance estimate from each model divided by the total variance (VarID/(VarID + VarResidual + VarPoisson)) (Nakagawa and Schielzeth, Reference Nakagawa and Schielzeth2010). This model also estimates the covariance at the among- and within-individual (residual) levels between the strongyle FEC and coccidian FOC. The covariance at the among-individual level (CovIndividiual) indicates the association between individuals' average strongyle FEC and coccidian FOC across the entire study period. The within-individual or residual covariance (CovResidual) reflects associations at the level of sample point having accounted for any association at the individual mean level. Overall (phenotypic) covariance between the two responses is then represented by Covphenotypic = CovIndividual + CovResidual.
Results
Strongyles (95% prevalence) and coccidian (99%) were by far the most prevalent parasites in the population, followed by Nematodirus (21.4%), Strongyloides (12.2%), Moniezia (10.8%) and Capillaria (9.2%; Fig. 3). Trichuris had a prevalence of <1% in the population (Fig. 3) and was not included in our analyses. Capillaria was found only in adults and therefore does not appear in lamb analysis, and Nematodirus were found almost exclusively in lambs and therefore does not appear in adult analysis. For parasites with associated count data (vs presence/absence), mean and range of counts for each age and season group are summarized in Table S2. There was a seasonal variation in the prevalence of all parasites (Fig. 3). Coccidia and strongyles were present at high prevalence in both adults and lambs for all seasons sampled. In contrast, other parasites were much less consistent in detection. Capillaria was found only in adults in the first two seasons only. Nematodirus was found primarily in lambs especially in the summer, but infrequently in adults across all seasons as well. Strongyloides was present primarily in adults and detected most frequently in spring and summer, whereas Moniezia was detected in low overall prevalence but more frequently in lambs. Finally, Trichuris was detected in only one adult and was dropped from further analysis.
Our models of parasite counts likewise revealed seasonal variation for most parasite species groups (Fig. 4). In adults, parasite abundance was generally significantly higher in spring compared to in other seasons and, while it tended to be lower in summer compared to spring, summer counts tended to be higher compared to autumn or winter season (Fig. 4A–E; Tables S1 and S2). For strongyle and coccidian counts, there was a clear seasonal pattern where spring FECs/FOCs were greater than those of summer, and both spring and summer FECs/FOCs were greater than those of autumn and winter, which were more similar in magnitude (Fig. 4A and B; Table S2). Capillaria was detected only in winter and spring 2019 and had highest abundance in the winter (Fig. 4C). Probability of detection was highest in the spring for Strongyloides, although seasonal patterns for this parasite were less consistent compared to strongyles and coccidia (Fig. 4D). There was no difference in the probability of infection with Moniezia across seasons (Fig. 4E). In addition to seasonal effects, we found that males had higher strongyle egg counts compared to females [post mean = 0.97, 95% confidence interval (CI): 0.5–1.45, P MCMC < 0.001] and males had greater probability of infection with Strongyloides compared to females (post mean = 1.28, 95% CI: 0.21–2.38, P MCMC = 0.03). There were no sex differences in the other parasite groups for adults (Table S3). Although parasites were modelled within age groups, parasite abundance was higher in lambs compared to adults for all parasites except Capillaria (Table S2).
Seasonal dynamics of six GI taxa of Soay sheep spanning five sample trips. The top panel (A–E) represents data from adults (all sampling points). The bottom panel (F–J) represents data from lambs (Summer 2019 onwards). Coloured points represent raw data, where the width of the point spread is proportional to the density distribution. Black points and error bars represent the mean (for counts) or prevalence (for presence/absence) for each parasite ± s.e. Brackets above indicate pairwise comparisons across all season combinations, where significance was calculated as the proportional overlap between posterior distributions for pairs of Season levels divided by half the number of stored iterations. Significance is denoted by ***, ** and * for P < 0.001, P < 0.01 and P < 0.05, respectively. Some models were run in adults (Capillaria) or lambs (Nematodirus) or only run on subsets of data due to zero-extremely low prevalence within some time points. Plots and effect comparisons are limited to those categories represented in the models.

In lambs – for which we only had samples in summer and autumn 2019 and winter 2020 – we found that strongyle and Nematodirus FECs and coccidian FOCs were highest in summer (Fig. 4F–H; Table S3). The probability of detecting Moniezia eggs was lower in autumn compared to either in summer or winter (Fig. 4J), while there was no difference in the probability of detection of Strongyloides eggs between summer and autumn and this parasite was detected in only one lamb in winter 2020 (Fig. 4I; Table S3). We found no evidence for differences between male and female lambs in their average counts across seasons in any of these parasite groups (Table S3).
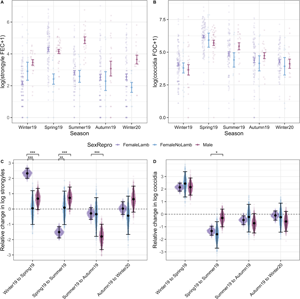
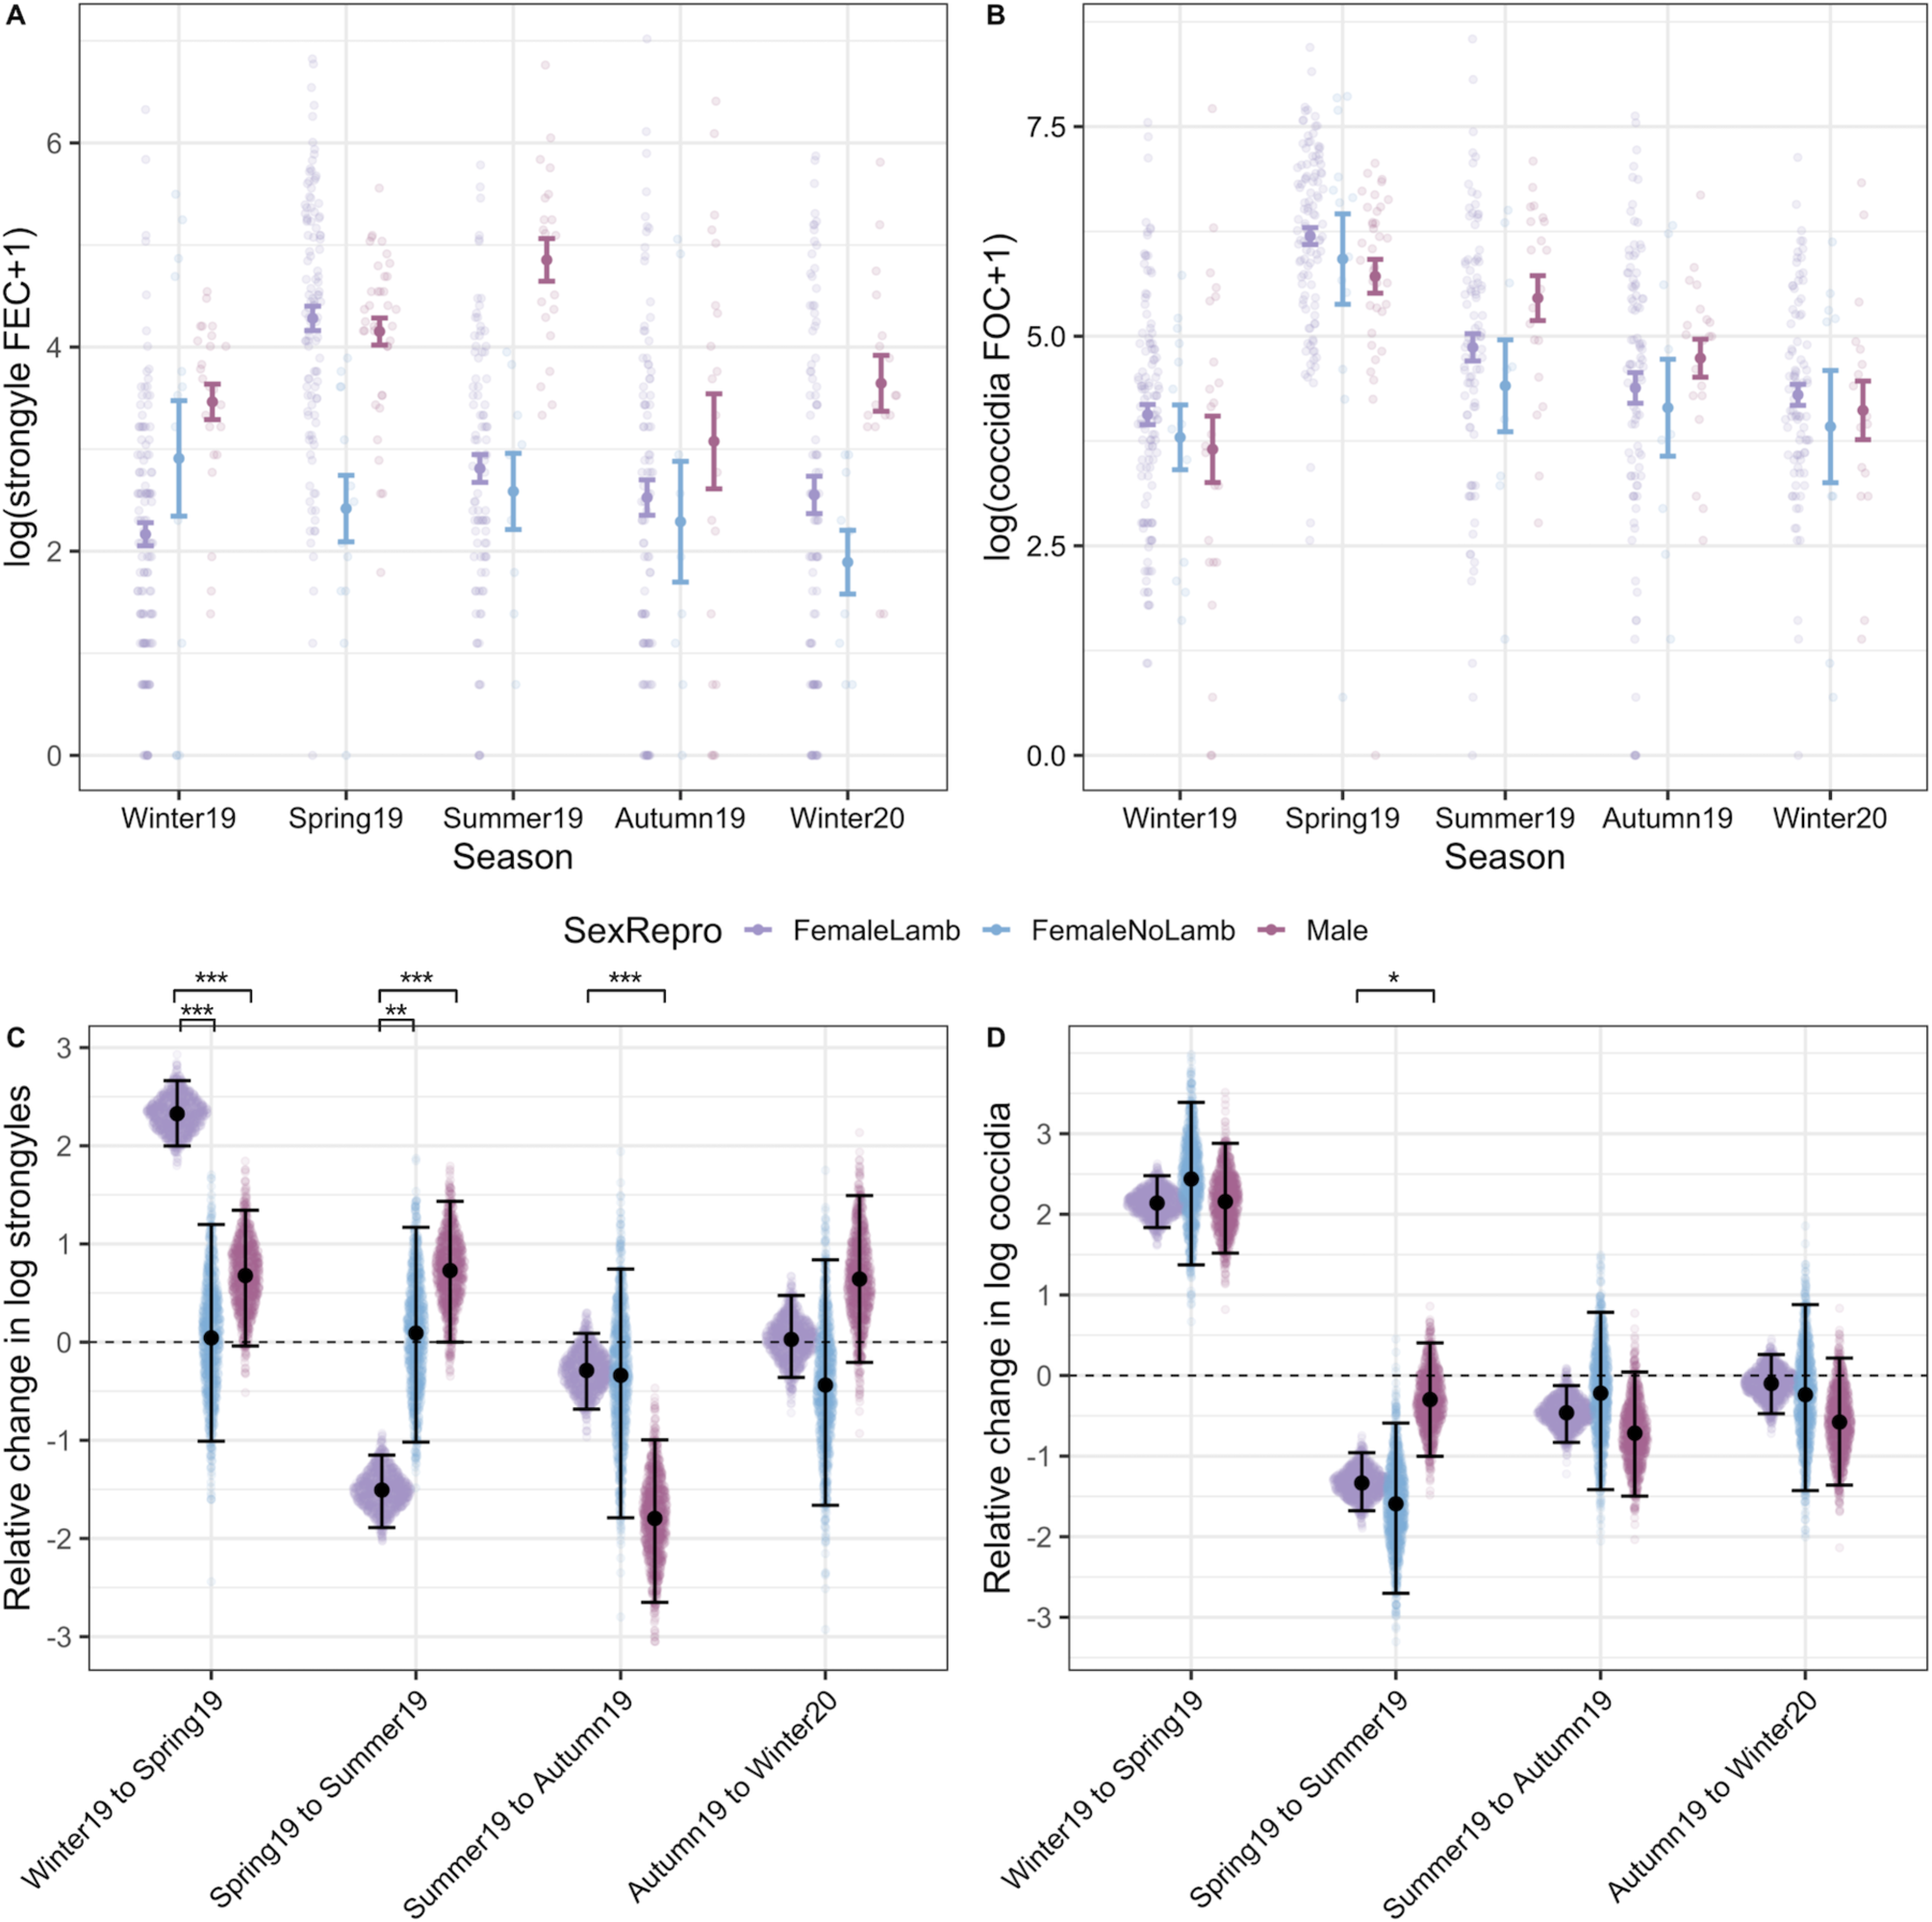
Models investigating interactive effects of sex/female reproductive status and season demonstrated much stronger interactions for strongyle FECs than in coccidian FOCs (Fig. 5; Tables S3 and S4). Strongyle counts increased significantly more from winter to spring in females that produced lambs than in males (Fig. 5A and C). Females that did not produce a lamb in contrast had a significantly lower magnitude of change from winter to spring and these barren ewes showed little seasonal variation in FEC overall (Fig. 5A and C). From spring to summer, strongyle FECs dropped in females with lambs to the levels similar to those observed in females without lambs (Fig. 5A and C), but male FECs remained high and actually increased slightly on average from spring to summer (Fig. 5A and C). Coccidian counts showed little evidence of a season-by-sex/reproductive status interaction in contrast: counts increased from winter to spring in a consistent manner across sex/reproductive status groups, and then fell from spring to summer, although this drop was less pronounced in males than in females (Fig. 5B and D). In both models, continuous age of adults was fit to account for potential ageing effects within the adult age class, but was insignificant for both strongyles and coccidia (Table S4).
Interactions with season and host sex and reproductive status in adult sheep. The top panel (A and B) represents raw data (coloured points) overlaid with mean and s.e. grouped according to SexRepro-by-Season groups for both (A) strongyle egg and (B) coccidian oocyst counts. Maroon indicates females that gave birth to at least one lamb in the spring, pink indicates females that did not give birth and blue indicates males. The bottom panel (C and D) represents the pairwise comparisons of seasonal changes calculated from 1000 predicted values for each SexRepro-by-Season group from GLMMs with (C) strongyle and (D) coccidian counts as a response. Sina plots of points represent each value from the predicted distribution (Seasont +1 − Seasont) for each group, overlaid with mean and 95% CIs. Significant differences between the SexRepro groups are indicated by brackets above plots, calculated from the proportional overlap of each pairwise set of distributions. Comparisons can be interpreted similarly to the following examples: panel C indicates that females with lambs show a much greater increase in FECs from winter to spring compared to both females without lambs and males, and panel D shows that females with lambs show a greater decrease from spring to summer compared to males. Significant differences between effects are indicated by ***, ** and * for P < 0.001, P < 0.01 and P < 0.05, respectively.
Bivariate GLMMs yielded nearly identical fixed effects estimates to the univariate models described above (Table S4). Repeatabilities of strongyle FECs and coccidian FOCs across season, after accounting for effects of sex and season, were 0.28 (95% CI: 0.19–0.36) and 0.20 (0.12–0.27), respectively. The overall phenotypic correlation between strongyle and coccidian counts was estimated as 0.27 (0.20–0.37, P MCMC < 0.001). Underlying this, we estimated a higher positive within-individual correlation (post mean = 0.46, 95% CI: 0.31–0.62) and a much weaker among-individual correlation which had credible intervals that overlapped zero (post mean = 0.15, 95% CI: −0.03 to 0.31).
Discussion
We found that most parasite groups varied in prevalence and abundance across the sampled seasons and, as predicted, these tended to be highest in the spring and summer. Strongyle nematodes and coccidian microparasites were highly prevalent across the entire study period in both lambs and adults, whereas other parasite groups were detected infrequently or only in certain age groups or seasons. These results largely agree with previous research in this system (Wilson et al., Reference Wilson, Grenfell, Pilkington, Boyd, Gulland, Clutton Brock and Pemberton2004; Craig et al., Reference Craig, Pilkington and Pemberton2006, Reference Craig, Pilkington, Kruuk and Pemberton2007), as well as in domestic sheep (Hamer et al., Reference Hamer, McIntyre, Morrison, Jennings, Kelly, Leeson, Bartley, Chaudhry, Busin and Sargison2019; Evans et al., Reference Evans, Chaudhry, Costa-Júnior, Hamer, Leeson and Sargison2021). Generally, GI parasite communities differed between lambs and adults (Fig. 3) and strongyle FECs and coccidian FOCs were generally higher in lambs than in adults across seasons (Fig. 5; Table S2). In contrast to predictions, we only detected male bias across seasons in two out of the six parasites studied (strongyles and Strongyloides). Our in-depth analyses of the highly prevalent strongyle and coccidian groups in adults revealed striking interactions between season and reproductive group in the former but not in the latter, as well as a surprising increase in strongyle FECs for males during the summer. We also demonstrated that counts of both groups are moderately repeatable across our year-long study period, and that counts are positively correlated with each other overall. Bivariate modelling of these two parasite groups further revealed that this correlation was driven by short-term fluctuations in the same direction across seasons, rather than consistent differences in FECs and FOCs between individual sheep on average across the study period.
The seasonal epidemiology of the GI nematode parasites investigated here has been well-characterized in a study on domestic sheep (Vlassoff et al., Reference Vlassoff, Leathwick and Heath2001). These dynamics seem remarkably robust to management practices (Hamer et al., Reference Hamer, McIntyre, Morrison, Jennings, Kelly, Leeson, Bartley, Chaudhry, Busin and Sargison2019), as well as being consistent with previous findings in the unmanaged population of Soay sheep on St Kilda (Wilson et al., Reference Wilson, Grenfell, Pilkington, Boyd, Gulland, Clutton Brock and Pemberton2004). Our results largely confirm these patterns, using a much larger dataset with finer-scale temporal resolution compared to previous studies on the Soay sheep. The widely observed increase in nematode FECs observed through spring and summer is associated with a surge in egg shedding onto pasture from immunologically naïve neonate lambs and ewes experiencing PPRI (Vlassoff et al., Reference Vlassoff, Leathwick and Heath2001). On St Kilda, strongyle eggs generally first appear in the feces of lambs around 6 weeks old and small-scale longitudinal studies of lambs suggest that while lamb FECs rise to a peak around August, they subsequently remain high and may continue to rise again through late winter (February–April; Wilson et al., Reference Wilson, Grenfell, Pilkington, Boyd, Gulland, Clutton Brock and Pemberton2004), whereas in domestic animals, egg shedding declines in the winter (Vlassoff et al., Reference Vlassoff, Leathwick and Heath2001). Although our sampling regime prohibited us from detecting the well-established increase in lamb FECs from spring to summer, our data confirm that lamb FECs remain high and do not decrease as markedly through autumn and winter as in adults (Fig. 5A and F). The reasons for this difference between the early-life dynamics in unmanaged Soay sheep and domestic sheep remain to be determined, and certainly warrant further investigation. One possibility is that on St Kilda lambs FECs remain high due to the food limitation experienced by Soay lambs during winter (Wilson et al., Reference Wilson, Grenfell, Pilkington, Boyd, Gulland, Clutton Brock and Pemberton2004; Craig et al., Reference Craig, Pilkington and Pemberton2006), which delays the onset of immunity to the parasites relative to domestic lambs of higher nutritional status.
We found pronounced increases in strongyle FECs from the end of winter (March) to spring (May) among females that produced lambs, but not in barren ewes (Fig. 5A). This supports previous observations of reproduction-induced increases in FECs in Soay sheep (Hayward et al., Reference Hayward, Pilkington, Wilson, McNeilly and Watt2019; Leivesley et al., Reference Leivesley, Bussière, Pemberton, Pilkington, Wilson and Hayward2019) as well as numerous other wild animals such as bighorn sheep (Festa-Bianchet, Reference Festa-Bianchet1989), red deer (Albery et al., Reference Albery, Watt, Keith, Morris, Morris, Kenyon, Nussey and Pemberton2020), flying foxes (Plowright et al., Reference Plowright, Field, Smith, Divljan, Palmer, Tabor, Daszak and Foley2008) and birds (Nordling et al., Reference Nordling, Andersson, Zohari and Lars1998; Knowles et al., Reference Knowles, Nakagawa and Sheldon2009) and is a well-defined phenomenon in domesticated sheep flocks (Vlassoff et al., Reference Vlassoff, Leathwick and Heath2001; Hamer et al., Reference Hamer, McIntyre, Morrison, Jennings, Kelly, Leeson, Bartley, Chaudhry, Busin and Sargison2019). The increased counts in reproductive ewes can be attributable to both relaxed immunity (PPRI) due to the demands of lactation and gestation (Festa-Bianchet, Reference Festa-Bianchet1989; Sheldon and Verhulst, Reference Sheldon and Verhulst1996) or due to higher exposure from increased foraging behaviour to compensate for resource demands (Hutchings et al., Reference Hutchings, Milner, Gordon, Kyriazakis and Jackson2002). Previous evidence documenting decreased strongyle-specific immunoglobulin G antibody levels during the lambing season in Soay ewes suggests that the former mechanism is at least partially responsible for an increase in the FECs in reproductive ewes in this system (Hayward et al., Reference Hayward, Pilkington, Wilson, McNeilly and Watt2019). The data from our study provide some further support for an immune-mediated explanation, as the FECs of reproductive ewes fall rapidly to the levels observed in barren ewes by summer (July; Fig. 5A). Breeding ewes are expected to experience high-nutritional demands through both spring and summer due to lactation, and therefore if increased exposure through altered foraging behaviour was responsible for increased egg shedding then we would expect reproductive females to have higher FECs compared to barren females through until the end of lactation in summer.
Our findings highlight the potential, and often overlooked, importance of males in the transmission dynamics of helminths in wildlife (Ferrari et al., Reference Ferrari, Cattadori, Nespereira, Rizzoli and Hudson2004; Grear et al., Reference Grear, Perkins and Hudson2009), where finer-scale sampling demonstrated that male FECs show a seasonal pattern distinct from that observed in lambs, pregnant or barren ewes. Adult males show a sustained increase in strongyle FECs through spring and summer, unlike reproductive ewes which show a peak in spring and a reduction in summer (Fig. 5A). Contrary to predictions for a persistent male bias in parasite abundance across ages and seasons, we found increased strongyle FECs in adult males relative to reproductive females only in summer. Although further investigation is required to understand the causes of this sex difference, it is likely that some combination of differences in resource allocation trade-offs and exposure to larvae on pasture in adult males compared with other demographic groups is responsible. Adult males invest their limited nutritional resources in horn growth and gaining weight and condition through spring and summer ahead of the autumn rut. The trade-off between testosterone production, investment in secondary sexual characteristics and immunity is hypothesized to predispose males to higher susceptibility to infection via an immunocompetence handicap (Zuk and McKean, Reference Zuk and McKean1996; Nunn et al., Reference Nunn, Lindenfors, Pursall and Rolff2009; Ezenwa et al., Reference Ezenwa, Stefan Ekernas and Creel2012), and we might expect this to manifest as increased male parasite burdens during the peak in exposure to strongyle larvae on pasture in July and August. In the St Kilda population, adult males often spend time in ‘bachelor groups’ outside of the autumn rut (Clutton-Brock and Pemberton, Reference Clutton-Brock and Pemberton2004b). This social grouping of adult males through spring and summer may reinforce immunologically mediate sex differences, as these heavily infected males may be more likely to expose each other to larvae on shared grazing ranging. We note that high strongyle FECs in adult males during the rut have been associated with reduced time spent engaged in sexual activity, suggesting that the summer peak in male FECs may have fitness costs and impact sexual selection in this system (Wilson et al., Reference Wilson, Grenfell, Pilkington, Boyd, Gulland, Clutton Brock and Pemberton2004). Further research addressing the seasonal dynamics of mucosal immunity in adult males (as has been done for females recently on St Kilda, see Hayward et al., Reference Hayward, Pilkington, Wilson, McNeilly and Watt2019), the relationship between home range sharing and parasite abundance and the effects of autumn infection on rut performance and reproductive success in males will help understand the causes and consequences of the male summer peak in strongyle FECs.
Coccidian parasites showed a seasonal pattern broadly consistent with expectations: a marked peak in spring in adults followed by a decline from summer onwards, and substantially higher FOCs in lambs compared to adults over summer and winter. However, in contrast to the patterns discussed above for strongyles, coccidian FOCs showed largely consistent seasonal dynamics across reproductive ewes, barren ewes and males (Fig. 5B). It seems that reproductive status and investment impact seasonal variation in abundance in quite different ways across these two groups of GI parasites. The main driver of seasonal variation in coccidia in domestic sheep is thought to be pasture oocyst contamination by immunologically naïve lambs through spring (Chartier and Paraud, Reference Chartier and Paraud2012). Although we did not have lamb samples from May to confirm this in the current study, previous research on the Soay sheep supports the central role of lambs in transmission and shows that coccidian FOCs are, on average, an order of magnitude greater in lambs compared to adults in summer (Craig et al., Reference Craig, Pilkington, Kruuk and Pemberton2007). Sheep develop immunity to coccidia over their first year of life, a response largely thought to be mediated by T helper type 1 (Th1) responses, and are thought to be largely resistant to pathology caused by these parasites after this point (Ovington et al., Reference Ovington, Alleva and Kerr1995; Jorg Reeg et al., Reference Jorg Reeg, Gauly, Bauer, Mertens, Erhardt and Zahner2005; Craig et al., Reference Craig, Pilkington, Kruuk and Pemberton2007; Ozmen et al., Reference Ozmen, Adanir and Haligur2012). One possible explanation for the lack of a PPRI effect or sex differences in coccidian FOCs, in contrast to strongyle FECs, may lie in differences in the way the immune response involved in controlling these parasite groups develops and trades off with investment in reproduction. Previous studies of mammals have observed that different parasite groups may be differentially impacted by reproduction (Rödel et al., Reference Rödel, Zapka, Stefanski and Holst2016; Becker et al., Reference Becker, Czirják, Volokhov, Bentz, Carrera, Camus, Navara, Chizhikov, Fenton, Simmons, Recuenco, Gilbert, Altizer and Streicker2018; Albery et al., Reference Albery, Watt, Keith, Morris, Morris, Kenyon, Nussey and Pemberton2020). Furthermore, resistance to helminths is dependent on T helper type 2 (Th2) responses, which can be constrained by immune commitment to the Th1 responses required for resistance to microparasites such as coccidia (Graham, Reference Graham2008). Recent evidence in wild Soay sheep has shown that Th1-associated immune phenotypes predicted reduced coccidian FOCs, while Th2-associated phenotypes predicted reduced strongyle FECs (Corripio-Miyar et al., Reference Corripio-Miyar, Hayward, Lemon, Sweeny, Bal, Kenyon, Pilkington, Pemberton, Nussey and McNeilly2022). Although this supports the role of functionally distinct aspects of the immune response in controlling these two different parasite groups, we also found that sheep mounting strong Th1 responses also tended to mount strong Th2 responses (Corripio-Miyar et al. Reference Corripio-Miyar, Hayward, Lemon, Sweeny, Bal, Kenyon, Pilkington, Pemberton, Nussey and McNeilly2022 ). It is possible that the immune responses that develop in sheep to coccidia during the first year of life are more effective than those against strongyle and that varied resource costs of anti-coccidian vs anti-strongyle responses may account for the varied effect of reproductive status on severity of infection. However, further research testing the relationship between reproductive investment, T helper immunity and parasite abundnace would be required to test this hypothesis.
Strongyle FECs and coccidian FOCs showed a positive phenotypic correlation in this study. These results confirm previous reports of positive phenotypic correlations between these two parasite groups in both Soay and domestic sheep (Craig et al., Reference Craig, Tempest, Pilkington and Pemberton2008; Pacheco et al., Reference Pacheco, McNeilly, Banos and Conington2021), but contrast with the previous experimental studies on wild rodents that have identified negative interactions between GI coccidia and strongyles, which appear linked to competition over shared host resources and competitive release (Knowles et al., Reference Knowles, Fenton, Petchey, Jones, Barber and Pedersen2013; Rynkiewicz et al., Reference Rynkiewicz, Pedersen and Fenton2015). One plausible explanation, which also applies to observed positive correlations between Th1 and Th2 immune phenotypes in this population (Corripio-Miyar et al., 2021), is variation in resource acquisition and joint exposure to multiple parasites which is likely very common in natural systems. Sheep acquiring fewer resources, due to competitive ability or home range quality, may be less able to mount immune response to multiple parasites and may need to forage more widely and less selectively and risk greater exposure to multiple parasites. However, in addition to these environmental factors, the recent observation that FECs and FOCs are positively correlated at the genetic level in domestic Blackface lambs suggests that the correlation between strongyle and coccidian parasite abundances in this study could also have some genetic basis (Pacheco et al., Reference Pacheco, McNeilly, Banos and Conington2021). In addition, strongyle FECs and coccidian FOCs were both moderately repeatable at the individual level over our study period. This shows that variation in parasite abundance across a year is driven, at least in part, by consistent among-host differences in some aspects of genotype or environment. Previous estimates in our study system put the heritability of August FEC and FOC measures at 10–20% (Beraldi et al., Reference Beraldi, McRae, Gratten, Pilkington, Slate, Visscher and Pemberton2006), which suggests at least some of the among-individual variations observed in the current study may have a genetic basis.
Here, we have utilized multivariate hierarchical mixed-effects models to dissect whether the observed positive correlation between strongyle and coccidian counts is driven by among- or within-host processes (see Fig. 1). Although rarely used to date in the context of co-infection, previous studies have used this approach to dissect the role of among- and within-host processes in linking nematode parasite burdens in wild horses (Debeffe et al., Reference Debeffe, McLoughlin, Medill, Stewart, Andres, Shury, Wagner, Jenkins, Gilleard and Poissant2016) and the role of among-host and among-site processes driving amphibian infection dynamics (Stutz et al., Reference Stutz, Blaustein, Briggs, Hoverman, Rohr and Johnson2017). Our analyses demonstrate that the positive covariance between strongyle FECs and coccidian FOCs is predominantly a within-individual correlation. In other words, it results from short-term (season-to-season) deviations from an individual's mean parasite count in the same direction for both types of parasites, and not from some individuals having consistently higher or lower mean FEC and FOC. This highlights the utility of this approach for our understanding the drivers of associations among parasites within communities, and suggests that short-term environmental fluctuations impacting host resource availability – rather than long-term genetically or environmentally driven among-host differences – are responsible for the observed correlation between strongyles and coccidia. The addition of multivariate mixed models to larger-scale and longer-term studies could also allow researchers to go further and address the role that annual variation in environmental conditions (by e.g. random effect for year; Froy et al., Reference Froy, Sparks, Watt, Sinclair, Bach, Pilkington, Pemberton, McNeilly and Nussey2019; Sweeny et al., Reference Sweeny, Albery, Venkatesan, Fenton and Pedersen2021); host genetics (via pedigree-based ‘animal models’; Beraldi et al., Reference Beraldi, McRae, Gratten, Pilkington, Slate, Visscher and Pemberton2006) and spatial structure (through inclusion of spatial field random terms; Albery et al., Reference Albery, Becker, Kenyon, Nussey and Pemberton2019) play in driving the patterns of co-infection in the wild.
Overall, these results demonstrate that seasonality varies across demographic and parasite groups and highlight the value of investigating fluctuating susceptibility and exposure over time for understanding epidemiology of a population. Although we focus here on strongyles and coccidia as broad taxonomic groups, there is considerable diversity of species within both groups on St Kilda (Wilson et al., Reference Wilson, Grenfell, Pilkington, Boyd, Gulland, Clutton Brock and Pemberton2004). Recent advances in characterizing the GI community with metabarcoding methods using noninvasive fecal samples for both nematodes and coccidia (Avramenko et al., Reference Avramenko, Redman, Lewis, Yazwinski, Wasmuth and Gilleard2015; Vermeulen et al., Reference Vermeulen, Lott, Eldridge and Power2016; Evans et al., Reference Evans, Chaudhry, Costa-Júnior, Hamer, Leeson and Sargison2021) could offer higher resolution understanding of GI parasite community dynamics. Additionally, integration of multiple immune markers could provide further insights regarding how multiple components of reproductive effort influence different components of immunity. This will be a crucial link in understanding dynamic stressors affecting immunity and the outcome across multiple parasites in co-infected systems. Finally, results here using just 1 year of sampling demonstrate the value of repeated observations at the individual level for parsing among- and within- individual contributions to variance. From an epidemiological perspective, long-term individual sampling can inform processes underlying complex dynamics of multiparasite systems.
Supplementary material
The supplementary material for this article can be found at https://doi.org/10.1017/S0031182021001980
Data
Data for this study are available on GitHub: https://github.com/arsweeny/SoayLongitudinalPar.
Acknowledgements
The authors acknowledge the National Trust for Scotland for support of this study on St Kilda, and QinetiQ and Kilda Cruises for logistical support. The authors acknowledge the Ecology Within Team for input in the analysis and manuscript. The authors thank Greg Albery, Josephine Pemberton, Robin Pakeman, Andy Fenton and Amy Pedersen for insightful discussion and comments on the manuscript. Figures 1 and 2 are created with Biorender.com. Sheep icons in Fig. 1 are based on photographs by Hannah Vallin and Martin Stoffel.
Author contributions
All authors contributed to the development and planning of the study. X. B. and J. G. P. collected samples. Y. C. M. and F. K. carried out parasitology. A. R. S. analysed the data and led the writing of the manuscript with assistance from D. H. N. and F. K. All authors contributed critically to manuscript drafts and analysis.
Financial support
This study was funded by a large NERC grant (NE/R016801/1), and the long-term study on St Kilda was funded principally by responsive mode grants from NERC.
Conflict of interest
The authors declare there are no conflicts of interest.
Ethical standards
All sampling was carried out in accordance with UK Home Office regulations under Project License PP4825594.


 Open access