


I. Introduction
Since 1988, Wine Spectator’s annual Top 100 list has provided a consistent and influential ranking of premium wines for U.S. consumers. Its stable editorial criteria—score, price, availability, and an “X-factor” capturing overall excitement—create a rare long-run record of quality, pricing, and shifts in regional and country representation. Two prior studies in this journal examined the Top 100 lists: Gokcekus and Fargnoli (Reference Gokcekus and Fargnoli2007) analyzed the 1988–2005 lists, documenting how globalization displaced traditional incumbents and broadened international participation. Gokcekus and Lee (Reference Gokcekus and Lee2014) extended the analysis through 2012 and found continued diversification accompanied by a decline in market concentration.
This note completes the empirical sequence by incorporating the full 1988–2025 dataset and applying Bai–Perron structural break tests (Bai and Perron, Reference Bai and Perron1998, Reference Bai and Perron2003) to regional and country shares. The results identify three statistically distinct phases—1988–1997, 1998–2015, and 2016–2025. Phase-dummy regressions show that real prices fall across the first two phases and continue to decline in the most recent period, even as concentration levels off. The structural break approach highlights changes that shorter samples could not detect and provides a clearer view of how regional representation and pricing have evolved over nearly four decades.
A broader literature has examined long-run globalization, pricing, and regulatory influences in international wine markets. Anderson and Nelgen (Reference Anderson and Nelgen2011) document global production and trade patterns, while Meloni and Swinnen (Reference Meloni and Swinnen2013) analyze how European wine policies shaped regional outcomes. This study contributes by offering a structural analysis of country-level representation in Wine Spectator’s Top 100 lists. Using the Herfindahl–Hirschman Index (HHI) to measure concentration among the Top 100 countries, it provides a complementary perspective based on perceived quality and critical recognition rather than production or trade volumes.
The remainder of the study is organized as follows. Section 2 describes the data and break-detection strategy. Section 3 analyzes phase-level changes in pricing, scores, and concentration. Section 4 examines regional composition and turnover. Section 5 models price formation, and Section 6 concludes.
II. Prices, scores, market concentration, and structural periods
Average real price is defined as the average nominal list price for the Top 100 wines in a given year, deflated using the U.S. CPI-U (U.S. Bureau of Labor Statistics, 2024) with 1988 as the base year. This real-price measure corresponds exactly to the method used in the two earlier JWE studies. Country shares are derived from each wine’s listed country of origin in Wine Spectator’s Top 100 entries (Wine Spectator, n.d.). The IMF’s real effective exchange-rate index (PX.REX.REER) is used as an aggregate control (International Monetary Fund, n.d.). These construction steps ensure consistency with prior JWE studies and comparability across the full 1988–2025 sample. The panel consists of 3,800 wines (100 per year for 38 years), and all results are based on annual aggregates rather than wine-level regressions. Non-vintage entries are included based on their listed country of origin, and no multi-country blends appear in the dataset.
Figure 1 shows normalized indices (1988 = 100) for average real price, score, and the price-to-score ratio. Scores show little movement over the 38-year window, while real prices and the price-to-score index display clear downward trends. A fitted linear trend to the price-to-score series yields a slope of −0.6804 index points per year (t = −5.38, R 2 = 0.445), indicating that the decline is statistically significant at conventional levels.
Price, score, and price-to-score indexes (1988 = 100).

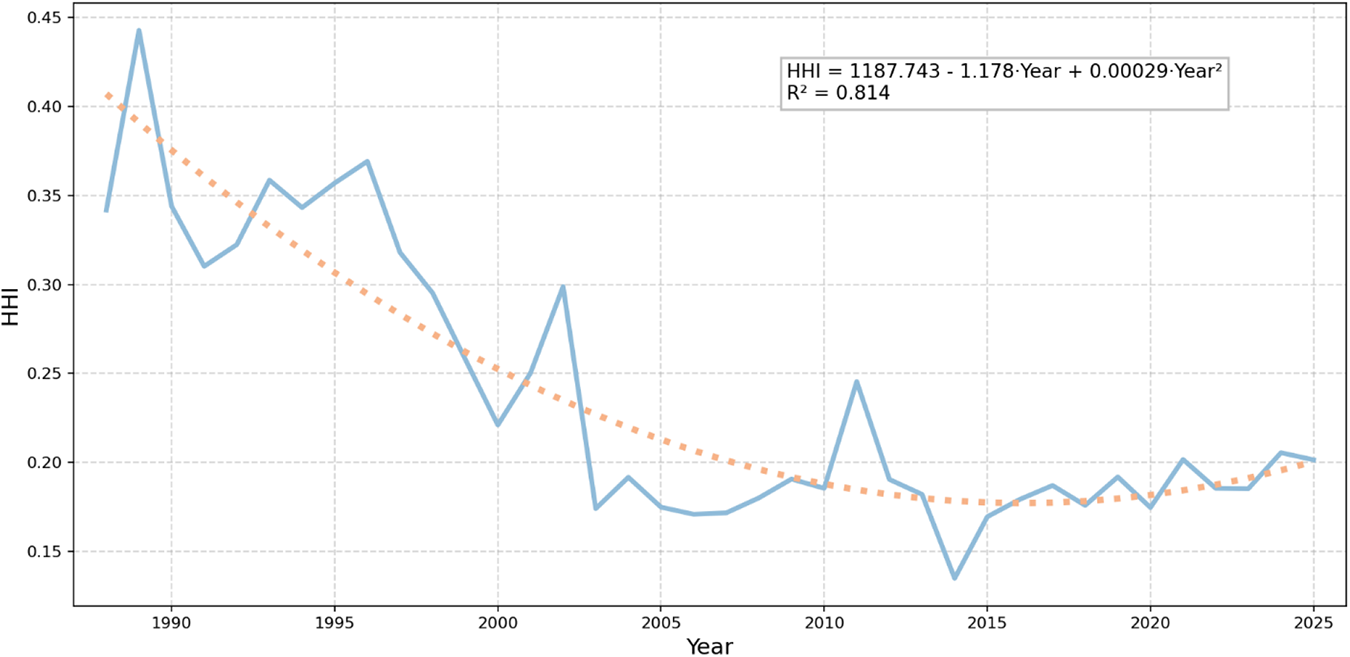
Figure 2 reports the country-level HHI, which captures editorial—not market—concentration. Specifically, the index measures concentration across countries appearing in the list; it is not a firm-level HHI and does not describe producer, importer, or retail concentration. While not reflecting total market structure, the HHI provides a consistent annual measure of representation among countries included in the Top 100 lists. As in earlier studies, the series declines over time. A linear trend captures the long-run downward pattern, and a second-degree polynomial highlights additional curvature in the mid-period.
Country-level concentration (HHI) in the Wine Spectator’s Top 100 lists, 1988–2025.

To identify potential structural changes, Bai–Perron (Bai and Perron, Reference Bai and Perron1998, Reference Bai and Perron2003) multiple structural break tests are applied to annual regional and country-level shares. Each series is tested individually with a maximum of two breaks, a trimming parameter of 0.10, and heteroskedasticity-robust standard errors. Breakpoints are identified using both the UDmax test and sequential F-tests. Results are robust to modest adjustments in the trimming parameter (for example, 0.15) and to limiting the maximum number of breaks to one. Series analyzed include the U.S., Europe, France, the combined U.S.–France share, Australia–New Zealand, South America (Chile and Argentina), the New–New World aggregate, and the incumbent bloc (France, Italy, U.S., and Australia).
Breakpoints cluster in three broad periods. The first appears in the mid-1990s, with breaks for France (1994), the U.S. and Europe (1997), and the combined U.S.–France share (1993). These dates correspond to the end of the early France-dominated period emphasized in previous studies. A second cluster emerges in the early 2000s, with breakpoints for South America (2002 and 2010), the New–New World aggregate (2002), and Australia–New Zealand (2009). These changes coincide with increasing representation of emerging producers in the Top 100 rankings. A final cluster occurs in the mid-2010s, including a structural break for the New–New World aggregate in 2016. Although these breakpoints are statistical rather than interpretive, the timing suggests reduced movement in regional representation after the mid-2010s.
The incumbent group as a whole shows no detected structural break, indicating stability in the aggregate share. However, individual countries within the bloc display movement: France shows breaks in 1994 and 2008, Italy increases its representation in the second period, and the U.S. fluctuates. The apparent group-level stability therefore reflects offsetting shifts among incumbent members rather than uniform patterns. The detailed break statistics are reported in Table 1.
Structural break tests for regional and country shares (Bai–Perron)

Notes: *** p < 0.01, ** p < 0.05, * p < 0.10. The interpretation entries are heuristic descriptions of the detected breaks and should not be viewed as causal attributions.
To assess whether the three-period segmentation (1988–1997, 1998–2015, and 2016–2025) is empirically meaningful, the analysis tests for distributional differences in real prices, scores, and concentration across periods. Kruskal–Wallis tests indicate statistically significant differences in real prices (χ 2 = 10.43, p = 0.0054) and HHI (χ 2 = 21.54, p < 0.0001), but not scores (χ 2 = 1.76, p = 0.4145). Levene’s tests confirm equal variances for all variables: real price (F = 1.995, p = 0.1512), score (F = 2.452, p = 0.1008), and HHI (F = 2.317, p = 0.1135). These results suggest that observed changes across periods reflect shifts in central tendency rather than dispersion and support the use of the three-period segmentation in the remainder of the analysis. Given the limited number of annual observations, all results in this section are descriptive summaries of long-run patterns rather than precise statistical estimates.
III. Phase-level patterns in prices, scores, and market concentration
Section 2 identified long-run differences in prices, concentration, and regional representation. This section evaluates whether these patterns remain statistically distinguishable across the three structural periods, using phase-level means, Welch two-sample t-tests, and nonparametric distributional tests.
Real prices decline across phases, falling from $29.35 in Phase I to $25.80 in Phase II and $22.39 in Phase III. The decrease from Phase I to Phase II is not statistically significant (t = 1.602, p = 0.1345), but prices in Phase III are significantly lower than in both earlier periods (t = 3.253, p = 0.0079 vs. Phase I; t = 3.179, p = 0.0038 vs. Phase II). The largest and most statistically robust difference appears between Phase III and the earlier two phases.
Scores remain stable across all three periods, averaging near 93 points. No phase-level differences are statistically significant (t = −0.361 to −1.340; all p > 0.19). A regression of scores on time yields an insignificant slope, and the Kruskal–Wallis test does not reject equality of score distributions (χ 2 = 1.761, p = 0.4145). Levene’s test also indicates no difference in variance across phases (F = 2.452, p = 0.1008). Together, these results imply that the distribution of quality has remained largely unchanged over the full sample.
Market concentration, measured by the HHI, shows a substantial reduction between Phase I and Phase II. The mean HHI declines from 0.351 to 0.205, a statistically significant difference (t = 9.086, p < 0.0001). Concentration remains low in Phase III (mean = 0.189), and the difference between Phases II and III is not statistically significant (t = 1.395, p = 0.1782). These patterns indicate that most of the long-run decline in concentration occurred between the first two phases, followed by limited movement thereafter.
IV. Composition, turnover, and market structure across phases
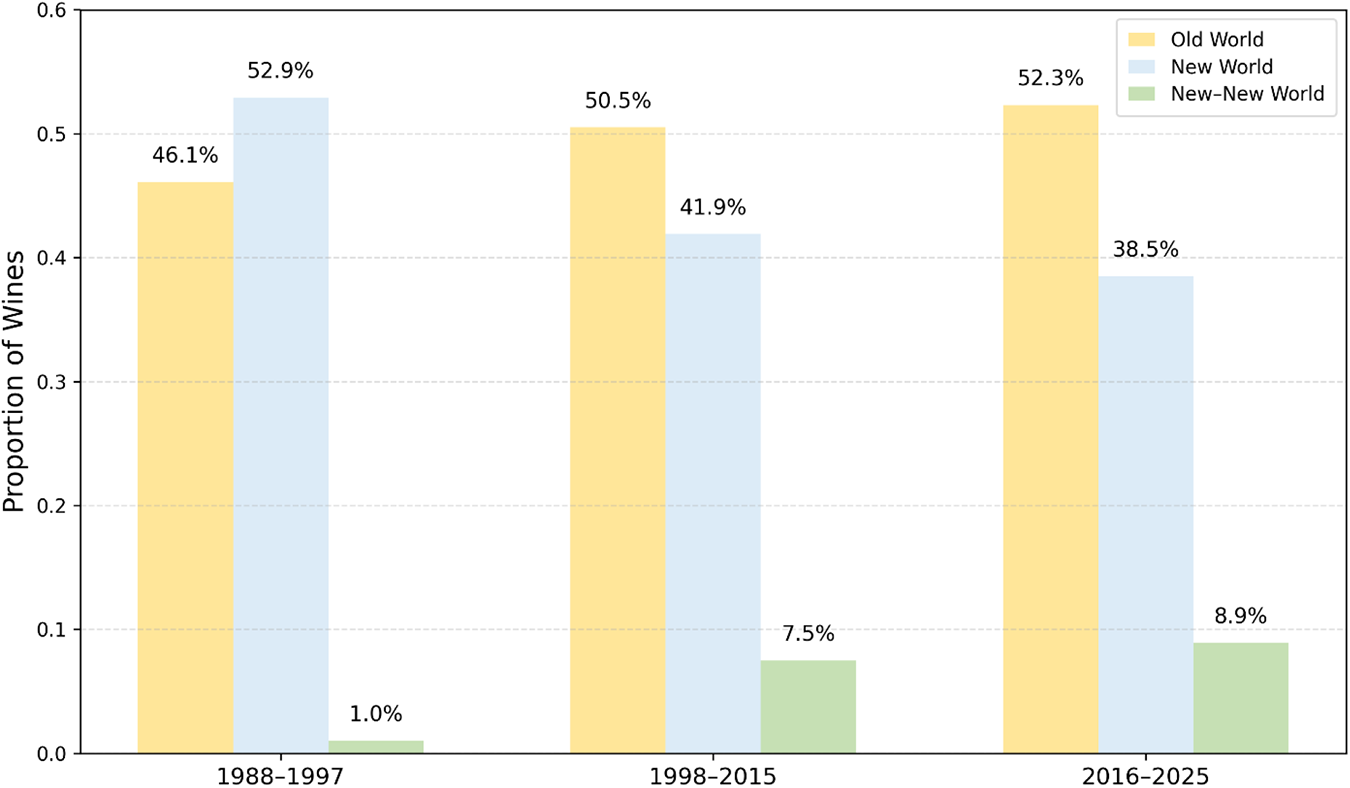
The structural patterns described above are reflected in changes in the Top 100’s regional composition. Figure 3 reports the proportion of wines from Old World, New World, and New–New World regions across the three phases, illustrating how regional representation varies over time. The phase boundaries detected in the structural break analysis correspond closely to these shifts in composition.
Regional and incumbent composition by phase (proportion of wines, Top 100).

Phase I is dominated by the Old World (46.1%) and the U.S. (37.4%), with limited participation from other countries. Only 1% of wines originate from the New–New World, and fewer than 8% from other New World producers. In Phase II, New–New World representation increases to 7.5%, Old World rises to 50.5%, and the U.S. share declines modestly. By Phase III, changes are smaller: Old World share increases slightly to 52.3%, New World falls to 38.5%, and New–New World reaches 8.9%.
A similar pattern holds for incumbency. France, Italy, the U.S., and Australia account for 92.4% of wines in Phase I. This declines to 77.2% in Phase II and 73.7% in Phase III. Although Australia’s rising share is visible in the data, the incumbent classification remains time-invariant to maintain comparability with earlier studies. By Phase III, non-incumbents consistently account for a stable share of the list.
Turnover provides an additional measure of year-to-year movement in representation. The turnover measure used here is adapted from the portfolio rebalancing literature, where it captures the extent of year-to-year adjustment in asset weights. Formally, annual turnover is defined as one-half of the sum of absolute changes in country shares across consecutive years, that is,  ${\text{Turnove}}{{\text{r}}_t} = \frac{1}{2}\mathop \sum \limits_c \mid {s_{c,t}} - {s_{c,t - 1}}\mid $, where ${s_{c,t}}{\text{ }}$denotes the share of country $c$ in the Top 100 list in year $t$. The factor of one-half avoids double-counting simultaneous increases and decreases in shares and yields a bounded measure between zero and one. This definition follows the standard treatment of turnover in the portfolio performance evaluation literature (Grinblatt and Titman, Reference Grinblatt and Titman1989).
Turnover is comparatively high and similar in the first two phases, with means of 0.172 in Phase I and 0.168 in Phase II. In Phase III, turnover declines to 0.092, indicating substantially less annual reallocation in country representation. A Kruskal–Wallis test confirms that differences across the three phases are statistically significant (χ 2 = 10.056, p = 0.0066). These patterns complement the earlier results on concentration: Phases I and II exhibit relatively high annual movement, while Phase III shows reduced variability. Concentration remains low not because of the continued expansion of participating countries but because the broader set of contributors exhibits less year-to-year change. Given that list composition reflects editorial judgment as well as underlying market dynamics, these patterns should be interpreted descriptively rather than mechanistically.
V. Market structure and price formation across phases
The structural breaks identified earlier suggest that 1988–1997, 1998–2015, and 2016–2025 correspond to distinct periods in pricing and concentration. Before presenting the regression results, it is important to clarify the estimation strategy. Because the dataset consists of 38 annual observations, conventional time-series techniques such as ARIMA, ARDL, VAR, or cointegration models are not appropriate; these methods require substantially longer series and tend to perform poorly in small samples. Moreover, the Bai–Perron structural break tests already capture the relevant low-frequency shifts. For these reasons, the analysis relies on robust regressions with phase indicators and on a simple long-run association between prices and concentration, which together provide the most reliable econometric summary given the structure of the data.
To assess whether real prices and market concentration differ systematically across the structural phases, the analysis estimates robust regressions with Phase I as the default phase. Columns (1) and (2) of Table 2 report these phase-level comparisons for real prices and concentration, respectively.
Robust regression results: structural phases, market concentration, and real prices (1988–2025)

Notes: Robust standard errors in parentheses. *** p < 0.01, ** p < 0.05, * p < 0.10.
Real prices decline monotonically across phases. Relative to Phase I, prices are significantly lower in Phase II (−0.1369, p < 0.05) and lower still in Phase III (−0.2635, p < 0.01). A Wald test confirms that the Phase III coefficient differs significantly from that of Phase II (F = 5.11, p < 0.05), indicating an additional downward shift in real prices after the mid-2010s.
Market concentration exhibits a sharper break. As shown in column (2) of Table 2, concentration declines substantially in Phase II (−0.1545, p < 0.001) and remains at a similarly low level in Phase III (−0.1521, p < 0.001). A Wald test detects no statistically significant difference between the Phase II and Phase III coefficients (F = 0.07, p = 0.796), suggesting that diversification occurred during Phase II and subsequently stabilized. The high R2 in this specification reflects a mechanical relationship between the dependent variable and the phase indicators, since the phase boundaries are themselves constructed from structural break tests applied to closely related concentration and share series. Accordingly, this regression should be interpreted as a descriptive summary of phase-level differences rather than an explanatory model.
While columns (1) and (2) focus on discrete phase comparisons, column (3) of Table 2 examines the long-run association between real prices and market structure over the full 1988–2025 sample. In this specification, higher concentration is positively associated with higher real prices (1.2999, p < 0.01), whereas the real exchange rate does not exhibit a statistically significant relationship with prices. Unlike the phase regressions, this model does not include phase indicators and is intended to capture a broad correlation rather than period-specific shifts.
Taken together, these results indicate that the three-period segmentation identified in the structural break analysis is reflected in both average real price levels and concentration patterns. Prices are lower in periods with lower concentration, and continued price declines occur even though concentration does not fall further. Given the limited number of annual observations, these regressions summarize long-run associations and should not be interpreted as evidence of causal relationships.
VI. Discussion and conclusion
This note shows that the evolution of the Wine Spectator’s Top 100 lists from 1988 to 2025 aligns with a three-phase structure rather than a smooth long-run trajectory. Prices, concentration, regional composition, and turnover each exhibit patterns that correspond closely to the structural breaks identified through Bai–Perron tests. These patterns provide a consistent framework for interpreting long-run changes in the composition of the U.S. premium wine market.
The first phase (1988–1997), documented in Gokcekus and Fargnoli (Reference Gokcekus and Fargnoli2007), is characterized by strong representation from France and other incumbents. Concentration is highest, New–New World participation is minimal, and turnover is elevated. Regression results indicate that this period corresponds to the highest real prices, consistent with the positive association between concentration and pricing.
Phase II (1998–2015), as shown in Gokcekus and Lee (Reference Gokcekus and Lee2014), features the most substantial changes in regional representation. Italy, Spain, and Portugal (New–Old World) expand their presence, and New–New World producers gain a more consistent share. Concentration declines sharply, turnover remains high, and real prices fall relative to Phase I. These shifts occur during a period when a broader diversification of contributing regions is also evident.
Phase III (2016–2025) exhibits less year-to-year movement in regional representation: turnover declines noticeably, concentration remains at the lower level reached in Phase II, and real prices continue to fall despite the absence of additional changes in concentration. This pattern is consistent with the possibility that broader structural pressures in the U.S. wine market, including demographic shifts, slowing consumption growth, and changing preferences among younger consumers (Asimov, Reference Asimov2025), may also contribute to pricing dynamics, although such mechanisms cannot be evaluated with the available data.
A salient feature of Phase III is that the Wine Spectator’s Top 100 is an editorial construct rather than a mechanical reflection of production volumes or market shares. The combination of sharply reduced turnover alongside persistently low concentration may therefore point to an institutional maturation of the selection process itself. As reviewer coverage broadened over earlier decades, the set of regions and producers receiving regular attention likely expanded; once this globalization effect was largely absorbed, fewer genuinely “new” entrants may have remained to generate substantial year-to-year reshuffling in country representation. Changes in editorial leadership and reviewer composition may also be relevant in this regard. Phase III overlaps with transitions among managing editors, including Harvey Steiman and Thomas Matthews, as well as shifts in reviewer assignments and regional specialization. Such developments could have contributed to a more stable equilibrium in representation without necessarily implying any retrenchment toward traditional incumbents.
An alternative, but not mutually exclusive, interpretation emphasizes broader market forces rather than editorial mechanisms. Convergence in wine quality across regions, together with cost compression and productivity gains in premium wine production, may have reduced dispersion in perceived quality among countries represented in the Top 100. On the demand side, the U.S. premium wine segment may have entered a more mature phase, characterized by a wide but relatively stable set of high-quality international offerings and less frequent reallocation of consumer attention across regions. Given the reliance on annual aggregates and a limited time series, these editorial and market-side channels cannot be disentangled empirically. The Phase III patterns should therefore be read as descriptive evidence of a stabilized configuration rather than as support for any single causal explanation.
Taken together, the findings extend earlier JWE studies by applying structural break tests to a longer panel and by documenting how changes in concentration, composition, and pricing align temporally. While causality cannot be inferred from annual aggregates, the observed patterns suggest that most of the long-run diversification in the Top 100 lists occurred prior to the mid-2010s, after which the distribution of contributing regions shows comparatively limited movement.
Beyond these specific period-level dynamics, the overall trajectory of the Top 100 lists points to a clear long-run pattern. The ranking has shifted from a highly concentrated, incumbent-dominated configuration toward a broadly diversified and more stable international structure, all while maintaining a remarkably constant quality distribution. Real prices have declined throughout the sample, first in tandem with falling concentration and later in ways that suggest additional forces at work once regional composition stabilized. In practical terms, the evidence paints a coherent picture of a market that has completed its major globalization adjustments: consumers now face a mature, globally diversified Top 100 in which no single country bloc dominates, quality remains stable, and real prices are lower than at any earlier stage in the 38-year record.
An open question is whether the Phase III pattern reflects an equilibrium specific to Wine Spectator’s editorial process or a broader outcome in the U.S. premium wine market. The available data do not allow for a clean distinction between these interpretations, nor do they permit strong causal claims. Nonetheless, the joint presence of low concentration, reduced turnover, stable quality, and continued real price declines is consistent with the possibility that the market has entered a more mature, post-globalization phase, in which both editorial selection and underlying market conditions may exhibit greater stability.
Whether this pattern persists is uncertain. The Trump administration’s tariffs on European wines represent a notable policy intervention, but the sample does not provide sufficient post-tariff observations to evaluate potential long-run effects.
Acknowledgements
Generative AI tools were used solely for language polishing and formatting assistance. The referee is gratefully acknowledged for particularly helpful suggestions that substantially improved the clarity, interpretation, and presentation of the manuscript.


 Open access