




1. Introduction
Seoul Korean stops have received considerable attention due to their typologically rare three-way contrast, but their acoustic properties in word-medial position remain relatively understudied (but see Han Reference Han1996 on the acoustics of intervocalic tense and lax stops). The three-way laryngeal contrast involves lax /p t k/, tense /p* t* k*/, and aspirated /pʰ tʰ kʰ/ stops that are all voiceless, at least in phrase-initial position (e.g., Jun Reference Jun1993). Other languages with a three- or four-way laryngeal contrast, such as Thai or Hindi, use both voicing and aspiration. Previous studies on Seoul Korean stops have primarily focused on phrase-initial stops (e.g., Silva Reference Silva1992; Jun Reference Jun1993; Kim Reference Kim2004; Kang & Han Reference Kang and Han2013; Kang Reference Kang2014; Bang et al. Reference Bang, Sonderegger, Kang, Clayards and Yoon2018, among many others). The main focus in the past decades has been the sound change in Seoul Korean which can be characterized as a Voice Onset Time (VOT)-merger and fundamental frequency (f0)-divergence between lax and aspirated categories in phrase-initial positions. Except for inter-sonorant voicing of lax stops (e.g., Silva Reference Silva1992; Jun Reference Jun1993; Han Reference Han2000), word-medial stops have been far less studied.
To gain a more comprehensive understanding of the phonetic implementation of Seoul Korean stops, it is crucial to examine how the stops are realized across different prosodic positions. To this end, the current study explores the acoustic properties associated with Seoul Korean stops in three prosodic contexts: Intonational Phrase (IP)-initial, inter-sonorant Accentual Phrase (AP)-initial, and inter-sonorant word-medial positions, with a particular focus on word-medial position. The IP typically corresponds to a major syntactic boundary, such as a clause or a sentence. The AP in Korean is a prosodic unit between the IP and the phonological word, defined as ‘a phonological phrase determined by a tonal pattern within a sentence’ (Jun Reference Jun1994: 102, see Jun Reference Jun1993, Reference Jun1998, for more details). While IP is typically marked with phrase-final lengthening and often followed by a pause, AP is demarcated with tonal patterns without a lengthening or a pause (Jun Reference Jun1998, among others). The following sections mainly focus on the use of different acoustic properties in the Seoul Korean stop contrast. While our primary emphasis is on Seoul Korean patterns, we refer to cross-linguistic tendencies when relevant.
1.1. VOT, post-stop f0, and sound change
VOT and post-stop f0 are the two main acoustic properties distinguishing phrase-initial stops in contemporary Seoul Korean. Historically, the three-way laryngeal contrast was maintained solely by VOT. Earlier analyses describe tense stops as having short VOT and high f0, lax stops as having intermediate (longer than tense, but shorter than aspirated) VOT and low f0, and aspirated stops as having the longest VOT and high f0 (e.g., Kim Reference Kim1965; Kagaya Reference Kagaya1974; Kim Reference Kim1994; Cho, Jun & Ladefoged Reference Cho, Jun and Ladefoged2002). In contemporary Seoul Korean, however, the contrast between lax and aspirated stops in the beginning of an AP and all higher prosodic units is achieved primarily through post-stop f0 such that the lax stops have a lower f0 than both the aspirated and tense stops (e.g., Kim Reference Kim2000, Reference Kim2008; Choi Reference Choi2002; Kim Reference Kim2004; Silva Reference Silva2006; Kang & Guion Reference Kang and Guion2008; Kong, Beckman & Edwards Reference Kong, Beckman and Edwards2011; Oh Reference Oh2011; Lee & Jongman Reference Lee and Jongman2012; Kang Reference Kang2014; Bang et al. Reference Bang, Sonderegger, Kang, Clayards and Yoon2018; Kang, Schertz & Han Reference Yoonjung, Schertz, Han, Cho and Whitman2022). At the same time, VOT for aspirated stops has shortened while VOT for lax stops has lengthened, resulting in substantial overlap between the two. VOT for tense stops has remained stable over the last eighty years, as reported by Kang and Han (Reference Kang and Han2013)’s longitudinal study, and the f0 following tense stops remains similar to the higher f0 following aspirated stops (e.g., Kim Reference Kim2004; Kang & Han Reference Kang and Han2013; Kang Reference Kang2014; Byun Reference Byun2016; Bang et al. Reference Bang, Sonderegger, Kang, Clayards and Yoon2018; Gao, Yun & Arai Reference Gao, Yun and Arai2021).
As most of the previous investigations on the Seoul Korean stops have heavily focused on phrase-initial stops, the process of VOT-merger and f0-divergence has often been called quasi-tonogenesis–“quasi” because the process is limited to phrase-initial positions. However, it is not yet conclusive whether this sound change could extend beyond phrase-initial positions. Two factors appear to be related to the progression of this sound change in Korean stops: (1) speaker gender and (2) vowel height. First, as is commonly observed in many sound changes (e.g., Labov Reference Labov2011, among others), younger female speakers lead this change in production (e.g., Kang & Guion Reference Kang and Guion2008; Byun Reference Byun2016; Bang et al. Reference Bang, Sonderegger, Kang, Clayards and Yoon2018). In perception as well, listeners seem to be attuned to this gender-based phonetic variation and weigh f0 more heavily when listening to stimuli produced by female speakers (Kong et al. Reference Kong, Beckman and Edwards2011). Second, lax and aspirated stops in non-high vowel contexts exhibit a greater f0 difference and VOT neutralization than those in high vowel contexts (Bang et al. Reference Bang, Sonderegger, Kang, Clayards and Yoon2018). According to Bang et al. (Reference Bang, Sonderegger, Kang, Clayards and Yoon2018), this points to the origin of the sound change in non-high vowel contexts where VOT tends to be shorter and intrinsic f0 tends to be lower (see Whalen and Levitt Reference Whalen and Levitt1995 for a discussion of the intrinsic f0 of vowels). These findings lead to the prediction that if the sound change is spreading to word-medial positions, word-medial stops produced by young female speakers and in non-high vowel contexts may show the most advanced state, characterized by greater differences in f0 and/or more similar VOT between lax and aspirated stops.
Non-phrase-initial positions, including both word-initial (but phrase-medial) and word-medial, have received relatively little attention. Choi, Kim and Cho (Reference Choi, Kim and Cho2020) report that in AP-medial, word-initial position, the role of f0 as the contrastive acoustic property between lax and aspirated stops depends largely on whether the word is focused or unfocused. When focused, the f0 difference between AP-medial aspirated and lax stops is similar to that observed in AP-initial positions. When unfocused, however, the difference is considerably reduced, though it still remained statistically significant.
For stops in word-medial positions, lax stops have been found to have shorter VOT than those in phrase-initial positions (Ahn Reference Ahn2018; Silva Reference Silva1992), and aspirated stops to have higher f0 than tense or lax stops (Kim, Lee & Lotto Reference Kim, Lee and Lotto.2003). Previous studies have also shown that the AP-initial boundary tone, that is, the laryngeal category of the AP-initial segment, can influence the realization of f0 on subsequent syllables (Jun Reference Jun1998). For example, Silva (Reference Silva2006) observes that the second syllable of an AP headed by a lax stop has lower f0 than one headed by an aspirated or tense stop. Kang (Reference Kang2014) reports the same pattern, noting that this difference in f0 is more pronounced in younger speakers. Cho and Lee (Reference Cho and Keating2016) further report that this effect extends across the entire AP, raising or lowering the f0 of all following syllables, at least in APs composed of up to five syllables. These studies, however, did not systematically control for the laryngeal category of the onset consonants of the subsequent syllables. Ahn (Reference Ahn2018) directly addresses this question and reports that the f0 following word-medial stops depends on the f0 following the preceding, AP-initial stop. Specifically, AP-initial aspirated and tense stops raise, and AP-initial lax stops lower the f0 of the following stop, regardless of the second stop’s laryngeal category. This suggests that the effects of the prosodic structure exert a stronger influence than consonant-induced f0 variation (see also Jun Reference Jun1998). Together, these findings suggest a potential interplay between the prosodic structure, such as focus or tonal demarcation of AP, and the use of f0 as the distinguishing property for stop laryngeal contrast, calling for further investigation of word-medial stops.
1.2. Stop closure: duration and voicing
1.2.1. Inter-sonorant voicing of lax stops
Stops in Seoul Korean are generally assumed to be underlyingly voiceless (see Cho Reference Cho, Jun and Ladefoged2016 for a review), yet lax stops are often realized as phonetically voiced between two sonorants. This inter-sonorant voicing occurs only within an AP such that AP-initial lax stops are not voiced even when they are preceded by a sonorant (Jun Reference Jun1993). Some have argued that this process is phonological, characterized by an assimilatory lenition (e.g., Silva Reference Silva1992), while others have claimed that the process is gradient and phonetic (e.g., Jun Reference Jun1994; Han Reference Han2000). Whether this inter-sonorant voicing is a phonological or phonetic process is beyond the scope of the current study. Therefore, we present here an overview of previous empirical findings on the inter-sonorant voicing of lax stops, focusing on the issues related to how phonetic voicing has been measured.
Previous studies have shown that inter-sonorant lax stops can be voiced to varying extents, and the degree of voicing differs based on multiple factors, including those related to the stops themselves (e.g., place of articulation, Silva Reference Silva1992) or their phonological contexts, such as flanking vowels (Jun Reference Jun1994; Han Reference Han2000), whether the following segment is a vowel or a nasal (Silva Reference Silva1992), and the laryngeal configuration of the AP-initial consonant (Jun Reference Jun1994). Moreover, lax stops produced at faster vs. slower speech rates (Jun Reference Jun1994) or focused vs. unfocused condition (Choi et al. Reference Choi, Kim and Cho2020) show different degrees of voicing. Finally, individual speakers differ in how much voicing they produce (Han Reference Han2000). It is important to note that these previous studies differ in how they measure the degree of voicing. For example, Jun (Reference Jun1994) reports the proportion of stop voicing by counting how many tokens are fully or partially voiced. Silva (Reference Silva1992) reports two measures related to the duration of the voiced portion during stop closure, namely percentage of voicing and voicing duration, which will be discussed further below. Han (Reference Han2000) measures the mean voicing duration during closure and categorizes each token into four categories based on how much voicing is present. Ahn (Reference Ahn2018) also measures both closure voicing and closure duration and categorizes the stops into voiced, partially voiced, and voiceless tokens. Choi et al. (Reference Choi, Kim and Cho2020) use a cut-off of 50% to label a token as ‘substantially voiced’. Across these studies, tokens categorized as ‘partially voiced’ can span a wide range of acoustic variation.
Silva (Reference Silva1992), in his investigation of labial stops in phrase-initial, word-initial, and word-medial positions produced by five male Korean speakers, uses two acoustic measures to examine inter-sonorant voicing: the absolute voicing duration and the percentage of closure voicing. As closure duration and percentage of voicing are inversely related, stops comparable in their absolute voicing duration can end up differing greatly in the percentage voiced. In Silva (Reference Silva1992), for example, voicing duration is similar in phrase-initial and word-initial positions; however, the percentage of voicing is greater in word-initial position than in phrase-initial position due to the shorter closure duration in the former context. Silva’s findings underscore that the absolute voicing duration and the percentage of voicing during closure should not be used interchangeably. When determining whether stops are ‘more voiced’ in some contexts than others, it is crucial to specify whether it pertains to a longer duration of absolute voicing or a greater voiced proportion of the closure.
Additionally, Silva (Reference Silva1992) reports that Seoul Korean lax stops have a greater percentage of voicing after nasals than after vowels. This effect of the preceding context has also been reported in American English in which the obstruents following a nasal stop have longer voiced proportions than those after other non-nasal sonorants, such as vowels and approximants (Davidson Reference Davidson2016). As post-nasal voicing may have an inherently different phonetic motivation (e.g., Hayes Reference Hayes1996), the nasality of the preceding sonorant should also be considered when investigating the inter-sonorant voicing of Seoul Korean lax stops.
This issue of how to measure voicing arises cross-linguistically, with similar patterns of variation in inter-sonorant voicing observed in languages such as American English (Davidson Reference Davidson2016; Fulop & Scott Reference Fulop and Scott2021), Glasgow English (Sonderegger et al. Reference Sonderegger, Jane Stuart-Smith, Macdonald and Rathcke2020), and Japanese (Gao & Arai Reference Gao and Arai2019; Tanner et al. Reference Tanner, Sonderegger and Stuart-Smith2020). Depending on their research goals, studies differ in how they quantify voicing during closure and whether they assign categorical labels or measure voicing as a continuous variable. For example, Davidson (Reference Davidson2016) and Fulop and Scott (Reference Fulop and Scott2021) both detect the percentage of unvoiced frames during the closure but diverge in their approach. While Davidson (Reference Davidson2016) identifies four different types of partially voiced inter-sonorant stops, Fulop and Scott (Reference Fulop and Scott2021) treat voicing as a continuous measure. Tanner et al. (Reference Tanner, Sonderegger and Stuart-Smith2020) use a binary categorization as either voiced or voiceless. Gao and Arai (Reference Gao and Arai2019) calculate voicing ratio in two different ways: the duration of voicing relative to the duration of the entire stop as well as the duration of voicing relative to the closure duration. In the present study, we adopt a continuous approach to voicing, focusing on the degree of voicing itself rather than assigning categorial labels, as our goal is not to determine whether Korean stops are phonologically voiced but to characterize the phonetic realization of voicing.
1.2.2. Aspirated and tense stops
Unlike lax stops, aspirated or tense stops are not described as participating in inter-sonorant voicing, and thus, have been less examined in medial positions. However, the few studies that report voicing measures of non-lax stops indicate that they may be at least partially voiced in medial positions. For example, in Silva (Reference Silva1992), word-medial aspirated and tense stops have shorter absolute voicing than lax stops (mean absolute voicing duration for /p/: 43 ms; /ph/: 14 ms; /p*/: 14 ms). When the percentage of voicing was considered, due to longer closure durations of non-lax stops (mean closure duration for /p/: 48 ms; /pʰ/: 84 ms; /p*/: 123 ms), the difference between lax vs. non-lax stops becomes even greater. Choi et al. (Reference Choi, Kim and Cho2020) report the percentage of voicing for AP-medial (but word-initial) lax and aspirated stops in focused and unfocused contexts, showing that aspirated stops are occasionally produced with more than 50% voicing in both focused (4%) and unfocused (16%) contexts. While some degree of passive carryover voicing is expected in any intervocalic obstruent, it is unlikely that the passive voicing extends to more than half of the stop closure. This calls for a more systematic investigation on voicing of inter-sonorant stops in Seoul Korean, including not only the lax stops but also the aspirated and tense stops.
1.2.3. Closure duration
Closure duration is not only relevant for determining the percentage of voicing but may also serve as an important acoustic property related to the laryngeal contrast of Seoul Korean stops. For example, Silva (Reference Silva1992) and Ahn (Reference Ahn2018) have reported that inter-sonorant lax stops have a much shorter closure duration than tense or aspirated stops. In Schertz et al. (Reference Schertz, Cho, Lotto and Warner2015), AP-initial tense stops exhibit the longest closure duration, followed by aspirated, and then lax. Prosodic contexts also influence closure duration, as expected under the domain-initial strengthening hypothesis (e.g., Cho Reference Cho and Aranoff2021). For instance, word-medial lax stops have shorter closure duration than word-initial lax stops (Ahn Reference Ahn2018). Interestingly, however, tense stops are often found to have a longer closure duration in word-medial positions than in phrase-initial positions. While this finding has led some researchers to analyze tense stops as geminates (Oh & Johnson Reference Oh and Johnson1997; Cho & Keating Reference Cho and Lee2001), it suggests that the variation in closure duration may reflect a mechanism other than prosodic strengthening.
1.3. Other acoustic properties
1.3.1. H1-H2
Previous research on Seoul Korean stops has identified additional phonetic properties related to the stops’ laryngeal contrast. One such property is H1-H2, an acoustic correlate of phonation type. In phrase-initial positions, tense stops have been consistently found to exhibit very low or negative H1-H2 (Cho et al. Reference Cho, Jun and Ladefoged2002; Kong et al. Reference Kong, Beckman and Edwards2011; Kang et al. Reference Yoonjung, Schertz, Han, Cho and Whitman2022), associated with creaky phonation. Aspirated stops, on the other hand, have been found to have relatively high H1-H2, indicating breathiness (Kang & Guion Reference Kang and Guion2008; Lee & Jongman Reference Lee and Jongman2012; Kang et al. Reference Yoonjung, Schertz, Han, Cho and Whitman2022). Lax stops have been reported to have H1-H2 values either very similar to aspirated stops (Park Reference Park2002b; Kong et al. Reference Kong, Beckman and Edwards2011; Kang et al. Reference Yoonjung, Schertz, Han, Cho and Whitman2022), intermediate between those of tense and aspirated stops (Kang & Guion Reference Kang and Guion2008; Lee & Jongman Reference Lee and Jongman2012) or higher than those of aspirated stops (Cho et al. Reference Cho, Jun and Ladefoged2002). Little has been reported on the phonation patterns of word-medial stops. Park (Reference Park2002b) observed highly similar H1-H2 values for word-medial tense and lax stops in data from three speakers. In contrast, Ahn (Reference Ahn2018) observes a pattern consistent with phrase-initial stops for the two speakers examined.
1.3.2. First formant frequency (F1)
Both Shimizu (Reference Shimizu1990) and Park (Reference Park2002a) have reported that the stop’s laryngeal category affects the F1 of the post-stop vowel. In both studies, an utterance-initial tense stop lowers the F1 of the following /a/. In word-medial positions, Park (Reference Park2002a) has reported that both lax and tense stops induce a lower F1 than aspirated stops. Park (Reference Park2002a) has also observed a positional variation: F1 trajectory following a lax stop patterns together with that following an aspirated stop in phrase-initial positions, but rather with that following a tense stop in word-medial positions. This could be explained by the F1 cut-back effect (Stevens Reference Stevens2000), i.e., when burst/aspiration is long, F1 is only visible after the formant transition, resulting in a higher F1 at voicing onset. According to Shimizu (Reference Shimizu1990) and Park (Reference Park2002a), this is why aspirated and lax stops pattern together in phrase-initial positions where they show similar VOT, but not in word-medial positions where lax stops have much shorter VOT than aspirated stops. However, Shimizu (Reference Shimizu1990) has reported an opposite pattern for the high vowel /u/ such that post-tense F1 is higher than post-lax/aspirated F1, which cannot be explained with F1 cut-back. Due to the paucity of data regarding the effects of stop laryngeal category on the following vowel’s F1, it remains to be confirmed whether F1 is a consistent acoustic property across different vowels.
1.4. Current study
The main goal of this study is to investigate the acoustic realizations of Seoul Korean lax, tense, and aspirated stops in three different prosodic positions. We aim to clarify how the phonetic manifestation of the laryngeal contrast varies across three prosodic positions, and whether the tonogenesis-like sound change observed phrase-initially may extend to medial positions. Specifically, we ask the following research question: How is the Seoul Korean laryngeal contrast acoustically realized in different prosodic positions, namely, IP-initial, AP-initial, and word-medial positions? This overarching question is explored through the following sub-questions:
-
Q1. Does the advanced f0-divergence and VOT-merger observed particularly for female speakers and in non-high vowels in initial positions extend to word-medial positions?
-
Q2. Do other phonetic correlates of the stop laryngeal contrast beyond post-stop f0 or VOT also show positional variation conditioned by speaker sex and vowel height?
-
Q3. How is voicing realized (or not realized) for all three stop categories in AP-initial and word-medial positions?
To answer these questions, we conducted two quantitative studies. Study 1 is a controlled lab-based production experiment with nine native speakers of Seoul Korean (section 2) and Study 2 is an analysis of the speech of fifteen female speakers from the Speech Corpus of Reading-Style Seoul Korean, collected by the National Institute of the Korean Language (NIKL) in 2005 (section 3). In both studies, we report on the following acoustic properties: f0, F1, H1*-H2* (all three spectral measures taken at 30% into the post-stop vowel), burst duration (instead of VOT, see 2.1.4.2 for more details), closure duration, and both proportion and absolute duration of closure voicing. Stops in both AP-initial and word-medial positions were always between two sonorants.
Studies 1 and 2 are designed to examine different aspects of the Q1 and Q2. Specifically, Study 1 examines the influence of speaker sex and Study 2 focuses on the effects of vowel height. Study 1 first tests whether the stops produced in a controlled setting vary between female and male speakers across prosodic contexts. Study 2 analyzes female speakers only, allowing for a more in-depth investigation of vowel context effects in a different speech style (i.e., read speech).
The speakers in the two studies were similar in their birth year and they were of similar ages—ranging from their early 20s to early 30s—at the time of recording. Specifically, speakers in Study 1 were born between 1983 and 1990 and recorded in 2016, whereas the speakers we analyzed in Study 2 were born between 1974 and 1984 and recorded in 2003. As such, we do not expect systematic differences due to diachronic change between the two groups. While we do not intend to make diachronic comparisons, the different recording contexts allow us to assess how comparable the production patterns are across speech styles.
Table 1 summarizes previous findings on each acoustic property across different prosodic positions examined in the current study. Prior studies have generally reported similar acoustic patterns for IP- and AP-initial stops except for the properties related to stop closure which cannot be reliably measured in IP-initial contexts. While inter-sonorant voicing of lax stops is typically limited to within an AP (e.g., Jun Reference Jun1998), Silva (Reference Silva1992) shows that AP-internal word-initial stops and word-medial stops differ in terms of inter-sonorant voicing, with voicing more prevalently observed in word-medial than word-initial ones. Building on this, the current study centers on IP-initial positions, inter-sonorant AP-initial positions, and inter-sonorant word-medial positions to assess differences in acoustic measures.
Summary of results for each acoustic property based on previous literature.

2. Study 1: Production experiment
In this section, we report the findings from the production experiment. The data were collected alongside articulatory data (ultrasound tongue imaging) for a separate study. As the focus of this study is on the acoustic properties of the laryngeal contrast, only the acoustic data are presented here.
2.1. Methodology
2.1.1. Stimuli
The target sounds were stops in three places of articulation (labial, alveolar, velar) and three laryngeal categories (lax, tense, aspirated). Each target sound was placed in three different prosodic positions: IP-initial, inter-sonorant AP-initial, and inter-sonorant word-medial positions. The target stop was followed by the low vowel /a/. This resulted in a total of 27 items, shown in Table 2. Each item was repeated 10 times, resulting in a total of 270 tokens per participant.
Target words and phrases produced in Study 1.

As some stops rarely occur underlyingly in word-medial positions, we used stops derived by liaison rules, such as the tensification of post-obstruent stop (in case of word-medial /t*/, e.g., Jun Reference Jun1998) and underlying lax stop+/h/ or /h/+lax stop merger (in case of /pʰ tʰ kʰ/, e.g., Kang & Lee Reference Kang and Lee2019). This was to avoid using less frequent phrases in the stimuli. Since previous studies (Kang & Lee Reference Kang and Lee2019; Kwon & Ahn Reference Kwon and Ahn2024) have shown that derived tense and aspirated stops are acoustically indistinguishable from underlying ones, the derived stops were treated as equivalent to their underlying counterparts. For these derived stops, we include both the underlying and the derived pronunciations in Table 2.
2.1.2. Participants
The data was collected in 2016. Nine self-reported native speakers (4 male, 5 female) of Seoul-Gyeonggi Korean in their 20-30s (mean = 30.8 years) participated. All participants were born in Korea and reported Korean as their first language. They were perceived by the second author (a trained phonetician and native Seoul Korean speaker) as fluent speakers of Seoul Korean with no discernible accent though they all spoke English as a second language with varying levels of proficiency. Seven participants were students in the US when they participated, and two of them (1F, 1M) were visiting the US for travel. Participants were compensated $15 USD for their participation.
2.1.3. Procedure
The recording session took place in a sound-attenuated booth in the Phonetics and Experimental Phonology Laboratory at New York University. After signing the consent form and filling out the demographic questionnaire, they were seated in the sound booth and the ultrasound transducer was placed under their chin for the articulatory data collection. An Audio Technica condenser microphone powered by an Aphex preamplifier was placed near the side of the participants’ mouth to avoid sound distortion due to aspiration. The stimuli were provided in Korean orthography on paper. Each item was repeated ten times, once per block, in a different randomized order in each block. The participants were instructed to read the phrases as naturally as possible. The entire recording session took about 30 minutes. The audio data were recorded alongside the ultrasound data and saved as AVI files using ADOBE Premiere on a Windows PC computer. The audio recordings were then extracted from the AVI files for acoustic analysis. All further analysis reported in this study is based solely on the acoustic signals.
2.1.4. Analysis
2.1.4.1. Annotation
The extracted audio recordings were annotated in Praat (Boersma & Weenink Reference Boersma and Weenink2023). For each target stop, the following acoustic landmarks were annotated: the onset of the stop closure, the release of the stop closure, the onset and offset of voicing during closure and the onset and offset of the post-stop vowel. The onset of the closure was not annotated for IP-initial stops due to the lack of reliable acoustic information. For the remaining stops, the onset of closure was determined by visually inspecting the spectrogram and the waveform. The onset of the post-stop vowel was determined by the appearance of F2 in the spectrogram. The onset and offset of voicing during the closure was determined through visual inspection of the spectrogram and waveform, guided by the Pulse function in Praat. The default voicing threshold (0.45) often marks pulses even during post-release aspiration, and thus a more conservative threshold of 0.6 was adopted to avoid detecting spurious voicing. Several tokens were produced without a discernible release or closure (as they were lenited), in which cases, the onset and the offset of the consonantal constrictions were annotated (see section 2.2.2 for more details). All recordings were separately annotated by two annotators and the tokens on which the two annotators disagreed were discussed case by case.
2.1.4.2. Acoustic measures
We took four duration measurements (burst duration, closure duration, voicing duration, and proportion voiced) and three spectral measurements (post-stop f0, F1, H1*-H2*) for each target stop.
Burst duration (ms) was calculated as the interval between the release of the stop closure and the onset of voicing (or of F2 when the stop was pre-voiced). We used burst duration instead of the more commonly used VOT because it captures the aspiration-like or breathy-voiced release bursts of the stops regardless of whether they are (partially) voiced during closure. As a considerable portion of word-medial lax stops were pre-voiced, using burst duration allowed us to include tokens with negative VOT in the same analysis while analyzing closure voicing separately. In contexts where stops are rarely pre-voiced (e.g., phrase-initially), our burst duration measure corresponds to the positive VOT reported in most prior studies. For Korean word-medial stops (e.g., Silva Reference Silva1992; Ahn Reference Ahn2018), closure voicing and post-release burst duration are typically reported separately, with the latter labeled VOT. This can be ambiguous when the stops are pre-voiced, since ‘VOT’ may refer either to voicing during closure (i.e., negative VOT) or to burst duration. To avoid this terminological ambiguity, we use the term burst duration rather than VOT.
Closure voicing (which is traditionally expressed as negative VOT) was then analyzed separately from the burst. The measures related to closure were calculated only for the subset of the entire data excluding the IP-initial stops that were also utterance-initial and thus did not yield reliable closure duration measurement. As mentioned in 1.2.1, many languages exhibit partially voiced stops and previous studies have employed various methods to measure voicing during closure or to calculate the proportion of voicing. In the current study, our goal is not to determine whether Korean stops are voiced or voiceless, but rather to examine gradient voicing patterns in Korean inter-sonorant stops. Therefore, closure duration (ms) was calculated as the time gap between the onset of the closure and the release of the stop closure, and voicing duration (ms) as the time between the onset and the cessation of voicing, either during the closure or, in the case of fully-voiced tokens, at stop release. Proportion voiced was calculated by dividing the voicing duration by the closure duration.
All spectral measures (f0, F1, and H1*-H2* ) were extracted using PraatSauce (Shue et al. Reference Shue, Keating, Vicenik and Yu2011; Kirby Reference Kirby2018) at the timepoint 30% into the post-stop vowel. The mean f0 and F1 for each speaker were calculated and values 2.5 SDs above or below the mean were excluded. Remaining extreme values were visually inspected and the tokens resulting from tracking errors were removed. This removed a total of 13% (n=317/2426) of f0 values, 70% of which were tense stops. Remaining f0 values were converted to semitones using the package hqmisc (Quené Reference Quené2014). H1-H2 values derived from the excluded f0 values were also excluded from further analysis. H1-H2 values were then corrected for formant frequency and bandwidths, following Hawks and Miller (Reference Hawks and Miller1995) and Iseli and Alwan (Reference Iseli and Alwan2004) and are reported as H1*-H2*.
To facilitate by-speaker comparison, all spectral measures (f0, F1, and H1*-H2*), but not the durational measures, were normalized by speaker using z-scores. For ease of interpretation, the z-scores were then converted back to the original scales, using the group mean and standard deviation. The subsequent statistical analyses and data visualization of the spectral measures used these normalized-and-scaled-back values, ensuring that the model estimates remained interpretable in the original acoustic units while maintaining model stability.
2.1.4.3. Statistical models
A series of linear mixed effect models were built to test how the stops of different laryngeal categories are realized in different prosodic positions, in terms of each acoustic measure: post-stop f0, F1, H1*-H2*, burst duration, closure duration, voicing duration, and proportion voiced. The three models on the closure-related measures (i.e., closure duration, voicing duration, and proportion voiced) were fitted to the subset of the entire data that did not include the IP-initial stops.
Each of these measures was analyzed in separate models with the predictors being the LARYNGEAL category of the stops (aspirated, lax, tense), the PLACE of articulation (labial, alveolar, velar), the prosodic POSITION (IP-initial, AP-initial, word-medial), the SEX of the speakers (female, male), and their interactions. All factors were simple-coded and the reference levels are bolded. As our goal was to capture the potentially complex interaction patterns among laryngeal contrast and prosodic structure, the initial maximal models included the four-way interaction among predictors. The interaction structure was simplified in a stepwise fashion by eliminating those that did not improve the model fit, determined by the model comparisons based on AIC. This approach allowed us to achieve a balance between model complexity and interpretability, especially in the underexplored word-medial context. For random effects, by-SPEAKER random intercept was included, along with a random slope (either for POSITION or LARYNGEAL) that allowed the model to converge and yielded the best model fit. By-ITEM random intercept was excluded for two reasons: (1) the models included the three-way interaction LARYNGEAL * PLACE * POSITION, and each combination corresponds to a single item; and (2) the models did not converge with both by-SPEAKER and by-ITEM intercepts and thus the by-SPEAKER random effect that explained more variance was retained. No model with more than one random slope converged, and therefore the single most effective random slope was included in the final model. The final models for each dependent variable and their outcomes are in Appendix A.
The significant interaction terms were further analyzed with post-hoc Tukey tests. In the following sections, we focus on the interaction term directly related to our research questions (i.e., LARYNGEAL* POSITION) based on the results of these post-hoc tests. All statistical analyses were done in R (R Core Team 2013), using the lmerTest (Kuznetsova, Brockhoff & Christensen Reference Kuznetsova, Brockhoff and Christensen2017), and emmeans (Lenth & Piaskowski Reference Lenth and Piaskowski2022) packages.
F0 across laryngeal categories, prosodic positions, and speaker sex. Boxplots represent empirical distributions; triangles and error bars indicate model predictions and 95% confidence intervals.

2.2. Results
2.2.1. Spectral measures
2.2.1.1. F0
The f0 data (both the empirical distributions and model predictions) are plotted in Figure 1. The 95% confidence intervals shown for the model predictions were calculated using the default t-based (Wald) method implemented in emmeans. Post-hoc analyses on the significant interaction POSITION * LARYNGEAL * SEX (Table A1) revealed that the stops were reliably distinguished by their post-stop f0 phrase-initially (both IP-initial and AP-initial), but less so word-medially.
In IP-initial positions, post-stop f0 was significantly different between aspirated and lax stops [βfemale = 10.9, t(2034) = 39.3, p < .001; βmale = 10.2, t(2035) = 31.7 p < .001], aspirated and tense stops [βfemale = 2.7, t(2037) = 7.5, p = .001; βmale = 3.6, t(2041) = 9.8, p < .001], and tense and lax stops [βfemale = –8.2, t(2036) = –23.4, p < .001; βmale = –6.6, t(2039) = –18.4, p < .001]. In AP-initial positions, a similar pattern was observed [aspirated-lax: βfemale = 10.6, t(2034) = 38.8, p < .001; βmale = 11.8, t(2040) = 36.7, p < .001; aspirated-tense: βfemale = 3.4, t(2040) = 11.1, p < .001; βmale = 4.2, t(2037) = 12.8, p < .001; tense-lax: βfemale = –7.2, t(2040) = –23.8, p < .001; βmale = –6.6, t(2039) = –18.4, p < .001]. In word-medial positions, the differences were of a smaller magnitude but still significant. For female speakers, aspirated stops had greater post-stop f0 than lax stops [β = 3.6, t(2035) = 12.7, p < .001] and tense stops [β = 2.5, t(2035) = 8.8, p < .001], while tense stops had a higher post-stop f0 than lax [β = –1.0, t(2035) = –3.6, p < .001]. For male speakers, aspirated stops had a higher post-stop f0 than lax stops [β = 2.9, t(2035) = 9, p < .001] but not tense stops [p = .9]. Tense stops had a higher post-stop f0 than lax stops [β = –2.8, t(2035) = –8.8, p < .001].
F0 in word-medial stops across laryngeal categories, AP-initial boundary tones, and speaker sex. Boxplots represent empirical distributions; triangles and error bars indicate model predictions and 95% confidence intervals.

The AP-initial segment is known to influence the f0 of subsequent syllables, due to the high or low boundary tone associated with different segments (e.g., Jun Reference Jun1998). This influence needs to be taken into account when interpreting the word-medial f0 patterns. To this end, we conducted a sub-analysis on word-medial stops, comparing those appearing in high and low boundary tone contexts. In this sub-analysis, we included only aspirated and lax stops given that all word-medial tense stops in the current study were in APs headed by a lax stop and thus could not be compared to tense stops in high boundary tone contexts.
For this sub-analysis, the subset of the data including word-medial aspirated and lax stops was statistically analyzed following the same procedure described in Section 2.1.2, but with the predictor POSITION replaced by BOUNDARY TONE (high, low). A by-SUBJECT random slope for BOUNDARY TONE was included. This model revealed a significant LARYNGEAL * BOUNDARY TONE * SEX interaction (Table A2). As Figure 2 shows, aspirated stops had significantly higher post-stop f0 than lax stops in both boundary tone contexts and for both sexes [high tone: βfemale = 3.7, t(482) = 6.6, p < .001; βmale = 2.6, t(481) = 4.1, p < .001; low tone: βfemale = 3.3, t(482) = 4.2, p < .001; βmale = 2.9, t(483) = 3.2, p = .001]. This outcome suggests that the observed f0 difference between aspirated and lax stops in word-medial position is not solely attributable to the AP-initial boundary tone, but rather reflects a genuine difference in post-stop f0 associated with the laryngeal category of the stop.
2.2.1.2. F1
The F1 model (Table A3) also revealed a significant three-way interaction among POSITION * LARYNGEAL * SEX (see Figure 3). Post-stop F1 seems to be a less reliable cue for the three-way laryngeal contrast, particularly for male speakers who distinguished the stops using post-stop F1 less than the female speakers. For female speakers, in phrase-initial positions (including both IP-initial and AP-initial), tense stops had lower post-stop F1 than aspirated stops [βIP-initial = 125.7, t(1961) = 8.4, p < .001; βAP-initial = 101.8, t(1980) = 6.8, p < .001] and lax stops [βIP-initial = 158.4, t(2005) = 10.9, p < .001; βAP-initial = 136.3, t(2005) = 9.1, p < .001], while aspirated and lax stops did not differ significantly. Male speakers produced tense stops with a lower F1 than aspirated in IP-initial position [β = 54.4, t(12001) = 3.6, p = .001] but not in AP-initial position [p = .9]. Male speakers’ lax and tense stops did not differ significantly in phrase-initial positions. This corroborates previous finding that tense stops had the lowest F1 for /a/ (Park Reference Park2002a; Shimizu Reference Shimizu1990). In word-medial positions, female speakers’ lax stops patterned together with tense stops while aspirated stops had higher post-stop F1 than both lax stops [β = 133.9, t(2004) = 9.0, p < .001] and tense stops [β = 136.6, t(2005) = 9.5, p < .001], again similar to Park (Reference Park2002a)’s findings. Male speakers showed a similar but less robust pattern: aspirated stops had higher F1 than lax stops [β = 64.0, t(2004) = 9.5, p < .001] but did not significantly differ from tense stops [p = .06].
F1 across laryngeal categories, prosodic positions, and speaker sex. Boxplots represent empirical distributions; triangles and error bars indicate model predictions and 95% confidence intervals.

2.2.1.3. H1*-H2*
The H1*-H2* model (Table A4) revealed significant interactions between POSITION * LARYNGEAL and SEX * LARYNGEAL, as plotted in Figure 4. Post-hoc pairwise comparisons showed distinct patterns for female and male speakers. Male speakers showed consistent patterns across all prosodic contexts such that aspirated stops had greater H1*-H2* (i.e., more breathy) than lax stops [βIP-initial = 3.9, t(2070) = 8.8, p < .001; βAP-initial = 3.4, t(2073) = 7.7, p < .001; βword-medial = 7.1, t(2069) = 16.2, p < .001] and tense stops [βIP-initial = 4.9, t(2074) = 9.7, p < .001; βAP-initial = 7.5, t(2078) = 16.2, p < .001; βword-medial = 6.8, t(2072) = 15.1, p < .001] while lax stops had a higher H1*-H2* than tense stops only in AP-initial position [β = 4.1, t(2078) = 9, p < .001]. On the other hand, for female speakers, phrase-initially, lax stops did not differ from aspirated stops [p’s > 0.5] but had greater H1*-H2* than tense stops [βIP-initial = 3.0, t(2079) = 6.1, p < .001; βAP-initial = 6.1, t(2077) = 13.8, p < .001]. This difference remained in word-medial position as well, with lax stops having greater H1*-H2* than tense stops [β = 1.7, t(2074) = 3.9, p < .001]. However, female speakers’ word-medial lax stops had significantly lower H1*-H2* (i.e., were less breathy) than aspirated stops [β = 3.3, t(2070) = 8, p < .001]. Across all prosodic contexts, female speakers produced greater H1*-H2* for aspirated stops than for tense stops [all p’s < 0.001].
H1*-H2* across laryngeal categories, prosodic positions, and speaker sex. Boxplots represent empirical distributions; triangles and error bars indicate model predictions and 95% confidence intervals.

2.2.2. Duration measures
In this section, we report results of the analyses on burst duration, closure duration, voicing duration, and proportion voiced. The three analyses related to the stop closure were conducted on the subset of the data excluding the IP-initial stops. Additionally, a small subset of non-IP-initial lax stops in our data, primarily in word-medial position, were lenited to fricatives or approximants with no recognizable burst or closure (No closure + No burst in Table 3). This type of lenition was most common in velar stops (one speaker even lenited some AP-initial velar stops). Figure 5 and Figure 6 show examples of this type of lenition. Some word-medial labial and velar stops had a closure but were produced without clear bursts (Closure + No burst in Table 3). These stops were voiced during closure, as shown in Figure 7. All tokens in Table 3 were excluded from the burst analysis. The No closure + No burst tokens were excluded from all three closure analyses. None of the IP-initial stops were lenited.
The number of lenited lax stops in Study 1, excluded from duration analyses

Example of word-medial /k/ realized as an approximant, without closure or burst.

Example of AP-initial /k/ realized as a fricative, without closure or burst.

Example of word-medial /p/ that is fully voiced and produced without discernible burst.

2.2.2.1. Burst duration (release + aspiration, if any)
Excluding the stops produced without bursts, the burst duration analyses (Table A5) revealed a significant interaction among POSITION * LARYNGEAL * SEX (see Figure 8). Post-hoc pairwise comparisons revealed nearly identical patterns for female and male speakers. In all phrase-initial positions (both IP-initial and AP-initial), speakers did not distinguish aspirated and lax stops [all p’s > 0.2], while they produced tense stops with significantly shorter burst durations than lax and aspirated stops [all p’s < 0.001]. In word-medial positions, the difference between lax and tense stops was not significant [all p’s > 0.7], and both lax and tense stops had significantly shorter burst duration than aspirated stops [all p’s < 0.001].
Burst duration across laryngeal categories, prosodic positions, and speaker sex. Boxplots represent empirical distributions; triangles and error bars indicate model predictions and 95% confidence intervals.


2.2.2.2. Closure analyses: AP-initial and word-medial stops
Excluding stops produced without a closure, a significant interaction among POSITION * LARYNGEAL * SEX was observed in the models for closure duration (Table A6), voicing duration (Table A7), and proportion voiced (Table A8).
First, in the closure duration model, tense stops consistently had significantly longer closure duration (the blue + pink bars in Figure 9) than lax stops across positions and sexes [AP-initial: βfemale = –53.2, t(7.5) = –8.1, p < .001; βmale = –43.6, t(7.5) = –5.9, p = .001; word-medial: βfemale = –97.6, t(7.6) = –14.8, p < .001; βmale = –76.9, t(7.6) = –10.4, p < .001]. Aspirated stops also had longer closure duration than lax stops in word-medial positions [βfemale = 73.8, t(7.4) = 9.3, p < .001; βmale = 55.1, t(7.4) = 6.2, p < .001], but in AP-initial position only for female speakers [β = 32.9, t(7.4) = 4.2, p = .009]. Finally, aspirated stops had shorter closure durations than tense stops in both positions for both sexes [AP-initial: βfemale = –20.3, t(12.3) = –7.9, p < .001; βmale = –10, t(12.3) = –3.5, p = .01; word-medial: βfemale = –23.8, t(12.3) = –9.3, p < .001; βmale = –21.8, t(12.3) = –7.56 p < .001]. Both aspirated and tense stops also had longer closure durations word-medially than AP-initially [p < .001], whereas lax stops did not show such positional difference.
Second, the voicing duration (the pink bars in Figure 9) did not differ among stops of different laryngeal categories in AP-initial positions for female speakers [all p’s > 0.1]. AP-initially, male speakers’ aspirated stops had shorter voicing durations than both lax [β = –5.1, t(1291) = –4.9, p < .001] and tense stops [β = –4.0, t(1291) = –3.9, p < .001]. On the other hand, in word-medial position, lax stops had significantly longer voicing than aspirated stops [βfemale = –15.9, t(1293) = –15.6 p < .001; βmale = –18.6, t(1294) = –15.5, p < .001] and tense stops [βfemale = 12.9, t(1291) = 14.2 p < .001; βmale = 20, t(1295) = 16.1, p < .001]. Only female speakers produced aspirated stops with shorter voicing duration than tense stops word-medially [β = –3.0, t(1292) = –2.9, p = .009]. In terms of the position effects, AP-initial lax stops exhibited shorter voicing duration than word-medial ones [βfemale = –13.8, t(9.2) = –7, p < .001; βmale = –11.7, t(9.4) = –5.3, p < .001]. Female speakers’ aspirated and tense stops did not show the position effects. For male speakers, tense stops were produced with longer voicing duration in AP-initial position than in word-medial position [β = 7.3, t(11.3) = 3.1, p = .009].
Finally, lax stops consistently had a greater proportion voiced than both aspirated and tense stops, regardless of the speaker’s sex in both AP-initial and word-medial positions [p < .001]. Also, word-medial lax stops exhibited greater proportion voiced than AP-initial lax stops [βfemale = 0.29, t(9.2) = 6.7, p < .001; βmale = 0.18, t(9.4) = 3.6, p = .005]. Aspirated stops did not differ between the two positions and only male speakers’ tense stops had a greater proportion voiced in AP-initial than in word-medial position [β = 0.13, t(11.3) = 2.5, p = .03].
2.2.3. Summary of findings and interim discussions
Table 4 summarizes the experimental findings. The findings reveal several noteworthy patterns. First, the two phrase-initial positions (IP-initial and AP-initial) showed nearly identical patterns across all measures, except for closure-related measures for which we do not have data for the IP-initial stops. Second, the contrast between aspirated and tense stops was consistent in word-medial and phrase-initial positions, indicating this contrast is largely unaffected by the prosodic position. In contrast, the phonetic implementations of lax stops appear to be sensitive to their position in phrases. Lax stops were distinguished from tense stops by their burst duration and closure duration in phrase-initial positions, but from the aspirated in word-medial positions. In addition, for F1 in female speakers, lax stops patterned together with aspirated stops phrase-initially and with tense stops word-medially. Female speakers produced similar H1*-H2* for lax and aspirated stops across all positions while male speakers showed an overall stable grouping of tense and lax stops across contexts. Finally, proportion voiced, rather than absolute voicing duration, distinguished lax and non-lax stops more consistently across different prosodic positions. Particularly in AP-initial positions, the proportion voiced difference between lax and non-lax stops was due to the short closure duration rather than an increased voicing duration of lax stops. Only lax stops showed a significantly longer voicing duration in word-medial position than AP-initial position.
To summarize, the results of Study 1 suggest that female speakers exhibit slightly different acoustic patterns from male speakers, especially regarding how lax stops are realized across prosodic positions. This seems to be in line with previous research suggesting that young female speakers are more advanced in ongoing sound changes in general (e.g., Labov Reference Labov2011) and this quasi-tonogenetic change in Seoul Korean in particular (e.g., Bang et al. Reference Bang, Sonderegger, Kang, Clayards and Yoon2018). We note, however, that the relatively small number of speakers in Study 1 may limit the generalizability of these findings, especially those involving sex-based comparisons. As such, the observed patterns should be interpreted with caution.
Summary of the findings from Study 1 (A = aspirated, L = lax, T = tense)

3. Study 2: Corpus
Building on the sex differences observed in Study 1, Study 2 focuses on young female speakers, a demographic group reported to lead the tonogenesis-like sound change in Seoul Korean (e.g., Bang et al. Reference Bang, Sonderegger, Kang, Clayards and Yoon2018). To better understand the role of each acoustic property in the most innovative speech, we investigated young female speakers’ productions in the Speech Corpus of Reading-Style Seoul Korean (NIKL 2005). We also included an additional variable of vowel height, based on the prior findings that the sound change originated and is most advanced in non-high vowel contexts (e.g., Bang et al. Reference Bang, Sonderegger, Kang, Clayards and Yoon2018).
3.1. Methodology
3.1.1. Tokens and speakers
Data were extracted from the Speech Corpus of Reading-Style Seoul Korean (NIKL 2005). The corpus consists of recordings of essays, stories, and novel excerpts read by Seoul Korean speakers in Seoul recorded in 2003 and published in 2005. Of the twenty young female speakers available, fifteen were randomly selected for acoustic analysis. The speakers were 19-29 years old at the time of recording.
Target words included three places of articulation (bilabial, alveolar, and velar) and four vowels (two high: /i/ and /u/, and two non-high: /a/ and /ʌ/). As with the experimental data in Study 1, three prosodic positions were investigated: IP-initial, AP-initial, and word-medial. IP-initial tokens were exclusively at the beginning of an utterance or after a long pause (greater than 200 ms), typically corresponding to a comma in the written text. AP-initial tokens were always IP-medial and were never preceded by a pause. Both AP-initial and word-medial tokens always followed a sonorant (vowel, nasal, or liquid). See Table B1 in Appendix B for the full list of target words.
Given the limitations of working with a corpus, the number of distinct words per condition was unbalanced, ranging from zero to three. Aspirated and tense stops in IP-initial positions were particularly under-represented. Most tokens were in word-medial position, which is the primary focus of the current study. Each speaker contributed 231 tokens. After removing mispronounced tokens or those with a devoiced vowel, acoustic measures were taken from a total of 3,390 tokens (approximately 226 per speaker).
3.1.2. Analysis
Corpus data were annotated and analyzed following the same procedures as in Study 1 (section 2.1.4), with minor modifications to statistical modeling due to the nature of the data. Correction of pitch-tracking errors led to the exclusion of 6% (n = 215/3390) of f0 values, 48% of which were tense stops. The statistical models for the corpus data included the following predictors: LARYNGEAL category of the stops (aspirated, lax, tense), PLACE of articulation (labial, alveolar, velar), prosodic POSITION (IP-initial, AP-initial, word-medial), and VOWEL HEIGHT (high, non-high), and their interactions. The model for F1 contained VOWEL (/a/, /i/, /u/, /ʌ/) as a predictor instead of VOWEL HEIGHT. Random effects included by-ITEM and by-SPEAKER random intercepts and by-SPEAKER random slopes (either for POSITION or LARYNGEAL) that led the model to converge. Final models were selected following the same method used in Study 1. The three models for closure-related measures, namely, closure duration, voicing duration, and proportion voiced, were fitted to the subset of the data that included neither the IP-initial stops nor stops with lenited variants (i.e., no closure, see Table 5 in section 3.2.2). The final models with their outcomes are presented in Appendix C (Tables C1∼C7).
Additionally, we examined the effect of the preceding segment on word-medial stops. While most word-medial stops were preceded by vowels, 21% followed a nasal (/n/, /m/, or /ŋ/) and 8% followed a liquid (/l/). Given this imbalance, only post-nasal and post-vocalic stops were compared. To determine how the preceding segment may influence the voicing of the following stop, we built three additional statistical models including the PRECEDING SEGMENT as a predictor (vowel, nasal). Due to the great imbalance of differing combinations of place of articulation and vowel height, only LARYNGEAL, along with the PRECEDING SEGMENT, were included as fixed factors, and by-SUBJECT and by-ITEM intercepts, as random effects. These three models, along with their outcomes, are in Appendix C (Tables C8∼C10).
The significant interaction terms were further analyzed with post-hoc Tukey tests. The in-text results in the following section are based on these post-hoc pairwise comparisons. All statistical analyses were done in R (R Core Team 2013), using the lmerTest (Kuznetsova et al. Reference Kuznetsova, Brockhoff and Christensen2017) and emmeans (Lenth & Piaskowski Reference Lenth and Piaskowski2022) packages.
3.2. Results
3.2.1. Spectral measures
3.2.1.1. F0
Post-hoc pairwise comparisons on the significant POSITION * LARYNGEAL * VHEIGHT interaction (Table C1, Figure 10) revealed that, in both IP- and AP-initial positions and in both vowel height conditions, f0 reliably distinguished aspirated and lax stops [IP-initial: βhigh = 4.6, t(391) = 7.0, p < .001; βnon-high = 4.7, t(504) = 7.4, p < .001; AP-initial: βhigh = 4.5, t(343) = 7.6, p < .001; βnon-high = 4.8, t(326) = 8.5, p < .001], as well as tense and lax stops [IP-initial: βhigh = 3.1, t(401) = 4.5, p < .001; βnon-high = 3.2, t(415) = 5.4, p < .001; AP-initial: βhigh = 3.4, t(334) = 5.5, p < .001; βnon-high = 3.5, t(343) = 6.7, p < .001]. F0 following aspirated and tense stops was significantly different only in the AP-initial non-high vowel context [β = 1.3, t(322) = 2.5, p = .04].
F0 across laryngeal categories, prosodic positions, and vowel height. Boxplots represent empirical distributions; triangles and error bars indicate model predictions and 95% confidence intervals.

In word-medial positions, aspirated stops had a significantly higher f0 than both lax [β = 2.8, t(276) = 4.8, p < .001] and tense [β = 1.7, t(304) = 3.2, p = .005] stops, only in the non-high vowel context. No significant differences were found in the high vowel context [all p’s > 0.3]. These findings align with Bang et al.’s (Reference Bang, Sonderegger, Kang, Clayards and Yoon2018) findings on phrase-initial stops, showing that post-stop f0 differences are more pronounced in non-high vowel contexts than in high vowel contexts.
It is noteworthy that the vowel height effect was also observed in word-medial positions. However, a finer-grained analysis is needed to assess whether this pattern is influenced by the AP-initial boundary tone. To this end, an additional model was built on the subset of word-medial tokens, following the same procedure as in Study 1 but replacing the SEX predictor with the VOWEL HEIGHT predictor (Table C2). As shown in Figure 11, a significant difference in post-stop f0 was observed only in non-high vowels following a high AP-initial boundary tone. In this context, lax stops had lower f0 than aspirated stops [β = 4.1, t(93.3) = 3.1, p = .006] and tense stops [β = 5.7, t(91.5) = 3.2, p = .004]. This differs from the results of Study 1 which revealed a significant difference between aspirated and lax stops preceding a non-high vowel /a/ in both high and low AP-initial boundary tone contexts.
F0 in word-medial stops across laryngeal categories, AP-initial boundary tones, and vowel height. Boxplots represent empirical distributions; triangles and error bars indicate model predictions and 95% confidence intervals.

3.2.1.2. F1
The results for F1 are shown in Figure 12. Post-hoc analyses on the significant LARYNGEAL * POSITION * VOWEL interaction (see Table C3) revealed the following patterns. In IP-initial positions, tense stops had greater F1 than lax stops for /i/ [β = 86.2, z = 2.4, p = .05], /ʌ/ [β/ʌ/ = 94.7, z = 2.4, p = .05], and /u/ [β = 69.3, z = 2.9, p = .01], but not for /a/ [p = 0.7]. No significant differences were found between tense and aspirated stops for any vowel in IP-initial positions [all p’s > 0.2]. In AP-initial positions, tense stops had greater F1 than lax stops for /i/ [β =79.8, z = 3.0, p = .007], /u/ [β = 89.9, z = 3.9, p < .001], and /ʌ/ [β = 180.1, z = 8.6, p < .001], but again, not for /a/ [p > 0.8]. AP-initially, tense stops also had significantly greater F1 than aspirated stops in /a/ [β = 74.5, z = 3.3, p = .002] and /ʌ/ [β = 100.8, z = 4.9, p < .001]. In word-medial positions, no significant F1 differences were observed for any vowel [all p’s > 0.1].
F1 across laryngeal categories, prosodic positions, and vowel quality. Boxplots represent empirical distributions; triangles and error bars indicate model predictions and 95% confidence intervals.

To sum, tense stops had consistently higher F1 than lax stops phrase-initially in all vowels but /a/. This contrasts with the observations in Study 1 (section 2.2.1.2), which revealed greater F1 for aspirated and lax stops than tense stops for /a/ in phrase-initial positions.
3.2.1.3. H1*-H2*
The interaction LARYNGEAL * POSITION * VHEIGHT was significant (Table C4) and was further explored by post-hoc pairwise comparisons. The results revealed that H1*-H2* values were influenced not only by prosodic position but also by vowel height (see Figure 13). Specifically, in high vowel contexts, a significant difference was observed only in AP-initial position where aspirated stops had a significantly lower H1*-H2* than lax stops [β = –2.3, t(237) = 2.5, p = .03]. No significant differences were found between stops in other positions when followed by a high vowel [all p’s > 0.05]. In non-high vowel contexts, however, tense stops had a lower H1*-H2* than both aspirated and lax stops in IP-initial [βaspirated = –4.6, t(683) = –2.7, p = .02; βlax = –4.7, t(232) = 5.1, p < .001] and AP-initial positions [βaspirated = –6.9, t(161) = –7.6, p < .001; βlax = –7.4, t(170) = –9.6, p < .001]. No significant differences were observed between aspirated and lax stops preceding non-high vowels in either IP-initial or AP-initial position [all p’s > 0.8]. In the word-medial non-high vowel context, aspirated stops had greater H1*-H2* than both lax [β = 4.3, t(181) = 5.3, p < .001] and tense [β = 5.6, t(129) = 6.9, p < .001] stops, while lax and tense stops did not differ significantly [p = .2].
H1*-H2* across laryngeal categories, prosodic positions, and vowel height. Boxplots represent empirical distributions; triangles and error bars indicate model predictions and 95% confidence intervals.

3.2.2. Duration measures
The durations of the stop burst, closure, and voicing were analyzed following the same procedure as in Study 1. As before, IP-initial stops were excluded from the closure and voicing analyses. Similar to Study 1, a small subset of non-IP-initial lax stops was produced with no discernible burst, and in some cases, further lenited and produced with no closure, as summarized in Table 5. All tokens in Table 5 were excluded from the burst analysis and the tokens lacking both closure and burst (No closure + No burst) were excluded from the closure and voicing analyses.
The number of lenited lax stops in Study 2, excluded from duration analyses

3.2.2.1. Burst duration (release + aspiration if any)
As shown in Figure 14, the burst duration model (Table C5) revealed that aspirated stops had significantly longer burst duration than lax stops in all three prosodic positions preceding high vowels [βIP-initial = 18.1, z = 5.3, p < .001, βAP-initial = 20.2, z = 6.8, p < .001; βword-medial = 30.9, z = 11.6, p < .001]. When preceding non-high vowels, the aspirated-lax difference was significant only in AP-initial [β = 9.5, z = 3.3, p = .003] and word-medial positions [β = 17.3, z = 6.2, p < .001] but not in IP-initial positions. As expected, tense stops had a significantly shorter burst duration than both lax and aspirated stops in phrase-initial positions regardless of the following vowel [all p’s < 0.001] but the tense-lax difference was not significant in word-medial positions in either vowel context [all p’s > 0.2].
Burst duration across laryngeal categories, prosodic positions, and vowel height. Boxplots represent empirical distributions; triangles and error bars indicate model predictions and 95% confidence intervals.

The current findings provide a more nuanced understanding of the VOT merger between lax and aspirated stops, namely that the merger is observed only in IP-initial positions preceding non-high vowels. While this outcome is consistent with Bang et al.’s (Reference Bang, Sonderegger, Kang, Clayards and Yoon2018) findings, it differs from the experimental results in Study 1, which examined stops in the /a/ context and found no significant burst duration difference between aspirated and lax stops in both IP- and AP-initial positions. This discrepancy suggests that the phonetic implementation of these stops may also be influenced by speech style and experimental context (controlled laboratory setting vs. story reading).
3.2.2.2. Closure analyses: AP-initial and word-medial stops
The results of the closure analyses are visually demonstrated in Figure 15. Post-hoc pairwise comparisons were conducted on the significant interaction of POSITION * LARYNGEAL. The three-way interaction including VOWEL HEIGHT was not significant (see Table C6). In both prosodic positions, tense stops had significantly longer closure duration than aspirated [βAP-initial = 17.3, t(161) = 3.7, p < .001; βword-medial = 13.1, t(163) = 3.9, p < .001] and lax [βAP-initial = 40.9, t(166) = 10.2, p < .001; βword-medial = 51.8, t(168) = 16.41 p < .001] stops, and aspirated stops were also produced with a longer closure duration than lax stops [βAP-initial = 23.6, t(161) = 5.5, p < .001; βword-medial = 38.7, t(165) = 11.3, p < .001]. When comparing stops of the same laryngeal categories across positions, only aspirated stops had a significantly longer closure duration in word-medial positions than in AP-initial positions [β = 10.9, t(164) = 2.4 p = .02].

For absolute voicing duration (Table C7), the POSITION * LARYNGEAL interaction was significant, but again, VOWEL HEIGHT did not significantly interact with them. Post-hoc comparisons on the significant interaction revealed no differences among laryngeal categories in AP-initial positions [all p’s > 0.8]. In word-medial positions, however, lax stops were produced with significantly longer voicing duration than aspirated stops [β = 7.1, t(77.4) = 2.9, p = .01]. In terms of the positional effect, both aspirated and tense stops had a significantly shorter voicing duration in word-medial than in AP-initial positions [βaspirated = 6.3, t(196) = 2.7, p = .007; βtense = 5.6, t(190) = 2.5, p = .01]. No significant positional effect was observed for lax stops.
For proportion voiced (Table C8), the three-way interaction POSITION * LARNGEAL * VHEIGHT was significant. Post-hoc comparisons indicated that, regardless of the vowel height, lax stops consistently showed a greater proportion voiced than aspirated [βhigh vowel = 18.3, t(188) = 2.8, p = .02; βnon-high vowel = 25.7, t(165) = 4.2, p < .001] and tense [βhigh vowel = 28.4, t(191) = 4.2, p < .001; βnon-high vowel = 24.3, t(171) = 5.6, p < .001] stops in AP-initially, as well as word-medially [aspirated: βhigh vowel = 53.8, t(160) = 9.2, p < .001; βnon-high vowel = 38.7, t(160) = 6.5, p < .001; tense: βhigh vowel = 53.1, t(163) = 9.5, p < .001; βnon-high vowel = 47.8, t(170) = 8.6, p < .001]. Proportion voiced of tense and aspirated stops did not differ significantly in any position or vowel context.
As previous studies have shown that the segment preceding word-medial stops can influence the degree of voicing during the closure (Silva Reference Silva1992; Hayes Reference Hayes1996; Davidson Reference Davidson2016), we further compared word-medial stops preceded by vowels and nasals (see 3.1.2). The data are presented in Figure 16. In the three separate statistical models (Tables C9∼C11) on closure duration, voicing duration, and proportion voiced, the interaction between PREVIOUS SEGMENT * LARYNGEAL was significant. Post-hoc comparisons showed that all post-nasal stops had significantly shorter closure duration than their post-vocalic counterparts [βaspirated = –28.3, t(88) = –5.9, p < .001; βlax = –17.4, t(86) = –3.1, p = .003; βtense= –25.7, t(84) = –4.8, p < .001]. Only post-nasal aspirated and tense stops had significantly longer voicing duration than those in post-vocalic position [βaspirated = 9.7, t(87) = 2.6, p = .01; βtense= 8.8, t(79) = 2.1, p = .03]. Finally, all post-nasal stops had a greater proportion voiced than their post-vocalic counterparts [βaspirated = 26.2, t(88) = 4.1, p < .001; βlax = 24.1, t(85) = 3.2, p = .002; βtense =18, t(81) = 2.6, p = 0.02].

3.2.3. Summary of findings
Table 6 summarizes the findings of Study 2. Overall, the results of Study 2 largely aligned with those of Study 1, with the exception of F1 values. There were, however, a few noteworthy differences. First, Study 2 incorporated an additional variable of vowel height. Across many acoustic properties, differences among laryngeal categories were generally greater in non-high vowel contexts than high vowel contexts. Notably, significantly higher H1*-H2* values were observed for aspirated and lax stops, compared to tense, only in non-high vowel contexts. Also, in terms of burst duration, no significant difference was observed between aspirated and lax stops in IP-initial positions preceding non-high vowels. However, aspirated stops had longer burst duration than lax stops in AP-initial positions, differing from the experimental data in Study 1. Finally, the F1 values of the tense stop were significantly higher than those of lax stops in all vowels except /a/ in phrase-initial positions. This also differs from the observations of Study 1, which considered only the low vowel /a/ and found that female speakers produced IP- and AP-initial tense stops with lower F1 than both aspirated and lax stops.
Summary of findings from Study 2. (A = aspirated, L = lax, T = tense; vowel contexts are indicated in parentheses where applicable; the results that differ from Study 1 are bolded.)

4. Discussion
Overall, the results in the two studies reveal that the acoustic properties of stops differed little across IP-initial and AP-initial positions, but were generally greater in magnitude in IP-initial positions. This arguably suggests that AP-initial and IP-initial positions constitute a highly similar prosodic environment for Seoul Korean stops. The acoustic properties realizing the laryngeal contrast in word-medial positions, however, often differed from those in phrase-initial positions as discussed in the following subsections.
4.1. Post-stop f0 and burst duration across prosodic positions (Q1)
The contrast between lax and aspirated stops has been at the center of the discussion on the tonogenesis-like sound change in Seoul Korean stops, given that only these two categories have been shown to participate in the sound change. Regarding IP- and AP-initial positions, the tendencies observed consistently in the literature were replicated in this study, namely that f0 differences are more evident than VOT differences in phrase-initial position between lax and aspirated stops (Kim Reference Kim2004; Silva Reference Silva2006; Kang & Han Reference Kang and Han2013; Kang Reference Kang2014; Bang et al. Reference Bang, Sonderegger, Kang, Clayards and Yoon2018; Gao et al. Reference Gao, Yun and Arai2021; Kang et al. Reference Yoonjung, Schertz, Han, Cho and Whitman2022). In both phrase-initial positions, f0 is overwhelmingly the most important property that distinguishes lax and aspirated stops for all speakers. However, female speakers in the corpus data also showed a significantly shorter burst duration AP-initially for lax stops compared to aspirated stops. It is unclear why AP-initial stops of the female speakers in the production experiment differed from those in the corpus, but this could be due to the difference in speech style required by the tasks. Unlike the experimental task involving short sentences and phrases (see Table 2), the speakers in the corpus read literary texts (NIKL 2005). Corroborating Bang et al.’s (Reference Bang, Sonderegger, Kang, Clayards and Yoon2018) claim on the relation between the sound change and vowel height, the f0 difference between lax and aspirated stops in both phrase-initial positions is also greater in non-high vowels contexts than high-vowel contexts.
In word-medial positions, the difference in f0 is drastically reduced, and the differences in burst and closure durations appear sufficient to maintain the three-way contrast. Nevertheless, a slightly higher f0 for aspirated stops than lax (and tense) is observed in both studies. In the production experiment, both male and female speakers produce this difference regardless of whether the AP-initial boundary tone is high or low. More specifically, the AP-initial boundary tone appears to slightly raise or lower the observed f0 range but does not alter the relationship between lax and aspirated stops. This observation is consistent with the interpretation that speakers may actively maintain low f0 for lax stops even in word-medial positions. In the corpus data, which encompassed a broader range of vowel contexts than the experimental data, this f0 difference between word-medial aspirated and lax stops was not significant in high vowel contexts nor when preceded by a low AP-initial boundary tone. Crucially, a lower f0 of lax stops compared to both aspirated and tense stops was observed only in non-high vowel contexts, consistent with Bang et al.’s (Reference Bang, Sonderegger, Kang, Clayards and Yoon2018) findings in phrase-initial positions. This outcome arguably suggests that Seoul Korean speakers may be beginning to implement a low f0 target for lax stops in word-medial positions as well, with vowel height being a conditioning factor (see, though, Choi et al. Reference Choi, Kim and Cho2020 for different views on the origin and possible development of this sound change).
It should however be noted that the exact position of the target syllable within the word was not controlled for in the word-medial stops in either study, except for being non-AP-initial. Therefore, the natural prosodic contours that are applied over an entire AP (e.g., Jun Reference Jun1998) may complicate the interpretation of the results. The exact realization of the prosodic contour of an AP depends heavily on the number of syllables that the AP contains though the general structure is L/H-HLH, with the initial tone being determined by the onset of the first syllable (e.g., Jun Reference Jun1998). However, given that the majority of word-medial stops in the current study were in the second syllable of the AP (Study 1: 89%, Study 2: 79%), the small but stable f0 difference between lax and aspirated stops observed in word-medial positions in non-high vowel contexts, could be interpreted as an indication of spreading of this sound change into this lower prosodic position. Future studies that more carefully control the number of syllables and the position of the target syllable are necessary to further investigate this possibility. If this small but stable f0 difference is found across different post-initial syllables, it would provide compelling evidence for an incipient f0 contrast in word-medial position.
4.2. Additional acoustic correlates across prosodic positions (Q2)
Regarding H1*-H2*, most previous studies reported that aspirated stops were either equally as breathy as lax stops (Park Reference Park2002b; Kong et al. Reference Kong, Beckman and Edwards2011; Kang et al. Reference Yoonjung, Schertz, Han, Cho and Whitman2022) or breathier than lax stops (Kang & Guion Reference Kang and Guion2008; Lee & Jongman Reference Lee and Jongman2012), although Cho et al. (Reference Cho, Jun and Ladefoged2002) reported higher H1*-H2* values for lax stops than aspirated stops. The current findings indicate that the main role of phonation likely lies in distinguishing tense versus non-tense stops, more notably for female than male speakers, in phrase-initial than word-medial positions, and in non-high vowel than high vowel contexts. In other words, both lax and aspirated stops are produced with breathy voice, and the degree of breathiness depends on factors such as speaker sex, prosodic position, or vowel height. Specifically, in Study 1, only female speakers showed higher H1*-H2* values for aspirated and lax stops compared to tense stops, and in Study 2, both lax and aspirated stops showed consistently higher H1*-H2* values than tense stops only in IP- and AP-initial positions when preceding non-high vowels. In word-medial position, however, only aspirated stops had breathier phonation than tense stops. This distribution aligns with the previously reported advancement of the VOT merger and f0 divergence in non-high vowel contexts.
If the well-documented sound change involving VOT-merger and f0-divergence between aspirated and lax stops is more advanced in non-high (than high) vowel contexts, the greater degree of breathiness observed in non-high vowels may also be related to this sound change. That is, breathiness may arguably be developing into a potentially contrastive property for the tense versus non-tense distinction. As the sound change progresses, listeners may begin to pay more attention to vocalic cues such as pitch or breathiness than the acoustic cues realized on stop consonants, and the vocalic cues might begin to outweigh the consonantal cues. If this is the case, the lax versus non-lax contrast may be maintained by pitch while the tense versus non-tense contrast may be increasingly signaled by breathiness, both originating in phrase-initial positions, led by specific speaker groups (e.g., young female speakers). The investigation of H1*-H2* underscores the importance of examining a wide range of acoustic properties potentially relevant to Seoul Korean laryngeal contrast to understand the nature and extent of the sound change.
Finally, IP- and AP-initial tense stops preceding /a/ showed a lower F1 than lax stops in the experimental data for female speakers, consistent with Shimizu’s (Reference Shimizu1990) and Park’s (Reference Park2002a) findings. However, this pattern was only observed for male speakers’ IP-initial tense stops in Study 1 and was not observed in Study 2. In fact, the corpus data revealed that tense stops were followed by a higher F1 than lax stops for all vowels except /a/ in both IP- and AP-initial positions, while no difference was observed for /a/. The source of this discrepancy remains unclear and calls for further research. With the current knowledge, the relevance of such F1 differences to the stop laryngeal contrast remains uncertain. Further perception studies are warranted to assess whether F1 contributes meaningly to the distinction.
4.3. Closure duration and voicing duration (Q3)
In word-medial positions, aspirated stops are consistently produced with a significantly longer burst duration, longer closure duration, and lower proportion voiced than lax stops. Regarding tense stops, their short burst duration seems sufficient in distinguishing them from both lax and aspirated stops in phrase-initial positions, as repeatedly shown in previous studies (Kim Reference Kim2004; Silva Reference Silva2006; Kang & Han Reference Kang and Han2013; Kang Reference Kang2014; Bang et al. Reference Bang, Sonderegger, Kang, Clayards and Yoon2018). However, in cases where word-medial lax stops were produced with little closure voicing and very short burst duration, resulting in burst duration values similar to those of the tense stop, closure duration may serve as the sole remaining acoustic property that distinguishes tense and lax stops. This was especially observed in non-high vowel contexts.
4.3.1. Voicing duration vs. proportion voiced
Substantial closure voicing was observed for stops of all three laryngeal categories in both AP-initial and word-medial positions. Although few previous studies have examined voicing in non-lax stops, Silva (Reference Silva1992) and Choi et al. (Reference Choi, Kim and Cho2020) reported that aspirated and tense stops were sometimes realized with a brief period of voicing, likely due to carryover voicing from the preceding sonorant (Davidson Reference Davidson2016, Reference Davidson2018).
In both AP-initial and word-medial positions, lax stops were produced with longer periods of closure voicing than either aspirated or tense stops. The participants in Study 1 produced consistently longer absolute voicing durations in word-medial lax stops, while closure durations remained similar to those in AP-initial positions. This resulted in a greater proportion voiced in word-medial than AP-initial positions. In Study 2, the absolute voicing duration was nearly identical across AP-initial and word-medial lax stops. However, due to a shorter closure duration in the latter, the proportion voiced was again greater word-medially than AP-initially. In addition, stops preceded by a nasal showed a greater proportion voiced than those preceded by a vowel, primarily due to the shorter closure durations (rather than increased absolute voicing), consistent with Silva (Reference Silva1992)’s findings. The two strategies, namely a decrease in closure duration and an increase in voicing duration, seem to have a common consequence of greater proportion voiced. The current findings cautiously suggest that speakers may maintain greater proportion voiced for word-medial lax stops, rather than targeting absolute voicing duration.
In AP-initial positions, voicing duration was nearly identical across the three laryngeal categories in both datasets. Interestingly, aspirated and tense stops in Study 1, as well as aspirated stops in Study 2, exhibited a longer closure duration in word-medial positions than in AP-initial positions. Furthermore, tense stops for male speakers in Study 1 and female speakers’ aspirated and tense stops in Study 2 had a shorter absolute voicing duration word-medially than AP-initially. Despite the considerable variation, these patterns arguably suggest that speakers may actively suppress the proportion voiced for aspirated and tense stops to avoid confusion with lax stops, especially in contexts where lax stops consistently exhibit greater proportion voiced. That being said, it remains unclear whether speakers (and listeners) rely on differences in closure duration or in proportion voiced to maintain the contrast between lax and non-lax stops in medial positions. Further investigations on the perceptual relevance of voicing, particularly for medial lax stops, and on whether absolute voicing duration or proportion voiced plays a more important role, would help clarify the extent to which the observed voicing patterns are under the control of speakers.
5. Conclusion
This study provided comprehensive acoustic descriptions of Seoul Korean stops in three different positions using two datasets, with a particular focus on word-medial position. The highly important role of f0 and burst duration in distinguishing all three laryngeal categories in IP-initial and AP-initial positions was confirmed once again. However, additional phonetic properties, specifically closure duration, proportion voiced, and phonation, were also found to be relevant to the contrast, both in phrase-initial and word-medial positions. A considerable amount of inter-sonorant voicing was observed for all three stop types, primarily for lax stops in word-medial position. The observation of smaller but significant f0 differences between word-medial aspirated and lax stops, especially in the context of non-high vowels and in part conditioned by the AP-initial boundary tones, arguably suggests the possibility of the tonogenesis-like sound change extending to medial positions and merits further investigation. Future perception studies would be needed to assess the relative importance of these acoustic properties, particularly in word-medial contexts, to determine which are most perceptually relevant to listeners. Incorporating multivariate modeling approaches in future work would allow for a more comprehensive understanding of how individual acoustic properties may interact to signal the stop laryngeal contrast, especially in word-medial positions.
Acknowledgements
We would like to thank all participants in Study 1 for their participation and the National Institute of the Korean Language for providing access to the corpus material analyzed in Study 2. We would also like to thank Marc Brunelle and Tae-Jin Yoon for their help with an earlier version of Study 2, which was the first author’s MA thesis. We are especially thankful to Yoonjung Kang who generously provided assistance on the earlier version and also offered detailed and constructive comments as a reviewer of this manuscript. Finally, we thank the editor, Patrycja Strycharczuk, and the anonymous reviewers for their helpful comments. Study 1 was supported by NSF Doctoral Dissertation Research Improvement Grant BCS-1627479 to the second author. Data collection was conducted while the second author was affiliated with New York University.
Appendix A
This appendix provides the statistical models and their outcomes for Study 1.
Mixed linear regression on normalized f0. f0 ∼ POSITION* LARYNGEAL* SEX* PLACE + (1 + POSITION| SUBJECT)

Mixed linear regression on normalized f0 for Wm aspirated and lax Laryngeals. f0 ∼ LARYNGEAL * SEX * AP–INITIALTONE + (1 + AP–INITIALTONE | SUBJECT)

Mixed linear regression on normalized F1. F1 ∼ POSITION * LARYNGEAL * SEX + POSITION * PLACE + (1 + POSITION | SUBJECT)

Mixed linear regression on normalized H1*–H2* H1*–H2* ∼ POSITION * LARYNGEAL + SEX * LARYNGEAL + PLACE * POSITION +(1 + POSITION | SUBJECT)

Mixed linear regression on burst duration. Burst duration ∼ POSITION * LARYNGEAL * SEX * PLACE + (1 + LARYNGEAL | SUBJECT)

Mixed linear regression on closure duration. Closure duration ∼ POSITION * LARYNGEAL * PLACE * SEX + (1 + LARYNGEAL | SUBJECT)

Mixed linear regression on voicing duration Voicing duration ∼ POSITION * LARYNGEAL * PLACE * SEX + (1 + POSITION | SUBJECT)

Mixed linear regression on proportion voiced. Proportion voiced ∼ POSITION * LARYNGEAL * PLACE * SEX + (1 + POSITION | SUBJECT)

Appendix B
This appendix provides the word list for Study 2.
Stop tokens extracted from the Speech Corpus of Reading-Style Seoul Korean (NIKL 2005).

Appendix C
This appendix provides the statistical models and their outcomes for Study 2.
Mixed linear regression on normalized f0. F0 ∼ POSITION * LARYNGEAL * VOWEL HEIGHT + (1 + POSITION | SUBJECT) + (1 | ITEM)

Mixed linear regression on normalized f0 for Word-medial stops. f0 ∼ LARYNGEAL * VOWEL HEIGHT * AP–INITIALTONE + (1 + AP–INITIALTONE | SUBJECT) + (1 | ITEM)

Model 2: Mixed linear regression on normalized F1. F1 ∼ POSITION * LARYNGEAL * VOWEL + (1 + POSITION | SUBJECT) + (1 | ITEM)

Mixed linear regression on normalized H1*–H2*. H1*–H2* ∼ POSITION * LARYNGEAL * VOWEL HEIGHT + POSITION * LARYNGEAL * PLACE + POSITION * PLACE * VOWEL HEIGHT + (1 + LARYNGEAL | SUBJECT) + (1 | ITEM)

Mixed linear regression on burst duration. Burst duration ∼ POSITION * LARYNGEAL * VOWEL HEIGHT + LARYNGEAL * VOWEL HEIGHT * PLACE + (1 + LARYNGEAL | SUBJECT) + (1 | ITEM)

Mixed linear regression on closure duration. Closure duration ∼ POSITION * LARYNGEAL * VOWEL HEIGHT * PLACE + (1 + POSITION | SUBJECT) + (1 | ITEM)

Mixed linear regression on voicing duration. Voicing duration ∼ POSITION * LARYNGEAL * VOWEL HEIGHT + (1 + LARYNGEAL | SUBJECT) + (1 | ITEM)

Mixed linear regression on proportion voiced. Proportion voiced ∼ POSITION * LARYNGEAL * VOWEL HEIGHT + (1 + LARYNGEAL | SUBJECT) + (1 | ITEM)

Mixed linear regression on closure duration by preceding segment. Closure duration ∼ PREVIOUS SEGMENT * LARYNGEAL * POSITION + (1 + POSITION | SUBJECT) + (1 | ITEM)

Mixed linear regression on voicing duration by preceding segment. Voicing duration ∼ PREVIOUS SEGMENT * LARYNGEAL * POSITION + (1 + LARYNGEAL | SUBJECT) + (1 | ITEM)

Mixed linear regression on proportion voiced duration by preceding segment. Proportion voiced ∼ PREVIOUS SEGMENT * LARYNGEAL * POSITION + (1 + POSITION | SUBJECT) + (1 | ITEM)

Appendix D
This appendix provides plots with predicted values for closure analyses in Studies 1 and 2.
Predicted values from mixed effects model on closure duration for Study 1.

Predicted values from mixed effects model on voicing duration for Study 1.

Predicted values from mixed effects model on proportion voiced for Study 1.

Predicted values from mixed effects model on closure duration for Study 2.

Predicted values from mixed effects model on voicing duration for Study 2.

Predicted values from mixed effects model on proportion voiced for Study 2.

Predicted values from mixed effects model on closure duration by preceding segment for word-medial stops in Study 2.

Predicted values from mixed effects model on voicing duration by preceding segment for word-medial stops in Study 2.

Predicted values from mixed effects model on proportion voiced by preceding segment for word-medial stops in Study 2.

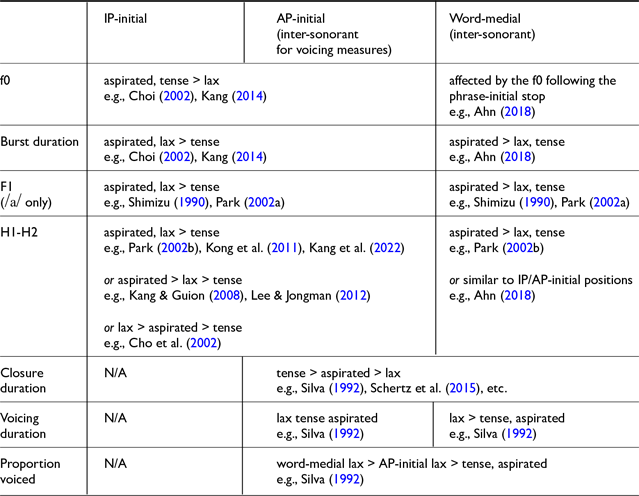
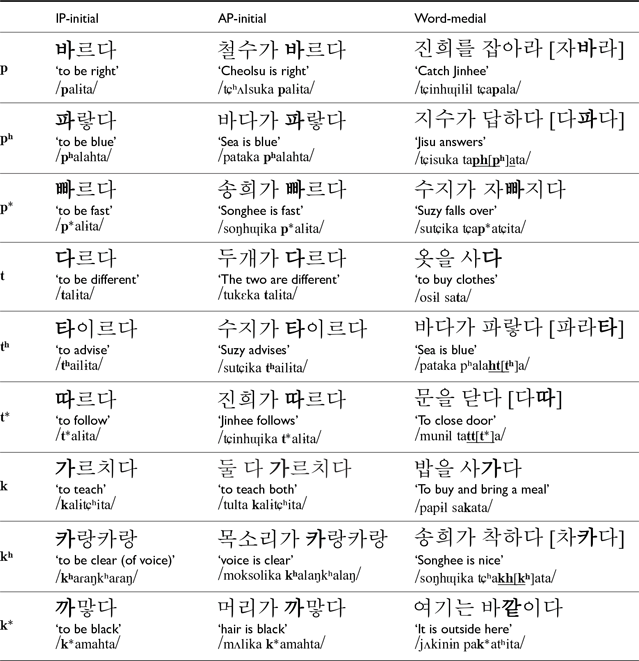

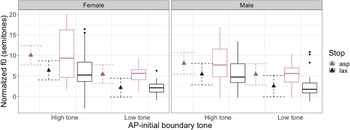

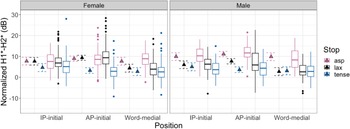
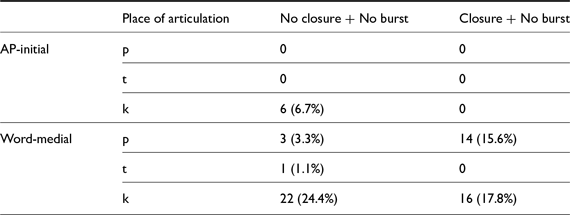


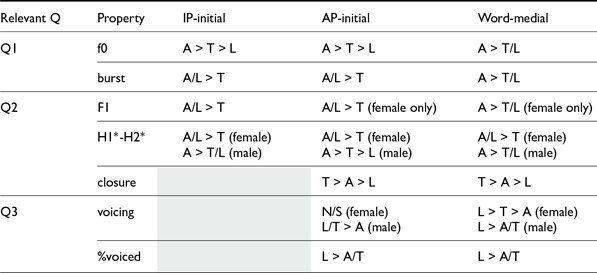


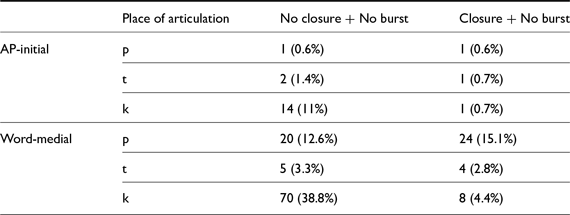


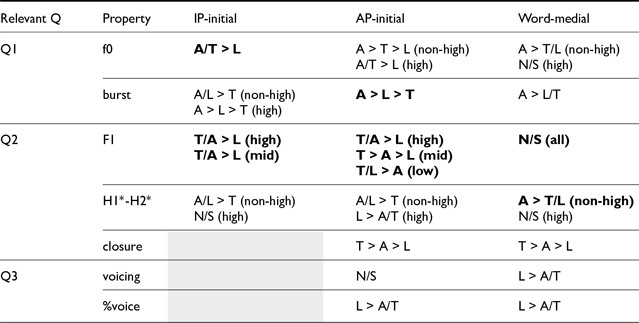
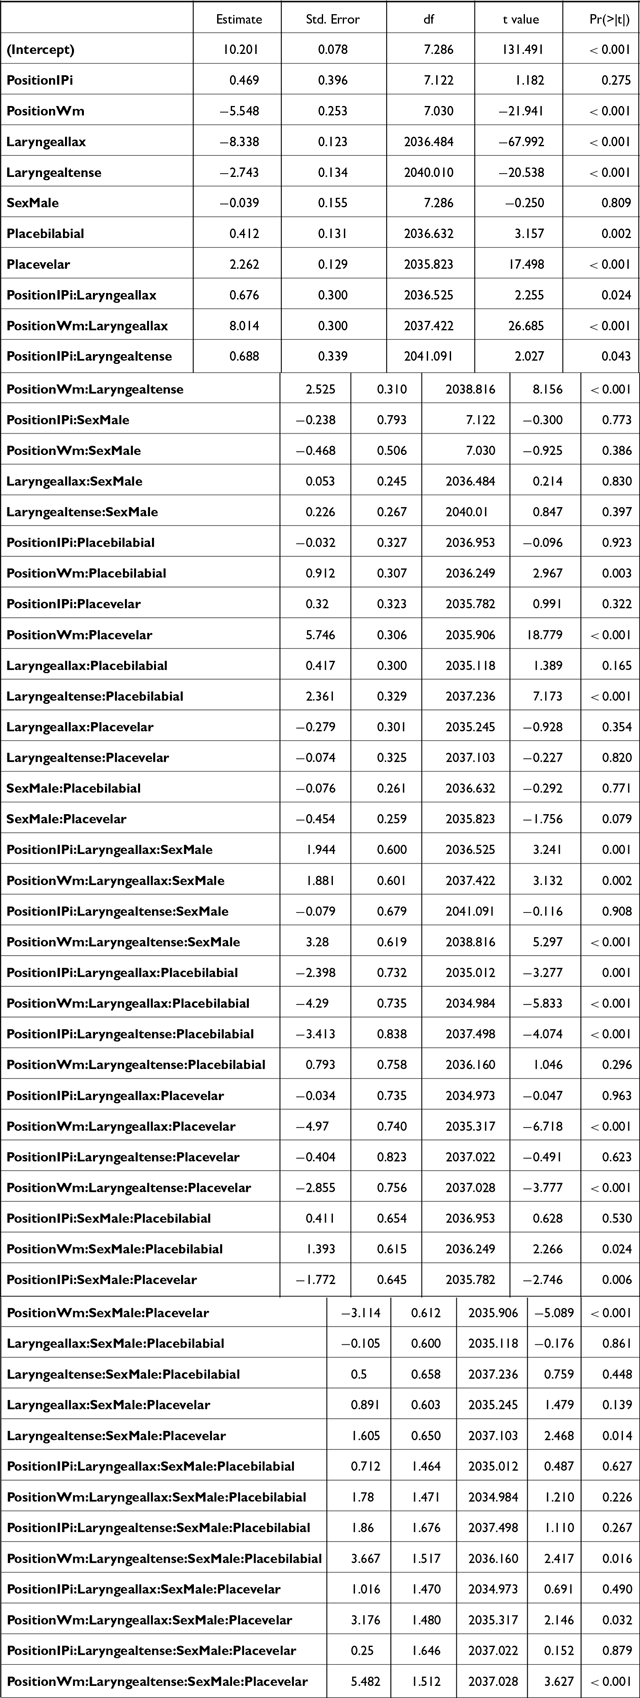
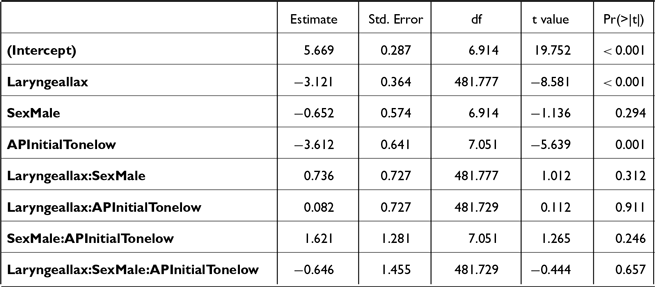
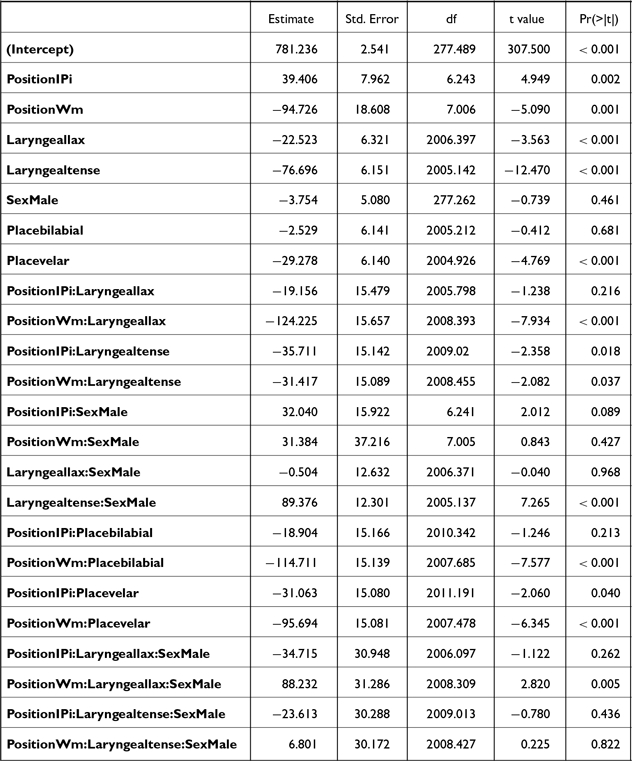
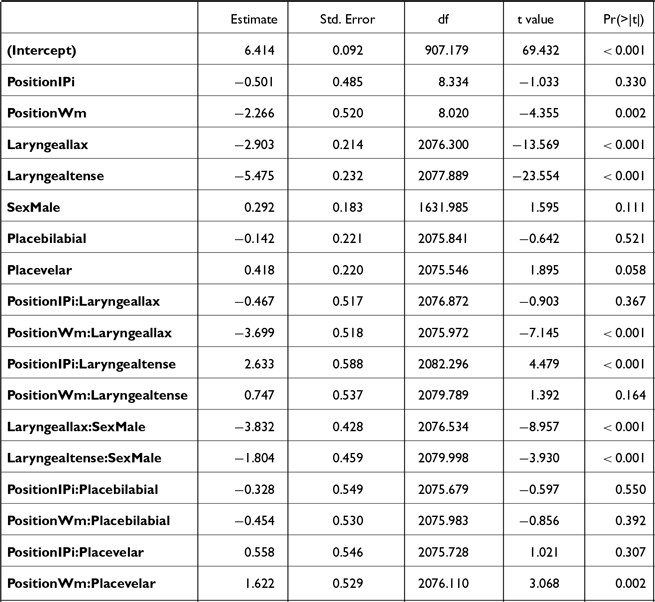
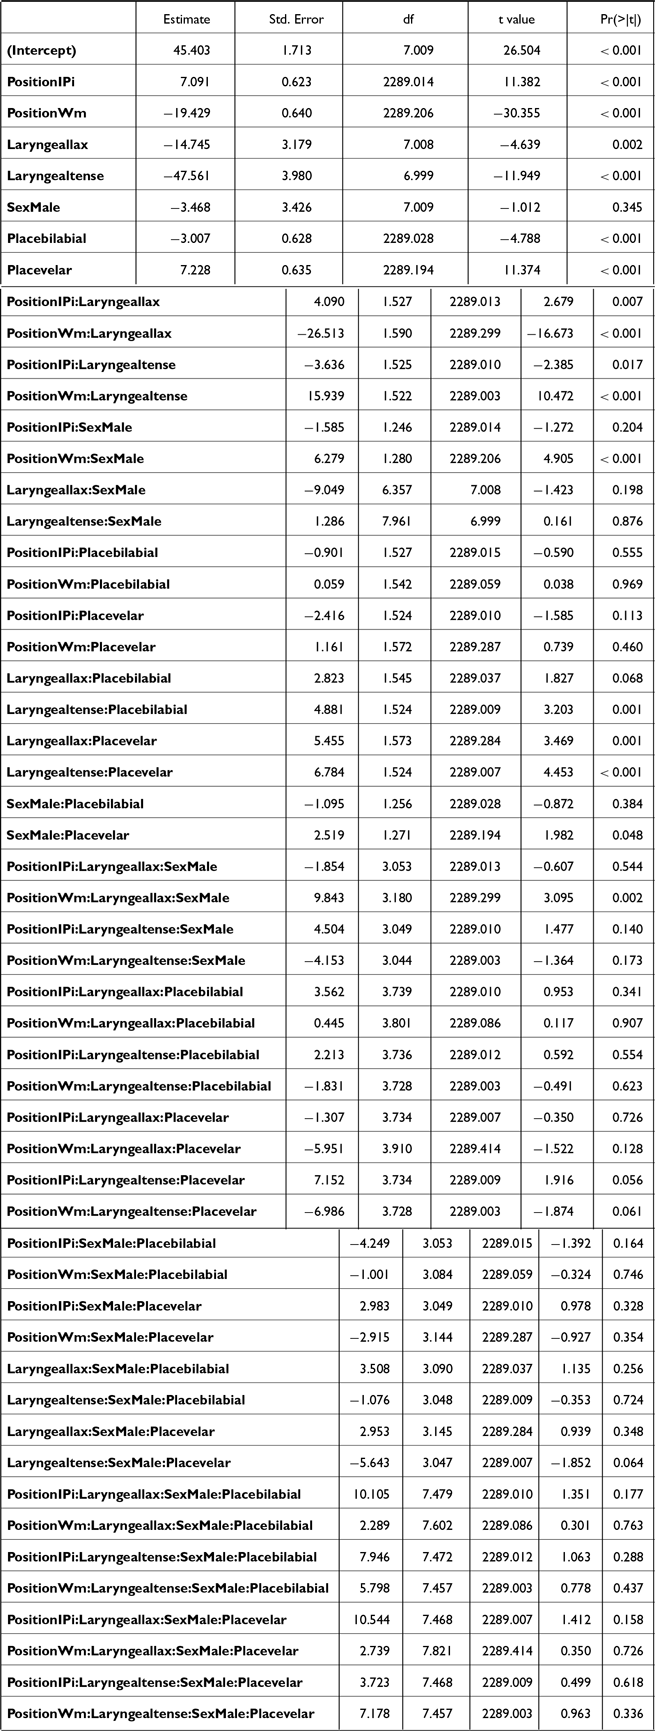
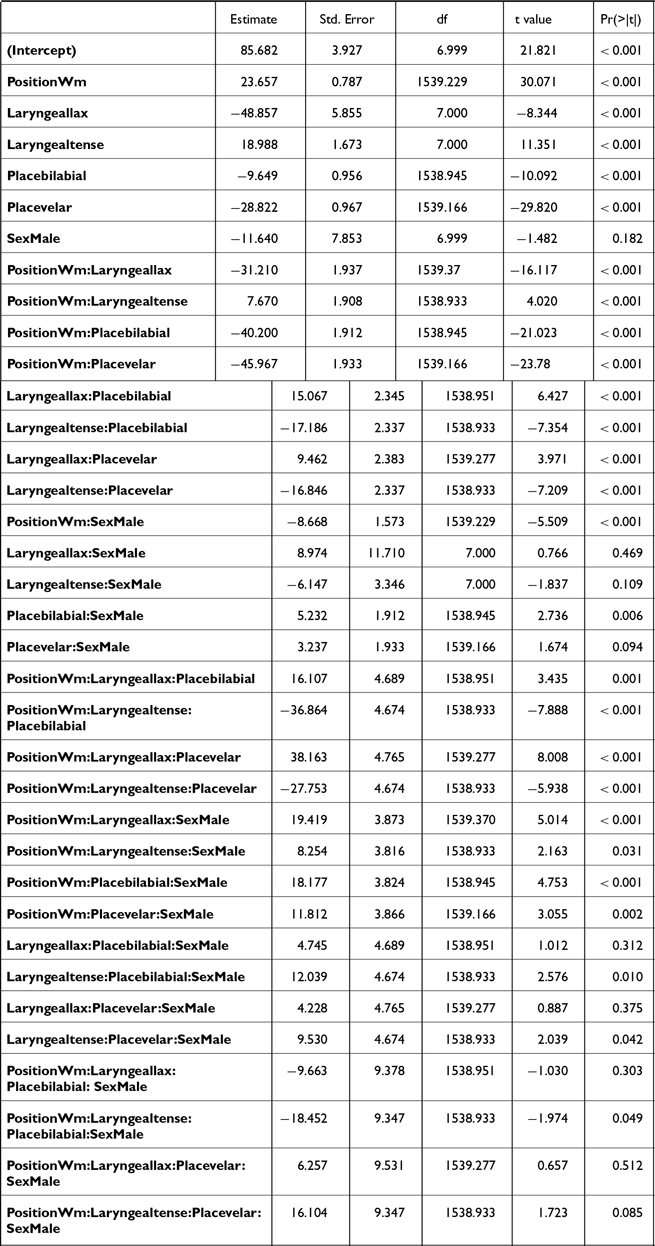
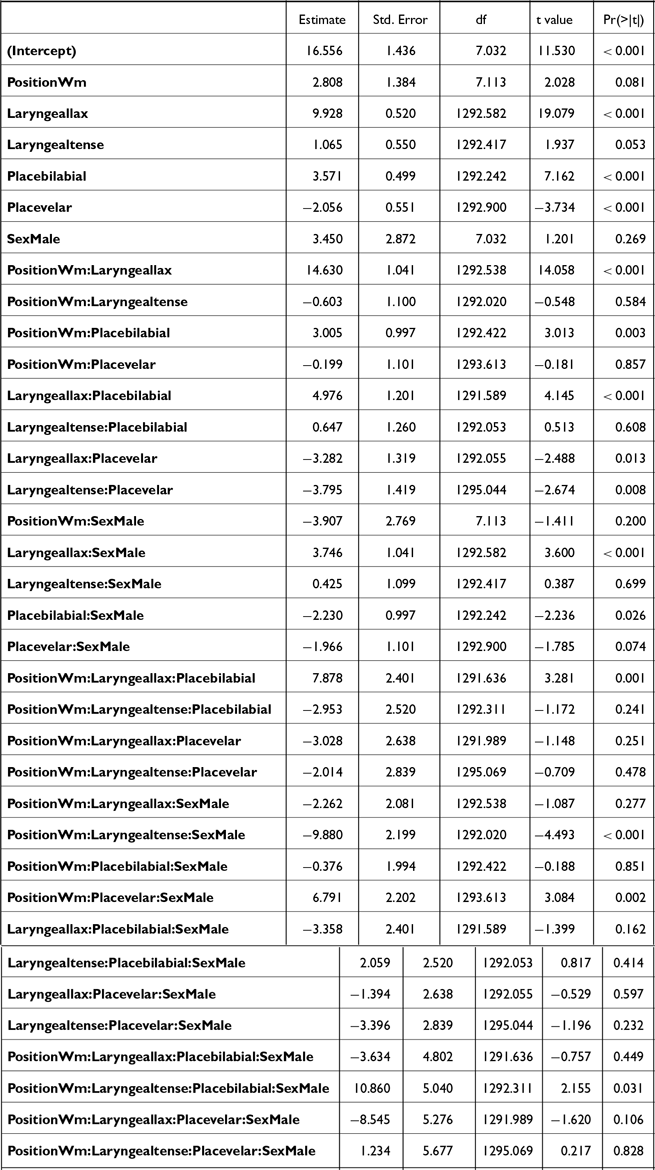
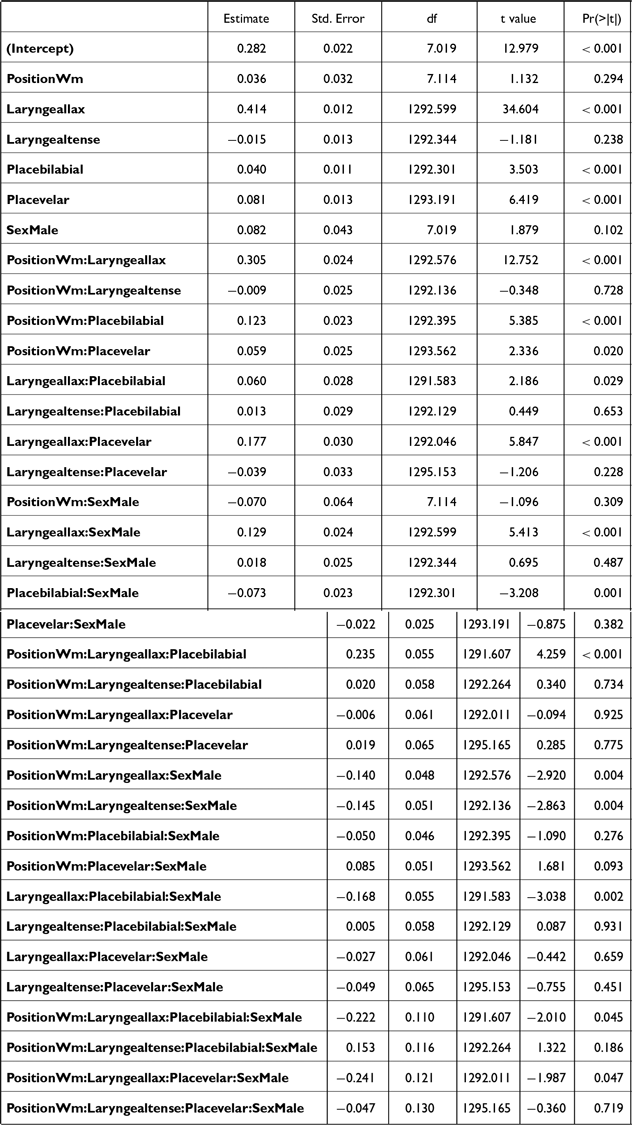

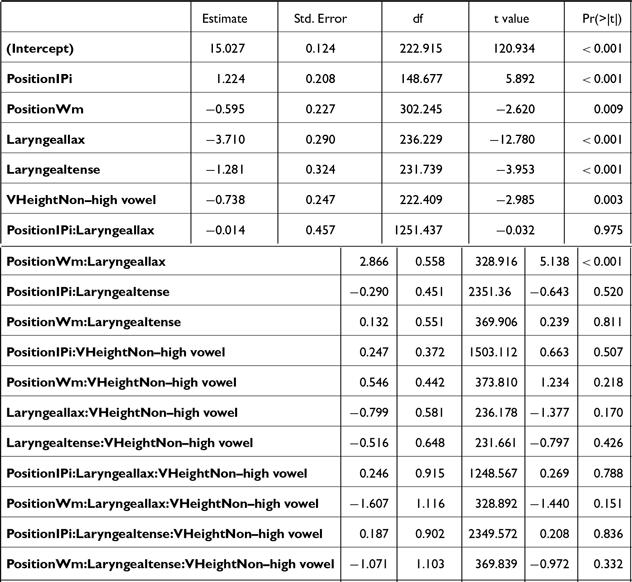
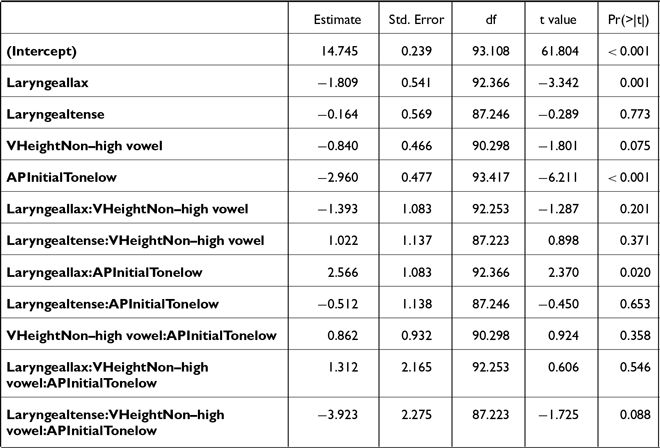
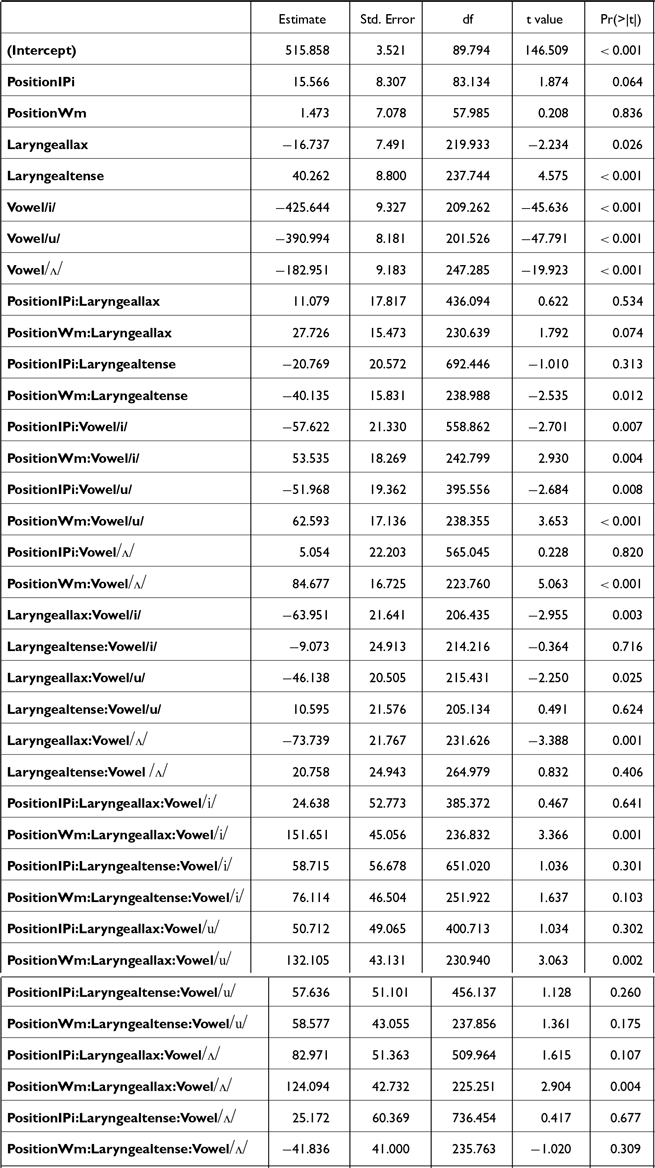
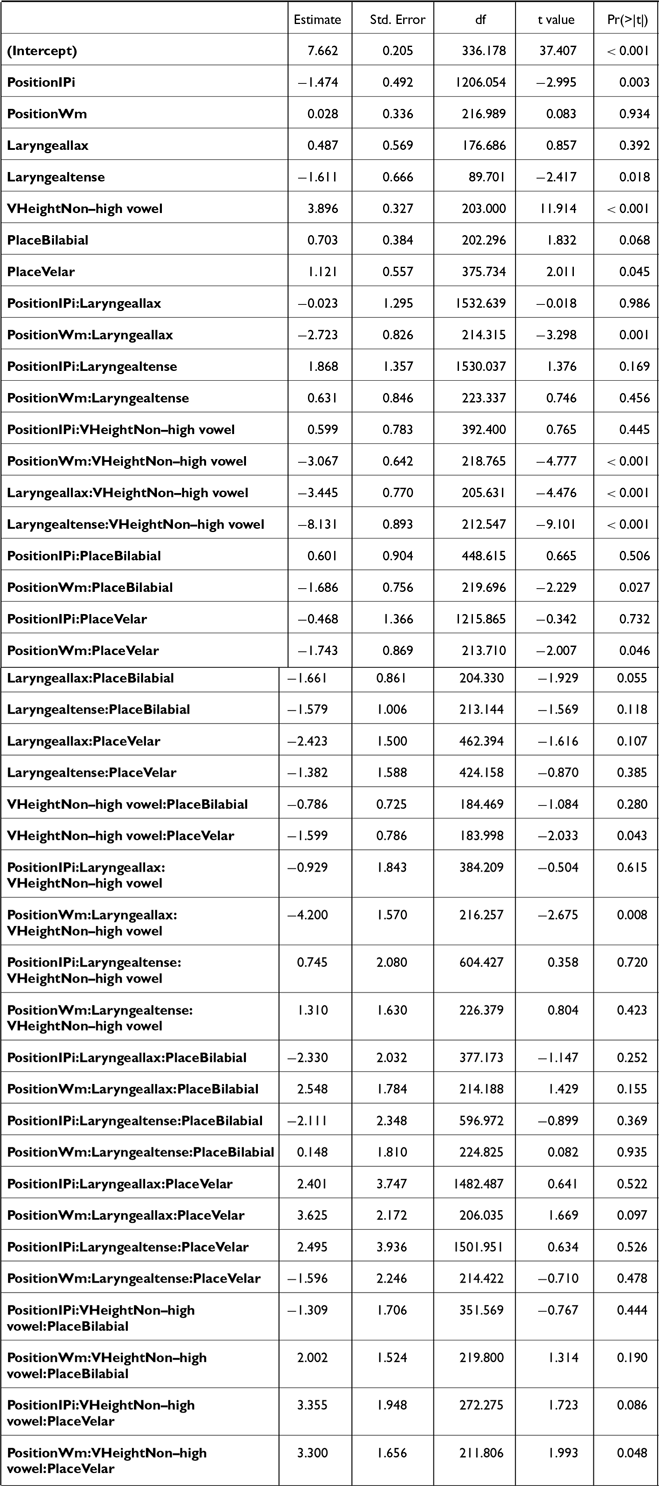
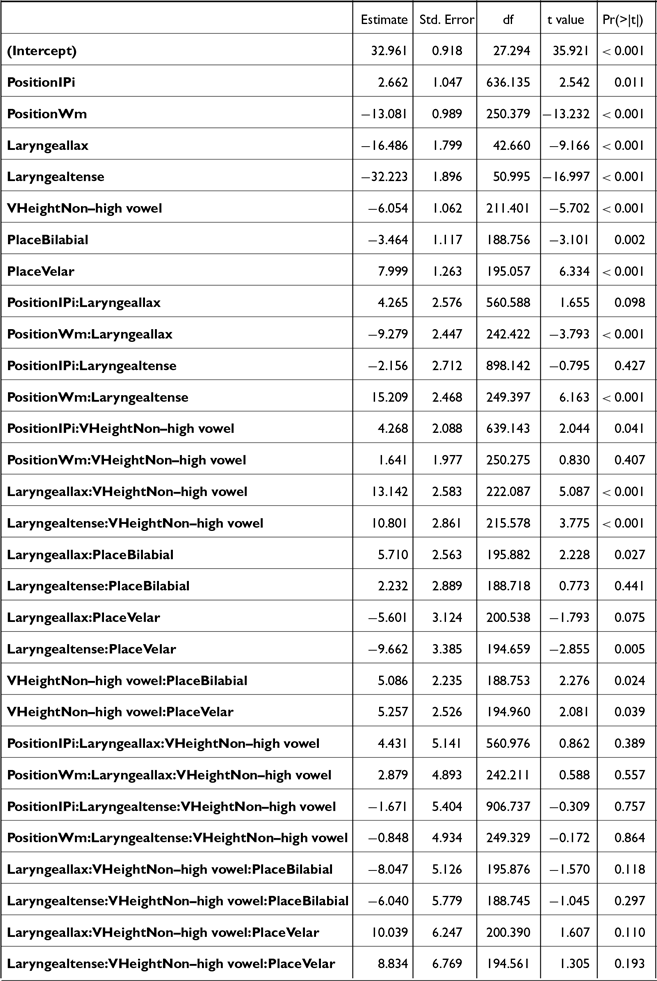
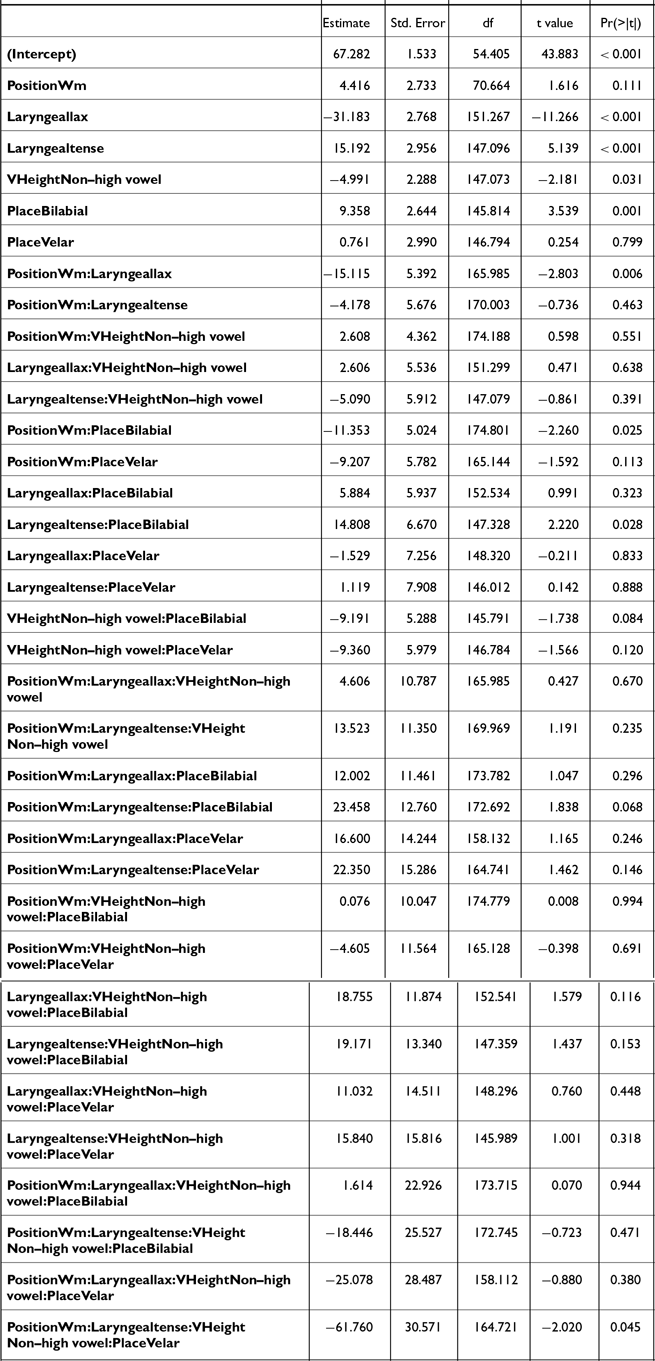
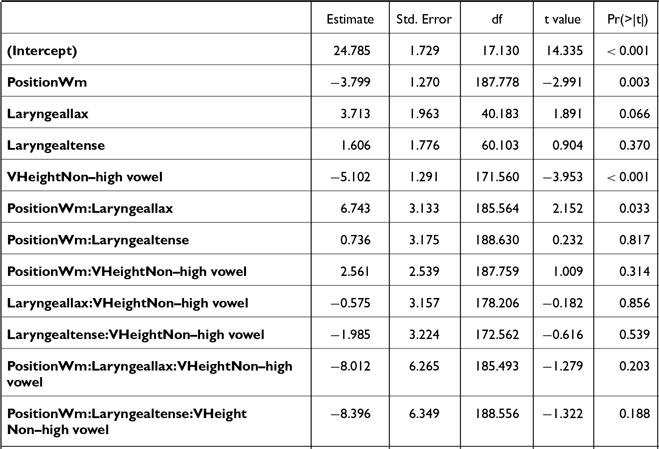
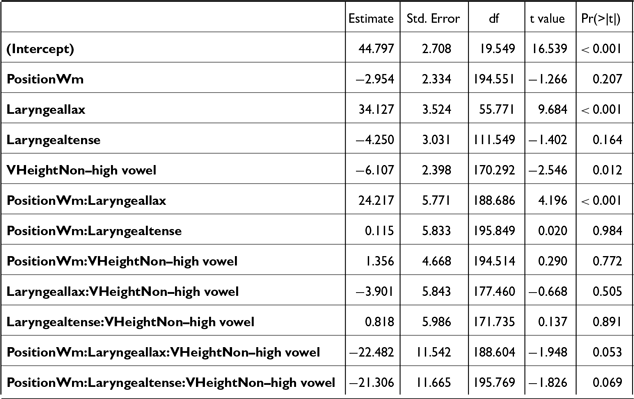
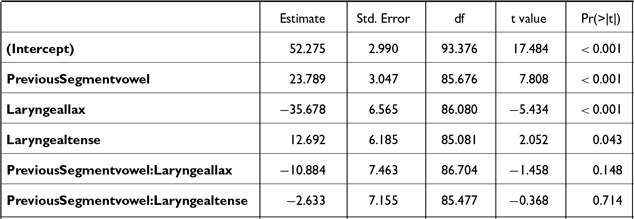
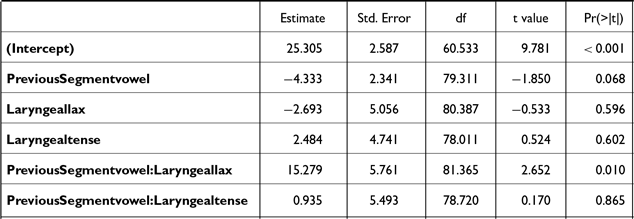
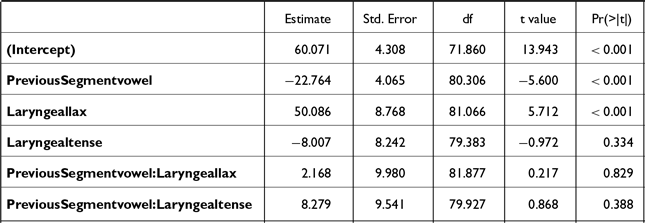
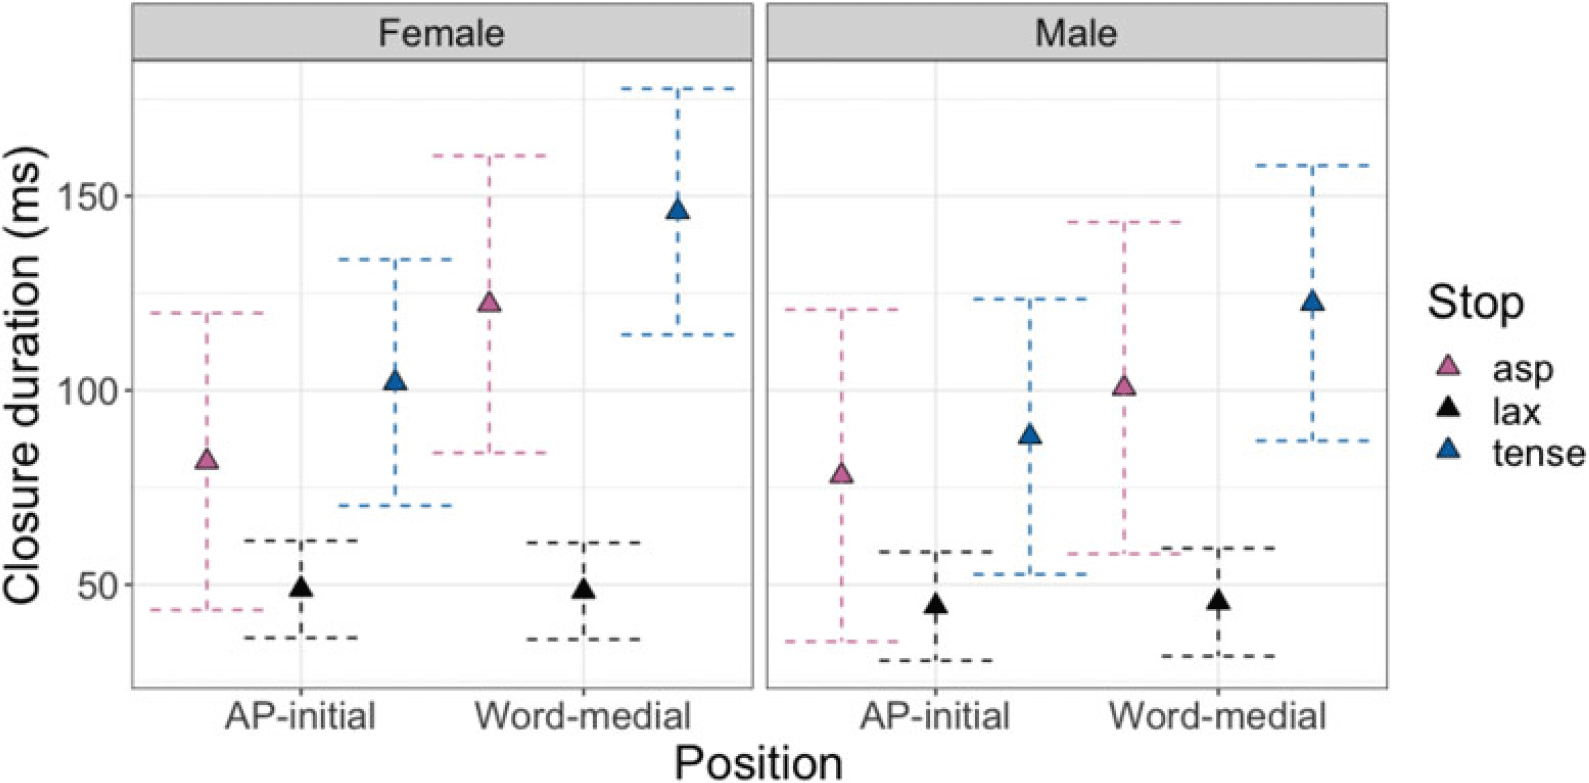
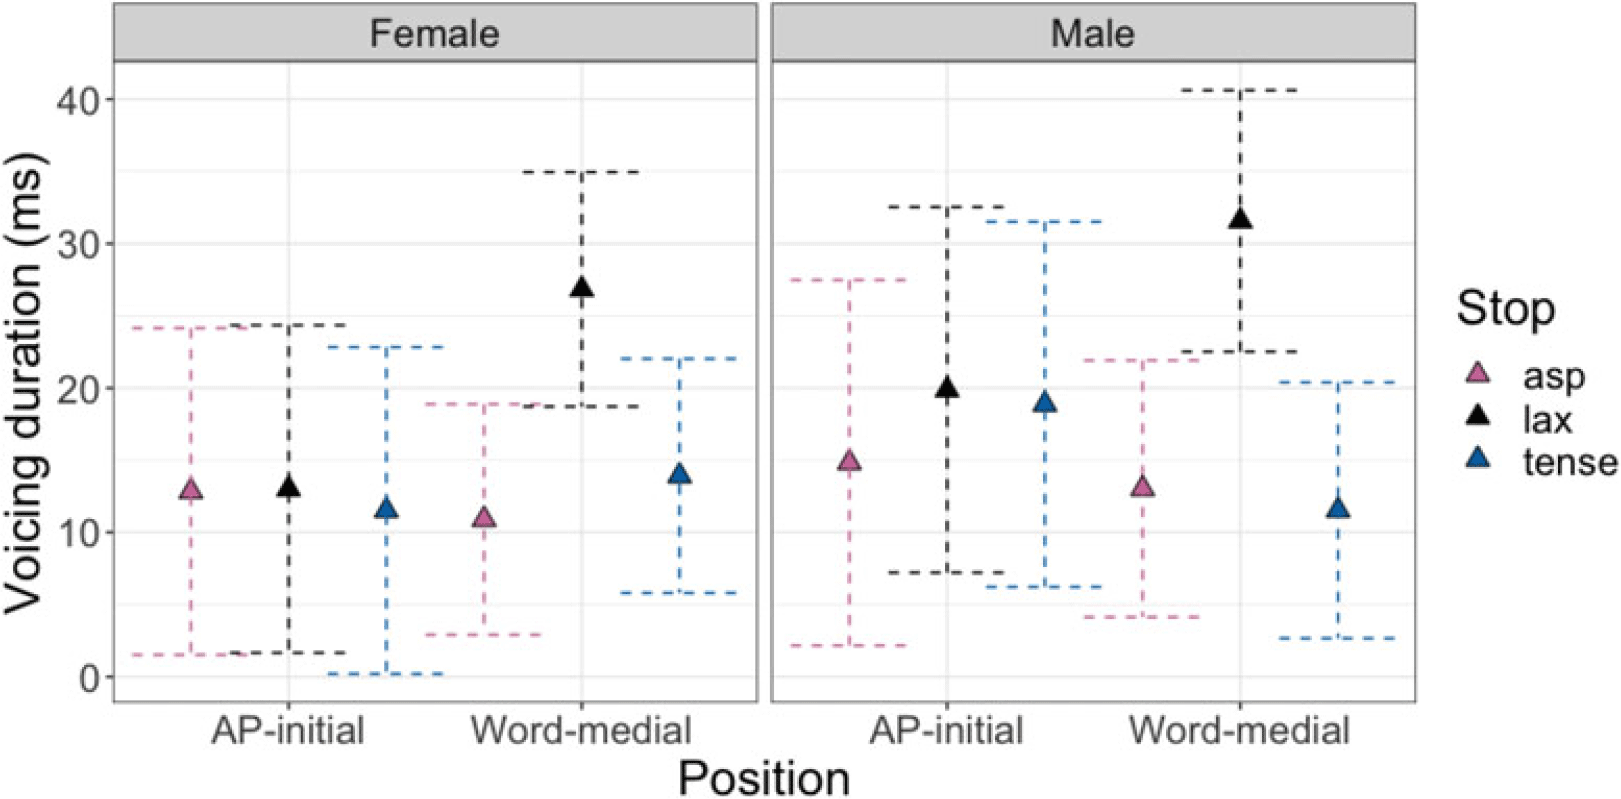
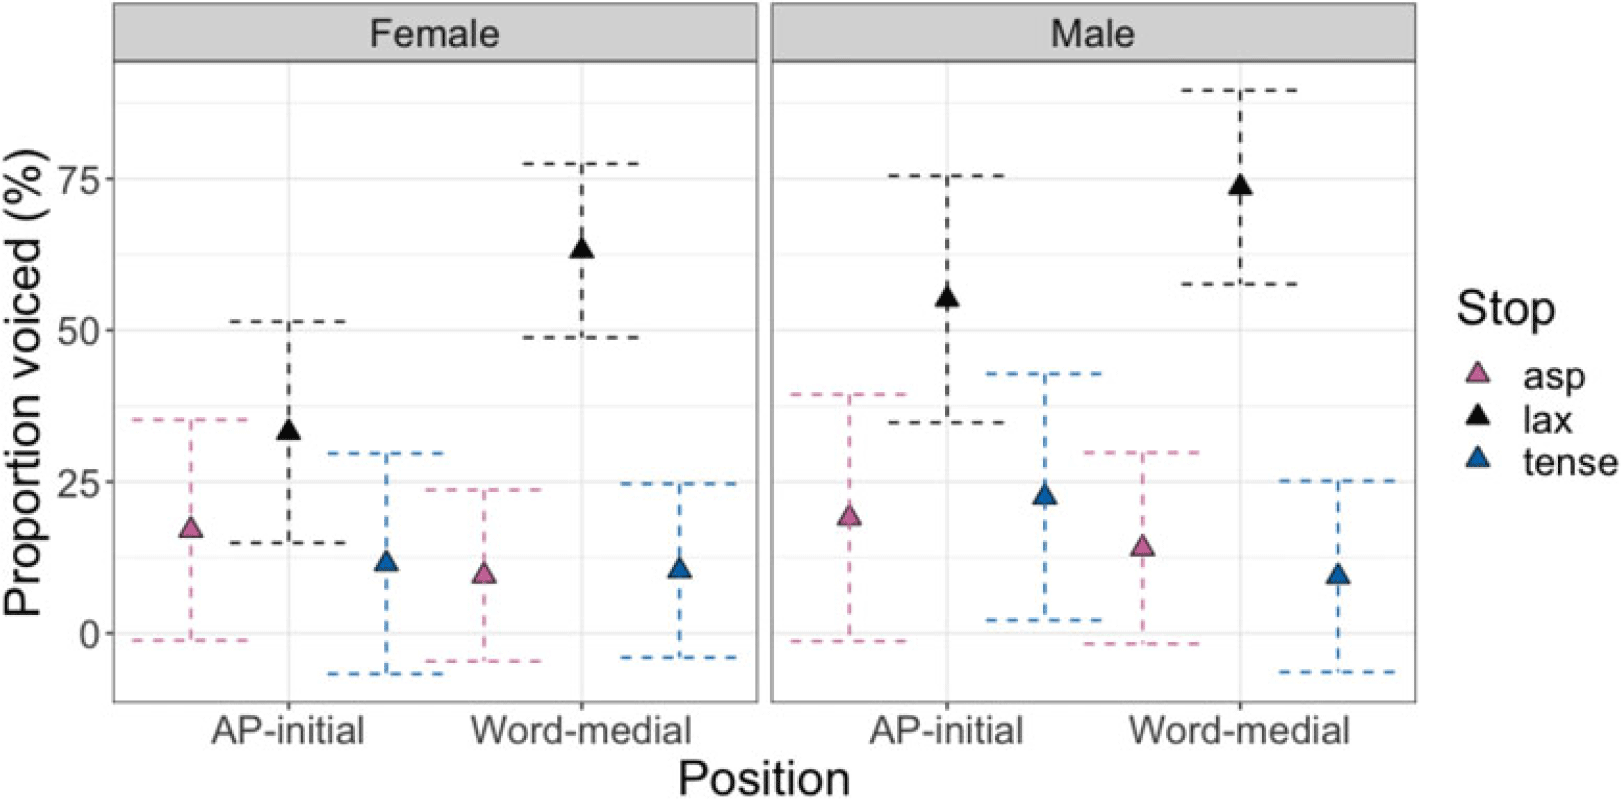
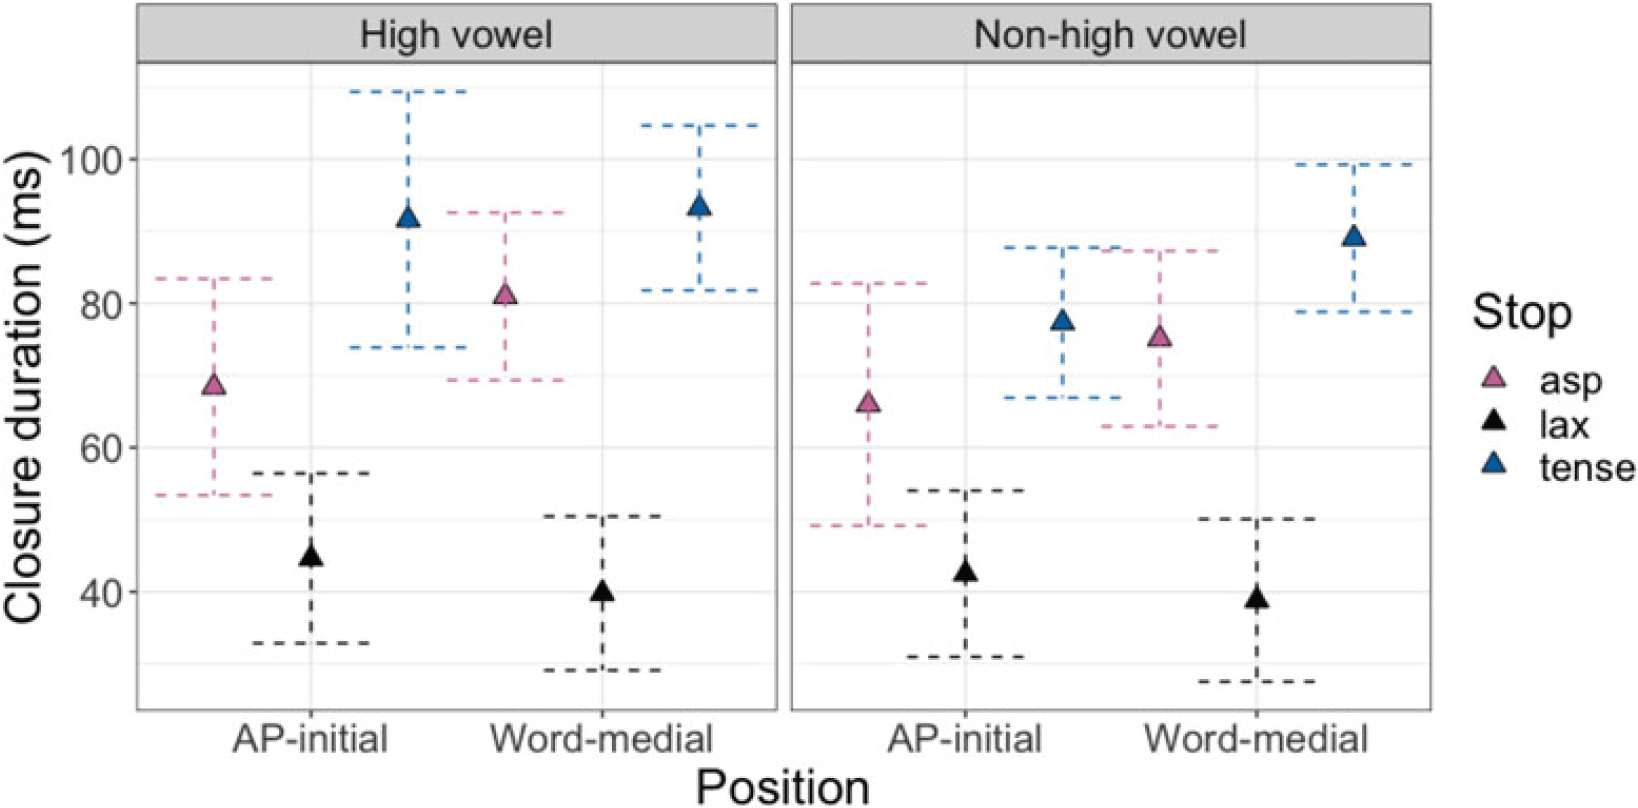
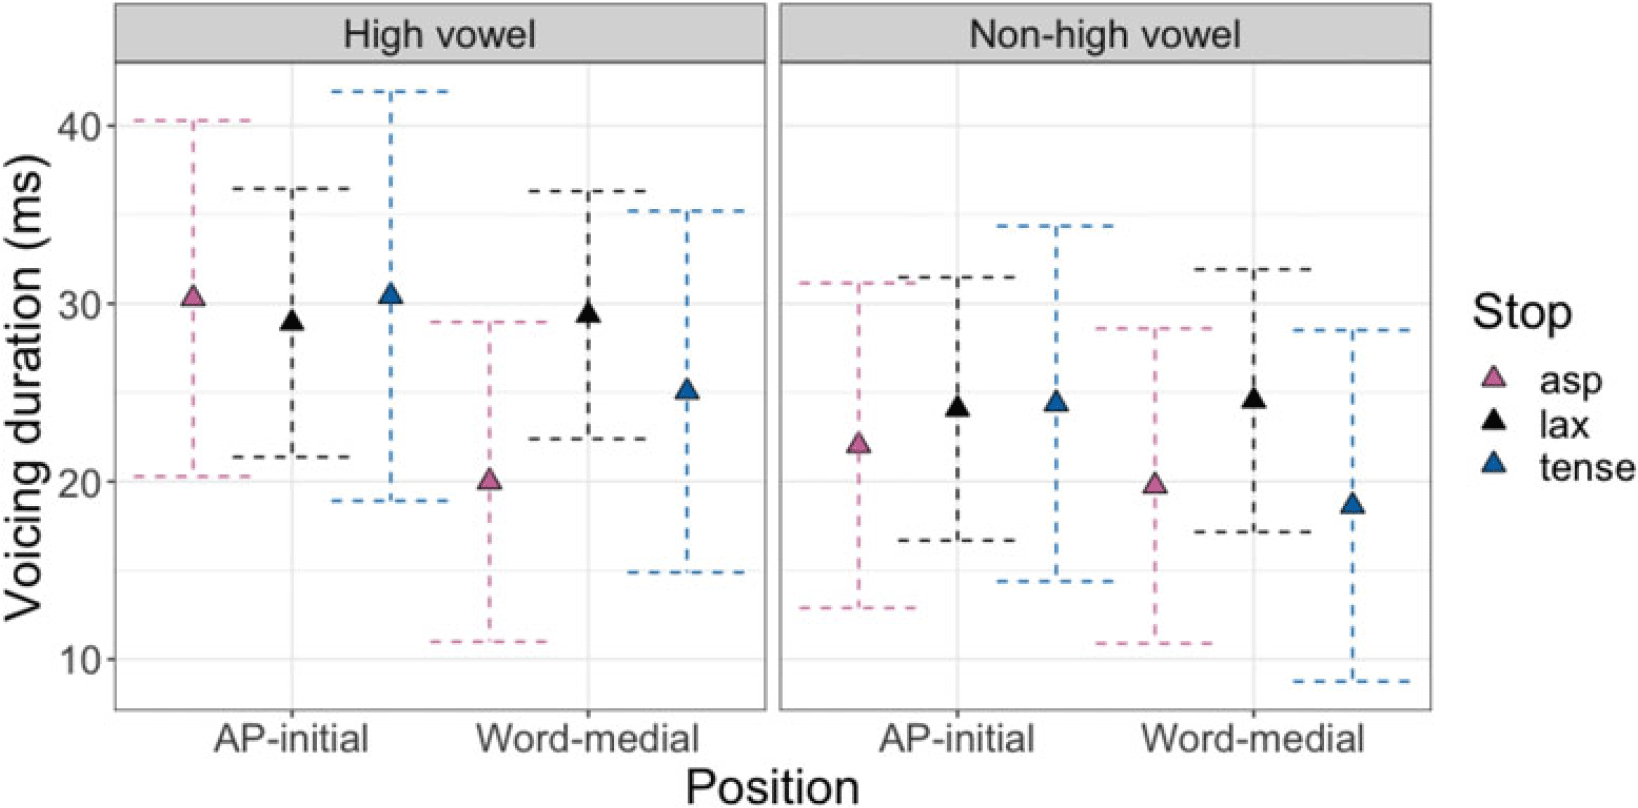
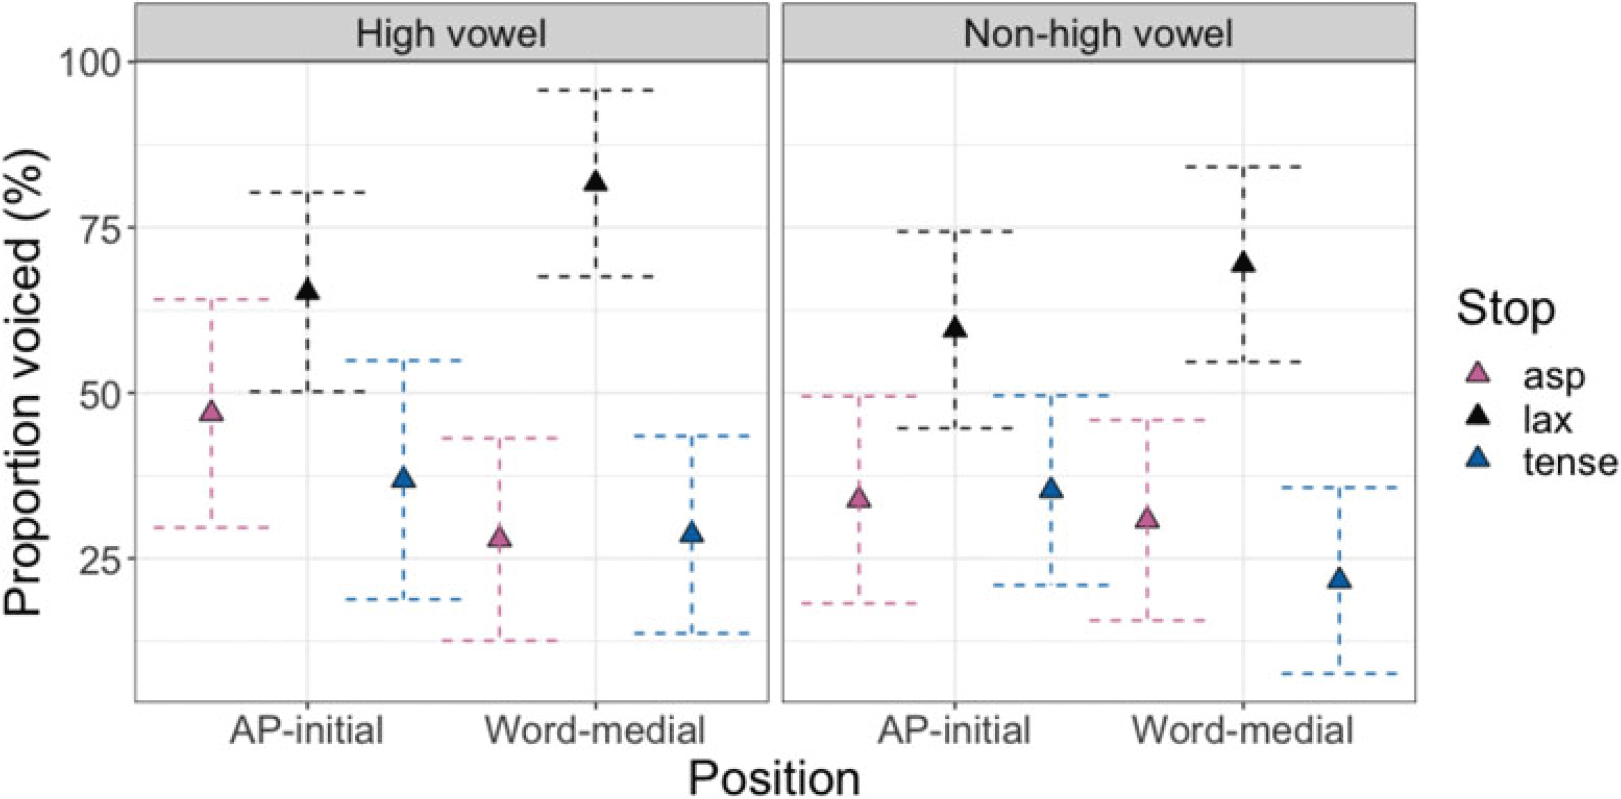
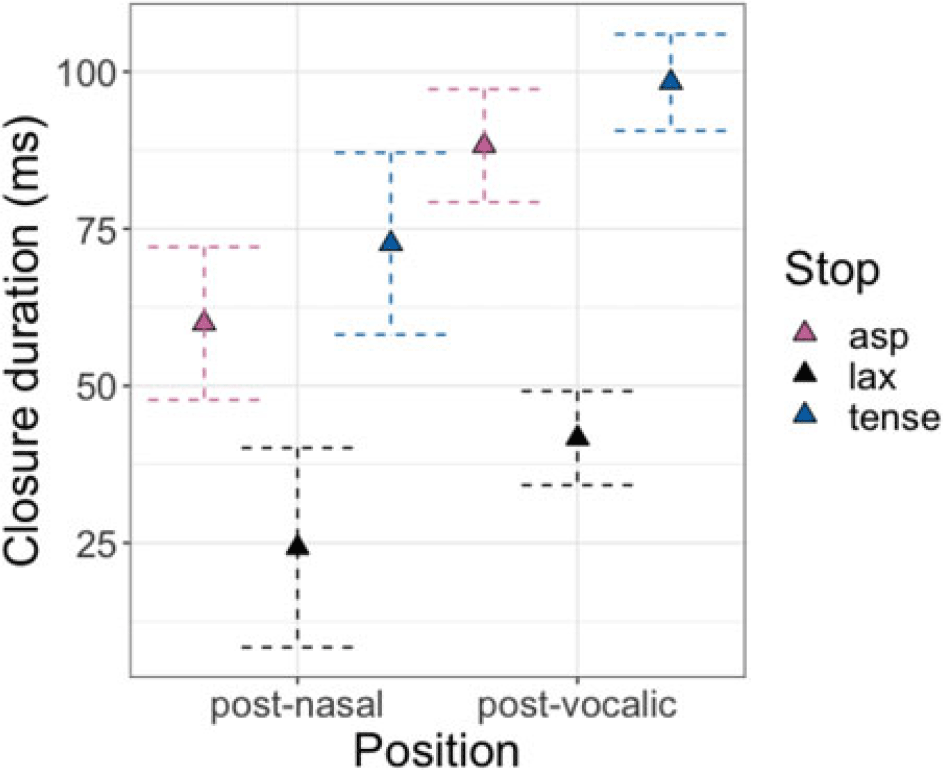
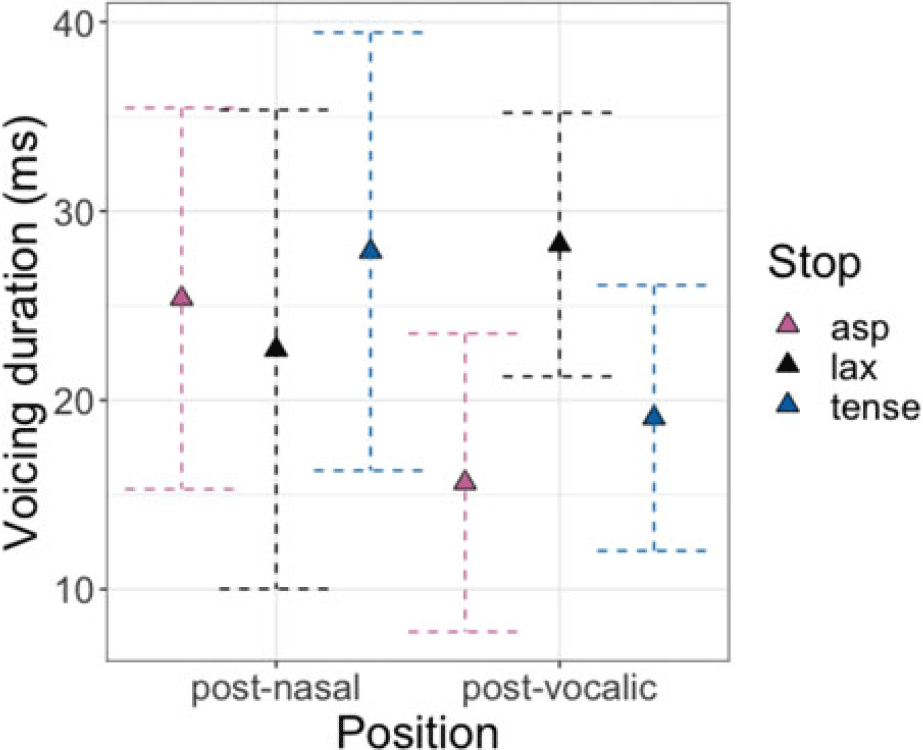
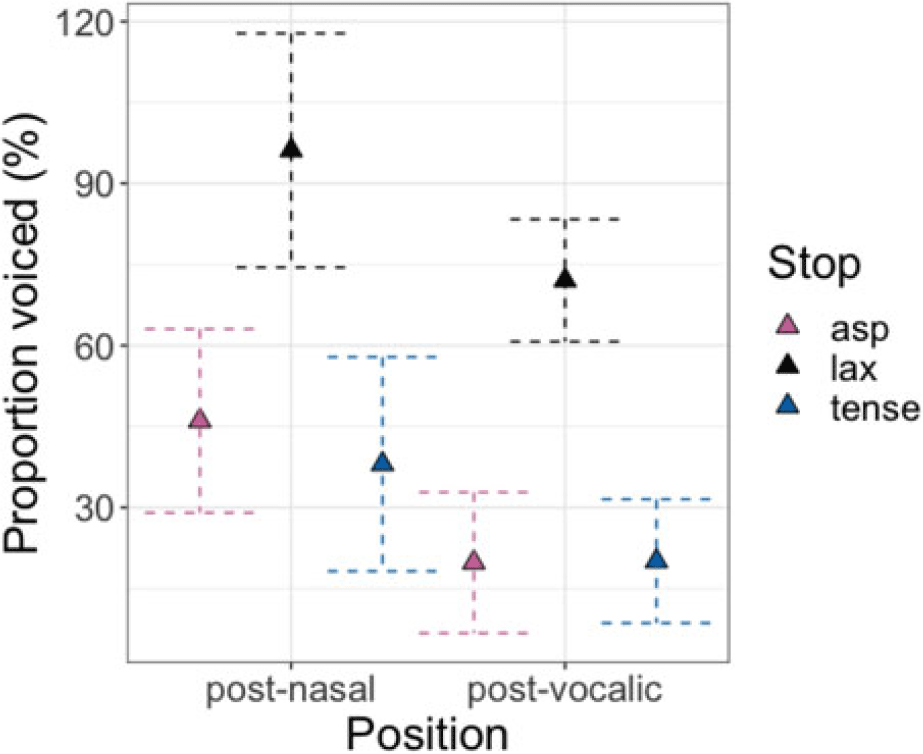

 Open access

