


Non-technical Summary
The body size of fossil organisms has been an important area of research for paleobiologists for well over a century, because body size can tell us much about widespread trends in the evolution of major groups of living things. However, paleobiologists often study body size by focusing only on size-related information collected from fossils. Without information about a fossil organism's biology and geologic history beyond its size, we cannot understand what is driving body-size change over evolutionary time in a meaningful way.
Luckily, the ways evolutionary biologists already think about growth and development (ontogeny) and evolutionary relationships among taxa (phylogeny) can help us resolve this issue. In particular, by looking at how a species’ body size, age, and other observable traits (phenotype) change over its growth and development, we can track how a species’ body-size changes over the course of its time on Earth. Furthermore, we can compare these patterns between closely related species, and identify the sources of body-size change in deep time.
To show how these ideas are a practical solution to problems in the fossil record, we applied them to a common pattern called the “Lilliput effect.” Named after the island of Lilliput and its tiny inhabitants in Gulliver's Travels, this pattern describes a sharp decrease in organism body size during extinctions in Earth history. Despite the Lilliput effect being very common, we understand little about how it occurs. Along with providing a stronger definition for the Lilliput effect, we use our framework to note some likely processes for the Lilliput effect (such as changes to development), and some famous cases where we could easily test these ideas.
Introduction
Body size has long been of interest to paleobiologists. Many frequently discussed phenomena recognized in the fossil record involve body size, including Cope's rule (Cope Reference Cope1869, Reference Cope1887; Stanley Reference Stanley1973; Jablonski Reference Jablonski, Jablonski, Erwin and Lipps1996; Gould and McFadden Reference Gould and MacFadden2004), Bergmann's rule (Bergmann Reference Bergmann1847; Blackburn et al. Reference Blackburn, Gaston and Loder1999; Meiri and Dayan Reference Meiri and Dayan2003), Foster's (island) rule (Foster Reference Foster1963, Reference Foster1964, Reference Foster1965; Van Valen Reference Van Valen1973; Heaney Reference Heaney1978; Lomolino Reference Lomolino1985; Lomolino et al. Reference Lomolino, Sax, Palombo and van der Geer2012), and the Lilliput effect (Urbanek Reference Urbanek1993; Twitchett Reference Twitchett2007; Harries and Knorr Reference Harries and Knorr2009). However, despite this large body of work on body-size trends in the fossil record, there is a dearth of studies on the mechanistic underpinnings of these patterns. Body size is a complex trait that reflects many aspects of organismal biology, including phylogeny, morphology, physiology, ecology, and ontogeny (Calder Reference Calder1984; Jablonski Reference Jablonski, Jablonski, Erwin and Lipps1996; Cooper and Purvis Reference Cooper and Purvis2010), and many studies utilize size data when evaluating macroevolutionary patterns involving these other factors. Yet body size alone can be a poor proxy for evaluating macroevolutionary patterns because of the myriad processes capable of driving size trends in the fossil record. Furthermore, apparent size trends can also reflect taphonomic processes, such as transport and sorting (Kidwell et al. Reference Kidwell, Fursich and Aigner1986; Kidwell and Bosence Reference Kidwell, Bosence, Allison and Briggs1991; Zuschin et al. Reference Zuschin, Harzhauser and Mandic2005; Brayard et al. Reference Brayard, Nützel, Stephen, Bylund, Jenks and Bucher2010), instead of biological ones. Mechanistic insight is needed to build a rigorous understanding of how body-size trends manifest over time and are preserved in the fossil record.
On their own, size measurements are agnostic to the mechanisms that drive body-size change over time, so additional data are needed to study these mechanisms in a biologically meaningful way. Ontogeny and phylogeny are particularly powerful lenses through which to interpret changes in body size, and existing frameworks for both can be broadly applied to the fossil record. Tools developed for studying heterochrony—particularly the multivariate age–size–phenotype space developed in the late twentieth century (Gould Reference Gould1977; Alberch et al. Reference Alberch, Gould, Oster, Wake, Alberch, Gould, Oster and Wake1979; McKinney and McNamara Reference McKinney and McNamara1991; Klingenberg Reference Klingenberg1998)—are especially useful for understanding mechanisms of body-size change. By referencing how size covaries with other aspects of a species’ ontogenetic trajectory, we gain a better understanding of the mechanisms that may underlie changes in size, and whether/how those mechanisms might vary when comparing species that display seemingly similar changes in size. Furthermore, interspecific comparisons of ontogeny (e.g., when testing for heterochrony) can only be done properly in a rigorous phylogenetic framework (Alberch et al. Reference Alberch, Gould, Oster, Wake, Alberch, Gould, Oster and Wake1979; Fink Reference Fink1982). Phylogenetic patterns of body-size change provide necessary context to determine directionality and mechanisms of size change and clarify distortions brought on when considering stratigraphic patterns of size change alone.
In this paper, we briefly review multivariate heterochrony and describe its application to studies of body-size change. We begin with a general description of the framework, followed by a discussion of heterochrony and its equally important counterparts, allometric and sequence repatterning. To better demonstrate the practical applications of this model, we then explore a widely documented but poorly understood pattern of size decrease, the Lilliput effect (Urbanek Reference Urbanek1993). Typically, the Lilliput effect has been studied by recognizing patterns of size decrease in a stratigraphic context (Twitchett Reference Twitchett2007; Harries and Knorr Reference Harries and Knorr2009). With use of a heterochronic framework, however, we can identify or constrain proximal mechanisms for the Lilliput effect, such as ontogenetic shifts and size-selective sorting, and determine whether species that experienced simultaneous size decreases exhibit patterns consistent with these mechanisms. Application of this framework is not limited to the Lilliput effect, however, and the model can be applied to many cases of size change in the fossil record.
Quantifying Ontogenetic Trajectories
The heterochrony literature of the late twentieth century is rich with concepts relevant to change in various aspects of organismal phenotype. The classic age–size–“shape” space outlined by Alberch et al. (Reference Alberch, Gould, Oster, Wake, Alberch, Gould, Oster and Wake1979) and referred to as the “heterochronic trinity” by McKinney (Reference McKinney and McKinney1988) provides a framework to both quantify body size and other relevant metrics, and facilitate comparison of ontogenetic trajectories between populations and species (Gould Reference Gould1977; Alberch et al. Reference Alberch, Gould, Oster, Wake, Alberch, Gould, Oster and Wake1979; McKinney Reference McKinney and McKinney1988; McKinney and McNamara Reference McKinney and McNamara1991; Klingenberg Reference Klingenberg1998; Webster and Zelditch Reference Webster and Zelditch2005). Throughout this paper, we refer to the classic “shape” axis as “phenotype” to be inclusive to other kinds of phenotypic data. In this framework, the age, size, and phenotype axes represent three distinct kinds of data that can be quantified in a developing organism or within a population; ontogenetic trajectories can be parameterized and modeled as a vector within this multivariate space (Fig. 1). Because lifelong ontogenetic data for individuals are typically not available for fossil and non-model organisms, we must usually infer average ontogenetic trajectories from cross-sectional or mixed cross-sectional data for a sample (Cock Reference Cock1966; Alberch et al. Reference Alberch, Gould, Oster, Wake, Alberch, Gould, Oster and Wake1979; Rice Reference Rice1997). Unfortunately, the limited sample size available for many taxa in the fossil record restricts the degree to which ontogenetic trajectories can be reconstructed, and data that can be parameterized as age, size, or phenotype are not uniformly available for all taxa. However, with new methods and approaches, age, size, and phenotype can certainly be quantified in a unified empirical framework (Barta et al. Reference Barta, Griffin and Norell2022). Although the age–size–phenotype framework is useful for those species that do preserve these data, it also useful for recognizing when one or more types of data are missing, underscoring the limits of the fossil record when drawing conclusions on the mechanistic underpinnings of size trends. Furthermore, although ontogenetic frameworks are useful for testing for mechanisms of size change, they are also useful in discriminating between ontogenetic and other mechanisms of body-size change in the fossil record (see discussion on size-selective sorting and the Lilliput effect in “Ontogenetic Mechanisms of Body-Size Change”). Here we briefly summarize the three axes of age–size–phenotype space and provide examples of data relevant to each axis.
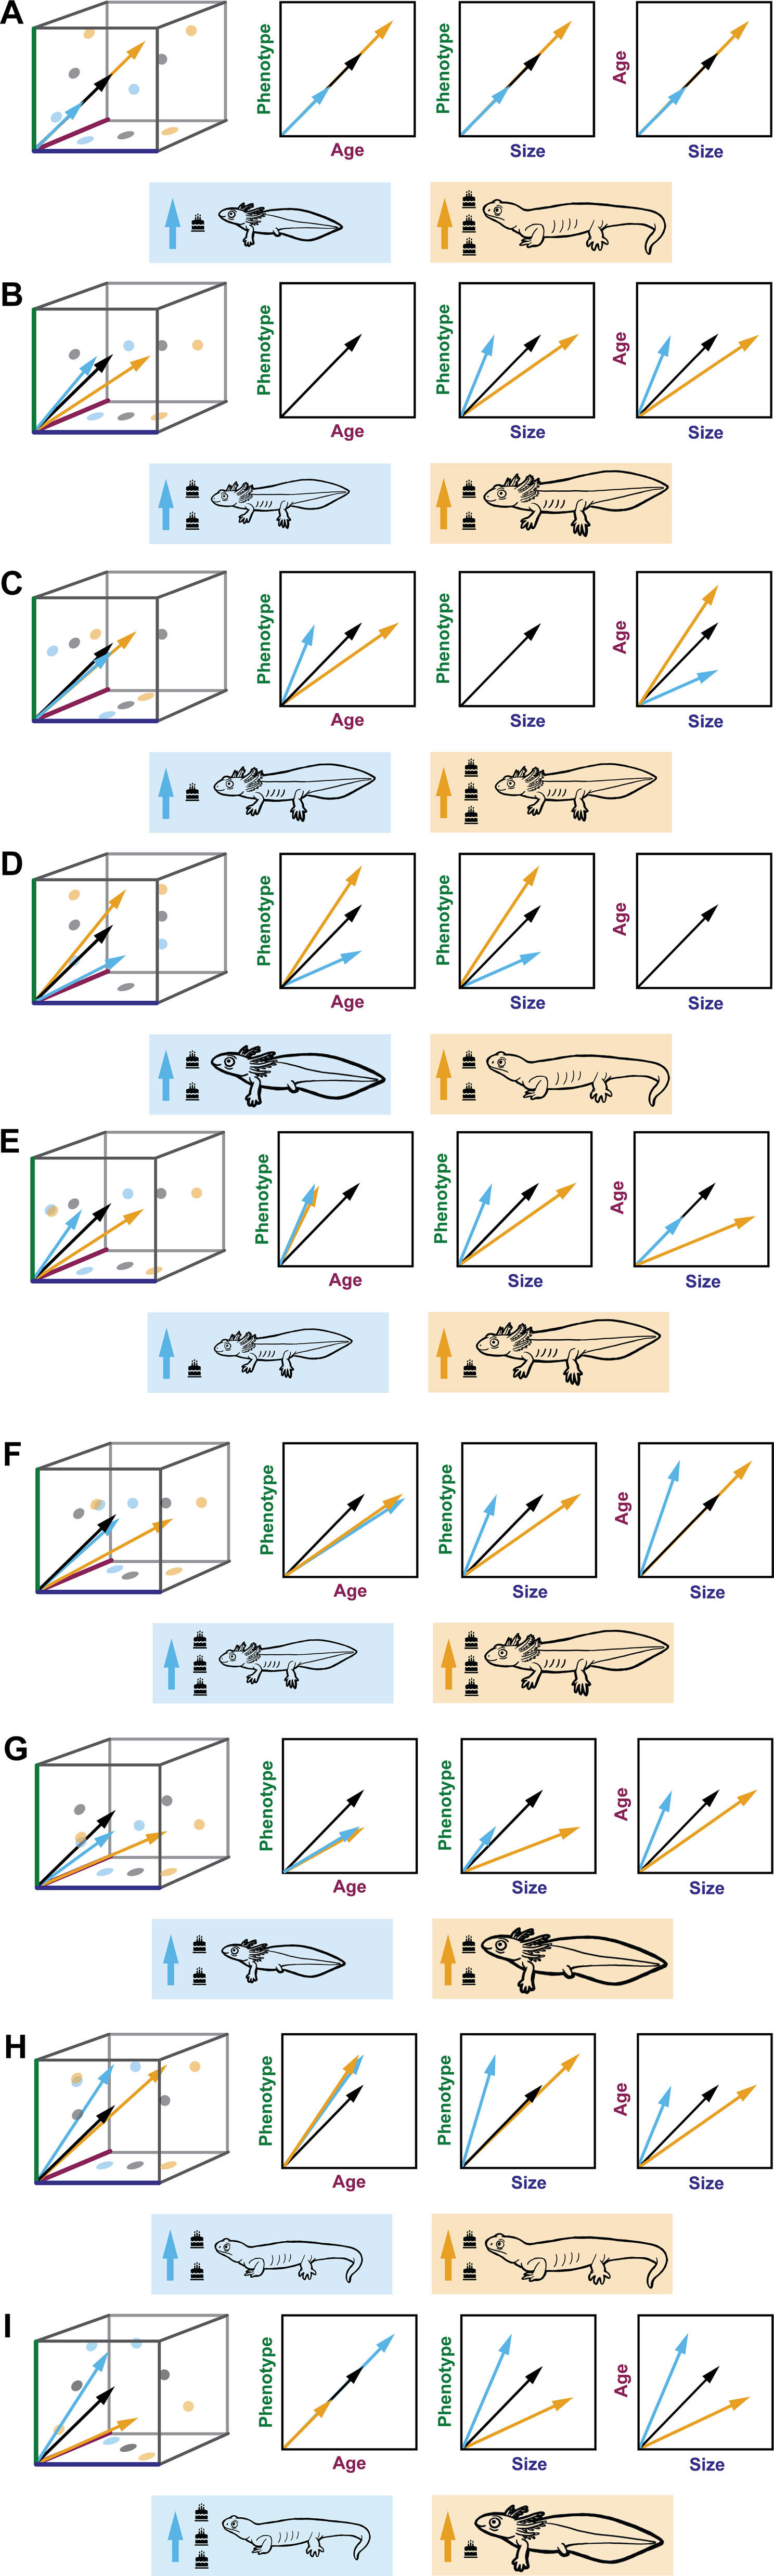
Age–size–phenotype space represented in three dimensions after Alberch et al. (Reference Alberch, Gould, Oster, Wake, Alberch, Gould, Oster and Wake1979). The black arrow represents the ontogenetic trajectory of an organism or the average trajectory of a population or species as it ages and undergoes change in both body size and phenotype.

Body Size
Body size of a fossil specimen can be defined as the size of preserved elements of a specimen at death. There is a vast literature exploring and utilizing various metrics for organismal size. The choice of “size” variable depends on the study system, available fossil material, and type of data being collected. Thus, size can be measured in a variety of ways, including the length of one or more skeletal elements, such as basal skull length (Huttenlocker and Botha-Brink Reference Huttenlocker and Botha-Brink2013; Botha-Brink et al. Reference Botha-Brink, Codron, Huttenlocker, Angielczyk and Ruta2016), trunk length (Motani et al. Reference Motani, Huang, Yong Jiang, Tintori, Rieppel, You, Chao Hu and Zhang2018), or limb-bone dimensions in vertebrates (Campione and Evans Reference Campione and Evans2012) and cephalon length in trilobites (Trammer and Kaim Reference Trammer and Kaim1997; Hunda and Hughes Reference Hunda and Hughes2007). For bivalves, brachiopods, foraminifera, and other taxa with fewer, simpler skeletal elements, geometric means of shell or test length and width (Jablonski Reference Jablonski, Jablonski, Erwin and Lipps1996; Chen et al. Reference Chen, Song, He, Tong, Wang and Wu2019), shell volume (Novack-Gottshall and Lainer Reference Novack-Gottshall and Lanier2008), and shell outline centroid size (Lockwood Reference Lockwood2005) are all appropriate metrics. In some cases, body-mass estimates for fossil specimens could be appropriate size metrics. However, body-mass estimates should be applied only when reliable and where other size metrics are inappropriate, because most estimates of fossil body mass and volume are calculated using proxies such as element lengths and circumferences (Novack-Gottshall Reference Novack-Gottshall2008; Campione and Evans Reference Campione and Evans2012; Field et al. Reference Field, Lynner, Brown and Darroch2013). Size proxies should be independent of the data used to parameterize the age and phenotype axes. For instance, raw femoral lengths would be inappropriate as a size metric for geometric morphometrics of femora, but centroid size of the same elements would be appropriate. These examples are not exhaustive and are meant to demonstrate how varied size metrics can be, rather than prescribe a specific approach for a given study system.
Age
Age is measured as absolute (chronological) time since birth or some other standard event early in ontogeny such as weaning, hatching, or metamorphosis. Although estimating the time since birth or absolute ontogenetic age of extinct taxa is often challenging, if not impossible, there are some useful proxies for estimating the relative age or life stage of an individual compared with other members of a fossil population. In bivalves, sclerochronology of shell growth increments serves as a proxy for ontogenetic age, especially when calibrated with geochemical data such as stable isotopes (Jones and Gould Reference Jones and Gould1999; Schöne and Surge Reference Schöne and Surge2012). Similar sclerochronological techniques have also been applied to brachiopods, although to a much lesser extent (Hiller Reference Hiller1988; Brey et al. Reference Brey, Peck, Gutt, Hain and Arntz1995; Angiolini et al. Reference Angiolini, Stephenson, Leng, Jadoul, Millward, Andrews, Chenery and Williams2011; Gaspard et al. Reference Gaspard, Aldridge, Boudouma, Fialin, Rividi and Lécuyer2018), as have counts of external growth lines of brachiopod shells (Metcalfe et al. Reference Metcalfe, Twitchett and Price-Lloyd2011). In many tetrapods, lines of arrested growth (LAGs) preserved in bone tissues represent annual slowing or cessation of growth, and both the number and spacing of these lines are used to estimate age (Castanet Reference Castanet1994; Castanet et al. Reference Castanet, Croci, Aujard, Perret, Cubo and De Margerie2004; Padian Reference Padian2012; de Buffrénil et al. Reference de Buffrénil, Quilhac, Castanet, de Buffrénil, de Ricqlès, Zylberberg and Padian2021). In fish, otoliths (ear bones) display annuli as well, with each annulus being shown to represent a true year in fisheries studies (Campana and Thorrold Reference Campana and Thorrold2001; Wilson and Nieland Reference Wilson and Nieland2001; Laidig et al. Reference Laidig, Pearson and Sinclair2003). Even in taxa that do not lay down some kind of annulus in their skeletal elements, there are other ways to approximate relative “age.” For instance, instars can be an appropriate staging metric in arthropods such as trilobites (Hughes et al. Reference Hughes, Minelli and Fusco2006, Reference Hughes, Adrain, Holmes, Hong, Hopkins, Hou and Minelli2021).
Many studies of heterochrony and ontogenetic trajectories in the fossil record consist of allometric studies of only size and phenotype because of the difficulty of collecting age data. Size is often treated as a proxy for age, but these two variables can decouple from one another (McKinney Reference McKinney and McKinney1988; Metcalfe et al. Reference Metcalfe, Twitchett and Price-Lloyd2011; Huttenlocker and Botha-Brink Reference Huttenlocker and Botha-Brink2013; Botha-Brink et al. Reference Botha-Brink, Codron, Huttenlocker, Angielczyk and Ruta2016), making size an unreliable proxy for the passage of time. Although age data and other stand-in metrics for life stage can be challenging to acquire from fossils, it is important to be aware of how an axis of time affects the interpretation of ontogenetic processes, as seen in “Ontogenetic Mechanisms of Body-Size Change.” In the absence of age data, care should be taken to avoid drawing conclusions that require a metric for time.
Phenotype
Phenotype is certainly the most complex axis to define and quantify. In classic heterochrony literature, the phenotype axis is often referred to as the “shape” axis, but “shape” has a precise meaning, especially in the context of geometric morphometrics, and only accounts for a subset of potentially important aspects of phenotype. Therefore, we refer to this axis as “phenotype” to accommodate both shape and non-shape measures of phenotype. The goal of a phenotype axis is to measure the morphological change experienced during ontogeny by members of a given taxon, independent of size and age, in a one- or multidimensional framework. Among extant taxa, this could include a wide range of features, including color, behavior, metabolic processes, and soft tissue morphology, but for our purposes in the fossil record, phenotypic data are largely restricted to the morphology of hard parts. Linear dimensions and geometric morphometric measures of phenotype are traditionally favored by paleobiologists, but they are not the only means to capture ontogenetically variable morphology. Some morphologies may be better captured as discrete-state (meristic) characters or “events” in a sequence. Discrete-state (meristic) data can also be collected from deformed and incomplete specimens where morphometric approaches might be unreliable. Furthermore, scored characters and meristic data can offer a degree of size independence that can be challenging to disentangle in morphometrics. Discrete data can reference a wide range of morphologies, including the development of elements like crests, bosses, and muscle scars (Griffin and Nesbitt Reference Griffin and Nesbitt2016a,Reference Griffin and Nesbittb; Griffin Reference Griffin2018; Barta et al. Reference Barta, Griffin and Norell2022) or the number of elements such as spines or shell ribs (Guo et al. Reference Guo, Chen, Harper and Huang2021). For example, ontogenetic sequence analysis (Colbert and Rowe Reference Colbert and Rowe2008) is a parsimony-based method used to reconstruct all possible ontogenetic sequences among ontogenetically variable specimens and has been used in studies of lepospondyl tetrapods (Olori Reference Olori2013) and early dinosaurs and dinosauriform archosaurs (Griffin and Nesbitt Reference Griffin and Nesbitt2016a,Reference Griffin and Nesbittb; Griffin Reference Griffin2018; Barta et al. Reference Barta, Griffin and Norell2022).
Ontogenetic phenotype can be challenging to parameterize. Although the entirety of ontogenetic phenotype need not be exactly conserved between taxa, measured features (shape, characters, dimensions, etc.) should be homologous. Measures of phenotype can suffer from dimensionality bias (Webster and Zelditch Reference Webster and Zelditch2005), both underparameterization and overparameterization, as seen in the morphometric size–shape allometry literature. An awareness of what the phenotype axis is intended to measure can help mitigate this problem. The goal of the phenotype axis is to measure a shared set or series of events, shape changes, or character changes, so the selected parameters should not overly simplify or complicate an organism's ontogeny. Furthermore, interpretation of ontogenetic modification must be limited to the kinds of data represented by the phenotype axis and not extrapolated to other unrepresented or unmeasured aspects of phenotype.
Phylogenetics and Size Change
A common issue in studies of body-size change is a lack of phylogenetic context. Evolutionary patterns within clades cannot be evaluated without a robust phylogeny (Webster et al. Reference Webster, Sheets, Hughes and Zelditch2001). Clade-level patterns of size decrease only make sense in an ancestor–descendant or stemward–crownward context (Gould and MacFadden Reference Gould and MacFadden2004; Lockwood Reference Lockwood2005; Harries and Knoor Reference Harries and Knorr2009). Interpretations of size change in a stratigraphic context alone are appealing but have the potential to miss important information. For example, in a solely stratigraphic context, it may appear as though size differences between species are directional. With the aid of a phylogeny, however, it may become clear that such size trends are inconsistent or follow a different pattern when ancestral character states and ghost lineages are accounted for (Adrain and Chatterton Reference Adrain and Chatterton1994; Gould and MacFadden Reference Gould and MacFadden2004; Fig. 2). Fossil equids are an excellent empirical example of this, as they were once the classic illustration of Cope's rule (Matthew Reference Matthew1926; Simpson Reference Simpson1953). However, with increased fossil occurrences and a robust phylogeny, equid body-size evolution is now recognized to include varied episodes of size change rather than a single gradual increase in body size through time (MacFadden Reference MacFadden1986; Gould and MacFadden Reference Gould and MacFadden2004; Cantalapiedra et al. Reference Cantalapiedra, Prado, Hernández Fernández and Alberdi2017).
An imaginary clade of salamanders illustrating the importance of phylogenetic context in body-size trends through geologic time in the fossil record. A, Without the context of phylogeny, the lineage appears to increase in size steadily over time and reflects the traditional view of Cope's rule. B, With the context of phylogeny, size evolution in this clade is revealed to be far more complex, and not a stepwise progression.

Although phylogenetic concerns pose less of a problem to studies of size change in a single species or an anagenetic lineage, they become a more significant challenge when considering members of genera or higher taxonomic ranks. A robust, well-supported phylogeny and ample developmental information can reveal complex patterns of body-size change (Hanken and Wake Reference Hanken and Wake1993; Gould and McFadden Reference Gould and MacFadden2004; Angielczyk and Feldman Reference Angielczyk and Feldman2013; Cordero Reference Cordero2021). Moreover, the larger the phylogeny and the longer the time spanned by it, the more variation is expected and the greater the challenge in determining mechanisms and modes in patterns of size change. Neontological examples highlight that size change can present in a variety of ways and be achieved through various mechanisms. As an example, turtles have relatively low taxonomic diversity compared with other vertebrates, yet they display a wide range of body sizes. Differing, complex modes of allometric and sequence repatterning leading to size decrease have been found among members of at least two groups of turtles (Angielczyk and Feldman Reference Angielczyk and Feldman2013; Cordero Reference Cordero2021; Heston et al. Reference Heston, Meylan and Goessling2022), in part revealed through the abundant developmental, morphological, and life-history information available in extant systems. As mentioned earlier in the section on phenotype, comparison of ontogenetic trajectories also requires a degree of conserved ontogeny among homologous structures or features. Such conservatism is less likely as phylogenetic scale increases, given that ontogenetic systems can often change with speciation (Webster and Zelditch Reference Webster and Zelditch2005; see also “Allometric and Sequence Repatterning”). This does not mean that clade-level studies of body size are futile, but again prompts caution regarding what can be said of a given system with the data at hand.
Altering Ontogenetic Trajectories: Heterochrony and Other Modes of Ontogenetic Change
As mentioned earlier, the age–size–phenotype framework was developed in the heterochrony and allometry literature. Due to the wide interest in heterochrony during the late twentieth century, extensive terminology for evaluating body-size phenomena in the fossil record has been developed (Gould Reference Gould1977, Reference Gould2000; Alberch et al. Reference Alberch, Gould, Oster, Wake, Alberch, Gould, Oster and Wake1979; McKinney Reference McKinney and McKinney1988; McKinney and McNamara Reference McKinney and McNamara1991; Klingenberg Reference Klingenberg1998; Webster and Zelditch Reference Webster and Zelditch2005). Here we review concepts and terminology relevant to the study of macroevolutionary body-size trends.
Heterochrony
Heterochrony refers to evolutionary change in mature phenotype resulting from a decoupling of a taxon's growth trajectory from that of its ancestor along one or more of the age–size–phenotype axes, producing a parallelism between ontogenetic and phylogenetic phenotypic change (McKinney and McNamara Reference McKinney and McNamara1991; Zelditch and Fink Reference Zelditch and Fink1996; Mitteroecker et al. Reference Mitteroecker, Gunz and Bookstein2005; Webster and Zelditch Reference Webster and Zelditch2005). Identification of heterochrony requires a phylogenetically conserved axis of phenotypic change and manifests as modification to the rate at which change along that axis is achieved and/or the timing of events along that axis with respect to developmental time (age) and/or size (Alberch et al. Reference Alberch, Gould, Oster, Wake, Alberch, Gould, Oster and Wake1979; Klingenberg Reference Klingenberg1998; Gould Reference Gould2000; Mitteroecker et al. Reference Mitteroecker, Gunz and Bookstein2005; Webster and Zelditch Reference Webster and Zelditch2005). Peramorphosis (the production of a “more mature” descendant phenotype) can result from either an increased rate of phenotypic development relative to size or time (acceleration) or a longer duration of ontogenetic change (by a delayed termination of phenotypic change [hypermorphosis] and/or an earlier start to change along the phenotypic development axis [predisplacement]). Conversely, paedomorphosis (the production of a “less mature” descendant phenotype) can result from a decreased rate of phenotypic development relative to size or time (deceleration or progenesis) and/or a shorter duration of ontogenetic change (by an earlier truncation of ontogeny [neoteny] and/or a delayed onset to change along the phenotypic development axis [postdisplacement]) (Alberch et al. Reference Alberch, Gould, Oster, Wake, Alberch, Gould, Oster and Wake1979; Klingenberg Reference Klingenberg1998). A selection of examples of the possible changes to the age–size–phenotype axes are shown in Figure 3.
Various mechanisms of body-size change and potential corresponding changes to age and phenotype, represented with salamanders in the three-dimensional space shown in Figure 1, and bivariate plots. The ancestral trajectory is represented by black arrows, and descendant trajectories are represented by blue (size decrease) and orange (size increase) arrows. Rectangles below each plot represent the outcome of these descendant trajectories. Salamander phenotypes are represented with a “paedomorph” (hindlimb buds and gills), an ancestral phenotype (axolotl-like with limbs and gills), and a “peramorph” (terrestrial, limbed, and gill-less). Salamander body size is represented by scaling the cartoons of these phenotypes, and age is represented by the number of birthday cake icons next to each. A, Size change via proportionate truncation or elongation along the ancestral trajectory resulting in progenesis or hypermorphosis. B, Size change via decoupling size from age and phenotype, which remain unchanged. Descendant is a smaller or larger version of the ancestor. C, No size change. Decoupling age from size and phenotype, which remain unchanged. Descendant is a younger or older version of the ancestor at maturity. D, No size change. Decoupling phenotype from age and size, which remain unchanged. Descendant is a morphologically immature or overly mature version of the ancestor. E, Size change via decoupling from age and phenotype, with decreased age. Descendant is smaller or larger, and younger than the ancestor with same adult phenotype. F, Size change via decoupling from age and phenotype, with increased age. Descendant is smaller or larger, and older than the ancestor with same adult phenotype. G, Size change via decoupling from age and phenotype, with morphologically immature phenotype. Descendant is smaller or larger, and morphologically immature when compared with the ancestor. H, Size change via decoupling from age and phenotype, with morphologically overly mature phenotype. Descendant is smaller or larger, and morphologically overly mature when compared with the ancestor. I, Size change via decoupling size from age and phenotype, in opposite directions. Descendant is either smaller, older, and morphologically overly mature or larger, younger, and morphologically immature.
As noted earlier, size is often substituted for time and plotted against phenotype. However, dissociations between size and age are possible as ontogenies change (McKinney Reference McKinney and McKinney1988). Although important to independently quantify, changes between size and age axes alone are not heterochronic without reference to phenotypic change. Heterochronic terms set forth by Gould (Reference Gould1977) and later refined (Alberch et al. Reference Alberch, Gould, Oster, Wake, Alberch, Gould, Oster and Wake1979; McKinney and McNamara Reference McKinney and McNamara1991; Klingenberg Reference Klingenberg1998) largely deal with outlining allometric change, which has posed problems for describing changes in phenotype with respect to age. In turn, this practice resulted in the misapplication of heterochronic terminology to changes in rate itself (McKinney Reference McKinney and McKinney1988; Gould Reference Gould2000), rather than to the results of changes in rate, timing, and onset in ontogeny (Gould Reference Gould2000). To remedy this problem, we recommend specifying the axis or axes involved in a given mechanism of change specifically with respect to phenotype. In earlier work, similar recommendations have been made when comparing phenotype to age and/or size to age (McKinney and McNamara Reference McKinney and McNamara1991). However, the assertion that heterochrony can be identified by comparing a measure of body size with respect to age has in part led to the widespread misuse of the term (Gould Reference Gould2000; Webster and Zelditch Reference Webster and Zelditch2005). Therefore, heterochrony should be identified by comparing trajectories along the axis of ontogenetic phenotype with respect to age and/or size, but not size against age. In some cases, ontogeny might be modified by decoupling one axis from the other two, as seen in the examples of progenesis and hypermorphosis in Figure 3A. In other cases, all three axes might be decoupled from each other as a result of multiple modifications to ontogeny, such as the production of the smaller (blue) paedomorphic descendant in Figure 3G, which resulted from progenesis with respect to size and neoteny with respect to age, or the production of the blue descendant in Figure 3I, which achieved a smaller body size but a peramorphic phenotype due to hypermorphosis with respect to age and acceleration with respect to size. Patterns resulting from such decoupling between all three axes were also discussed by Klingenberg (Reference Klingenberg1998). It is important to note that all of these modifications to ontogeny are described in terms of phenotype with respect to size and/or age. Historically, the concept of heterochrony became so broad that it nearly became a “catchall” for any morphological change. Despite this misapplication of the term, heterochrony represents a distinct, rare case of morphological evolution that occurs along an ontogenetic line of least resistance (Webster et al. Reference Webster, Sheets, Hughes and Zelditch2001; Webster and Zelditch Reference Webster and Zelditch2005).
Allometric and Sequence Repatterning
Allometric repatterning, as defined by Webster and Zelditch (Reference Webster and Zelditch2005), describes evolutionary modification to the pattern of allometric ontogenetic shape change not produced by heterochrony. Similarly, for non-shape measures of phenotype, sequence repatterning describes a similar modification to the type and order of events or characters not produced by heterochrony. Both kinds of repatterning describe dynamic (ontogenetic) phenotypic change. In this case, the phenotype axis is not shared between ancestor and descendant, and thus the parallelism of ontogeny and phylogeny is broken (Webster and Zelditch Reference Webster and Zelditch2005). Because the axis of phenotypic change is not shared between the two trajectories, allometric and sequence repatterning pose an issue for the three-axis model, because ancestor and descendant now have different phenotype axes and so exist in entirely separate age–size–phenotype spaces. However, even if the phenotype axis is not conserved (shared) between species, this does not mean that taxa cannot be compared in meaningful ways.
Allometric repatterning has been widely documented, including in examples of early Cambrian (Webster et al. Reference Webster, Sheets, Hughes and Zelditch2001) and Late Ordovician (Hunda and Hughes Reference Hunda and Hughes2007) trilobites, modern Arctic charr (Parsons et al. Reference Parsons, Sheets, Skúlason and Ferguson2011), modern piranhas (Zelditch et al. Reference Zelditch, David Sheets and Fink2000), modern rodents (Zelditch et al. Reference Zelditch, Lundrigan, Sheets and Garland2003), modern Leptodactylus frogs (Ponssa and Candioti Reference Ponssa and Candioti2012), and Carboniferous (Stephen et al. Reference Stephen, Manger and Baker2002) and Jurassic (Gerber et al. Reference Gerber, Neige and Eble2007) ammonoids. The study by Hunda and Hughes (Reference Hunda and Hughes2007) is particularly relevant to the present paper, because it focused on an example of body-size change. In their study, Hunda and Hughes (Reference Hunda and Hughes2007) compared two subspecies of trilobite (Flexicalymene retrorsa retrorsa and Flexicalymene retrorsa minuens) that represent sister-taxa (and potentially an ancestor–descendant pair) from the Cincinnatian Series (Upper Ordovician). Using two-dimensional geometric morphometrics of the cephalon, they found that the subspecies differed in their patterns of ontogenetic shape change during the holaspid phase and thus that the trajectory of ontogenetic shape change had been evolutionarily modified: the evolution of the small-bodied F. retrorsa minuens did not result from pure heterochrony but involved allometric repatterning in addition to whatever process was responsible for the size decrease. The authors were careful to highlight the limitations of their data, namely that: (1) only the holaspid phase of ontogeny was sampled for both subspecies, so that their study was silent regarding the nature of any modifications to earlier portions of ontogeny; and (2) developmental age data were unavailable, and the analysis was thus unable to discern the mechanism by which the change in body size occurred. By rigorously quantifying ontogenetic shape change and carefully interpreting the implications of their data, the authors uncovered subtler, more informative results regarding the ontogenetic trajectories of these subspecies than would be understood from traditional, broad considerations of heterochrony.
Ontogenetic Mechanisms of Body-Size Change
The mechanisms that generate size increase or decrease involve decoupling body size from its ancestral relationship with age and/or phenotypic change. At the outset, one might expect that decreases in size correspond to “juvenilized” ontogenies and vice versa with size increase. These associations may hold true in some cases, such as the craniofacial evolutionary allometry relationship seen both interspecifically among mammals (Cardini and Polly Reference Cardini and Polly2013; Cardini et al. Reference Cardini, Polly, Dawson and Milne2015; Cardini Reference Cardini2019; Rhoda et al. Reference Rhoda, Haber and Angielczyk2023) and intraspecifically during ontogeny (Cardini and Polly Reference Cardini and Polly2013; le Verger et al. Reference le Verger, Hautier, Bardin, Gerber, Delsuc and Billet2020), where snout length proportionally increases with body size along a line of least resistance as a general rule. However, size decrease is not always associated with paedomorphic-like trends nor is size increase always associated with peramorphic-like trends. In other cases, we might see different ontogenetic mechanisms in response to other pressures. For example, in fisheries where overharvesting of “normal” adult phenotypes has led to smaller individuals reaching sexual maturity at a younger age (Krohn and Kerr Reference Krohn and Kerr1997; Jørgensen et al. Reference Jørgensen, Ernande and Fiksen2009; Frank et al. Reference Frank, Petrie, Leggett and Boyce2018; Morrongiello et al. Reference Morrongiello, Sweetman and Thresher2019; Ayllón et al. Reference Ayllón, Nicola, Elvira and Almodóvar2021; Roy and Arlinghaus Reference Roy and Arlinghaus2022; see sections below on the Lilliput effect), we instead see accelerated phenotypic change with respect to a reduced adult body size and age (Fig. 3C). There has not been enough investigation into ontogenetic phenotype in these systems to say whether this represents acceleration in the heterochronic sense (and thus peramorphosis) or an increased rate of growth toward the ancestral adult phenotype, but it nevertheless illustrates the above point. Any of several kinds of modification to ontogeny can produce an increase or decrease in size.
One of the simplest theoretical ways to increase or decrease body size is to truncate or extend the growth trajectory without modifying the ancestral relationship between phenotype, age, and size (i.e., progenesis or hypermorphosis, respectively, of both age and size; Fig. 3A). In the case of size increase with hypermorphosis, the descendant adult would appear more morphologically mature in phenotype and be older in age than ancestor. In the case of size decrease with progenesis, the descendant adult would appear as a juvenilized version of the ancestor, being both younger in age and phenotype and thus morphologically immature. If the relationships between phenotype, size, and age are known for the ancestor, then measurement of any one of those variables in the descendant allows prediction of the other two in that descendant.
The next simplest scenario is to decouple size from age and phenotype but retain the ancestral relationship between age and phenotype. In this case, ancestor and descendant would attain a given phenotype at the same age but different sizes (Fig. 3B). Knowledge of the ancestral ontogeny allows prediction of age from phenotype (or vice versa) in the descendant but does not allow prediction of size from either age or phenotype in that descendant.
It is also theoretically possible to decouple age from size and phenotype but retain the ancestral relationship between size and phenotype. In this case, ancestor and descendant would attain a given phenotype at the same size but different age. At a given developmental age, the descendant would have either a paedomorphic phenotype and smaller size, or a peramorphic phenotype and larger size, than the ancestor (Fig. 3C). Knowledge of the ancestral ontogeny allows prediction of phenotype from size (or vice versa) in the descendant but does not allow prediction of age from either size or phenotype in that descendant.
Another possibility would be to decouple both age and size from phenotype but retain the ancestral relationship between age and size. In this case, ancestor and descendant would attain a given phenotype at a different size and age (Fig. 3D). Knowledge of the ancestral ontogeny allows prediction of age from size (or vice versa) in the descendant but does not allow prediction of phenotype from either age or size in that descendant. It should be noted that the ancestral size is conserved in both of the above examples (Fig. 3C,D). Although neither example represents a case of ontogenetic size change compared with the others described here, these simple adjustments to ontogeny should be considered for both possible scenarios in the fossil record and the more complex scenarios described below (Fig. 3E–I).
More complicated scenarios arise if none of the ancestral relationships between age, size, and phenotype are retained in the descendant. A given evolutionary change in size could in principle be achieved via a peramorphic or paedomorphic shift in phenotype, and with an increase or decrease in the duration of growth, as outlined in Figure 3E–I. Knowledge of the ancestral ontogeny would not shed light on the relationships between age, size, and phenotype in the descendant. We outline these ontogenetic mechanisms in this non-exhaustive list to provide context for how changes in body size relate to corresponding, decoupled, and nonexistent changes in age and phenotypic maturity. Depending upon which ancestral relationships between age–size–phenotype are evolutionarily conserved, certain predictions can be made about the combinations of age, size, and phenotype values in the descendant. Hypotheses regarding how the ancestral ontogeny was modified are therefore testable. As discussed earlier, heterochrony is ultimately a multivariate framework, and disregarding one axis as “interchangeable” with another could easily lead one to miss important mechanistic underpinnings or to mischaracterize size change in the fossil record.
Miniaturization and Gigantism
Cases of size increase and decrease are often referred to as “miniaturization” and “gigantism” in the literature, but we argue that they should be avoided as terms for any directional changes in body size. Both terms not only indicate an extreme decrease or increase in size, but also a shift in biological mode, meaning size change results in major changes to the physiology, anatomy, ecology, life history, or behavior of an organism (Hanken and Wake Reference Hanken and Wake1993). Yet these terms have been applied broadly to a variety of nonapplicable or unclear cases, including “miniaturization” and “gigantism” seen in insular size change, or the Island rule (Stanley Reference Stanley1973; Raia and Meiri Reference Raia and Meiri2006), and the “miniaturized” faunas described in the Lilliput effect (He et al. Reference He, Shi, Feng, Campi, Gu, Bu, Peng and Meng2007; Harries and Knorr Reference Harries and Knorr2009; Huang et al. Reference Huang, Harper, Zhan and Rong2010; Borths and Ausich Reference Borths and Ausich2011). Determining whether a taxon is truly miniaturized, meaning greatly reduced in size such that it occupies a different mode of life than its ancestor, is extremely challenging without the context of ontogeny and phylogeny. Many cases of true miniaturization and gigantism likely represent instances of allometric or sequence repatterning, as the magnitude of change in the organism's biology almost certainly requires deviating from the ancestral phenotypic trajectory throughout ontogeny. As such, miniaturization and gigantism are also “phylogenetic statements” and indicate dramatic shifts in body size and mode of life with reference to other members of a clade (Haken and Wake Reference Hanken and Wake1993). Cases of miniaturization and gigantism are plentiful, especially among living taxa, including miniature threadsnakes of the West Indies (Martins et al. Reference Martins, Koch, Joshi, Pinto, Machado, Lopes and Passos2021); Brookesia chameleons, including the exceptionally small Brookesia nana (Glaw et al. Reference Glaw, Köhler, Townsend and Vences2012); kinosternine turtles (Cordero Reference Cordero2021); extinct varanid lizards (Erickson et al. Reference Erickson, De Ricqles, de Buffrénil, Molnar and Bayless2003); baleen whales (Slater et al. Reference Slater, Goldbogen and Pyenson2017); and amphiumid salamanders (Bonett et al. Reference Bonett, Chippindale, Moler, van Devender and Wake2009).
Taphonomic Biases and Juvenile Mortality
Although there are plentiful examples of ontogenetic shifts resulting in body-size change in the fossil record, some instances of apparent size change do not involve actual biological change as presented in a fossil population. Such apparent cases of size change include taphonomic size biases and high juvenile mortality in an assemblage. In the case of taphonomic bias, paleobiologists should be cautious of fossil assemblages that preserve only one size or age class of a given taxon. Although they can provide abundant fossil material, aggregations of particular size or age classes can strongly skew analyses of size and ontogeny without proper consideration of taphonomic setting and ecomorphology. Furthermore, size sorting, time averaging, and differential preservational potential of ontogenetic stages can produce misleading trends for those interested in ontogenetic information in fossil material (Kidwell and Bosence Reference Kidwell, Bosence, Allison and Briggs1991; Aslan and Behrensmeyer Reference Aslan and Behrensmeyer1996; Behrensmeyer et al. Reference Behrensmeyer, Kidwell and Gastaldo2000; Britt et al. Reference Britt, Eberth, Scheetz, Greenhalgh and Stadtman2009; Gostling et al. Reference Gostling, Dong and Donoghue2009; Brayard et al. Reference Brayard, Nützel, Stephen, Bylund, Jenks and Bucher2010; Chattopadhyay et al. Reference Chattopadhyay, Rathie and Das2013; Wosik and Evans Reference Wosik and Evans2022). Considering time averaging, temporally distinct populations can easily be admixed, leading to a composite distribution of phenotypes in the pooled sample (Kidwell and Bosence Reference Kidwell, Bosence, Allison and Briggs1991; Aslan and Behrensmeyer Reference Aslan and Behrensmeyer1996; Behrensmeyer et al. Reference Behrensmeyer, Kidwell and Gastaldo2000). Transport-based size sorting and unequal preservation potential among ontogenetic stages of a population can restrict the portion of an ontogenetic trajectory available for study (Aslan and Behrensmeyer Reference Aslan and Behrensmeyer1996; Chattopadhyay et al. Reference Chattopadhyay, Rathie and Das2013). Such taphonomic biases are not representative of size variation in the living population but can mimic biological phenomena such as the Lilliput effect (Brayard et al. Reference Brayard, Nützel, Stephen, Bylund, Jenks and Bucher2010). Geologic setting and taphonomic processes are easily overlooked, but these processes should be embraced if we are to study ontogeny in the fossil record with fidelity. An understanding of the depositional setting and possible transport mechanisms of fossil material is just as crucial as an awareness of where specimens sit along a given ontogenetic trajectory.
As another example, high juvenile mortality in a fossil population can appear similar to an evolutionary (or plastic) ontogenetic shift toward a morphologically immature phenotype. In the case of the Lilliput effect (see following section), sampling of smaller (and perhaps morphologically immature) specimens in the aftermath of extinctions could be the result of a real ontogenetic response to an unfavorable environment or the result of increased juvenile mortality (Twitchett Reference Twitchett2007; Huang et al. Reference Huang, Harper, Zhan and Rong2010; Botha Reference Botha2020; Huttenlocker et al. Reference Huttenlocker, Botha, Browning, Kulik, Tshibalanganda and du Plessis2022). In the case of juvenile mortality, body-size distributions are skewed due to preferential die-off of particular ontogenetic stages, but without a significant change to the underlying ontogeny of the organism (Twitchett Reference Twitchett2007). Often, the mass mortality of juveniles reflects behavioral responses to environmental stressors like drought (Weigelt Reference Weigelt1989; Varricchio et al. Reference Varricchio, Sereno, Xijin, Lin, Wilson and Lyon2008; Viglietti et al. Reference Viglietti, Smith and Compton2013; Smith et al. Reference Smith, Botha and Viglietti2022) and thus are not representative of the entire size–age structure of a population. Additionally, specific reproductive strategies (or changes in reproductive strategies) have been suggested to drive overrepresentation of juveniles in the fossil record (Stephen et al. Reference Stephen, Bylund, Garcia, McShinsky and Carter2012; Botha-Brink et al. Reference Botha-Brink, Codron, Huttenlocker, Angielczyk and Ruta2016). Although juvenile mortality does promote a “size phenomenon” in the fossil record, we do not consider it to be an ontogenetic mechanism of body-size change. The perceived size change is a result of relatively few individuals reaching normal adult size, but it does not result in a smaller adult size. Because the size change instead reflects preferential die-off of abundant juveniles rather than an evolutionary trend in the entire population, juvenile mortality is a “false” size decrease. To avoid conflating the two, rigorous sampling across stratigraphy, a range of localities, and ontogeny for multiple assemblages are necessary. Even in a population with high juvenile mortality, population numbers have to be maintained by reproducing adults, and the presence of rare, large individuals can be an indicator of increased juvenile mortality.
The Lilliput Effect
Potential empirical applications of the age–size–phenotype framework to macroevolutionary body-size phenomena are plentiful in the fossil record and span a variety of clades and time periods. We use the Lilliput effect to introduce how this framework can clarify aspects of size evolution as well as candidate systems where it could be used. We chose the Lilliput effect—a pattern of body-size decrease during extinctions—because of the wide interest in size trends during extinctions. Body size has long been studied as a metric of life-history patterns (Metcalfe et al. Reference Metcalfe, Twitchett and Price-Lloyd2011; Botha-Brink et al. Reference Botha-Brink, Codron, Huttenlocker, Angielczyk and Ruta2016) and ecosystem recovery dynamics (Sallan and Galimberti Reference Sallan and Galimberti2015; Chen et al. Reference Chen, Song, He, Tong, Wang and Wu2019) during extinctions and their subsequent recoveries. In addition, the Lilliput effect is an ideal phenomenon to apply the age–size–phenotype framework due to the relative abundance of single species and genera that thrive in the aftermath of extinctions. These “disaster” taxa are often opportunistic generalists that frequently dominate during the immediate crisis and briefly into the following recovery (Benton and Newell Reference Benton and Newell2014). Resilience to the adverse conditions during the crisis often comes with extreme costs, however, and disaster taxa often experience shifts in morphology and life history during extinctions. Many disaster taxa are relatively abundant and display variation in size, age and phenotypic characteristics, making them good candidates for the age–size–phenotype framework. In the following sections, we review the history of the Lilliput effect, challenges in defining this pattern, process-based refinements to studying it using the age–size–phenotype framework, and relevant case studies of the phenomenon.
A History of the Lilliput Effect
The Lilliput effect was initially defined by Urbanek (Reference Urbanek1993) as a “post-event syndrome” that resulted in both size reduction and a “subnormal phenotype” from hindered phenotypic development. This definition attributed small size and associated phenotypic shifts to harsh postextinction environmental conditions and reduced competition in disturbed environments. Urbanek's definition outlines expectations for both the body size and phenotype of Lilliputian species in the aftermath of an extinction and restricts the phenomenon as a process that occurs temporarily within a single species. Since this initial work, the Lilliput effect has been reported in a diverse range of clades, including brachiopods (Chen et al. Reference Chen, Kaiho and George2005; He et al. Reference He, Shi, Feng, Campi, Gu, Bu, Peng and Meng2007; He et al. Reference He, Twitchett, Zhang, Shi, Feng, Yu, Wu and Peng2010; Huang et al. Reference Huang, Harper, Zhan and Rong2010; Metcalfe et al. Reference Metcalfe, Twitchett and Price-Lloyd2011; Schaal et al. Reference Schaal, Clapham, Rego, Wang and Payne2016; Chen et al. Reference Chen, Song, He, Tong, Wang and Wu2019), mollusks (Twitchett Reference Twitchett2007; Atkinson and Wignall Reference Atkinson and Wignall2020), ostracodes (Forel et al. Reference Forel, Crasquin, Chitnarin, Angiolini and Gaetani2015); corals (Kaljo Reference Kaljo1996), foraminifera (Keller and Abramovich Reference Keller and Abramovich2009; Song et al. Reference Song, Tong and Chen2011), echinoderms (Jeffery Reference Jeffery2001; Twitchett and Oji Reference Twitchett and Oji2005; Borths and Ausich Reference Borths and Ausich2011; Brom et al. Reference Brom, Salamon, Ferre, Brachaniec and Szopa2015), graptolites (Urbanek Reference Urbanek1993), and vertebrates (Girard and Renaud Reference Girard and Renaud1996; Renaud and Girard Reference Renaud and Girard1999; Mutter and Neuman Reference Mutter and Neuman2009; Huttenlocker and Botha-Brink Reference Huttenlocker and Botha-Brink2013; Huttenlocker Reference Huttenlocker2014; Sallan and Galimberti Reference Sallan and Galimberti2015; Botha-Brink et al. Reference Botha-Brink, Codron, Huttenlocker, Angielczyk and Ruta2016; Berv and Field Reference Berv and Field2018; Botha Reference Botha2020; Xinsong et al. Reference Xinsong, Siyu, Yinfan and Yiming2020). These body-size reductions also occur during many extinction events and biotic crises, including the Ordovician–Silurian mass extinction (Kaljo Reference Kaljo1996; Borths and Ausich Reference Borths and Ausich2011), the late Silurian extinction events (Urbanek Reference Urbanek1993), the Frasnian–Famennian Mass extinction (Girard and Renaud Reference Girard and Renaud1996; Renaud and Girard Reference Renaud and Girard1999; Xinsong et al. Reference Xinsong, Siyu, Yinfan and Yiming2020), the end-Devonian mass extinction (Sallan and Galimberti Reference Sallan and Galimberti2015), the end-Permian mass extinction (EPME) (Chen et al. Reference Chen, Kaiho and George2005; Twitchett and Oji Reference Twitchett and Oji2005; He et al. Reference He, Shi, Feng, Campi, Gu, Bu, Peng and Meng2007, Reference He, Twitchett, Zhang, Shi, Feng, Yu, Wu and Peng2010; Twitchett Reference Twitchett2007; Mutter and Neuman Reference Mutter and Neuman2009; Huang et al. Reference Huang, Harper, Zhan and Rong2010; Metcalfe et al. Reference Metcalfe, Twitchett and Price-Lloyd2011; Song et al. Reference Song, Tong and Chen2011; Huttenlocker and Botha-Brink Reference Huttenlocker and Botha-Brink2013; Huttenlocker Reference Huttenlocker2014; Botha-Brink et al. Reference Botha-Brink, Codron, Huttenlocker, Angielczyk and Ruta2016; Schaal et al. Reference Schaal, Clapham, Rego, Wang and Payne2016; Chen et al. Reference Chen, Song, He, Tong, Wang and Wu2019; Botha Reference Botha2020), the end-Triassic mass extinction (Atkinson and Wignall Reference Atkinson and Wignall2020), the Cretaceous marine anoxia events (Brom et al. Reference Brom, Salamon, Ferre, Brachaniec and Szopa2015), and the Cretaceous–Paleogene mass extinction (Jeffery Reference Jeffery2001; Keller and Abramovich Reference Keller and Abramovich2009; Berv and Field Reference Berv and Field2018). The widespread documentation of this phenomenon suggests that the Lilliput effect is a common response to stressful environmental or ecological conditions during biotic crises. However, there is little consensus on what the “Lilliput effect” is in a biologically meaningful sense, because the mechanisms that underlie the Lilliput effect are poorly defined and understood.
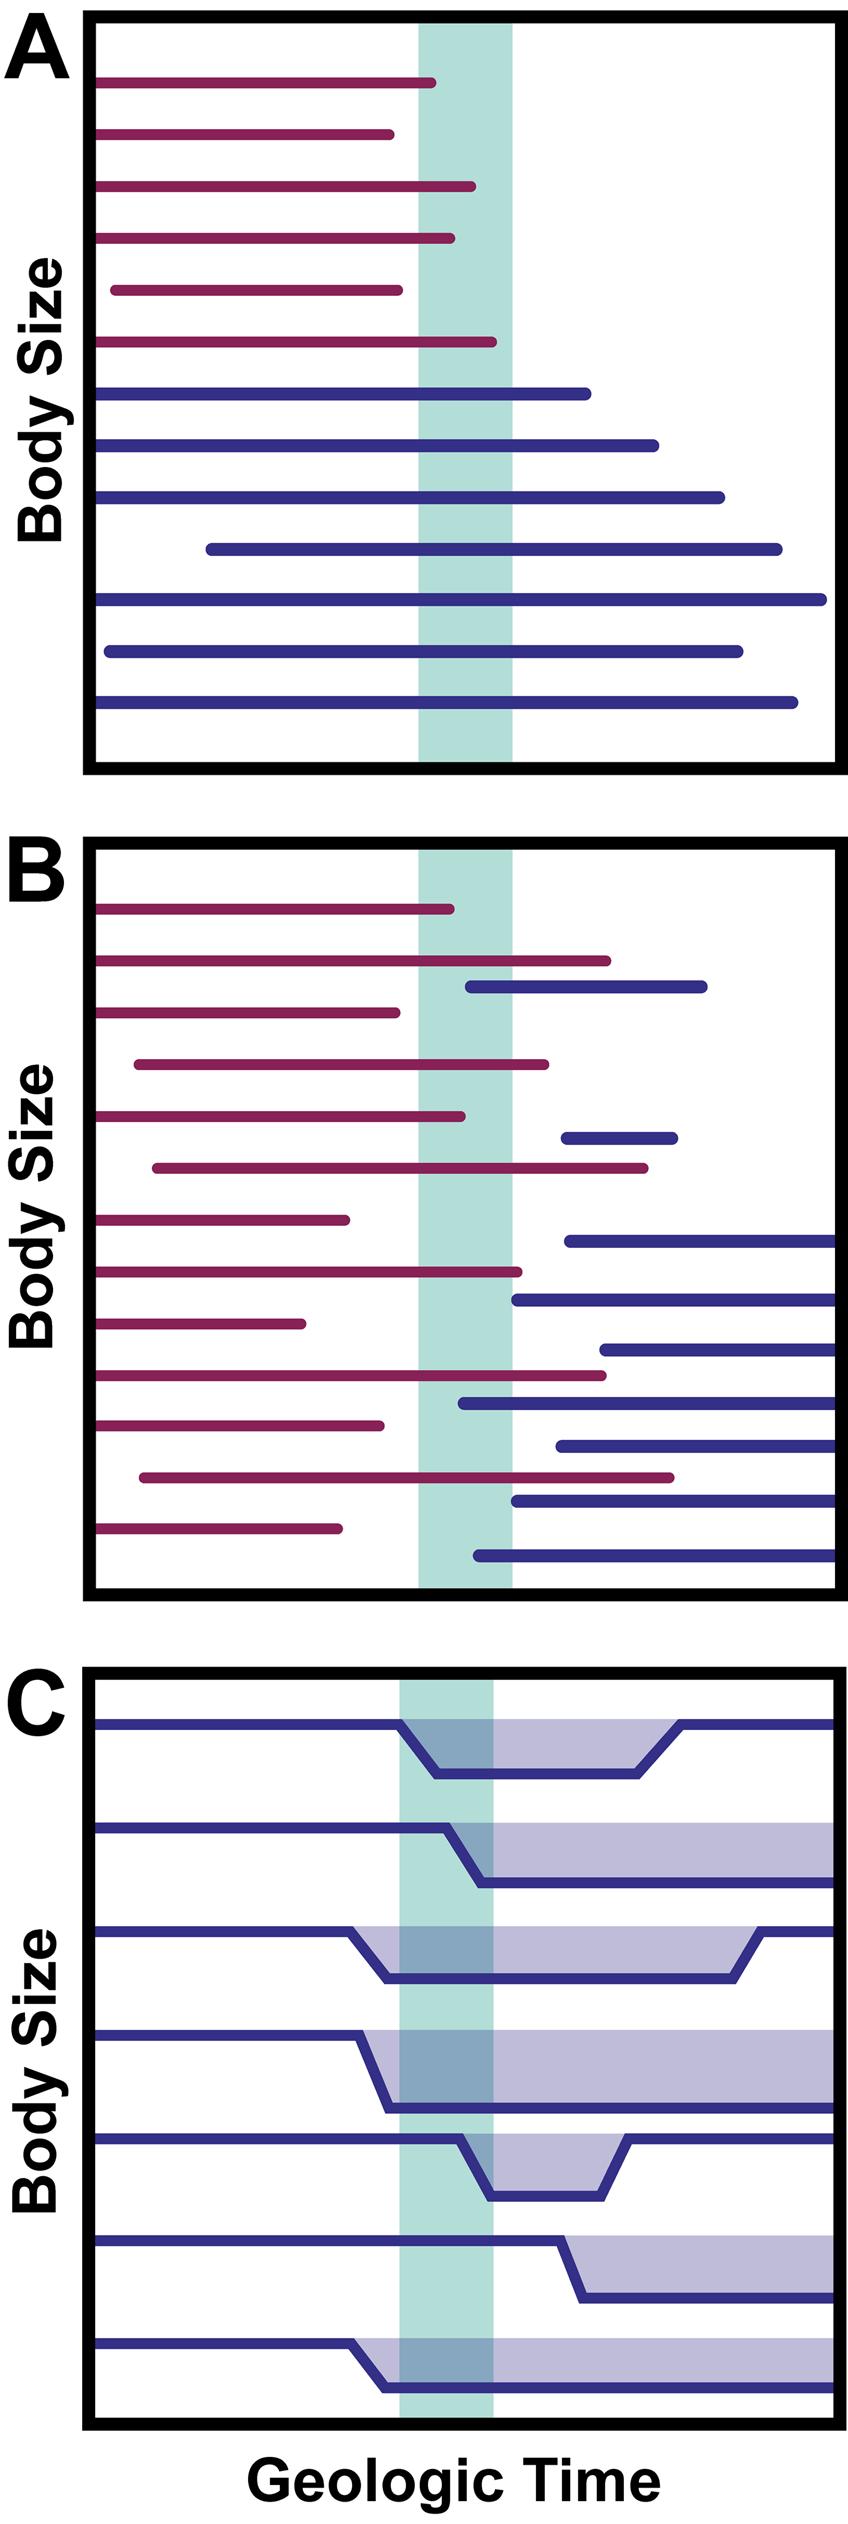
Following the work of Urbanek, many cases of decreased body size following mass extinctions were recognized as Lilliput effects (Girard and Renaud Reference Girard and Renaud1996; Kaljo Reference Kaljo1996; Renaud and Girard Reference Renaud and Girard1999; Harper and Jia-Yu Reference Harper and Jia-Yu2001; Jeffery Reference Jeffery2001; Chen et al. Reference Chen, Kaiho and George2005; Twitchett and Oji Reference Twitchett and Oji2005; He et al. Reference He, Shi, Feng, Campi, Gu, Bu, Peng and Meng2007). As more and more examples of the Lilliput effect were observed across time periods and clades, the concept of the phenomenon expanded. Prior work seeking to categorize and define the Lilliput effect has focused on its faunal patterns. The phenomenon has been considered to involve (1) the temporary removal of large taxa (“faunal stunting” of Harries and Knorr [2009]), (2) the origination of smaller taxa, and (3) within-lineage size decrease (Twitchett Reference Twitchett2007; Harries and Knorr Reference Harries and Knorr2009; Fig. 4). However, this broadly inclusive concept, though useful in documenting the general effects of extinctions, does not inform us of the nature of the Lilliput effect and its underlying mechanisms in specific cases. Indeed, there is considerable confusion concerning which cases of size decrease count as examples of the Lilliput effect due to the lack of a process-based definition. Discussion of whether or not the Lilliput effect is an “evolutionary” or “ecological” phenomenon (Harries and Knorr Reference Harries and Knorr2009) further complicates our understanding. Indeed, this question presents a false dichotomy of sorts, as ecology, evolution, and other factors almost certainly interact and/or vary in influence depending on the clade, environment, and time period in question. The typical resolution of the fossil record itself also hinders us from evaluating whether Lilliput patterns are driven by microevolutionary/ecological or macroevolutionary forces. Finally, relying on “ecology” versus “evolution” generates contingency issues that cannot be resolved in the fossil record. For example, some Lilliputian taxa went extinct before they had a chance to return to their original body size, as in the case of the dicynodont Lystrosaurus (Botha-Brink et al. Reference Botha-Brink, Codron, Huttenlocker, Angielczyk and Ruta2016; Botha Reference Botha2020; Viglietti et al. Reference Viglietti, Benson, Smith, Botha, Kammerer, Skosan and Butler2021).
Conventional definitions of the Lilliput effect following Twitchett (Reference Twitchett2007) and Harries and Knorr (Reference Harries and Knorr2009), with horizontal lines representing lineage occurrences through geologic time and the vertical green bar representing an extinction boundary. Purple lines represent victim taxa, while blue lines represent surviving or postextinction taxa. A, Removal, or preferential extinction, of large-bodied taxa. B, Increased origination of small-bodied taxa following an extinction boundary. C, Temporary within-lineage size decrease.
What Is the Lilliput Effect?
We propose that a common problem in the current definitions of the Lilliput effect is that they primarily focus on the pattern of general size decrease during an extinction interval, as opposed to the process(es) by which the size decrease was achieved. Related to this issue, the importance and utility of phylogenetic data have largely been overlooked in studies of the Lilliput effect (Harries and Knorr Reference Harries and Knorr2009). To resolve the confusion around the Lilliput effect, we propose two refinements that more explicitly include phylogeny and apply the age–size–phenotype framework to better focus on the process of size reduction. First, the Lilliput effect should be evaluated in a phylogenetic context as described earlier, either within a single species, anagenetic ancestor–descendant pairs, sister-species, or a small clade with a robust phylogeny. Second, the Lilliput effect should be categorized by proximal mechanisms underlying size reduction and other changes to phenotype rather than only documenting the pattern of smaller individuals or taxa during/after an extinction event. Relevant mechanisms include ontogenetic shifts, such as allometric repatterning, sequence repatterning, and heterochrony; evolutionary size-selective sorting processes, which can arise from size-selective extinction and/or origination; and potentially other non-evolutionary phenomena such as the Lazarus effect (Flessa and Jablonski Reference Flessa and Jablonski1983; Jablonski Reference Jablonski1986; Fara Reference Fara2001) as discussed by Twitchett (Reference Twitchett2007) and Harries and Knorr (Reference Harries and Knorr2009). These proximal mechanisms likely share common ultimate causes, which include environmental stress and limited resources (Twitchett Reference Twitchett2001, Reference Twitchett2007). Furthermore, we disregard that the Lilliput effect must be “temporary,” as previously posited (Urbanek Reference Urbanek1993; Twitchett Reference Twitchett2007), because this creates contingency problems with the fossil record. Our revisions clarify what cases of size decrease count as Lilliputs, as well as how specific examples of the Lilliput effect may differ from one another. Under our revised definition, the Lilliput effect is an instance of size decrease in a single species, anagenetic lineage, or small clade observed during a widespread extinction event, diversity crisis, or other period of high taxonomic turnover compared with background intervals.
Ontogenetic Change and the Lilliput Effect
Ontogeny is a particularly interesting framework with which to evaluate the Lilliput effect, given that several examples of size decrease across mass extinctions recognize “immature” phenotypes (MacLeod et al. Reference MacLeod, Ortiz, Fefferman, Clyde, Schulter, MacLean, Culver and Rawson2000; Forel et al. Reference Forel, Crasquin, Chitnarin, Angiolini and Gaetani2015; Botha-Brink et al. Reference Botha-Brink, Codron, Huttenlocker, Angielczyk and Ruta2016; Botha Reference Botha2020), including the original example outlined by Urbanek (Reference Urbanek1993). However, some authors posit that this size decrease is due to “developmental plasticity” rather than the Lilliput effect. Given that the Lilliput effect has been categorized as a pattern rather than a process, there is no reason to disregard size reduction via ontogenetic change as cases of the Lilliput effect. Furthermore, “developmental plasticity” is often improperly used in the paleobiological literature, as it refers to a specific process by which varying conditions in the macroenvironment of an organism prompt distinct developmental responses from the same genotype (Webster Reference Webster2019). Hypotheses regarding changes in macroenvironmental sensitivity of a genotype (and thus of environmental canalization) cannot be unambiguously tested in the fossil record (Webster Reference Webster2019). However, hypotheses regarding modification to the relationship between age, size, and phenotype can be (see “Ontogenetic Mechanisms of Body-Size Change”).
Ontogenetic change is an important yet overlooked mechanism in producing the Lilliput effect, particularly because there are cases in extant systems where environmental pressure produces comparable alterations to ontogeny. Fisheries provide a particularly compelling example of this phenomenon, as artificial stress has prompted rapid changes in fish populations. Harvesting the largest, oldest, and most fecund individuals, frequent harvesting, and climate change have led to rapid growth rates, smaller body sizes, earlier onset of sexual maturity, and other ontogenetic shifts in a variety of fish species (Krohn and Kerr Reference Krohn and Kerr1997; Jørgensen et al. Reference Jørgensen, Ernande and Fiksen2009; Frank et al. Reference Frank, Petrie, Leggett and Boyce2018; Morrongiello et al. Reference Morrongiello, Sweetman and Thresher2019; Ayllón et al. Reference Ayllón, Nicola, Elvira and Almodóvar2021; Roy and Arlinghaus Reference Roy and Arlinghaus2022). Habitat disturbance and climate change have produced similar size-reduction effects in a variety of taxa, including various species of fishes (Audzijonyte et al. Reference Audzijonyte, Fulton, Haddon, Helidoniotis, Hobday, Kuparinen, Morrongiello, Smith, Upston and Waples2016), salamanders (Caruso et al. Reference Caruso, Sears, Adams and Lips2015), toads (Vogel and Pechmann Reference Vogel and Pechmann2010; Cogălniceanu et al. Reference Cogălniceanu, Stănescu, Székely, Topliceanu, Iosif and Székely2021), ants (Gibb et al. Reference Gibb, Sanders, Dunn, Arnan, Vasconcelos, Donoso and Andersen2018), birds (Van Buskirk et al. Reference Van Buskirk, Mulvihill and Leberman2010; Weeks et al. Reference Weeks, Willard, Zimova, Ellis, Witynski, Hennen and Winger2020), and mammals (Smith et al. Reference Smith, Betancourt, Brown, Smith, Betancourt and Brown1995; Post et al. Reference Post, Stenseth, Langvatn and Fromentin1997; Ozgul et al. Reference Ozgul, Tuljapurkar, Benton, Pemberton, Clutton-Brock and Coulson2009). Given these neontological data and emerging patterns in the fossil record, it is likely that environmental stress during extinctions would similarly prompt paedomorphosis and related ontogenetic responses from Lilliputian taxa (Harries et al. Reference Harries, Kauffman and Hansen1996).
To evaluate ontogenetic shifts as mechanisms to generate the Lilliput effect, we can return to the age–size–phenotype framework and compare parameters of ontogenetic trajectories before, during, and after an extinction. As discussed earlier, the Lilliput effect only requires a decrease in body size during an interval of heightened extinction or faunal turnover in a species, anagenetic lineage, or small clade, but a variety of mechanisms can produce it. Any of the mechanisms involving size decrease discussed earlier will constitute an example of the Lilliput effect by ontogenetic shift (Fig. 3). Along with identifying when ontogenetic change is a mechanism of the Lilliput effect, this framework will also allow us to recognize whether there are common modes of modification to ontogeny by which Lilliputian taxa are produced.
The abundance of many proposed Lilliputian taxa offers paleobiologists many potential opportunities to investigate the mechanisms underlying the phenomenon. The preservation biases of different taxonomic groups and taphonomic settings can limit the amounts and kinds of data available for age, size, and phenotype respectively. Nevertheless, for most groups for which size is available, data can be gathered for at least two, if not all three, axes of the model. In fact, some studies have attempted to quantify ontogenetic change in size-reduced populations, whether under the label of the Lilliput effect or not, including Cretaceous–Paleogene, Paleocene–Eocene, and late Eocene foraminifera (MacLeod Reference MacLeod, Sharpton and Ward1990; MacLeod and Kitchell Reference MacLeod, Kitchell, Rohlf and Bookstein1990; MacLeod et al. Reference MacLeod, Keller and Kitchell1990, Reference MacLeod, Ortiz, Fefferman, Clyde, Schulter, MacLean, Culver and Rawson2000), lingulid brachiopods of the EPME (Metcalfe et al. Reference Metcalfe, Twitchett and Price-Lloyd2011), and non-mammalian therapsids of the EPME (Huttenlocker and Botha-Brink Reference Huttenlocker and Botha-Brink2013, Reference Huttenlocker and Botha-Brink2014; Botha-Brink et al. Reference Botha-Brink, Codron, Huttenlocker, Angielczyk and Ruta2016; Botha Reference Botha2020).
In a synthesis paper, MacLeod et al. (Reference MacLeod, Ortiz, Fefferman, Clyde, Schulter, MacLean, Culver and Rawson2000) presented a strong working example for evaluating the role of ontogeny in size decrease across extinctions, albeit solely in an allometric framework, and summarized work investigating the size and “shape” of planktic and benthic foraminifera during the Cretaceous–Paleogene mass extinction, the Paleocene–Eocene thermal maximum, and the late Eocene cooling. The authors utilized robust stratigraphic frameworks and compared allometric patterns before and after these three events. Although not called the Lilliput effect, their ontogenetic framing of size change can be usefully applied to future studies of the Lilliput effect. It should be noted, however, that some of their data suffer from dimensionality bias, for example, the use of test chamber number as their metric for phenotype to test for paedomorphosis in one case. Where appropriate, higher-dimensionality data, such as geometric morphometric shape data (utilized in a separate analysis), would serve as a richer test of conservation of phenotype across ontogeny and between species (Webster and Zelditch Reference Webster and Zelditch2005). They also did not discuss how lacking a parameter for age affects their conclusions, and they somewhat conflated age with their phenotype metrics. Chamber count may be a better metric for age than phenotype for this reason, and in fact was used as a means of developmental staging in later work (Shi and MacLeod Reference Shi and MacLeod2016).
Metcalfe et al. (Reference Metcalfe, Twitchett and Price-Lloyd2011) also provided a useful example with lingulid brachiopod size and growth lines in the earliest Triassic, comparing age and size axes, albeit with no measure of phenotype. The authors posited that the higher density of growth lines in the immediate post-extinction ‘Lingula’ specimens represents slowed growth and high instances of growth cessation as drivers of small body size rather than juvenile mortality. Without phenotypic data, their interpretation of their age and size data could mirror the mechanisms seen in either Figure 3F or I, where we see smaller individuals with an extended life span. Further data on the phenotypic development of ‘Lingula’, the periodicity of brachiopod growth lines, and the taxonomic affinities and phylogenetic relationships of Permo-Triassic ‘Lingula’ species are still needed for the example to fulfill all parameters of our age–size–phenotype model.
Studies of the non-mammalian therapsid Moschorhinus kitchingi during the EPME in the Karoo Basin, South Africa (Huttenlocker and Botha-Brink Reference Huttenlocker and Botha-Brink2013, Reference Huttenlocker and Botha-Brink2014), are especially promising for this framework, and indicate that this system is worthy of further investigation. In this research, the authors evaluated size and age metrics, and described data that could apply well to phenotype. Moschorhinus kitchingi was a common therocephalian during the EPME interval in the Karoo Basin, and its comparatively rich fossil record reveals that Triassic cranial and postcranial specimens of the organism are considerably smaller than their preextinction Permian counterparts (Huttenlocker and Botha-Brink Reference Huttenlocker and Botha-Brink2013; Huttenlocker Reference Huttenlocker2014). Furthermore, histological sections show that Triassic specimens present considerably fewer growth marks and appear to have grown more rapidly (Huttenlocker and Botha-Brink Reference Huttenlocker and Botha-Brink2013). These data, combined with other histological metrics relevant to phenotype, indicate that M. kitchingi could represent a Lilliput effect due to ontogenetic change. The mechanism for size decrease in M. kitchingi could be the global progenesis outlined in Figure 3A or the non-heterochronic size decrease with corresponding decrease in age found in Figure 3E. The authors did not relate their data to an ontogenetic framework in the manner that we suggest here, but this could be accomplished in future work by including additional data for phenotype. Because many tetrapod crania from the Karoo Basin are preserved with varying degrees of taphonomic deformation (Kammerer et al. Reference Kammerer, Deutsch, Lungmus and Angielczyk2020), morphometric data may be unreliable in this system. Instead, ontogenetic phenotypic change summarized by discrete data, such as ontogenetic sequence analysis (OSA) (Colbert and Rowe Reference Colbert and Rowe2008) and ordination techniques like nonmetric multidimensional scaling (NMDS) (Griffin and Nesbitt Reference Griffin and Nesbitt2016a) are more appropriate. Moschorhinus kitchingi likely could fit into the age–size–phenotype framework with information for all three of these axes, so future work on this taxon is strongly encouraged.
Size-Selective Sorting and the Lilliput Effect
Besides ontogenetic shifts, size-selective sorting represents another mechanism important to the Lilliput effect. We use size-selective sorting rather than size-selective extinction, because the diversification of smaller taxa in the aftermath of extinctions should also fall within this mechanism. Both selection for the extinction of large forms and preferential origination/survival of small forms represent responses to a common environmental pressure, rather than two distinct mechanisms, as portrayed in prior studies of the Lilliput effect. In either case of size-selective sorting, factors such as limited resources, shifting food webs, and environmental stress could impose a size filter on a given group, resulting in extinction, migration, and/or low population numbers, all of which could produce an apparent size reduction (Twitchett Reference Twitchett2001). At the beginning of an extinction event, the initial imposition an environmental size filter could likely result in the extinction of large-bodied taxa. As the extinction proceeds, the size filter would remain in place, selecting for small-bodied taxa among survivors and the species that originate in the earliest stages of extinction recovery (Fig. 5).
An imaginary clade of salamanders illustrating possible variation in Lilliput effect mechanisms across a phylogeny. Cases of ontogenetic repatterning are represented in blue and with an ancestral and descendant phenotype. Cases of size-based species sorting are represented in orange.

Even though size-selective sorting involves no ontogenetic response, the age–size–phenotype framework can aid in assessing whether or not size reduction has arisen via ontogeny or a size-selective process. Rather than observing an ontogenetic response, in this case, we would expect to see the disappearance of larger members of a clade as well as surviving smaller members with relatively unchanged ontogenies across the course of their stratigraphic record (Fig. 5). Under this kind of size filter, we would also expect to see small-bodied remaining clades diversifying with the opening of ecological space (Twitchett Reference Twitchett2007). The patterns of “removal” of large taxa and “addition” of smaller taxa are treated as two separate kinds of Lilliput effect under traditional definitions of the phenomenon, but here we view them as two patterns resulting from the same process, a filter against large body size in a given taxonomic group.
Numerous reported cases of the of the Lilliput effect (sensu lato) involve the disappearance of larger taxa and/or origination of small taxa. Most of these studies do not utilize a phylogeny to confirm the evolutionary polarity of these trends, however. For many groups, especially extinct invertebrates, this is simply because robust phylogenies are not yet available. Without the context of phylogenetic relationships, it is easy to misinterpret the polarity of size trends in the Lilliput effect, as outlined in “Phylogenetics and Size-Change” and later in the section dealing with phylogeny and the Lilliput effect specifically. However, some groups with well-represented Lilliputian members have recently received rigorous phylogenetic treatments. An excellent example is found among rhynchonelliform brachiopods of the EPME. The Lilliput effect has been extensively documented in rhynchonelliforms (Chen et al. Reference Chen, Kaiho and George2005; He et al. Reference He, Shi, Feng, Campi, Gu, Bu, Peng and Meng2007, Reference He, Twitchett, Zhang, Shi, Feng, Yu, Wu and Peng2010; Huang et al. Reference Huang, Harper, Zhan and Rong2010; Schaal et al. Reference Schaal, Clapham, Rego, Wang and Payne2016; Chen et al. Reference Chen, Song, He, Tong, Wang and Wu2019), largely utilizing size metrics in the absence of a phylogeny, but two recent phylogenetic studies of rhynchonellide and spiriferinid brachiopods during the EPME and recovery provide data that could clarify Lilliputian mechanisms among rhynchonelliforms (Guo et al. Reference Guo, Chen and Harper2020, Reference Guo, Chen, Harper and Huang2021). Along with generating a phylogenetic tree for members of Rhynchonellida and Spiriferinida during the late Permian through the Late Triassic, Guo and colleagues also assessed metrics of size and phenotype in both groups. In the rhynchonellides, a tip-dated Bayesian approach was used to generate the tree, and shell ornamentation index and shell size were plotted on branch tips and used to generate ancestral-state reconstructions (Guo et al. Reference Guo, Chen, Harper and Huang2021). The ornamentation index, which measures the coarseness, distribution, and strength of shell ribs, is variable among taxa and during ontogeny. The authors highlighted that in taxa at or near the Permo-Triassic boundary, shell size is smaller and ornamentation less complex than in earlier and later members of the clade. They suggested this as evidence of “paedomorphosis,” but without additional phenotypic and age data, this could be interpreted as a case of clade-wide size-selective sorting, given that ornamentation index varies with both phylogeny and ontogeny (Guo et al. Reference Guo, Chen, Harper and Huang2021). This approach is applicable to similar systems, such as the dataset of South China brachiopods presented in Chen et al. (Reference Chen, Song, He, Tong, Wang and Wu2019). Although the latter study boasts an impressive sample size (n = 3,316), it lacks a phylogeny and other metrics for phenotype aside from body size. Expanding the recently developed phylogeny to the rhynchonellids in their dataset (which would likely entail extensive taxonomic revision) in addition to comparative analysis of size and ornamentation index, or other measures of phenotype that better differentiate phylogenetic and ontogenetic patterns, would provide a more rigorous description of the Lilliputian patterns and the mechanisms that are driving these patterns.
An additional direction for future work on size sorting and the Lilliput effect includes the coincidence of Lilliputian taxa and Lazarus taxa, which has been noted since Urbanek (Reference Urbanek1993) but rarely formally studied. The Lazarus effect describes an apparent extinction and subsequent reappearance of a given taxon within a specified time interval (Flessa and Jablonski Reference Flessa and Jablonski1983; Jablonski Reference Jablonski1986). Prior work has discussed the potential relationship of Lazarus taxa and the Lilliput effect as a case where large taxa go unsampled due to lower population numbers only to reappear in samples during ecosystem recovery (Twitchett Reference Twitchett2007; Harries and Knorr Reference Harries and Knorr2009). In the context of mass extinctions, Lazarus taxa may represent poor sampling, low population sizes, and/or migration to more favorable, though unsampled, environments or refugia (Jablonski Reference Jablonski1986; Harries et al. Reference Harries, Kauffman and Hansen1996; Fara Reference Fara2001; Twitchett Reference Twitchett2001). Furthermore, because the Lazarus effect reflects biases of the fossil record, it is not an evolutionary phenomenon. The relationship of the Lilliput effect to Lazarus taxa has not yet been empirically studied. However, a study by Payne (Reference Payne2005) exploring body size among Lazarus gastropods during the EPME indicates that Lazarus taxa were dominated by small species and not large-bodied forms. Nevertheless, given the interest in the theoretical relationship of the Lilliput effect and Lazarus taxa, this topic deserves further scrutiny of other taxonomic groups and time periods.
Considerations and Challenges of Phylogenetic Scale
Because individual species are characterized by particular patterns of ontogenetic development, it is logical to discuss ontogenetic shifts and size-selective mechanisms as processes acting in a single species or ancestor–descendant context. However, it is expected that these mechanisms also operate in concert at larger phylogenetic scales (Fig. 5). Size decrease within an ancestor–descendant pair, sister-species pair, or small clade (e.g., congeneric species) is relatively easier to evaluate due to simpler phylogenetic relationships, typically shorter stratigraphic and temporal ranges, and a higher likelihood of shared phenotype. Furthermore, as discussed in the earlier section on phylogeny, the kinds of information preserved in the fossil record often limit our ability to adequately describe ontogeny for a wide variety of fossil taxa in a single phylogeny. Regardless, phylogeny is key in studying mechanisms of size change in the fossil record. Without understanding phylogenetic polarity to size trends, we cannot determine whether size change is an ontogenetic response, an instance of size sorting, or a result of biases in the fossil record. For the Lilliput effect, this means being able to identify the derived or ancestral condition of small body size and thus properly determine the mechanism of size change. Furthermore, phylogeny is important to account for stratigraphic incompleteness, including ghost lineages and Lazarus taxa. In the case of both biases, phylogenetic context can help indicate where size decrease occurs in a clade's history and whether it coincides with a particular biotic crisis. Particular care must be taken when evaluating Lilliput effects at the genus or higher clade levels to avoid mischaracterizing which mechanisms of the Lilliput effect are at work, and whether a Lilliput effect occurred at all.
A good illustration of the importance of phylogeny comes from the dicynodont therapsid genus Lystrosaurus in the Karoo Basin, South Africa, during the EPME. Lystrosaurus is known from an impressively large sample size for a terrestrial vertebrate (Smith et al. Reference Smith, Rubidge, van der Walt and Chinsamy-Turan2012), spanning a stratigraphically, geographically, and ontogenetically wide range of specimens that exhibit a clear size decrease during the EPME (Botha-Brink et al. Reference Botha-Brink, Codron, Huttenlocker, Angielczyk and Ruta2016; Fig. 6). Four species of Lystrosaurus are currently recognized in the Karoo Basin: the primarily Permian Lystrosaurus maccaigi and Lystrosaurus curvatus, and the Triassic Lystrosaurus declivis and Lystrosaurus murrayi (Grine et al. Reference Grine, Forster, Cluver, Georgi, Carrano, Blob, Gaudin and Wible2006; Botha-Brink et al. Reference Botha-Brink, Codron, Huttenlocker, Angielczyk and Ruta2016; Botha Reference Botha2020; Viglietti et al. Reference Viglietti, Benson, Smith, Botha, Kammerer, Skosan and Butler2021). Recent histological studies show that, in addition to size decrease, Triassic Lystrosaurus long bones exhibit fewer growth marks (<2) than their Permian counterparts (>3) (Botha-Brink et al. Reference Botha-Brink, Codron, Huttenlocker, Angielczyk and Ruta2016). Even the largest Triassic specimens only present a few LAGs and appear to lack the thick bone cortices seen in Permian specimens, considered indicative of later stages of phenotypic maturity (Botha Reference Botha2020; Fig. 7). Previous researchers proposed that Triassic Lystrosaurus populations suffered high levels of juvenile mortality, and therefore were younger and smaller and grew more rapidly to achieve reproductive maturity and equivalent body sizes as compared with their Permian counterparts (Botha-Brink et al. Reference Botha-Brink, Codron, Huttenlocker, Angielczyk and Ruta2016). Similar to data from Moschorhinus kitchingi, these data apply to the size and age axes of the ontogenetic framework, and discrete metrics, such as OSA and NMDS, could be used to quantify phenotype. Unlike M. kitchingi, however, Lystrosaurus is represented by multiple species, and thus inference of Lilliput mechanisms requires phylogenetic context.
Density plot of Lystrosaurus basal skull lengths (n = 504) from the Karoo Basin of South Africa. Mean skull length 18.53 cm for Permian specimens (n = 110) and 11.49 cm for Triassic specimens (n = 394). Data acquired from supplement of Botha-Brink et al. (Reference Botha-Brink, Codron, Huttenlocker, Angielczyk and Ruta2016).

Selected transverse histological sections of limb bones from the two largest size classes of Lystrosaurus maccaigi and Lystrosaurus murrayi from the Karoo Basin of South Africa. Images from Botha (Reference Botha2020). A, Size Class III L. maccaigi (NMQR 3663) humerus in cross polarized light exhibiting several annuli (white arrows) and parallel-fibered bone tissue. B, Size Class III L. murrayi (NMQR 659) humerus exhibiting no annuli and woven-fibered bone. C, Size Class IV L. maccaigi (NMQR 1020) femur exhibiting parallel fibered bone toward the cortex and vascular canals that decrease in size toward the bone exterior but lacking an external fundamental system. D, Size Class IV L. murrayi (BP/1/3236) humerus in cross-polarized light showing a single annulus and fibrolamellar bone. Scale bars, 500 μm (A, D); 1000 μm (B, C).

Assessing the Lilliput effect in Lystrosaurus from a classic, stratigraphic perspective suggests ontogenetic shifts as the primary mechanism, as the older, larger species (L. maccaigi, L. curvatus) occur in the late Permian and the younger, smaller species (L. declivis, L. murrayi) occur in the Early Triassic (Fig. 8A). Current phylogenetic information offers little insight, and either supports size selectivity (Fig. 8B,D) or ontogenetic shifts (Fig. 8C), depending on the study (e.g., Cox and Angielczyk Reference Cox and Angielczyk2015; Kammerer Reference Kammerer2019; Angielczyk et al. Reference Angielczyk, Liu and Yang2021). Part of this uncertainty stems from the fact that phylogenetic relationships among Lystrosaurus species are recovered from phylogenetic studies of anomodont therapsids as a whole. These studies were intended to resolve broader issues of anomodont phylogeny and thus focus less on the specific relationships among Lystrosaurus and related dicynodontoids. Lystrosaurus species’ diagnoses are also contentious and suffer from subjectivity and inconsistency (Cluver Reference Cluver1971; Brink Reference Brink1986; Ray Reference Ray2005; Grine et al. Reference Grine, Forster, Cluver, Georgi, Carrano, Blob, Gaudin and Wible2006), so species’ boundaries themselves remain in question along with their relationships to one another. Furthermore, in the phylogenies that appear to support size selectivity (e.g., Cox and Angielczyk Reference Cox and Angielczyk2015; Angielczyk et al. Reference Angielczyk, Liu and Yang2021), the characters that place L. declivis and L. murrayi stemward and L. maccaigi and L. curvatus as later diverging appear to be ontogenetically variable within the genus. Interestingly, a likely new species of lystrosaurid from the Luangwa Basin of Zambia (Kammerer et al. Reference Kammerer, Deutsch, Lungmus and Angielczyk2020) is represented by a partial growth series in which adult crania resemble a more ancestral dicynodontoid morphotype, whereas the juveniles look very similar to the morphologically distinct Lystrosaurus, further alluding to potential ontogenetic mechanisms in operation through the evolution of Lystrosauridae. Given that interpretations of the Lilliput mechanism change greatly with different phylogenetic hypotheses for Lystrosaurus species, additional work on the alpha taxonomy and phylogenetic relationships of Lystrosaurus is crucial to properly characterize the Lilliput effect in this genus.
Stratigraphic ranges and alternative phylogenetic relationships for Lystrosaurus species in the Karoo Basin, South Africa. A, Species ranges of Lystrosaurus according to stratigraphic units and biostratigraphic zones in the Karoo Basin, with the current position of the end-Permian mass extinction labeled in red (after Viglietti et al. Reference Viglietti, Benson, Smith, Botha, Kammerer, Skosan and Butler2021). B–D, Alternative topologies of Lystrosaurus species in the Karoo Basin from larger phylogenetic studies of anomodont therapsids. EPME, end-Permian mass extinction. Cox and Angielczyk (Reference Cox and Angielczyk2015); Kammerer (Reference Kammerer2019); Angielczyk et al. (Reference Angielczyk, Liu and Yang2021).

Conclusions
Despite the frequent invocation of the Lilliput effect in the literature, it continues to be poorly understood nearly 30 years after it was first discovered. Defining the effect in terms of stratigraphic faunal patterns and body size alone has led to confusion about what phenomena and taxa qualify as examples. As we reframe it, the Lilliput effect describes a pattern of size decrease observed in a single lineage or clade during periods of widespread extinction, diversity crisis, or high turnover. Framing studies of the Lilliput effect through the lens of ontogeny and phylogeny, utilizing the classic heterochrony framework, allows it to be studied in terms of mechanism and process and not body-size patterns alone. Although metrics for age, size, and phenotype, as well as robust phylogenies, are challenging to gather and construct, examples exist where all of these parameters are feasibly quantified. Approaching the Lilliput effect in this way offers the promise of much better insight into the processes by which environmental stress during biotic crises causes reductions in size, as well as the degree to which results from any particular case can be generalized to other extinctions, including modern anthropogenic extinctions. Where “complete” data are not available, this framework better highlights the limits of our knowledge and directions for future investigation.
Applications of heterochrony and other mechanistic approaches to body-size change do not stop at the Lilliput effect. The improved rigor they bring is also relevant to other body-size phenomena in the fossil record. These might include clade-level patterns such as Cope's rule, latitudinal trends such as Bergman's rule, and biogeographic trends such as Foster's (island) rule. All of these phenomena are widely documented but subject to ongoing debate, and improved ontogenetic and phylogenetic context could provide new insights. This framework also need not be limited to the fossil record, and additional data and rigor could be found with extension to neontological studies of size phenomena. Rigorous application of the heterochrony framework to problems of change in body size has the potential to reinvigorate study of these macroevolutionary phenomena for a variety of clades and evolutionary scales.
Acknowledgments
We thank S. Kidwell, J. Botha, R. Ng, and the Angielczyk Lab members for their discussion and comments to improve the article. We would also like to thank J. Botha for providing histological images of Lystrosaurus long bones included in the figures. We thank the two reviewers for their helpful comments toward the improvement of this article. C.P.A. would like to thank I. Magallanes for moral support on this ontogenetic odyssey and V. Magallanes-Abbott for only trying to chew notes and books a few times.
Competing Interest
The authors declare no competing financial, professional, or personal relationship interests in this article.


 Open access