


Introduction
Dyslipidaemia, a common metabolic anomaly and a major risk factor for atherosclerotic cardiovascular disease (ASCVD), comprises elevated low-density lipoprotein cholesterol (LDL-C), non-high-density lipoprotein cholesterol and triglycerides (TG), all of which independently increase the risk of ASCVD(1). Several lifestyle modifications have been recommended for the management of dyslipidaemia, including dietary interventions and increased physical activity(Reference Handelsman, Jellinger and Guerin2). Moreover, it has been postulated that the balanced consumption of fruits and vegetables, as a part of healthy dietary patterns, might lead to favourable alterations in lipid profile(Reference Chiavaroli, Viguiliouk and Nishi3).On the other hand, the global production and consumption of fruit is subpar(Reference Mason-D'Croz, Bogard and Sulser4). However, orange juice (OJ) remains one of the most frequently consumed fruit juices worldwide(Reference Tadros and Andrade5), making it the centre of many investigations with regard to diet-related health issues. Natural OJ contains considerable amounts of vitamin C, folate, potassium, fibre and bioactive flavonoids(Reference Cara, Beauchesne and Wallace6), all of which contribute to a healthy diet. Previous studies have shown that the consumption of OJ significantly decreases levels of total cholesterol (TC) and LDL-C(Reference O'Neil, Nicklas and Rampersaud7). Moreover, OJ supplementation decreased LDL-C and increased high-density lipoprotein cholesterol (HDL-C) in both normolipidaemic and hyperlipidaemic participants of a controlled clinical trial(Reference Cesar, Aptekmann and Araujo8). The presumed effect of oranges/OJ on improving the lipid profile have been mainly attributed to its flavonoid content, especially hesperidin(Reference Mohammadi, Ramezani-Jolfaie and Lorzadeh9). In this systematic review and meta-analysis of randomised controlled trials (RCTs), we aimed at summing up the existing evidence with regard to potential impact of OJ supplementation on lipid profile.
Method
Search strategy
The present study was performed based on the PRISMA guideline(Reference Moher, Liberati and Tetzlaff10). A systematic search was conducted via the Cochrane library, Scopus, PubMed and Embase database from inception up to 29 November 2020. The following keywords were used to find the relevant articles: (‘citrus flavonoid’ [tiab] OR orange [tiab] OR ‘citrus sinensis’ [tiab] OR ‘juice’ [tiab]) AND (‘Triglycerides’ [tiab] OR ‘Cholesterol’ [tiab] OR ‘HDL’ [tiab] OR ‘Cholesterol, LDL’ [tiab]) AND (intervention [tiab] OR RCT [tiab] OR ‘controlled trial’ [tiab] ‘Randomised Controlled Trial’ [tiab]). No time or language-restrictions were applied for selection of articles. To make sure that all related works are considered, we also verified the reference list of the articles.
Eligibility criteria
Original studies were included if they met the following inclusion criteria: (1) being a randomised controlled trial with either parallel or cross-over design, (2) investigating the impact of OJ v. placebo on plasma/serum concentrations of lipids and (3) presentation of sufficient information on lipids concentrations at baseline and at the end of follow-up in each group or providing the net change values. Exclusion criteria were (1) non-randomised trials, (2) lack of a placebo control group in the study design, (3) observational studies with case-control, cross-sectional or cohort design and (4) lack of sufficient information on lipid concentrations at the baseline or during the follow-up (or the net change of these parameters).
Data extraction
Eligible studies were reviewed and the following data were extracted: first author's name, year of publication, the country in which the study was performed, study design, the number of participants in the intervention and placebo groups, the dosage used, treatment duration, age, gender and body mass index (BMI) of study participants, and plasma concentrations of lipid indices at the baseline and during the follow-up.
Quality of studies
We assigned low risk (L), some concerns (S) and high risk (H) of bias for each six items presented in Table 1, based on Cochrane Collaboration risk of bias tool(Reference Higgins, Altman and Gøtzsche11) and according to the following criteria: (1) randomisation process; (2) deviations from the intended interventions; (3) missing outcome data; (4) measurement of the outcome; (5) selection of the reported result and (6) and overall bias (Table 1).
Risk of bias for randomised controlled trials, assessed according to the Revised Cochrane risk-of-bias tool for randomised trials (RoB 2).
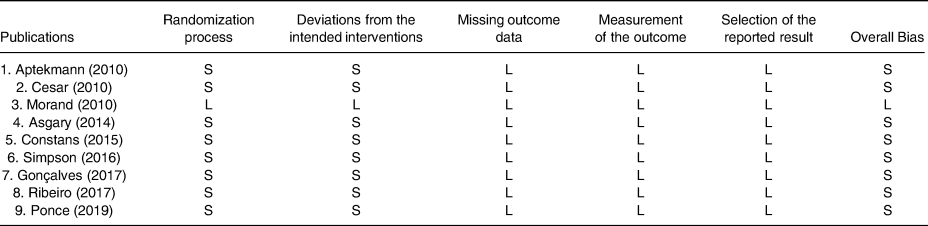
L, low risk of bias; H, high risk of bias; S, some concerns.
Statistical analysis
To calculate the effect size of the lipid profiles, the mean change and the standard deviation for both the intervention and placebo groups were extracted. A random-effects model (using DerSimonian–Laird method) was used to compensate for the heterogeneity of studies. Standard deviations (sds) of the mean difference were calculated using the following formula: sd change = square root [(sdpre-treatment)2 + (sdpost-treatment)2−(2 × R × sdpre-treatment × sdpost-treatment)], assuming a correlation coefficient (R) = 0·8. If the outcome measures were reported in median and range (or 95 % confidence interval [CI]), mean and sd values were estimated using the method described by Hozo et al. (Reference Hozo, Djulbegovic and Hozo12). Where standard error of the mean (sem) was only reported, sd was estimated using the following formula: sd = sem × sqrt (n), where n is the number of subjects. Effect sizes were expressed as weighted mean difference (WMD) and 95 % CI. A subgroup analysis according to the trial duration (≤8 or >8 weeks), OJ dose intervention (≤500 or >500 ml/d) and the participants’ gender (both, male, female) was carried out to identify possible sources of heterogeneity. Sensitivity analysis was carried out by omitting each study one by one and recalculating the pooled assesses. Visual inspection of funnel plots, Begg's rank correlation test and Egger's regression test were conducted to identify possible publication bias(Reference Egger, Smith and Schneider13). Statistical analysis was performed using STATA, version 14 (Stata Corp, College Station). P-values less than 0·05 were regarded to be statistically significant.
Result
Study selection
Initially, after multiple database search, 6334 published studies that were identified (of which 1600 were duplicates) and 4735 reviewed. Of these, 3688 articles did not meet the inclusion criteria and were also excluded. The detailed process of the search strategy is presented in Fig. 1. Finally, nine full RCTs articles, with nine intervention arms were selected for the final meta-analysis.
Flow diagram of the study selection.

Characteristics of studies
Table 2 displays the baseline characteristics of the included studies. In total, 10 effect sizes were extracted from 9 RCTs, including a total of participants of 386. The mean age of the participants ranged from 36 to 56 years. Participants’ health conditions were as follows :healthy(Reference Asgary, Keshvari and Afshani14), patients with hepatitis C(Reference Gonçalves, Lima and Ferreira15), hypercholesterolaemic(Reference Cesar, Aptekmann and Araujo16,Reference Constans, Bennetau-Pelissero and Martin17) , normocholesterolaemic(Reference Cesar, Aptekmann and Araujo16), overweight(Reference Aptekmann and Cesar18–Reference Simpson, Mendis and Macdonald20), obese(Reference Ribeiro, Dourado and Cesar21) and patients with metabolic syndrome(Reference Ponce, Benassi and Cesar22). All the RCTs used a parallel study design. The nine eligible articles were released between 2010 and 2019. The RCTs were carried out in Iran(Reference Asgary, Keshvari and Afshani14), France(Reference Constans, Bennetau-Pelissero and Martin17,Reference Morand, Dubray and Milenkovic19) , UK(Reference Simpson, Mendis and Macdonald20) and Brazil(Reference Gonçalves, Lima and Ferreira15,Reference Cesar, Aptekmann and Araujo16,Reference Aptekmann and Cesar18,Reference Ribeiro, Dourado and Cesar21,Reference Ponce, Benassi and Cesar22) . The dosage of OJ ranged from 250(Reference Simpson, Mendis and Macdonald20) to 1000 ml/d(Reference Asgary, Keshvari and Afshani14). The duration of interventions ranged from 3(Reference Constans, Bennetau-Pelissero and Martin17) to 12 weeks(Reference Aptekmann and Cesar18,Reference Simpson, Mendis and Macdonald20–Reference Ponce, Benassi and Cesar22) .
Characteristics of the included studies

TC, total cholesterol; LDL, low-density lipoprotein; HDL, high-density lipoprotein; TG, triglycerides; MetS, metabolic syndrome.
Meta-analysis of data
Effects of OJ on TG
As illustrated in Fig. 2, pooling by the fixed-effects model, we could not observe any significant improvement in TG levels (WMD −1·53 mg/dl, 95 % CI −6·39, 3·32, P = 0·536) in comparison with the control group. Subgroup analysis was not done for TG, due to not meaningful heterogeneity between studies (I 2 = 45·8 %, P = 0·055).
Forest plot for the effect of orange juice on TG concentrations, expressed as mean differences between intervention and control groups. Horizontal lines represent 95 % CIs. Diamond represents the pooled effect size.

Effects of OJ on TC
By a random effect model, OJ did not significantly reduce TC levels (WMD −5·91 mg/dl, 95 % CI −13·26, 1·43, P = 0·114) (Fig. 3). A high level of heterogeneity was observed between the included articles (I 2 = 83·4 %, P < 0·001). Subgroup analysis showed that the duration of intervention and gender could justify the high heterogeneity between studies (Table 3).
Forest plot for the effect of orange juice on TC concentrations, expressed as mean differences between intervention and control groups. Horizontal lines represent 95 % CIs. Diamond represents the pooled effect size.

Subgroup analysis of included randomised controlled trials in meta-analysis of the effect of orange juice on lipid profile

WMD, weighted mean difference; CI, confidence interval; TC, total cholesterol; TG, triglycerides; HDL, high-density lipoprotein; LDL, low-density lipoprotein.
a Refers to the mean (95 % CI).
b Inconsistency, percentage of variation across studies due to heterogeneity.
c Obtained from the Q-test.
d Obtained from the fixed-effects model.
Effects of OJ on LDL-C
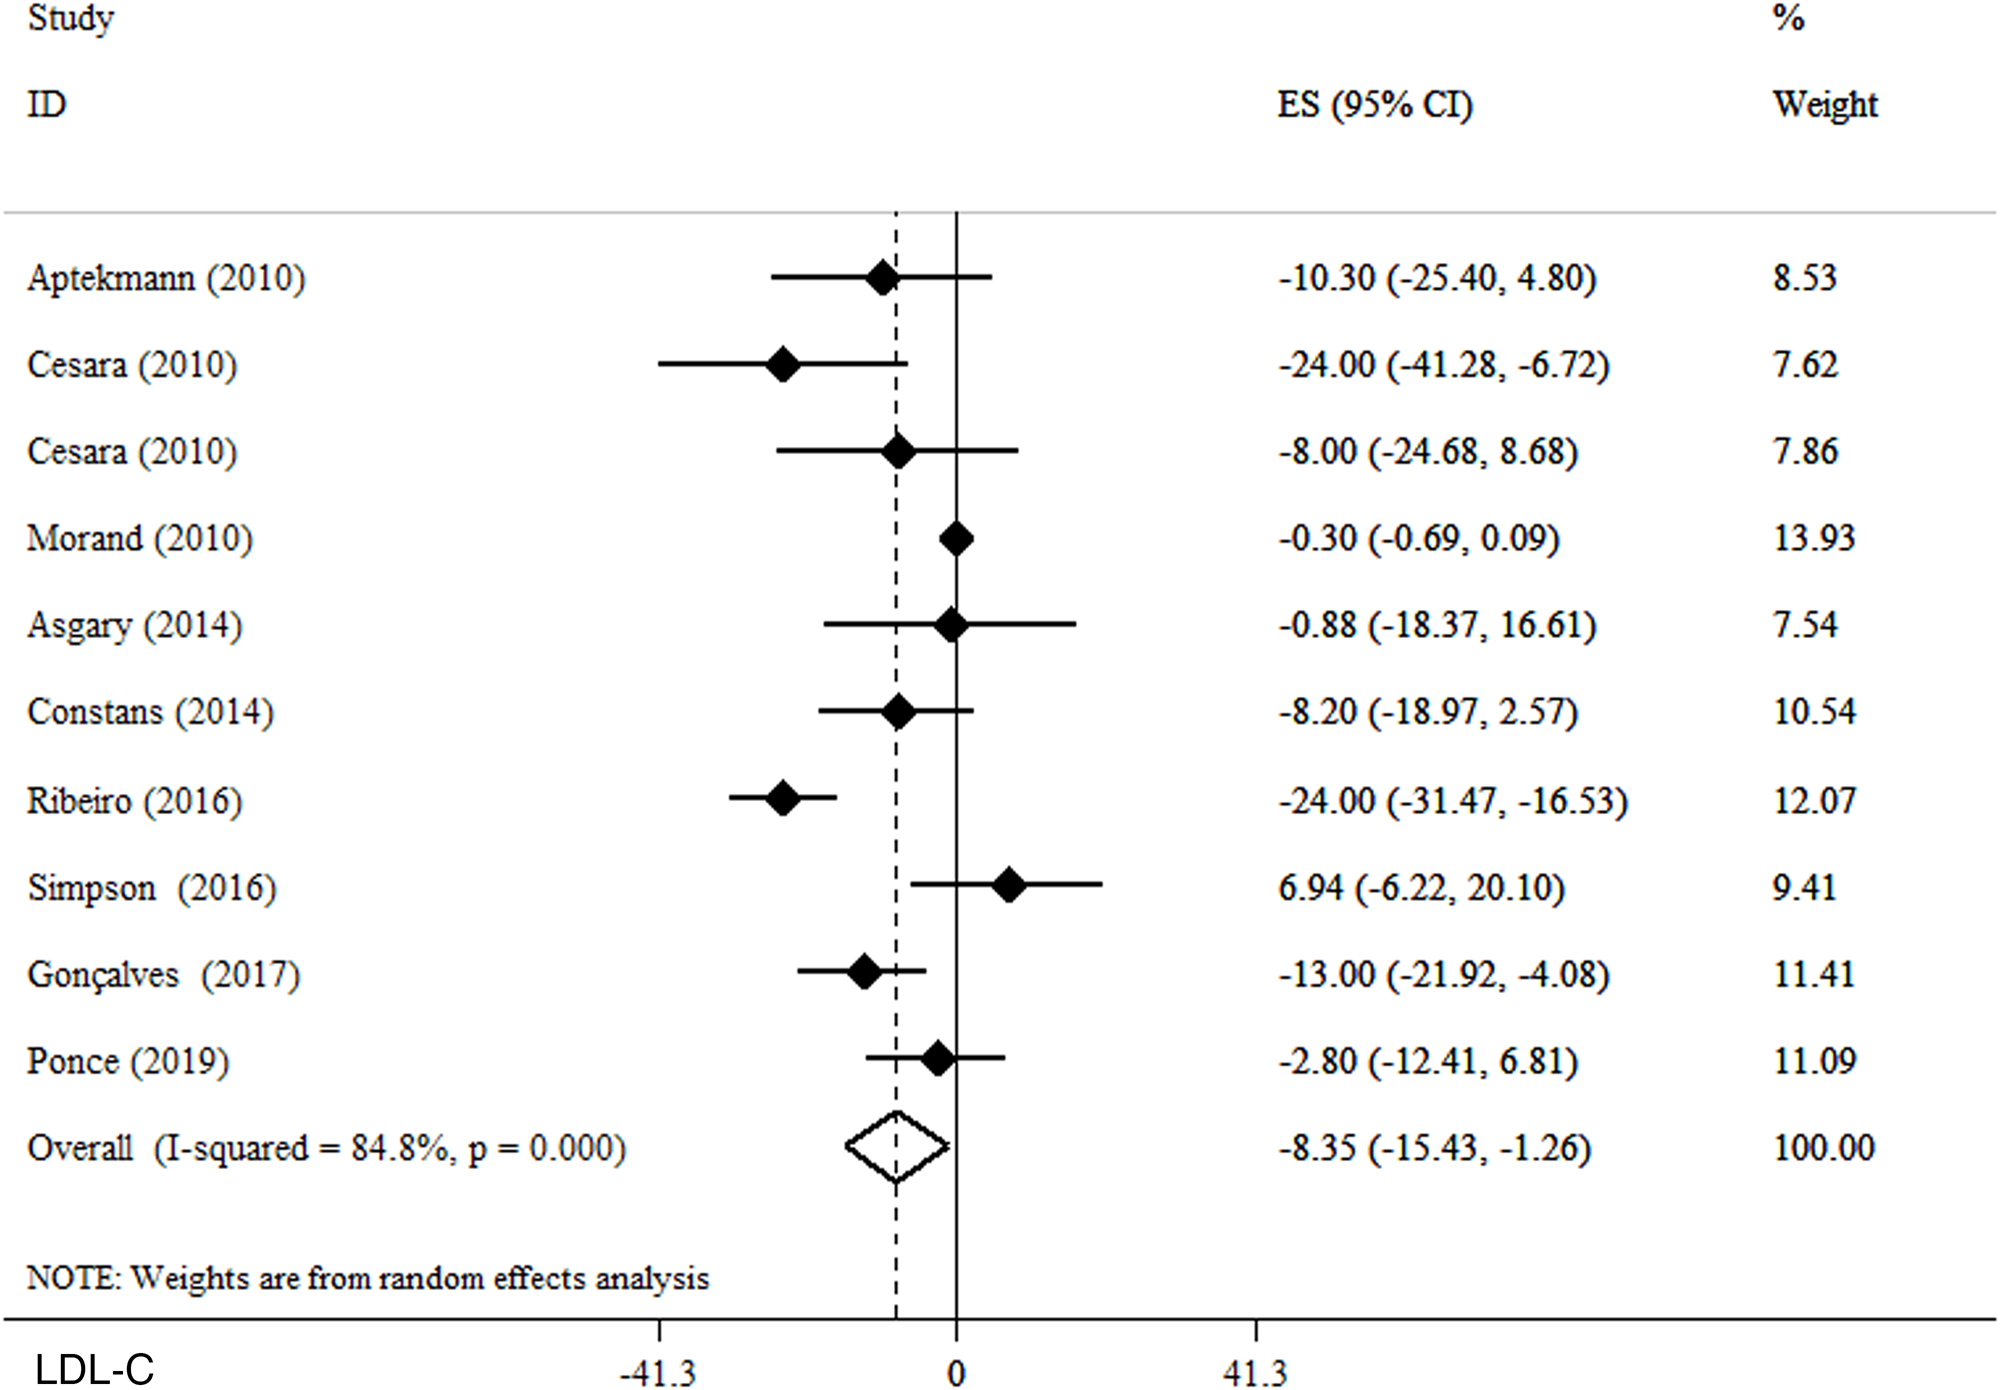
We found that blood levels of LDL-C (WMD −8·35 mg/dl, 95 % CI −15·43, −1·26, P = 0·021) (I 2 = 45·8 %, P = 0·055) significantly decrease after OJ supplementation in a random effect model (Fig. 4). In the subgroup analysis based on the administered dosage, LDL-C significantly decreased following the consumption of >500 ml/d OJ (WMD −9·85 mg/dl, 95 % CI −18·18, −1·52, P = 0·02). Moreover, the subgroup analyses based on the duration of intervention revealed that the effect of OJ supplementation on LDL-C was significantly greater in trials lasting ≤8 weeks (WMD −7·91 mg/dl, 95 % CI −15·91, −36; P = 0·04). Also, studies conducted on both genders were observed to be significantly more likely to reduce blood LDL-C levels (WMD −12·61 mg/dl, 95 % CI −21·19, −4·04; P = 0·004) (Table 3).
Forest plot for the effect of orange juice on LDL-C, expressed as mean differences between intervention and control groups. Horizontal lines represent 95 % CIs. Diamond represents the pooled effect size.
Effects of OJ on HDL-C
In a random effect model, no significant alteration in plasma HDL-C concentrations was observed following OJ supplementation (WMD 0·61 mg/dl, 95 % CI −0·61, 1·82, P = 0·333) (I 2 = 77·6 %, P < 0·001) (Fig. 5). In subgroup analyses, we observed that OJ significantly reduced HDL-C in studies conducted on women (WMD 12·1 mg/dl, 95 % CI 6·37, 17·83, P < 0·001). Further subgroup analyses did not reveal any additional findings (Table 3).
Forest plot for the effect of orange juice on HDL-C concentrations, expressed as mean differences between intervention and control groups. Horizontal lines represent 95 % CIs. Diamond represents the pooled effect size.

Publication bias and sensitivity analysis
The sensitivity analysis showed that the estimated overall effect size for lipid profiles did not change dramatically after omitting the size of each effect from the included studies. Based on visual inspection, the funnel plots showed slightly asymmetry for outcomes (Supplementary Figure S1). However, the results of Begg's test suggested no publication bias for TG (P = 0·311), TC (P = 0·24), LDL-C (P = 0·05) or HDL-C (P = 0451).
Discussion
In this systematic review and meta-analysis of 9 RCTs consisting 386 participants which evaluated the effect of OJ on lipid profile, we showed that OJ supplementation significantly reduced blood levels of LDL-C. However, we observed no significant impact for serum levels of TC, HDL-C and TG. Additionally, based on the subgroup analysis, it was found that OJ had a significant effect on LDL-c in doses above 500 ml/d.
Studies have shown that supplementation with OJ leads to significant reductions in the circulating concentration of TC and LDL-C(Reference Aptekmann and Cesar23–Reference Rangel-Huerta, Aguilera and Martin25). Moreover, a large-sized epidemiological study validated the beneficial effects of citrus flavonoids, including hesperidin and naringin, on reducing serum TC concentrations(Reference O'Neil, Nicklas and Rampersaud7). In an experimental model, Kurowska et al. (Reference Kurowska and Manthey26) showed that in hypercholesterolaemic hamsters, consumption of citrus polymethoxylated flavones (PMFs) (including hesperidin and naringenin) significantly improved lipid profile in both and lower and higher concentrations. In addition, Simpson et al. (Reference Simpson, Mendis and Macdonald20) reported no change in LDL levels after supplementation with 250 ml/d of OJ. As stated previously, most of the lipid-lowering effect of oranges is ascribed to their polyphenol content, especially hesperidin(Reference Pla-Pagà, Companys and Calderón-Pérez27). On the other hand, in a meta-analysis(Reference Mohammadi, Ramezani-Jolfaie and Lorzadeh28), it was shown that hesperidin intake is not associated with significant changes in blood pressure nor blood lipids. Such conflicting observations may be justified by the difference in the dosage administered or the limited bioavailability of hesperidin. It has been suggested that the remaining of the unabsorbed flavonoid is converted to insoluble compounds by the colon flora(Reference Gil-Izquierdo, Gil and Ferreres29). One study examined that hesperidin metabolites appeared in plasma 3 h after consuming 440 mg of hesperidin supplement and reached to the peak level after 5–7 h of administration, which can provide 1·28 mmol/l of aglycone hesperidin equivalent(Reference Manach, Morand and Gil-Izquierdo30). Based on that, it is plausible to assume that hesperidin may not reach the sufficient levels that are needed for the regulation of lipid metabolism. Our subgroup analysis confirms these assumptions, since we also showed that OJ consumption had a significant effect on LDL-c only at doses above 500 ml/d.
It is noteworthy that OJ also comprises fair amounts of other flavonoids, such as naringenin and eriodictyol(Reference Gattuso, Barreca and Gargiulli31). Eriodictyol has been linked to numerous health-promoting impacts, including anti-inflammatory, anti-diabetic and anti-tumor effects(Reference Yao, Liu and Bashir32). However, due to scarcity of high-quality research, its impact on cardiovascular risk factors, including lipid profile, is still unclear. Similarly, naringenin has been claimed to possess anti-inflammatory, anti-adipogenic and cardioprotective effects(Reference Salehi, Fokou and Sharifi-Rad33). It is believed that naringenin imposes changes in circulatory lipids, through manipulation of various pathways involved in lipid metabolism; including lipid digestion, reverse transport of cholesterol and reduced reduction of lipoprotein receptors(Reference Yang, Trevethan and Wang34). However, in both cases, due to lack of sufficient human trials with respect to their direct effects on measurements of lipid profile, it is difficult to make a general statement regarding their impact on these cardiovascular risk factors.
Lowered blood cholesterol was expected due to the hesperidin and naringin roles as flavonoid components of OJ in reducing the hepatic secretion of very low-density lipoproteins (VLDL) and, consequently, LDL-C into the bloodstream. This LDL-lowering effect of purified citrus flavonoids is supported by in-vivo supplementation studies in rodents(Reference Kurowska and Manthey26,Reference Li, Theriault and Au35) , rabbits(Reference Hooper, Kroon and Rimm36) and humans(Reference Jung, Kim and Lee37) and the presence of these flavonoids in OJ may contribute to the observation of reduced serum TC levels observed in epidemiological studies(Reference O'Neil, Nicklas and Rampersaud7). These changes lead to increased hepatic receptors that speed up the clearance of circulating LDL-C particles(Reference Assini, Mulvihill and Huff24). In-vitro studies, using isolated liver cells, have shown that citrus flavonoids can reduce net Apo-B secretion, by inhibiting synthesis of the cholesterol esters required for LDL production(Reference Borradaile, Carroll and Kurowska38).
As we found in this meta-analysis, OJ consumption had no effect on TG; this observation might be explained by the presence of hesperidin in OJ that has been shown to inhibit pancreatic lipase(Reference Kawaguchi, Mizuno and Aida39). In a study on subjects with hypercholesterolaemia, increases in plasma TG and HDL-C were produced in response to treatment with 750 ml/d of OJ(Reference Kurowska and Manthey26). The authors suggested that the fructose or sucrose content of OJ were not related to this observation, because increases in plasma TG instigated by these sugars in humans were linked with decreases in HDL-cholesterol. In contrast, in another study in which rats were fed a hypercholesterolaemic diet plus a mixture of naringin and hesperidin, no changes in plasma TG levels were reported; indicating that the inhibition of hepatic acyl-CoA cholesterol acyl transferase (ACAT) had no effect on VLDL secretion(Reference Bok, Lee and Park40).
Even though the purpose of the present study is not to indicate direct recommendations on the use of 100 % OJ, we find some points worthy of reminding. It is of vital significance how ‘100 %’ or ‘natural’ fruit juices (in this case OJ) are defined. Multiple studies have shown that although 100 % OJ does not seem to augment the risk of CVDs and type 2 diabetes mellitus (T2DM) or even might protect against them(Reference Alissa and Ferns41,Reference Zheng, Zhou and Li42) , artificially/sugar-sweetened beverages are considered as potent risk factors and that their health impacts must be distinguished from those of natural fruit juices(Reference Chen, Khan and Chiavaroli43,Reference Imamura, O'Connor and Ye44) . Nonetheless, we find the overall evidence to advocate the daily use of fruit juices (including 100 % OJ) to be lacking and in need of further high-quality investigations.
The present study has some limitations. First, there were considerable between-study heterogeneities. Subgroup analysis, nevertheless, revealed several potential causes of the observed variation including gender, duration of intervention and dosage of OJ. These subgroups analyses are indicators for the fact that, as is the case of all human trials, various interventions with different methods of administration and dosages affect individuals distinctly. Second, the effect of some confounding factors, such as dietary intake and physical activity, were not considered in most of the included studies. Third, most studies were conducted in Brazil, this may exacerbate the potential impacts of other confounding covariates, such as race and eating habits. Third, due to short follow-up period of the included studies, long-term interpretation of the observed effects is limited. Finally, the protocol of the study was not registered in PROSPERO.
Conclusion
In conclusion, the current systematic review and meta-analysis on available RCTs suggested that OJ consumption might have beneficial effects on blood LDL levels, but no significant effects were observed for serum levels of TC, HDL-C and TG. However, we suggest that further research in the form of high-quality clinical interventions be done, since there are substantial inconsistencies among the included studies.
Supplementary material
The supplementary material for this article can be found at https://doi.org/10.1017/jns.2023.22.
Acknowledgements
M. R. A. and F. S. contributed in the systematic search and data extraction. M. A. and E. G. contributed in the statistical analyses and data interpretation. H. R., H. G. and E. B. contributed in manuscript drafting and data interpretation. All authors approved the final manuscript for submission.
The authors declared no personal or financial conflicts of interest.


 Open access