

Reducing childhood obesity and health inequalities is at the centre of the UK government’s health policy, and halting growth in childhood obesity is a prime objective. The government’s recent White Paper seeks ‘to reduce the proportion of overweight and obese children to 2000 levels’ by 2020(1). To be able to assess whether this is achieved and whether interventions to reduce the prevalence of childhood obesity are successful, accurate and comprehensive data are required.
There has been a worldwide (including the UK) rapid rise in childhood obesity in recent decades(Reference Wang and Lobstein2), which is associated with an increased risk of diseases including high blood pressure, type 2 diabetes, CVD and some cancers(3). The cost of treating obesity and obesity-related diseases is substantial. In the UK in 2002 this cost was about £3·5 billion. In 2004 this was estimated to increase to £7 billion by 2020(4), but more recently this estimate has been raised to a massive £45·5 billion by 2050(5).
In the UK the National Child Health Computer System (NCHCS) is used to record the results of regular health check-ups for children. Generally weight and height are measured at regular intervals from birth until school entry (5 years). The quality of the data varies across the country. Three studies in the UK have specifically looked at using NCHCS data to monitor trends in obesity, although with differing results. An examination of Wirral Health Authority data found low coverage of height and weight data(Reference Bundred, Kitchiner and Buchan6). Poor coverage of weight and height measurements (approximately 67 %) was also shown in part of South Wales(Reference Banerjee, Morgan and Rees7), yet in neighbouring South Wales localities much higher coverage of height and weight data (87–99 %) was demonstrated(Reference Jones, James-Ellison and Young8). All three papers reported many measurement/data-entry errors.
Some authors have suggested that routinely measured data (RMD) are inadequate for monitoring trends in childhood obesity, suggesting that the data are too inaccurate and that school entry age (which is when routine measurements are taken) is too young as levels of obesity are low relative to later in childhood(Reference Rudolf, Levine and Feltbower9). However, there is strong evidence that an early age of adiposity rebound increases the risk of subsequent obesity(Reference Parsons, Power and Logan10, Reference Reilly, Armstrong and Dorosty11), although the mechanism is unclear. Accordingly, it is important to monitor children at a young age. The present study reviews the coverage of 3- and 5-year-olds afforded by NCHCS records in the Leeds Primary Care Trusts (PCT) and whether the measurement data are accurately recorded. These data are then used to examine trends in obesity in young children in the study area.
Methods
The study area covers the city of Leeds in the UK, which includes a variety of different demographic and socio-economic factors. Childhood obesity is described using BMI, standardised for age and sex (BMI standard deviation score (SDS)) against the British reference data set(Reference Cole, Freeman and Preece12, Reference Freeman, Cole and Chinn13). Overweight is defined as above the 91st centile and obesity as above the 98th centile.
Height, weight, sex, age and postcode data were obtained from the NCHCS records of RMD for 3- to 6-year-olds born between 1995 and 2003. The measurements were taken by trained health visitors or school nurses using methodologies that were standardised by the PCT. Unfortunately many of the Leeds records, particularly for 3-year-olds, had not been transposed onto the NCHCS, remaining as inaccessible paper records (not examined). The only exclusion criteria were if the child had subsequently died and if they were too young or old for our study (under 2·5 years or over 6·5 years).
Children with no height and/or weight data were excluded. If children had been measured more than once in the same year, then one of that year’s measurements (randomly chosen) was included and the others excluded. These repeated measurements were also scrutinised for cases in which the second height measurement was less than the first as an indication of an obvious measurement error (in which case both records were excluded). The results for BMI were scrutinised for outliers. It was clear that weight and, more frequently, height data had at times been logged inaccurately, giving rise to unlikely BMI results. These mistakes generally arose due to the incorrect placing of decimal points. Accordingly a correction formula (multiplication of the weight entry by 10, 100 or 1000, as appropriate, and division of the height entry by 10) was applied to adjust for this. Following on from these adjustments, in order to remove the effect of remaining outliers that were also due to incorrect data entry, the data were re-examined and entries with an unfeasible BMI (BMI SDS >+4·00 or <−4·00) were excluded. Finally, entries were also excluded if the child lived outside the study area or if no or incomplete postcode information was provided. No children were contacted and no new measurements were taken. All data were anonymised and a unique identifying number given to each child. Ethical approval was obtained from the Leeds (East) Research Ethics Committee.
Three different measures of coverage were calculated for 3- and 5-year-olds only (as these are the age groups targeted by the PCT for measurement); i.e. 4- and 6-year-old children were excluded from the analysis for these coverage calculations only. The ‘usual’ method is to calculate the proportion of children with height and weight data against all of the children for that age/year on the NCHCS system. Also calculated was the ‘birth’ coverage, which uses the total number of children born in Leeds in the corresponding year of birth as the denominator (birth data obtained from the Leeds PCT). Similarly the ‘census’ coverage uses the total number of children of corresponding age living in Leeds in the measurement year (using the Census 2001 statistics produced by the Office for National Statistics).
Mean age, height, weight, BMI, BMI SDS, and the proportions of obese and/or overweight 3- to 6-year-old children were calculated for each measurement year. A logistic regression model was used to examine whether there was any association between obesity and time. The proportion of obese children was the dependent variable and year of measurement the covariable. This model was also stratified by sex. In addition, two linear regression models were built, both using BMI SDS as the dependent variable and year of measurement as the explanatory variable: a simple model and an adjusted model which controlled for age and sex. Finally, the mean BMI SDS was calculated for each ward in the study area for each measurement year and these data were mapped over time (using ArcGIS version 9·0 software; ESRI Inc., Redlands, CA, USA).
Results
There was a total of 42 396 children aged 3–6 years on the NCHCS system for Leeds. Of them, 11 585 (27 %) had no height/weight data and 1435 (3 %) were excluded due to data problems (317 duplicate entries; 322 implausible BMI SDS; 502 outside study area; 294 no or incomplete postcode), leaving 29 376 records for analysis. A large proportion of these ‘clean’ data were adjusted for errors in data entry (the most common being height entered in mm rather than cm).
The coverage numbers of the RMD for 3- and 5-year-olds (3651 children, aged 4 and 6 years, were excluded) were calculated by three different methods. The birth and census coverage figures were much lower than the usual calculation coverage values (see Table 1). For 3-year-olds, the three coverage figures were 72 %, 22 % and 22 % (usual, birth and census coverage, respectively). For 5-year-olds, these figures were higher (92 %, 35 % and 34 %). If the latter two years of data collection for 5-year-olds, where coverage suddenly fell to 5 % (most likely due to the data for recent years not being input into the NCHCS yet), were excluded, the birth and census coverage figures were much more robust: usual 93 % (range 89–95 %), birth 50 % (range 44–54 %) and census 48 % (range 44–52 %).
Coverage of routinely measured data
NA, not applicable.
Note that the year relates to the year of birth, not the year of measurement. All three coverage calculations are shown. The ‘usual’ coverage calculation for routine data (i.e. that reported by other authors) underestimates the number of missing children.
Mean age, height, weight, BMI and BMI SDS in 1998 were 3·1 years, 95·4 cm, 15·0 kg, 16·4 kg/m2 and 0·231, respectively, compared with 4·7 years, 106·4 cm, 18·8 kg, 16·6 kg/m2 and 0·464, respectively, in 2003 (see Table 2). The differences in age between the data sets by measurement year were statistically significant (two-tailed paired t test, P < 0·001).
Summary of cleaned routinely measured data with sex, age, height and weight data by year of measurement for 3- to 6-year-olds in Leeds
SDS, standard deviation score.
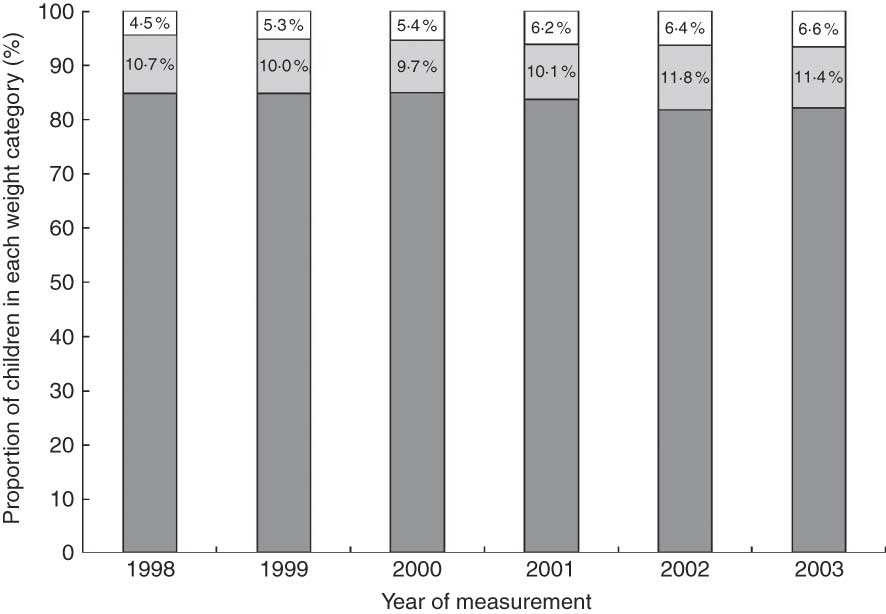
The childhood obesity data were analysed over time (serial cross-sectional analyses). The proportions of children who were in the acceptable, overweight (but not obese) and obese ranges of BMI in 1998 were 84·8 %, 10·7 % and 4·5 %, which by 2003 had changed to 82·0 %, 11·4 % and 6·6 %, respectively (see Fig. 1).
The proportion of children with acceptable (![]() ), overweight (but not obese;
), overweight (but not obese; ![]() ) or obese (
) or obese (![]() ) weight status according to BMI standard deviation score for 3- to 6-year-old children in Leeds routinely measured between 1998 and 2003, showing an increase in childhood obesity over time
) weight status according to BMI standard deviation score for 3- to 6-year-old children in Leeds routinely measured between 1998 and 2003, showing an increase in childhood obesity over time
Logistic regression analysis showed that the proportion of obese 3- to 6-year-old children rose significantly between 1998 and 2003 (P < 0·001, Nagelkerke R 2 = 0·002). Children were 1·5 times more likely to be obese in 2003 than 1998. When the data were considered by sex, logistic regression analysis showed significant increases in obesity for both (boys: P = 0.002, Nagelkerke R 2 = 0·003; girls: P = 0·021, Nagelkerke R 2 = 0·003). While the proportion of obese girls was lower than that of boys, this difference between boys and girls was not significant (P = 0.056; two-tailed, two-sample, equal variance t test).
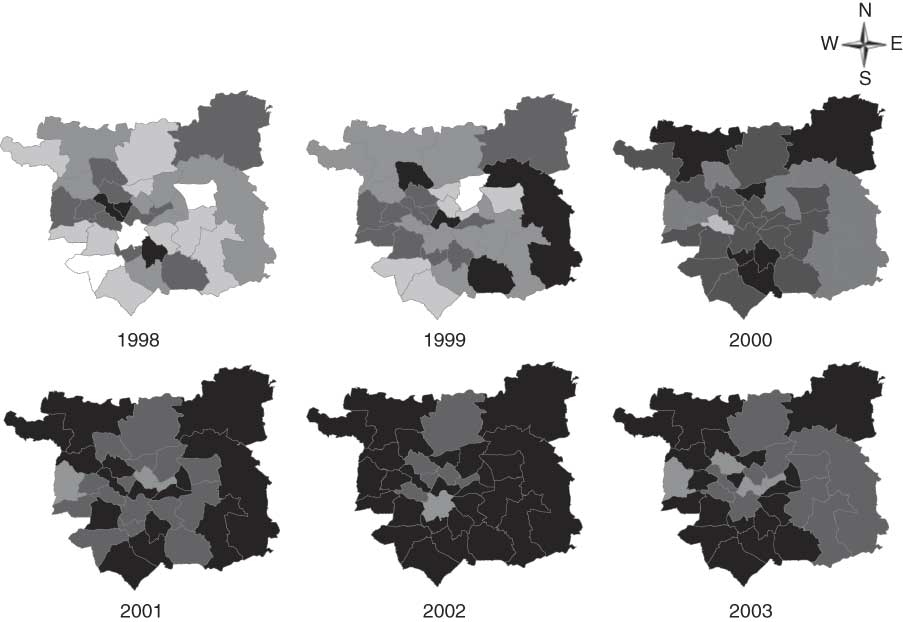
The linear regression analyses showed that the BMI SDS rose significantly between 1998 and 2003 (simple model: β = 0·075, 95 % CI 0·041, 0·056; fully adjusted model: β = 0·036, 95 % CI 0·015, 0·032). The maps of mean BMI SDS clearly showed how the mean BMI SDS increased across Leeds between 1998 and 2003 (see Fig. 2).
Mean BMI standard deviation score (![]() , <0·000;
, <0·000; ![]() , 0·001–0·150;
, 0·001–0·150; ![]() , 0·151–0·300;
, 0·151–0·300; ![]() , 0·301–0·450;
, 0·301–0·450; ![]() , >0·451) for each ward in Leeds for each measurement year among children aged 3 to 6 years who were routinely measured
, >0·451) for each ward in Leeds for each measurement year among children aged 3 to 6 years who were routinely measured
Discussion
Childhood overweight and obesity rose significantly between 1998 and 2003 in Leeds: children were 1·5 times more likely to be obese in 2003 than 1998. There was also a significant increase in BMI SDS across Leeds during this time. The present investigation also demonstrated that RMD are an important means of monitoring population-level obesity trends in very young children, although more effort is required to reduce the quantity of data-entry errors, for relatively low marginal cost.
The finding that obesity in children has increased in Leeds over this time scale is not unexpected given the recent worldwide(Reference Wang and Lobstein2) and national increases in childhood obesity: in the UK between 1995 and 2002, the prevalence of obesity in children aged 2 to 15 years increased from 10·4 % to 16·6 % (60 % rise) in boys and from 11·7 % to 16·7 % (43 % rise) in girls(Reference Sproston and Primatesta14). Monitoring child BMI trends is important because of this rapid and substantial rise in obesity prevalence. RMD are of value in identifying anthropometric trends in populations(Reference Bundred, Kitchiner and Buchan6), although not all authors agree (e.g. reference (9)). In 2005 the UK government commenced universal measuring of children in order to undertake this monitoring, establishing the National Child Measurement Programme to measure children in Reception (aged 4–5 years) and Year 6 (aged 10–11 years) to assess levels of childhood overweight and obesity.
The present investigation undertook serial cross-sectional analyses of trends in prevalence of obesity and overweight in 3- to 6-year-olds between 1998 and 2003 in Leeds: this showed higher rates in 2003, with 11 % of children overweight and 7 % obese. Over time there was a small increase in average BMI (0·2 kg/m2), although the range remained fairly static. This modest average gain converts into a 50 % increase in the proportion classified as obese; i.e. children were 1·5 times more likely to be obese in 2003 than 1998. BMI SDS was also shown to have increased over time. When considering sex there were significant increasing trends for boys and girls individually as well as cumulatively by time. The proportion of obese girls was lower than that of boys (not significantly), which differs from results from other studies(Reference Jones, James-Ellison and Young8). The effect size of the sex differences in obesity was too small to be clinically important or to make a different to potential public health policies.
The present paper also examined RMD to determine the quality and coverage of the data for use in monitoring obesity trends. Data quality varies across the UK. The ‘usual’ coverage calculation for the Leeds data set was on a par with that reported elsewhere(Reference Banerjee, Morgan and Rees7, Reference Jones, James-Ellison and Young8). However, the ‘birth’ and ‘census’ coverage figures are novel, and more truly represent the proportion of the whole population that was measured; both measures produced similar figures, which were low. Birth and census coverage for 5-year-olds was more robust, particularly if the last two years of measurements (where many data had not yet been captured on the computer system) were excluded, both averaging about 50 %. This is probably because this age group is a more captive target, being measured at school rather than relying on attendance at a clinic. The coverage was lumpy; i.e. some schools had particularly high or low measurement rates. It is not known why certain schools did not participate. Qualitative interviews with the system administrator and school nurses suggest this was due to time or funding limitations.
Primary school entry offers an excellent opportunity to monitor trends in early cases of obesity in children: the age of adiposity rebound is critical in determining risk of subsequent obesity(Reference Parsons, Power and Logan10, Reference Reilly, Armstrong and Dorosty11); further, these data are showing significant increases in obesity in these young children. Some authors have been critical of using RMD as a means of monitoring trends in childhood obesity(Reference Rudolf, Levine and Feltbower9), although other authors have argued that the monitoring process would be assisted by a policy of universal measurement when children start school and do advocate the use of RMD for monitoring obesity(Reference Bundred, Kitchiner and Buchan6, Reference Jones, James-Ellison and Young8, Reference Hall15). The current study supports the latter view. The theoretical benefits of using RMD are low marginal cost (when taken together with other school-entry screening procedures), potentially high coverage, and the additional benefits of potentially identifying children with other growth-related disorders(Reference Hall15). The National Child Measurement Programme data are an obvious source of data for such an analysis and will be better than the old PCT-level data where the data quality and coverage varied substantially depending on location. Limited budgets, in terms of time and finances, often prevented the data from being available to researchers in usable (e.g. electronic) form, thereby negating the benefits of collecting the data in the first place.
The number of children excluded from the present analysis due to data problems was low (3 %). More of a problem was missing height and weight data, principally because a large proportion of the records were still in paper form – due to insufficient resources (both time and money) to transpose the data onto the computer system – particularly for 3-year-olds and the more recent measurements on 5-year-olds. To a lesser degree other possible reasons for missing data were families not attending assessments (with no subsequent follow-up), plus some overly busy health visitors/school nurses did not measure children who looked ‘normal’. Measurement bias is possible, as many different examiners undertook the measurements using multiple scales, but is unlikely because staff were highly trained in these techniques and the measuring methodologies were standardised by the PCT. Many entries were input into the computer incorrectly, using the wrong unit of measurement (e.g. mm rather than cm). While it was possible to use a formula to correct these errors, this is indicative of the low quality of the data input, perhaps because of a lack of priority given to this task by the PCT. Data-entry errors were also minimised by excluding children with implausible BMI SDS. This may serve to underestimate the obesity problem, but given the high level of data-entry errors it was strongly felt that it was more important to remove these likely errors (as it was likely that more children were in this category incorrectly than correctly). It has been suggested that the NCHCS should have been developed with the ability to reject obviously wrong entries, as well as to highlight those in the highest and lowest centiles(Reference Betts16).
The current study supports the view that NCHCS data, if amassed accurately, with comprehensive coverage, can be used to examine UK trends in childhood obesity. However, to do this there is a need to improve the quality of the database, particularly the data entry. A thorough review of the NCHCS database across the country is needed to identify those areas that are under-performing and need urgent attention (and probably additional resources) to facilitate this process. As significant resources are already committed to measuring height and weight at school entry (and also now at age 11 years), to not make these relatively small improvements is a massive waste of resources and potentially valuable information. The present paper has also shown that obesity in 3- to 6-year-olds in Leeds has risen since 1998. These results serve as a base from which future trends in Leeds can be monitored and also for comparison with trends elsewhere in the UK.
Acknowledgements
K.L.E. was funded by the Economic and Social Research Council (ESRC) and the Medical Research Council. While the funding sources approved the study design for the purpose of providing the grant, they were not involved in the design or implementation of the study, or in the preparation of this paper. The boundary data used in this paper are Crown Copyright, produced by the Office for National Statistics, and licensed for academic use by the ESRC and the Joint Information Systems Committee Census Programme. The boundary data service provider is the Census Geography Data Unit (UK Boundary Outline and Reference Database for Education and Research Study: UKBORDERS) via Edinburgh University Data Library. There are no conflicts of interest to declare. All authors were involved in the preparation of the paper; K.L.E. prepared the first draft of the paper, on which the other authors commented and revised. The authors thank the Leeds PCT for their collaboration and for providing the data sets.


