


Perinatal depression and anxiety are among the most prevalent mental health conditions affecting women worldwide, with estimated rates of approximately 20% for depression [Reference Yin, Sun, Jiang, Xu, Gan and Zhang1] and 24% for anxiety disorders [Reference Roddy Mitchell, Gordon, Atkinson, Lindquist, Walker and Middleton2] during pregnancy, and 17% for depression [Reference Wang, Liu, Shuai, Cai, Fu and Liu3] and 16% for anxiety [Reference Roddy Mitchell, Gordon, Atkinson, Lindquist, Walker and Middleton2] during the first postpartum year. These disorders, which co-occur in approximately 9% of women [Reference Ou, Shen, Xiao, Wang, He and Wang4], leading to adverse obstetric, neonatal, and long-term developmental outcomes for both mother and child [Reference Slomian, Honvo, Emonts, Reginster and Bruyère5]. Traditionally, perinatal depression and anxiety have often been examined as distinct diagnostic entities. However, growing evidence indicates extensive symptom overlap and dynamic interactions across time, which form a complex network of physiological, affective, and cognitive experiences [Reference Harasawa, Chen, Okawa, Okubo, Matsubara and Nakagawa6–Reference Phua, Chen, Chong, Gluckman, Broekman and Meaney8]. Understanding these interrelations is important for developing effective evidence-based assessment approaches and targeted interventions that address the multifaceted nature of perinatal mental health.
Perinatal disorders have been historically conceptualized as manifestations of underlying constructs such as “depression” or “anxiety” [Reference O’Hara and McCabe9, Reference Falah-Hassani, Shiri and Dennis10]. Such a latent variable approach can obscure heterogeneity in symptom manifestation and comorbidity observed in real-world clinical practice. Network theory offers an alternative framework: it postulates that mental disorders emerge from direct interactions among individual symptoms rather than a single latent cause [Reference Borsboom11, Reference Borsboom, Deserno, Rhemtulla, Epskamp, Fried and McNally12]. In this framework, symptoms such as sadness, insomnia, and excessive worry operate as nodes in an interconnected system, and edges represent statistical associations among them. Symptoms in these networks often cluster into communities (groups of symptoms that are more strongly connected to one another than to other symptoms). Across time or contexts, a network may appear broadly similar yet still change in specific connections. We refer to such localized changes in the presence, strength, or sign of particular symptom-to-symptom connections as network reconfiguration (sometimes called “rewiring”). Central symptoms may function as hubs that maintain the network, whereas bridge symptoms may facilitate comorbidity between syndromic clusters [Reference Borsboom, Deserno, Rhemtulla, Epskamp, Fried and McNally12, Reference Heeren, Bernstein and McNally13]. While centrality indices identify symptoms that are strongly interconnected with others, predictability quantifies how tightly a symptom is embedded in the network, defined as the proportion of its variance explained by the other symptoms.
Recent network analyses in perinatal samples show that depression and anxiety symptoms form distinct yet highly correlated clusters. For example, Phua et al. [Reference Phua, Chen, Chong, Gluckman, Broekman and Meaney8] reported that prenatal and post-partum networks shared a similar overall structure but were more strongly connected after birth, with largely stable yet shifting central and bridging symptoms, and greater prenatal symptom centrality associated with poorer gestational and child outcomes. Similarly, Liu et al. [Reference Liu, Huang, Gao, Wang, Lin and Kong14] and Wang et al. [Reference Wang, Wang, Huang, Deng and Gu15] identified sadness as a central node; in the first study it clustered with trouble relaxing and feeling scared/panicky – with sleep and fear symptoms bridging depression–anxiety – whereas in the second study it co-occurred with parenting-stress nodes such as irregular infant sleep, lack of personal time, crying, and body-image concerns. Overall, these findings support the view that perinatal psychological distress arises from an interdependent affective system in which various symptoms reinforce one another.
Bridge symptoms are nodes that connect different symptom communities and may help explain comorbidity [Reference Mazza, Brisi, Veneziani, Lisci, Sessa and Balocchi16]. In practice, bridge symptoms are identified by their cross-community links – that is, direct connections (edges) between a symptom in one community (e.g., depression-related affect) and a symptom in another (e.g., worry/arousal) [Reference Mazza, Brisi, Veneziani, Lisci, Sessa and Balocchi16]. These links are clinically meaningful because they may provide pathways through which activation in one symptom cluster spreads to another. Postpartum, bridges include insomnia/sleep difficulty, fear/panic related to infant care, feeling overwhelmed, anhedonia, self-harm thoughts, and reduced enjoyment with the baby [Reference Harasawa, Chen, Okawa, Okubo, Matsubara and Nakagawa6]. These cross-community links may allow distress to spread from one symptom cluster to another, with neuroendocrine and psychosocial factors – such as hormonal fluctuations, sleep disruption, and caregiving stress – potentially amplifying these connections [Reference Okun, Mancuso, Hobel, Schetter and Coussons-Read17–Reference Schiller, Meltzer-Brody and Rubinow19].
Despite these advances, few network studies have examined how symptom networks reorganize across perinatal phases. Evidence suggests that pregnancy and postpartum constitute distinct physiological and psychosocial milieus; for instance, postpartum networks can feature infant-sleep disruption and caregiving stress as central [Reference Wang, Wang, Huang, Deng and Gu15], while the overall structure may remain broadly similar, with higher postpartum connectivity and shifting central/bridge symptoms [Reference Phua, Chen, Chong, Gluckman, Broekman and Meaney8]. However, more research is needed to fully understand whether depressive and anxiety symptom networks maintain global stability across the perinatal periods or exhibit phase-specific reconfiguration.
Building on this evidence, we applied network analysis to a large, population-based dataset of more than 10,000 perinatal women to characterize interconnections among depression and anxiety symptoms during pregnancy and the postpartum period. Using the Edinburgh Postnatal Depression Scale (EPDS) and the Generalized Anxiety Disorder-7 (GAD-7), we aimed to: (a) identify central and bridge symptoms within perinatal depression–anxiety networks; (b) compare network topology and global strength across pregnancy and postpartum, and (c) examine whether specific connections reorganize over time.
Methods
Design and setting
This study is part of an ongoing multicenter project, coordinated by the Italian National Health Institute (Istituto Superiore di Sanità, ISS). The project monitors anxiety and depressive symptoms from early pregnancy through 12 months postpartum. Thirteen public healthcare centers – obstetrics–gynecology wards, maternal–child health centers, and hospital psychiatry departments – across eight Italian regions participate as members of the Italian Perinatal Mental Health Network. All centers implement harmonized screening, data-entry, and referral procedures developed by the ISS. For the present analyses, we used baseline data – defined as each participant’s first screening assessment at any point in the perinatal period (from conception to ≤52 weeks postpartum) – collected between November 2021 and December 2024.
Participants
Clinicians approached women consecutively during routine antepartum or postpartum visits. Inclusion criteria were: (a) age ≥18 years; (b) being pregnant or having a biological child aged ≤52 weeks; and (c) sufficient proficiency in Italian to complete the psychological assessment. We excluded women with current psychosis or with cognitive impairment that precluded informed consent. Between November 2021 and December 2024, 10,064 women enrolled (4,386 pregnant; 5,678 postpartum). Among pregnant participants, most were assessed in the third trimester (75.1%; M = 35.3 weeks’ gestation, approximately 8 months), followed by the second trimester (18.2%; M = 21.8 weeks, approximately 5 months) and first trimester (6.7%; M = 10.0 weeks, approximately 2 months). Among postpartum participants, most were assessed within 3 months after delivery (96.8%; M = 4.7 weeks postpartum, approximately 1 month); smaller proportions were assessed at 4–6 months postpartum (2.0%; M = 19.9 weeks, approximately 5 months) and 7–12 months postpartum (1.2%; M = 39.2 weeks, approximately 9 months). Mean maternal age was 33 years (SD ≈ 5) in both groups. Most participants were married or cohabiting (pregnancy: 92%; postpartum: 93%) and were Italian nationals (> 90%). Nearly half held a university degree (pregnancy: 48%; postpartum: 45%). About two-thirds reported stable employment, and unemployment was higher during pregnancy (22%) than postpartum (13%). A previously diagnosed psychiatric disorder was reported by 14% of pregnant and 9% of postpartum participants. Psychotropic medication use was uncommon (pregnancy: 3%; postpartum: 2%).
Procedure
Each participant completed a single screening session. After receiving written and oral information, women provided written informed consent and were informed that they could withdraw from the study at any time without affecting care. Trained midwives or psychologists collected sociodemographic and clinical information and administered self-report questionnaires. Staff reviewed scores, provided immediate feedback, and scheduled diagnostic follow-up for women found to be at risk. Centers delivered or coordinated evidence-based psychological assessments and interventions within Italy’s National Health Service. The ISS Ethics Committee approved the study (prot. 0024542; 21 June 2021).
Measures
The Psychosocial and Clinical Assessment Form [Reference Mirabella, Michielin, Piacentini, Veltro, Barbano and Cattaneo20] captured sociodemographic characteristics (e.g., age, nationality, education, marital status), obstetric and psychological history (e.g., miscarriage/abortion history; past and current psychological disorders), and information about the current pregnancy (e.g., planned vs. unplanned conception; medically assisted reproduction).
The Italian version of the Generalized Anxiety Disorder-7 (GAD-7 [Reference Spitzer, Kroenke, Williams and Löwe21]) assessed anxiety symptom severity over the past 2 weeks. Items are rated from 0 (not at all) to 3 (nearly every day), and the Italian version has demonstrated good psychometric properties in perinatal samples [Reference Stefana, Mirabella, Gigantesco and Camoni22].
The Italian version of the Edinburgh Postnatal Depression Scale (EPDS [Reference Cox, Holden and Sagovsky23]) assessed depressive symptoms over the past 7 days. Items are scored 0–3 to yield a total severity index, and the Italian EPDS has demonstrated sound psychometric properties [Reference Stefana, Cena, Trainini, Palumbo, Gigantesco and Mirabella24, Reference Stefana, Langfus, Palumbo, Cena, Trainini and Gigantesco25].
Statistical analysis
All analyses were conducted in R (version 4.5.1). A complete-case approach was applied, meaning only participants without missing responses on any EPDS or GAD-7 item and with available timing information (pregnancy or postpartum week at assessment) were included. Therefore, no imputation was performed. Phase was harmonized into two groups (pregnancy vs postpartum), and phase-specific Gaussian graphical models were estimated on polychoric correlation matrices of the 17 EPDS+GAD-7 items using EBICglasso (γ = 0.50), allowing negative edges. We summarized global network characteristics (edge density, mean absolute edge weight, and global strength) and applied Louvain community detection on the absolute partial correlation matrices to identify symptom communities and modularity. Node-level indices included strength centrality, bridge strength between EPDS and GAD-7 communities, and node-wise predictability. Nodewise predictability quantifies, for each symptom (node), how well it can be statistically accounted for by its direct neighbors in the estimated network, without implying any causal direction. We report predictability as R2, interpretable as the proportion of variance in a symptom explained by all other symptoms in the network (given the model). Pregnancy and postpartum networks were compared with the Network Comparison Test (NCT; 1,000 permutations), testing differences in global strength, overall structure, and edge-specific weights (Holm-adjusted p-values). Stability of centrality indices was examined via case-dropping bootstraps, and robustness to regularization was assessed by repeating EBICglasso estimation across γ ∈ {0.25, 0.50, 0.75}. Full analytic details are provided in the Supplementary Material.
Results
Sample and symptom distributions
We analyzed N = 10,064 observations (pregnancy n = 4,386; postpartum n = 5,678). As detailed in Table 1, mean total scores were modest (pregnancy: EPDS M = 6.42, GAD-7 M = 4.91; postpartum: EPDS M = 5.17, GAD-7 M = 4.22). Item distributions were positively skewed: EPDS skew ranged 0.05–5.39 (pregnancy) and 0.16–7.59 (postpartum); GAD-7 skew ranged 0.88–2.44 (pregnancy) and 0.78–2.91 (postpartum). When items were dichotomized at scores ≥2 Self-harm (EPDS) was rarest (2.31% pregnancy; 1.04% postpartum); in GAD-7, Restlessness was least common (4.72%; 3.42%). Figure 1 shows phase-specific prevalence estimates with 95% CIs.
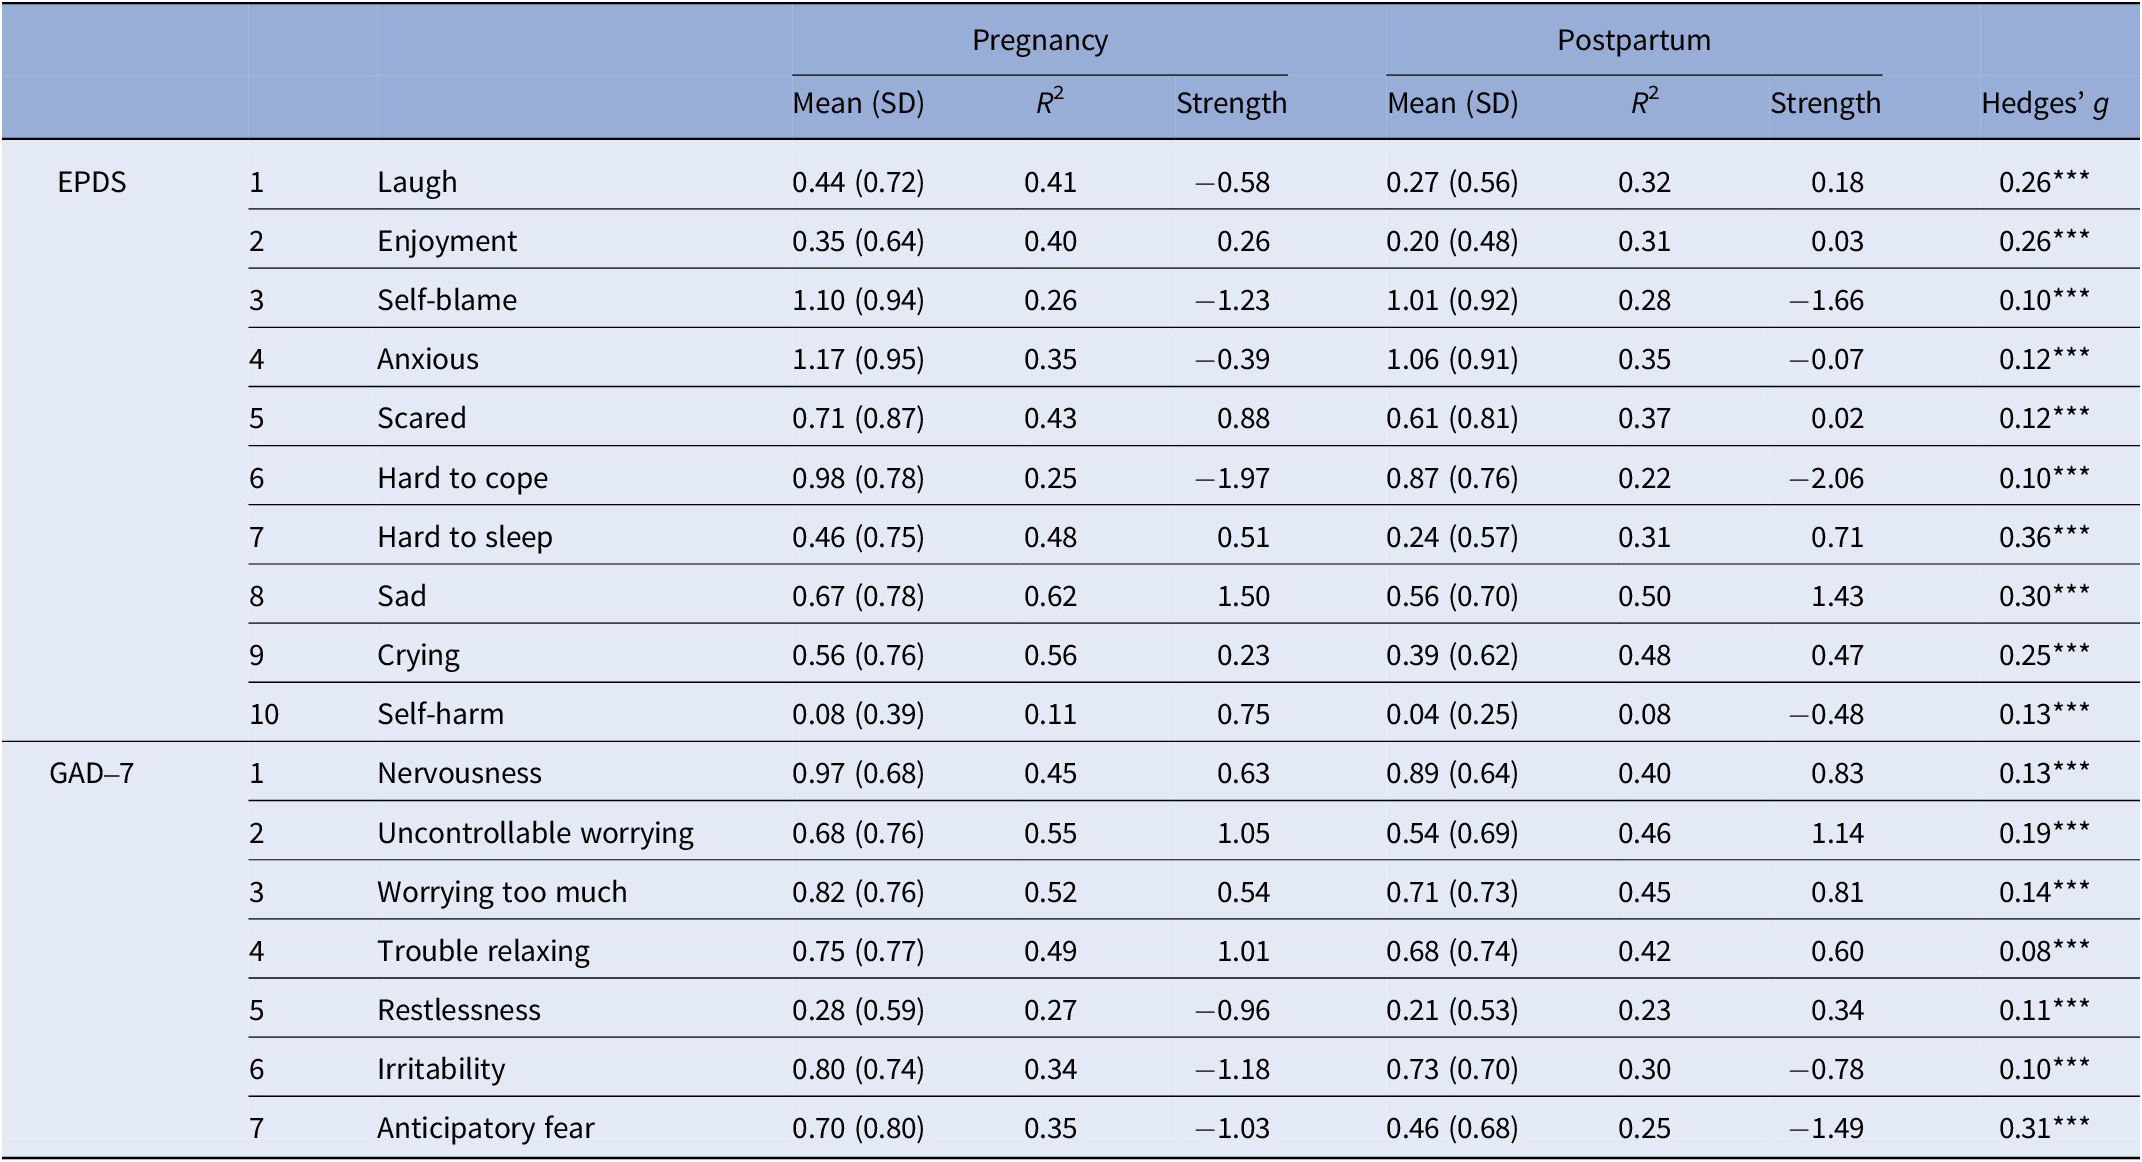
Item scores, predictability (R2), strength centrality, and tests by perinatal phase

Note: EPDS and GAD-7 items were scored 0–3. R 2 indicates node predictability (proportion of variance explained by all other items in the network). Strength indicates standardized node-strength centrality (z-score within the network). Hedges’ g was computed as Pregnancy − Postpartum; positive values indicate higher means during pregnancy. Asterisks (***) denote Holm–Bonferroni–adjusted Welch’s t tests (two-tailed), p < .001.
Prevalence and 95% confidence intervals of depressive and anxiety symptoms in pregnant and postpartum women. Note: Bars show the proportion of participants endorsing each symptom at score ≥2 (EPDS/GAD-7 0–3), with 95% confidence intervals (error bars). Group differences were evaluated using χ2 tests with Holm–Bonferroni correction for multiple items; item-level statistics are reported in Table 1.

Pairwise polychoric correlations
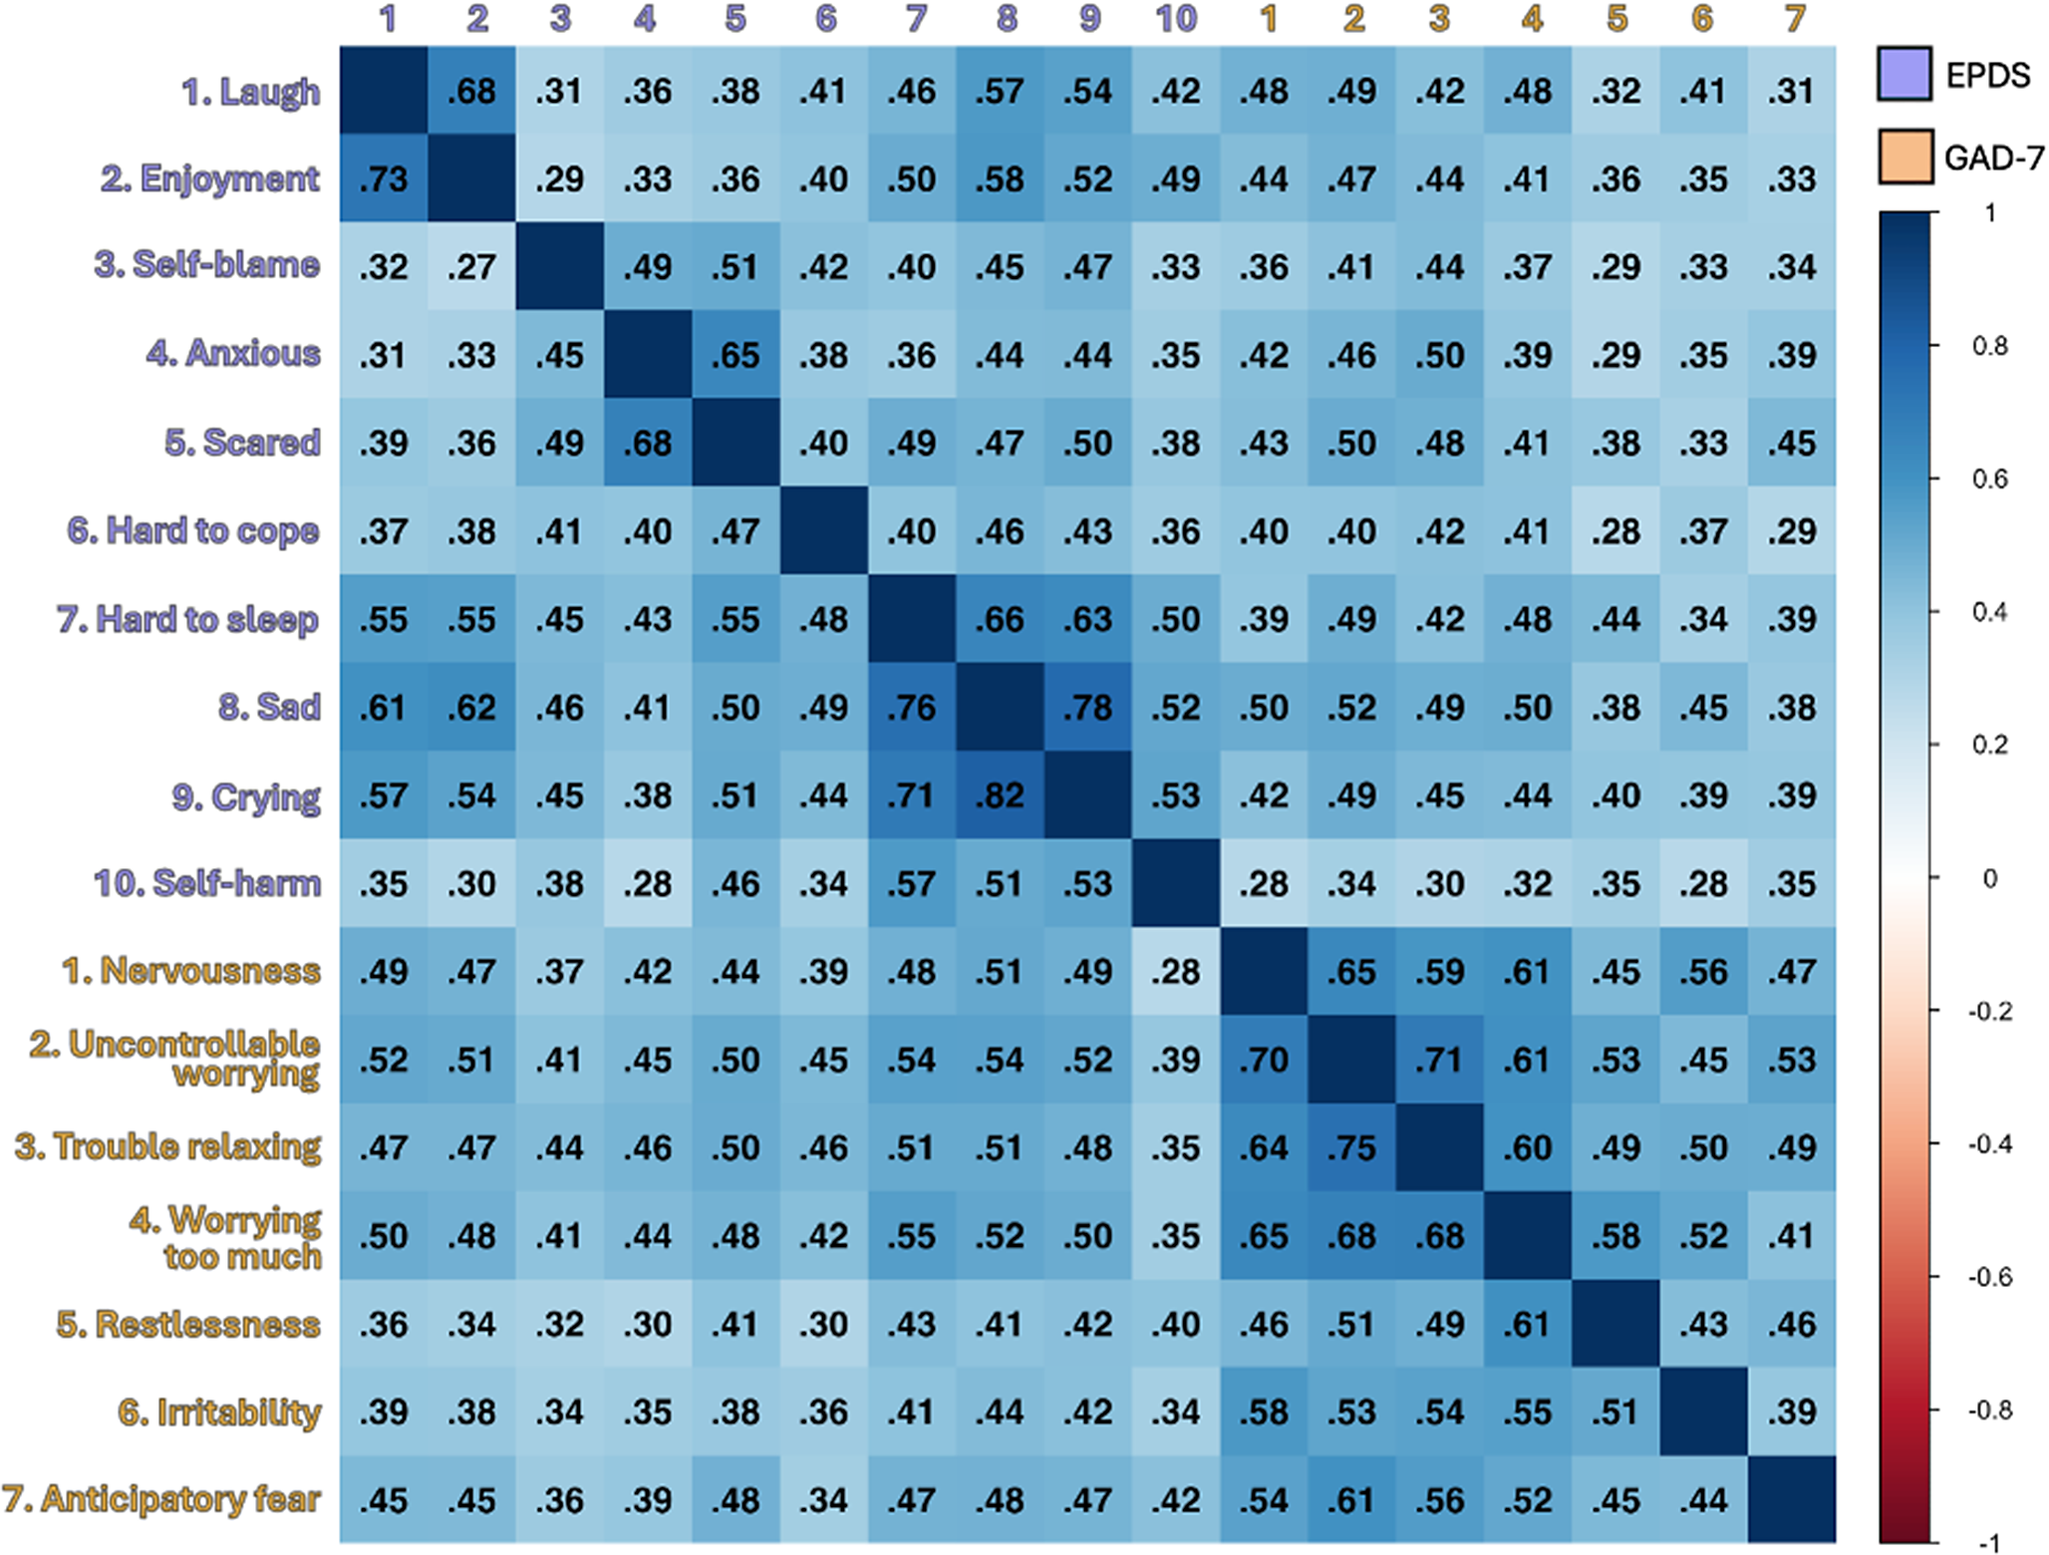
Before estimating partial-correlation networks, we inspected phase-specific polychoric matrices to verify within-scale cohesion and cross-scale positivity (Figure 2). Phase-specific matrices across all items showed a pronounced block-diagonal pattern – strong within-scale associations and uniformly positive, more modest cross-scale associations – which provides the backbone for network estimation (Figure 2). For completeness, within-EPDS summaries were pregnancy median = 0.46, mean = 0.47, range = 0.27–0.82; postpartum median = 0.45, mean = 0.46, range = 0.29–0.78. Within-GAD-7 summaries were pregnancy median = 0.55, mean = 0.57, range = 0.44–0.75; postpartum median = 0.52, mean = 0.52, range = 0.39–0.71. Phase-to-phase correlation patterns were highly similar within each scale (EPDS r = 0.91; GAD-7 r = 0.93), consistent with the broad stability of associations across pregnancy and postpartum.
Polychoric correlation heatmaps by phase. Note: Lower triangle = Pregnancy; upper triangle = Postpartum. As a general interpretive guide, values of 0.00–0.19 indicate a very weak correlation, 0.20–0.39 weak, 0.40–0.59 moderate, 0.60–0.79 strong, and 0.80–1.00 very strong [Reference Stefana, Damiani, Granziol, Provenzani, Solmi and Youngstrom31].

Network estimation
We estimated EBICglasso networks on polychoric correlations for a shared 17-item set (p = 17), separately for pregnancy and postpartum; we refer to these as phase-specific networks with a common item set (γ = 0.50; negative partial edges allowed). All items showed non-trivial variance (lowest: Self-harm Var = 0.10), and per-item missingness was low (~1.99–2.28%). Redundancy screening with goldbricker flagged two EPDS pairs (Laugh–Enjoyment; Hard to sleep–Crying); we retained all items for comparability. Sensitivity to γ ∈ {0.25, 0.50, 0.75} was minimal. Full procedures and diagnostics are in Methods and Supplementary Tables S1–S2 and Figure S1.
Global network characteristics
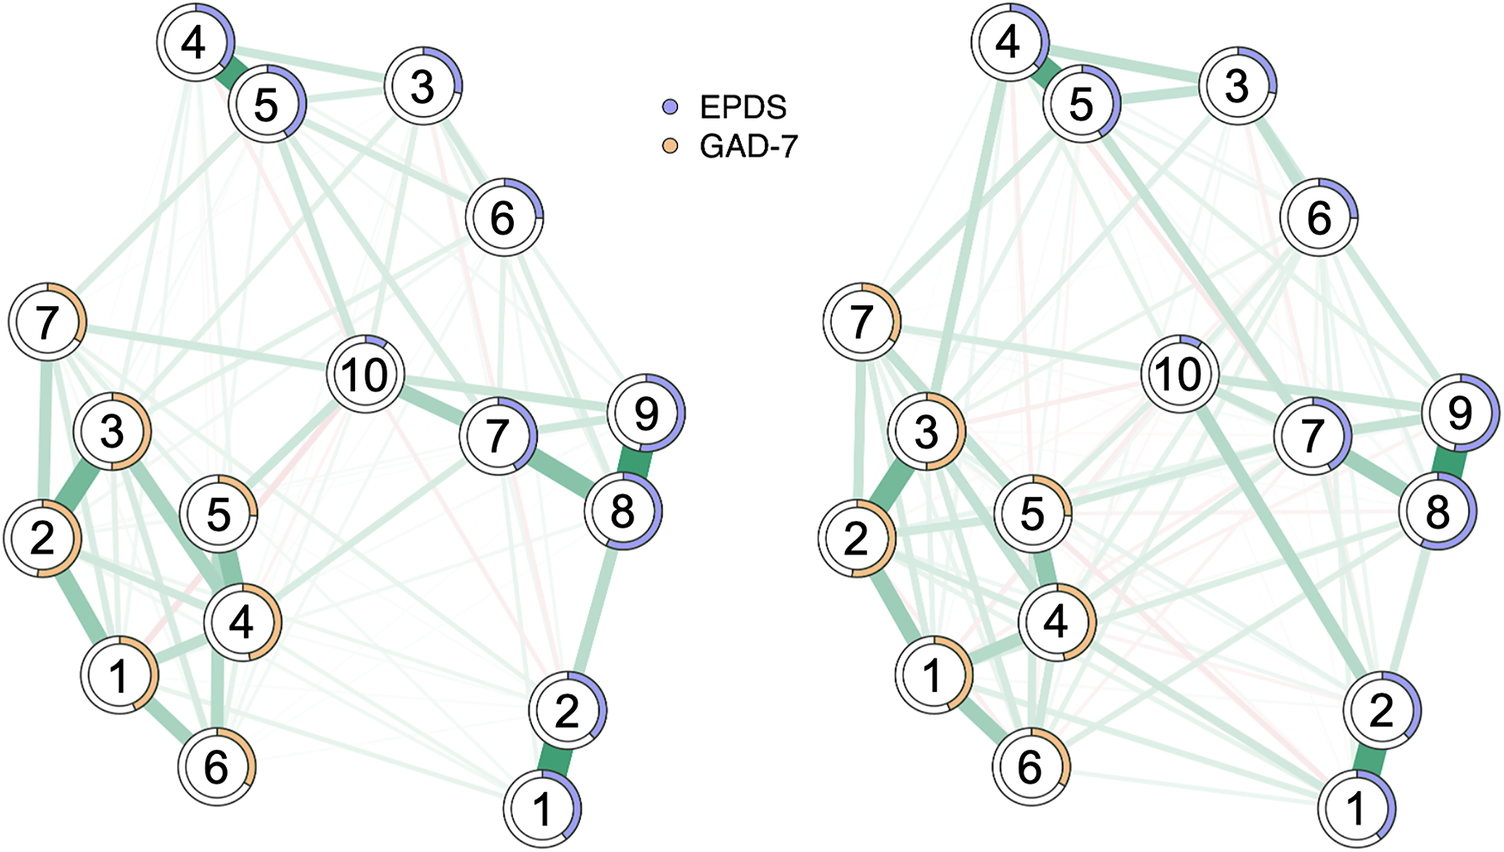
During pregnancy, the network contained 96 of 136 non-zero edges (density = 0.71), comprising 88 positive and 8 negative connections. During the postpartum period, 122 of 136 edges were non-zero (density = 0.90), including 95 positive and 27 negative connections. The mean absolute edge weight (|w|) among non-zero edges was 0.087 for pregnancy and 0.078 for postpartum. When averaged across all edges, mean |w| values were 0.061 and 0.070, respectively. Phase-specific networks with predictability rings are shown in Figure 3, and edge density is visualized in Supplementary Figure S2.
Symptom networks of anxiety (GAD-7) and depression (EPDS) in pregnancy and postpartum. Note: Side-by-side partial-correlation networks for Pregnancy and Postpartum, estimated via unregularized Gaussian graphical model selection on Spearman correlations (complete cases). Nodes are EPDS (1 Laugh, 2 Enjoyment, 3 Self-blame, 4 Anxious, 5 Scared, 6 Hard to cope, 7 Hard to sleep, 8 Sad, 9 Crying, 10 Self-harm) and GAD-7 (1 Nervousness, 2 Uncontrollable worrying, 3 Worrying too much, 4 Trouble relaxing, 5 Restlessness, 6 Irritability, 7 Anticipatory fear) items. Edges depict partial correlations; line thickness scales with absolute weight, and a common edge scale and shared average layout enable direct comparison across groups. Ring pies show node predictability (R2), i.e., the proportion of variance explained by all other items in the same network (larger rings indicate higher predictability). After Holm adjustment for multiple testing, 14 edges showed significant between-phase differences. Edges stronger postpartum were: Enjoyment – Self-harm, Anxious – Self-harm, Hard to sleep – Restlessness, Anxious – Worrying too much, Restlessness – Anticipatory fear, Uncontrollable worrying – Restlessness, Hard to cope – Self-harm, Anxious – Hard to sleep (more negative postpartum), and Sad – Irritability. Edges stronger in pregnancy were: Scared – Self-harm, Hard to sleep – Self-harm, Anxious – Scared, and Hard to sleep – Sad.

The five strongest edges during pregnancy were Sad–Crying (0.51), Laugh–Enjoyment (0.497), Anxious–Scared (0.48), Uncontrollable worrying–Worrying too much (0.36), and Hard to sleep–Sad (0.31). In the postpartum network, the top edges were Sad–Crying (0.49), Laugh–Enjoyment (0.45), Anxious–Scared (0.42), Uncontrollable worrying–Worrying too much (0.35), and Restlessness–Irritability (0.27). Full edge matrices are presented in Supplementary Table S3. The adjacency similarity between pregnancy and postpartum networks was high (Spearman ρ = 0.886).
Node-level metrics: Predictability and centrality
In the phase-specific networks, mean predictability (node-wise R2) was 0.43 in pregnancy and 0.35 postpartum. This means that, on average, 43% and 35% of the variance in symptoms in pregnancy and postpartum, respectively, was explained by the other symptoms in the network. Among pregnant women, the top nodes were Sad (0.62), Crying (0.56), Uncontrollable worrying (0.56), Worrying too much (0.54), and Trouble relaxing (0.51). For postpartum women, the top nodes were Sad (0.52), Uncontrollable worrying (0.48), Crying (0.48), Worrying too much (0.47), and Trouble relaxing (0.44). Figure 3 presents predictability rings, and Supplementary Table S4 reports the full node-wise R2 values. Strength centrality (z-standardized) similarly highlighted affective and worry-related symptoms in both phases. During pregnancy, the highest z-scores were for Sad (z = 1.50), Uncontrollable worrying (1.05), Trouble relaxing (1.01), Scared (0.88), and Self-harm (0.75). In the postpartum period, top z-scores were observed for Sad (1.43), Uncontrollable worrying (1.14), Nervousness (0.83), Worrying too much (0.81), and Hard to sleep (0.71). Item-level centrality estimates were broadly consistent across phases (Spearman ρ = 0.760, p < 0.001). Supplementary Table S5 provides z-standardized strength and expected influence values, and Figure 4 illustrates the centrality profiles.
Standardized node strength centrality per EPDS depressive symptom and GAD-7 anxiety symptoms in pregnant and postpartum women. Note: Points and lines show z-standardized node strength (sum of absolute edge weights) for each EPDS and GAD-7 item, separately for Pregnancy (light blue) and Postpartum (red). Items are ordered top-to-bottom by their plotting index.

Community structure
Louvain clustering on |W| recovered four modules in both combined networks: one GAD-7 community (n = 7) and three EPDS communities – anhedonia (Laugh, Enjoyment), anxious/cognitive distress (Self-blame, Anxious, Scared, Hard to cope), and depressed affect/sleep–suicidality (Hard to sleep, Sad, Crying, Self-harm). Community assignments were identical across phases (Adjusted Rand Index = 1.00). Modularity values were Q = 0.349 for pregnancy and Q = 0.258 for the postpartum period.
Bridge centrality
Given the four recovered communities, we next examined inter-community bridges. Bridge centrality analyses indicated that bridges were primarily concentrated on worry- and sleep/affect-related symptoms. During pregnancy, the five strongest bridge nodes were Self-harm (0.42), Anticipatory fear (0.34), Trouble relaxing (0.29), Nervousness (0.27), and Worrying too much (0.24). In the postpartum period, the strongest bridges were Restlessness (0.481), Worrying too much (0.45), Nervousness (0.43), Laugh (0.43), and Hard to sleep (0.38). Values represent bridge strength (rounded to three decimals). Full bridge profiles are presented in Supplementary Figure S3.
Between-phase comparison (NCT)
Global strength was higher postpartum than during pregnancy (Σ|w| = 9.49 vs. 8.34), but the NCT indicated no significant global-strength difference (Δ = −0.04, p = .387). In contrast, overall network structure differed significantly (observed M = 0.23, p = .001). The largest edge shifts were as follows (Postpartum > Pregnancy unless otherwise noted): Enjoyment–Self-harm (Δw = +0.24, p < .001, Holm p < .001), Anxious–Self-harm (+0.12, p < .001, Holm p < .001), Scared–Self-harm (−0.11, Pregnancy > Postpartum; p < .001, Holm p < .001), Hard to sleep–Restlessness (+0.11, p < .001, Holm p < .05), and Hard to sleep–Self-harm (−0.10, Pregnancy > Postpartum; p < .001, Holm p < .05). Additional edges showed smaller but consistent shifts (see Supplementary Table S6 for full edgewise tests with Holm and FDR corrections).
Robustness and sensitivity
Case-dropping bootstraps indicated adequate stability for Strength in the pregnancy network (CS = 0.75) and moderate stability in postpartum (CS = 0.44). γ-sensitivity analyses showed minimal changes across γ ∈ {0.25, 0.50, 0.75}, with edge counts, mean |w|, and sparsity remaining broadly consistent within each phase. Density patterns were largely invariant for both networks, supporting robustness of conclusions to regularization choices.
Discussion
This study examined the network structure of depressive and anxiety symptoms during pregnancy and the postpartum period using EPDS and GAD-7 item sets. By adopting a network approach, we characterized perinatal affective distress as an interconnected system of mutually reinforcing symptoms rather than a latent disorder. Our findings provide new evidence on the organization, stability, and reconfiguration of symptom interrelations across the perinatal timeline, consistent with a dynamic-systems view of maternal mental health.
Symptom clustering and structural organization
In our data, across pregnancy and postpartum, depression and anxiety were interlinked yet distinguishable at the symptom level. EPDS items clustered around affective/anhedonic content (e.g., Sad, Crying, Laugh/Enjoyment), while GAD-7 items clustered around arousal/worry (e.g., Uncontrollable worrying, Worrying too much, Trouble relaxing). A postpartum network study likewise detected sadness and parenting-stress nodes among the most influential symptoms, indicating tight interconnections between affective and caregiving-stress domains (Wang et al., 2024). During pregnancy, networks that included EPDS, STAI, GAD-7, and affective temperaments showed broad interconnections rather than forming discrete, non-overlapping modules [Reference Mazza, Brisi, Veneziani, Lisci, Sessa and Balocchi16].
Relatedly, though in a different pairing, postpartum depression–bonding networks consistently identified bridge symptoms (e.g., insomnia/sleep difficulty, fear related to infant care, overwhelm, reduced enjoyment/anhedonia, self-harm thoughts) that link communities across postpartum intervals, underscoring robust cross-community connectivity [Reference Harasawa, Chen, Okawa, Okubo, Matsubara and Nakagawa6]. In high-risk postpartum samples that integrated depression, sleep, psychological birth trauma, and quality of life, daytime dysfunction emerged as a central node, with sleep duration and physiological emotional response acting as bridges that couple mood, trauma, and functioning – again highlighting sleep-arousal processes as network couplers [Reference Jiayuan, Xiaoxi, Dan and Yuqiu26]. Beyond symptom communities, discrimination can function as a network-level bridge linking sociocultural stressors to core depressive symptoms (e.g., worry, crying, sadness, self-blame), illustrating how context can couple into symptom networks during pregnancy [Reference Harris, Chen and Santos27].
Finally, peripartum depression–anxiety networks have been shown to maintain a similar overall structure across phases but to display higher postpartum connectivity and shifts in central/bridge symptoms, indicating qualitative reorganization without loss of global stability [Reference Phua, Chen, Chong, Gluckman, Broekman and Meaney8].
Central and bridge symptoms: Affective and arousal cores
In our data, the most central and predictable nodes across both phases were Sad, Crying, Uncontrollable worrying, and Trouble relaxing. Converging pregnancy evidence identifies sadness and trouble relaxing among the most central symptoms, with scared/panicky also highly central and fear-related items acting as bridges between depression and anxiety [Reference Liu, Huang, Gao, Wang, Lin and Kong14]. In the postpartum period, sadness and crying sit among the top central nodes alongside parenting-stress items [Reference Wang, Wang, Huang, Deng and Gu15]. During pregnancy, EPDS/STAI/GAD-7 networks show broad interconnections and prominent influence of EPDS and GAD-7 rather than crisp separations [Reference Mazza, Brisi, Veneziani, Lisci, Sessa and Balocchi16]. In postpartum depression–bonding networks, insomnia/sleep difficulty, fear regarding infant care, overwhelm, reduced enjoyment, and self-harm recur as high-bridge symptoms across time windows [Reference Harasawa, Chen, Okawa, Okubo, Matsubara and Nakagawa6].
In our data, feeling afraid/scared or panicky and trouble relaxing acted as prominent connectors between depression and anxiety clusters – a pattern consistent with pregnancy networks where feeling afraid, scared/panicky, and trouble relaxing emerge as bridge symptoms [Reference Liu, Huang, Gao, Wang, Lin and Kong14]. Using a dual-community specification (negative vs. positive mental health), anxiety-related items have also functioned as primary bridges, consistent with the idea that arousal-related symptoms couple otherwise distinct domains [Reference Phua, Chen, Chong, Gluckman, Broekman and Meaney8]. Complementary postpartum evidence situates daytime dysfunction centrally and identifies sleep duration and physiological emotional response as bridges across domains [Reference Jiayuan, Xiaoxi, Dan and Yuqiu26]. Complementing these patterns, network analyses during the Omicron period also identified trouble relaxing as a central symptom and depressed mood as a bridge, with context-specific differences in edges across periods [Reference Wu, Niu, Guo, Liu, Hu and Gong28].
Clinically, bridge nodes are meaningful “points of contagion” through which activation in one cluster can propagate to another [Reference Borsboom11]. Targeting sleep disturbance and hyperarousal may therefore yield network-wide benefits – an implication consistent with pregnancy and postpartum network portraits, while acknowledging that rigorous causal tests remain limited.
Phase-sensitive network reorganization
Although the overall organization was broadly similar across phases (including identical community partitions), global strength did not differ significantly between pregnancy and postpartum; however, the Network Comparison Test indicated a significant difference in overall network structure, with the postpartum network showing higher edge density, more negative partial correlations, and several edge-specific shifts. Phua et al. [Reference Phua, Chen, Chong, Gluckman, Broekman and Meaney8] likewise reported no structural difference between prenatal and postpartum depression–anxiety networks, yet greater postpartum global connectivity and specific shifts in edges (e.g., stronger postpartum worthlessness–punishment; weaker panicky–anxious/worried) and central/bridge profiles – pointing to topological reorganization rather than wholesale restructuring after birth. In line with Harasawa et al. [Reference Harasawa, Chen, Okawa, Okubo, Matsubara and Nakagawa6], postpartum systems appear to place more weight on insomnia/sleep difficulty, infant-focused fear, overwhelm, reduced enjoyment, and self-harm as cross-community conduits, plausibly reflecting the caregiving-linked and sleep-disrupted milieu of the postnatal period [Reference Jiayuan, Xiaoxi, Dan and Yuqiu26].
We also observed more negative partial correlations postpartum, which we interpret as potential regulatory decoupling among previously synchronized affective and physiological nodes. While mechanistic tests were beyond scope, this interpretation aligns with postpartum contexts in which sleep disruption and caregiving demands become prominent features – and where sleep-arousal nodes are observed as central or bridging elements in independent postpartum networks [Reference Mazza, Brisi, Veneziani, Lisci, Sessa and Balocchi16].
As an additional longitudinal lens, panel network analyses of early parenthood show that depressive symptom interrelations evolve during the months after birth, consistent with the notion of local reconfiguration within a globally cohesive system [Reference Mazza, Brisi, Veneziani, Lisci, Sessa and Balocchi16, Reference Skjerdingstad, Speyer, Isvoranu, Moe and Fredriksen29].
Clinical and translational implications
Identifying central and bridge symptoms provides concrete leverage for early screening and intervention. Converging evidence also links central/bridge nodes to gestational and neonatal outcomes, underscoring the value of routine monitoring and timely intervention [Reference Wu, Niu, Guo, Liu, Hu and Gong28]. In postpartum networks, sadness/crying rank among the most influential nodes and parenting-stress items (e.g., irregular infant sleep) are salient, while across phases there are shifts in which nodes are central or bridging – patterns that align with our findings [Reference Wang, Wang, Huang, Deng and Gu15]. Sleep-related symptoms function as pivotal connectors: insomnia/sleep difficulty frequently bridges postpartum depression and bonding [Reference Harasawa, Chen, Okawa, Okubo, Matsubara and Nakagawa6], and daytime dysfunction sits centrally in high-risk postpartum systems with sleep duration and physiological emotional response bridging mood, trauma, and quality of life [Reference Jiayuan, Xiaoxi, Dan and Yuqiu26]. Practically, routine monitoring of Sad, Uncontrollable worrying, and sleep disturbance may help detect system-level dysregulation earlier, enabling targeted interventions that stabilize sleep/arousal (e.g., insomnia treatment; hyperarousal reduction) and dampen negative affect/worry (e.g., CBT, mindfulness-based strategies). Screening for discrimination/acculturative stress may also identify upstream connectors that feed depressive cascades in pregnancy [Reference Harris, Chen and Santos27].
Strengths, limitations, and future directions
Strengths include a large sample, harmonized measurement across phases, and polychoric-based estimation with multiple robustness checks. Stability analyses indicated reliable node- and edge-level inferences. Limitations include the cross-sectional design, which precludes causal directionality; longitudinal/dynamic models would better capture temporal evolution. Outside the perinatal context, stage-specific network reorganization in youth likewise shows shifting core/bridge profiles and global strength differences across development, underscoring the value of stage-sensitive network approaches [Reference He, Wu, LeMoult, Huang, Zhao and Liang30]. Self-report assessment may introduce reporting bias, particularly for sensitive domains (e.g., self-harm). Future work that integrates hormonal, behavioral, and ecological-momentary data could clarify biopsychosocial mechanisms behind phase-specific reconfiguration.
Conclusions
Perinatal depression and anxiety organize into cohesive yet partially distinct symptom networks that remain globally stable while reorganizing locally from pregnancy to postpartum. Central affective and arousal nodes – Sad, Crying, Trouble relaxing, fear/panic, and sleep disturbance – anchor the system and serve as key conduits linking depressive and anxiety clusters. Phase-specific shifts in edges and bridge roles suggest that the perinatal transition changes how symptoms couple more than the basic architecture of the network. Clinically, this supports phase-tailored, node-specific care that prioritizes emotion regulation and sleep restoration to dampen activation within and between communities; conceptually, it frames perinatal mental health as a dynamic, self-organizing system in which disrupting pivotal connections may yield outsized therapeutic gains.
Supplementary material
The supplementary material for this article can be found at http://doi.org/10.1192/j.eurpsy.2026.10181.
Data availability statement
Data are available from Laura Camoni (laura.camoni@iss.it) upon reasonable request.
Competing interests
The authors declare none.
AI use declaration
During the preparation of this work, the authors used ChatGPT 5.1 to edit the language (grammar, syntax, clarity, and readability) of the original draft. After using this tool, the authors reviewed and edited the content as needed and take full responsibility for the content of the publication.


 Open access
Comments
No Comments have been published for this article.